changing international landscape of global oil and...
TRANSCRIPT

Changing International Landscape
of Global Oil and Natural Gas
Impacts of U.S. Shale
2016 API International
Trade and Customs Conference
March 30, 2016
Geoffrey N. Brand
Senior Economic Advisor
American Petroleum Institute
1220 L Street, NW • Washington, DC 20005-4070 • www.api.org 1

“Changes call for innovation, and innovation
leads to progress” Li Keqiang – Premier of
China
“The times they are a changin’ ”
Bob Dylan – American Poet
“Ch-Ch-Changes – turn and face the strange”
David Bowie – International Poet
1220 L Street, NW • Washington, DC 20005-4070 • www.api.org 2

US Crude Oil Production
Average 2008 5.0 MMbbld
Average 2015 9.4 MMbbld
Peaked in 1970
+4.4 MMbbld 88%
Source: EIA
Growth in Texas
and
North Dakota

US Natural Gas Marketed Production
Decline – 2000 to 2005
Peak – early 70’s
+50 %
Shale Revolution Begins
2006 – (Barnett in Texas)

1220 L Street, NW • Washington, DC 20005-4070 • www.api.org 5
Source: EIA
Changing US Oil Landscape Reduced Our Net Imports

1220 L Street, NW • Washington, DC 20005-4070 • www.api.org 6
55 Proposed LNG
Terminals
(43 in the U.S.)
Changing US Natural Gas Landscape
US LNG Terminals

1220 L Street, NW • Washington, DC 20005-4070 • www.api.org 7
US Oil and Natural Gas
Short Term Outlook
Source: EIA Short Term Outlook – March 2016
Will US Production Increase?
Recent oil peak – Early 2015
-6%
-18%
+4%

1220 L Street, NW • Washington, DC 20005-4070 • www.api.org 8
Oil Rig Count vs Spot Price (WTI)
2014 to Today
Price -70%
Rigs -75%
Production -6%
(from 2015 peak)
Source: EIA, Baker Hughes

1220 L Street, NW • Washington, DC 20005-4070 • www.api.org 9
Gas Rig Count vs Spot Price (HH)
2008 to Today
Price -85%
Rigs -95%
Production +36%
Source: EIA, Baker Hughes

We went from “Hunting” Traps to
“Farming” Source Rocks
1220 L Street, NW • Washington, DC 20005-4070 • www.api.org 10
Cap Rock Nonporous
Nonpermeable
Reservoir Porous and Permeable
Source Rock Carbon Rich
Good Stuff = 150 – 350
Million years
old
Why is the Shale Revolution
So Different?

Example:
Why this is a game changer
In 1983 Harold Hamm drilled 17 dry holes in a row - almost
went bankrupt.
Continental Resources has drilled over 1,000 wells in the
Bakken since 2009.
All producers.
1220 L Street, NW • Washington, DC 20005-4070 • www.api.org 11

Efficiency is Key to Winning
the Shale Game Geology is similar
across wide areas.
vs. conventional
Core vs. noncore
Two main ways:
Increase production per
well (better Fracking)
Keep costs down.
(better drilling)
1220 L Street, NW • Washington, DC 20005-4070 • www.api.org 12
Source Rock
(Shale)
Aquifer
Hydraulic fracturing in not new – it has been done
for the last 60 years. We are just getting better at it
therefore it is becoming more common.

1220 L Street, NW • Washington, DC 20005-4070 • www.api.org 13
Source: EIA Drilling Productivity Report
ND Industrial Commission
Oil Rig Productivity
750
200
+275%
More Wells per Rig
2011 - 1,528 wells - 182 rigs - 8 w/r/yr
2015 - 1,363 wells - 91 rigs – 15 w/r/yr

1220 L Street, NW • Washington, DC 20005-4070 • www.api.org 14
Source: EIA Drilling Productivity Report
Pennsylvania DEP
10,500
2,000
+425%
Same Wells per Rig
2011 - 1,958 wells - 101 rigs - 19 w/r/yr
2015 - 758 wells - 40 rigs - 19 w/r/yr
Natural Gas Rig Productivity
Longer wells

1220 L Street, NW • Washington, DC 20005-4070 • www.api.org 15
Main short-term drivers of US oil
and natural gas production?
Oil – World oil price
Natural gas - Markets
The gas needs a place to go.

Source: EIA, Short-Term Energy Outlook, February 2016
WTI price
dollars per barrel
16
0
25
50
75
100
125
150
2007 2008 2009 2010 2011 2012 2013 2014 2015 2016 2017
Historical Spot Price
STEO Forecast
NYMEX Futures Price
Current 95% NYMEX futures price confidence interval
June 2014 95% NYMEX futures price confidence interval
Short Run Oil Price Projection
EIA and NYMEX

Forecast
-2
-1
0
1
2
3
4
5
6
7
8
9
76
78
80
82
84
86
88
90
92
94
96
98
2009 2010 2011 2012 2013 2014 2015 2016 2017
Change in U.S. consumption (right axis)
Change in China consumption (right axis)
Change in other consumption (right axis)
Total world consumption (left axis)
world liquid fuels consumption
million barrels per day
annual change
million barrels per day
Center for Strategic and International Studies | State of the oil markets February
17, 2016
Source: EIA, Short-Term Energy Outlook, February 2016
World Growth Petroleum Liquids Consumption
between 1 and 1.5 MMBbld / year

1220 L Street, NW • Washington, DC 20005-4070 • www.api.org 18
Average 2,650 Million Barrels
Global OECD Crude Oil Storage Inventories
End of 2017 - 3,300 Million Barrels
Projection +650 Million Barrels above
historical averages.
Does not include Non OECD Storage.
Source: EIA Short-term Energy Outlook

1220 L Street, NW • Washington, DC 20005-4070 • www.api.org 19
Long - Run Oil Price Projection
IEA, EIA
Energy Information Administration 2020 2040
Reference Case 2015 $77 $141
High Resource Case $74 $129
Low Oil Price $58 $76
International Energy Agency 2020 2040
New Policies $80 $128
Low Oil Price $50-$60 $85
Brent
Real $’s per Barrel
API does not forecast commodity prices.

1220 L Street, NW • Washington, DC 20005-4070 • www.api.org 20
Long - Run Natural Gas Price
Projection
Natural Gas is priced
regionally not globally
IHS estimates that the
US has 1,400 Tcf of
natural gas resource
that can be developed
at $4 /MMBtu or less
with current technology
High resource case
most likely scenario
Source: EIA Annual Energy Outlook 2015

1220 L Street, NW • Washington, DC 20005-4070 • www.api.org 21
Optimistic projection for US
crude oil production
Source: EIA Annual Energy Outlook 2015

1220 L Street, NW • Washington, DC 20005-4070 • www.api.org 22
Source: EIA Annual Energy Outlook 2015
Optimistic projection for US
natural gas production

23
0
20
40
60
80
100
120
1980 1985 1990 1995 2000 2005 2010 2015 2020 2025 2030 2035 2040
U.S
. p
rim
ary
en
erg
y c
on
su
mp
tion
qu
ad
rilli
on
Btu
Source: EIA, Annual Energy Outlook 2015 Reference case
History Projections 2013
36%
18%
27%
8%
8%
1%
33%
10%
18%
29%
8%
1% Nuclear
Petroleum and other liquids
Natural gas
Coal
Renewables (excluding liquid biofuels)
2025
35%
19%
27%
8%
9%
1% Liquid biofuels
2040
Annual Energy Outlook 2015, April 14,
2015
US will need Oil and Natural Gas
Over 60% of US Energy in 2040

International Energy Agency (IEA)
World Energy Outlook 2015
New Policies Scenario
• One of many reputable global energy forecasts.
• Exact numbers are not important – look for general
trends.
• Includes both energy policies that have been adapted
by 2015 and proposed policies not yet implemented.
• Includes pledges from countries leading up to the 2015
climate conference in Paris.
• Includes Clean Power Plan in the US
Adam Sieminski , WAMM, April 18, 2013 24

International Energy Agency (IEA)
World Energy Outlook 2015
New Policies Scenario (continued)
• Fossil fuel subsidies are phased out in all countries that have
promised to do so.
• Real price increases in residential and electricity for places such
Russia. Equalize domestic and export fossil fuel prices.
• Energy market reforms in China and other price controled
markets.
• Various country renewable energy targets.
• Various country energy efficiency programs – cars, buildings,
industrial ect.
Adam Sieminski , WAMM, April 18, 2013 25
26
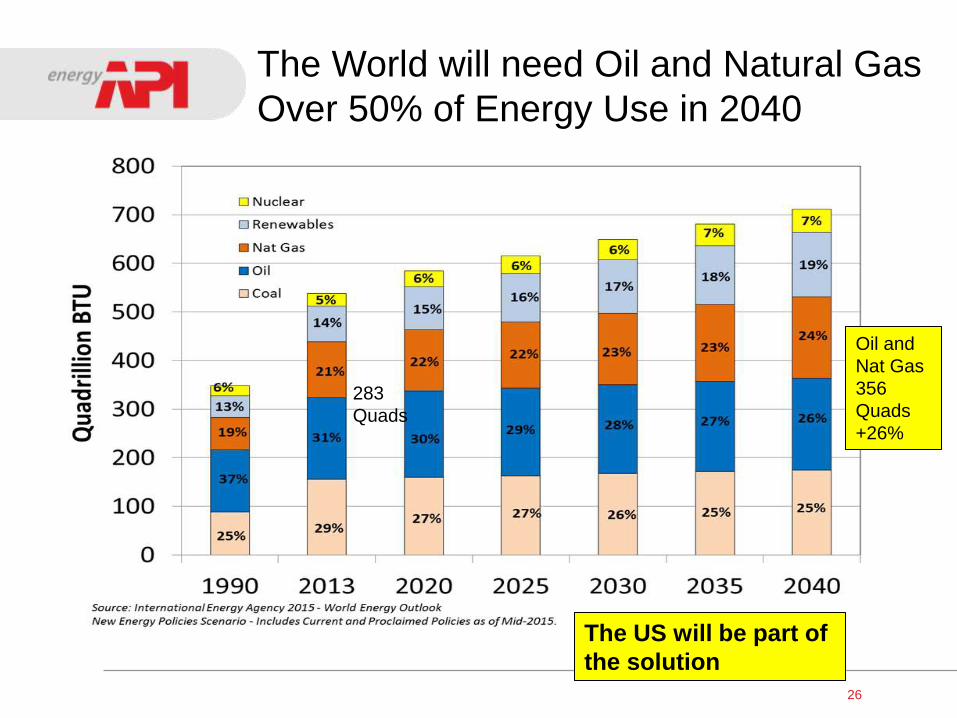
The World will need Oil and Natural Gas
Over 50% of Energy Use in 2040
The US will be part of
the solution
283
Quads
Oil and
Nat Gas
356
Quads
+26%

-30
-20
-10
0
10
20
30
40
50
60
70
2005 2010 2015 2020 2025 2030 2035 2040
27
ne
t cru
de
oil
an
d p
etr
ole
um
pro
du
ct im
po
rts
pe
rce
nta
ge o
f to
tal U
.S. su
pp
ly
Source: EIA, Annual Energy Outlook 2015
History Projections 2013
High Oil and Gas Resource
Reference
Annual Energy Outlook 2015, April 14, 2015
US will increasingly become a larger
trader in crude and refined products
US crude will trade
light sweet out with
heavy sour in –
even if US is a net
importer
Projected Net Imports
Crude and Refined
AEO 2015 assumed export ban still in place.
Potential crude oil trade by 2040
Net crude Imports 4 to 7.5 MMbbld
2.5 - 3 MMbbld export / 7-10 MMbbld import

28
US Refined Products Imports
and Exports
Source: EIA, Annual Energy Outlook 2015
Potential
Trade
8-14 MMbbld
Imports
Exports
Net Imports
High Resource
Net Imports
Exports
US became a net
exporter in 2011
Trade 1975
2 MMbbld
Trade 2015
6 MMbbld

bil
lio
n c
ub
ic f
ee
t p
er
da
y
29
Projections History
2013
Consumption
Production
Net Imports
Source: EIA Annual Energy Outlook 2015 – Reference Case
US becomes Net Exporter of Natural
Gas 2018 (LNG and Pipeline)
US will become a major LNG Exporter
with pipeline exports to Mexico
Net exports can reach 20% to 45% of
US natural gas consumption.

1220 L Street, NW • Washington, DC 20005-4070 • www.api.org 30
7 approved
by both DOI and FERC
12.8 Bcfd capacity
North American Approved LNG
Export Terminals

1220 L Street, NW • Washington, DC 20005-4070 • www.api.org 31
25 Additional Proposed
LNG Export Terminals
(22 in the U.S.)

Global Oil and Natural Gas
Forecast by Region
1220 L Street, NW • Washington, DC 20005-4070 • www.api.org 32

1220 L Street, NW • Washington, DC 20005-4070 • www.api.org 33
Global Regional Petroleum*
Consumption - MMbbld
Source: IEA World Energy Outlook 2015 – New Policies Scenario
* Includes crude oil and natural gas plant liquids
1990 2013 2020 2040
OECD Americas 19.8 22.5 22.7 18.2
Latin America 3.2 6.2 6.5 7.4
Europe 13.2 12.6 11.7 8.4
Eurasia 10.1 5.1 5.4 5.5
OECD Asia 7.2 7.9 7.0 5.2
Asia 6.9 21.6 26.6 37.8
Middle East 2.9 7.5 9.0 11.3
Africa 1.9 3.8 4.7 6.6
Total 65.2 87.2 93.6 100.4

1220 L Street, NW • Washington, DC 20005-4070 • www.api.org 34
Global Regional Petroleum
Production - MMbbld
Source: IEA World Energy Outlook 2015 – New Policies Scenario
1990 2013 2020 2040
OECD Americas 13.9 17.0 21.0 21.0
Latin America 4.5 7.5 8.3 10.8
Europe 4.3 3.3 3.2 2.2
Eurasia 11.4 14.0 13.5 12.2
OECD Asia 0.7 0.5 0.9 0.9
Asia 6.0 7.9 7.9 5.9
Middle East 17.7 28.0 30.9 38.5
Africa 6.7 9.0 7.9 8.9
Total 65.2 87.2 93.6 100.4

Net Regional Imports
Petroleum - MMbbld
1220 L Street, NW • Washington, DC 20005-4070 • www.api.org 35
Source: IEA World Energy Outlook 2015 – New Policies Scenario

Net Regional Exports
Petroleum - MMbbld
1220 L Street, NW • Washington, DC 20005-4070 • www.api.org 36
Source: IEA World Energy Outlook 2015 – New Policies Scenario

Global Petroleum Flow
Takeaways
1220 L Street, NW • Washington, DC 20005-4070 • www.api.org 37
• Non-OECD Asia is the only net regional growth import market
(India and China)
+5 MMbbld by 2020, +18 MMbbld by 2040
• The Western Hemisphere (North and South America) could
become a net petroleum exporter by 2020
• North America could become a net exporter of petroleum by
2040
• US – switches from customer only to
both a customer and supply competitor
• The Middle East will likely remain the major export region for
the next several decades – their customers may change.

1220 L Street, NW • Washington, DC 20005-4070 • www.api.org 38
Global Regional Natural Gas
Consumption – Bcf/d
Source: IEA World Energy Outlook 2015 – New Policies Scenario
1990 2013 2020 2040
OECD America 62 89 97 110
Latin America 6 16 17 28
Europe 31 49 48 51
Eurasia 73 67 65 74
OECD Asia 8 22 21 22
Asia 8 44 62 113
Middle East 9 41 48 72
Africa 3 12 14 28
Total 201 340 371 498

1220 L Street, NW • Washington, DC 20005-4070 • www.api.org 39
Global Regional Natural Gas
Production – Bcf/d
Source: IEA World Energy Outlook 2015 – New Policies Scenario
1990 2013 2020 2040
OECD America 62 86 101 118
Latin America 6 17 19 30
Europe 20 27 23 17
Eurasia 80 88 89 111
OECD Asia 3 7 14 17
Asia 13 42 49 76
Middle East 9 53 56 87
Africa 7 20 21 41
Total 201 340 371 498

Net Regional Imports
Natural Gas (Pipe & LNG) – Bcf/d
1220 L Street, NW • Washington, DC 20005-4070 • www.api.org 40
Source: IEA World Energy Outlook 2015 – New Policies Scenario

1220 L Street, NW • Washington, DC 20005-4070 • www.api.org 41
Source: IEA World Energy Outlook 2015 – New Policies Scenario
Net Regional Exports
Natural Gas (Pipe & LNG) – Bcf/d

Global Natural Gas Flow
Takeaways
1220 L Street, NW • Washington, DC 20005-4070 • www.api.org 42
• Non-OECD Asia (China and India) is the major growth
markets. Europe needs more natural gas through a
combination of increases in demand and reductions in
supply (North Sea). Asia in not the only game in town.
• Australia reduces net regional imports to OECD Asia –
significant regional supplier.
• Eurasia (Russia and other Caspian suppliers) pipeline
exports remain the major interregional natural gas
supplier through 2040.
• North America is a significant LNG supplier in the future.

National Security
General Martin Dempsey, Chairman of the Joint
Chiefs of Staff:
“An energy independent [U.S.] and net exporter of
energy as a nation has the potential to change the
security environment around the world – notably in
Europe and in the Middle East. And so, as we look
at our strategies for the future, I think we’ve got to
pay more and particular attention to energy as an
instrument of national power. And because it will
very soon in the next few years potentially become
one of our more prominent tools.”
1220 L Street, NW • Washington, DC 20005-4070 • www.api.org 43

Questions?
1220 L Street, NW • Washington, DC 20005-4070 • www.api.org 44

US Shale Development's and the
US Economy
1220 L Street, NW • Washington, DC 20005-4070 • www.api.org 45

1220 L Street, NW • Washington, DC 20005-4070 • www.api.org 46
• IHS - America’s New Energy Future: The Unconventional Oil and Gas Revolution and the US Economy; Volume 3: A Manufacturing Renaissance – September 2013 Key Findings:
– Total Supported Employment: • 2.1 million jobs supported in 2012 (500K direct) • 3.9 million jobs supported in 2025 (800K Direct)
• Including 515,000 manufacturing jobs • Jobs tend to high quality and high paying ($35/hr vs. $23/hr in general
economy) – Capital Expenditures:
• $121 billion in 2012, rising to $240 billion by 2025 • $2.75 trillion in capex cumulative between 2012 and 2025
– Gross Domestic Product Impact • $284 billion in value added contributions in 2012 (US GDP $16 Trillion)
• Increases to $533 billion / year in 2025
Shale Development’s Impact
on the US Economy

1220 L Street, NW • Washington, DC 20005-4070 • www.api.org 47
Shale Development’s Impact
Goes beyond Producing States

1220 L Street, NW • Washington, DC 20005-4070 • www.api.org 48
Shale Gas Development’s Benefits
to Consumers
Lower natural gas and electricity prices plus additional
household income:
In 2012: $1,200 per household ($163 billion US Total )
Rising to:
$3,500 per household in 2025.
Source: IHS - America’s New Energy Future: The Unconventional Oil and Gas Revolution and the US Economy; Volume 3: A Manufacturing Renaissance – September 2013

Shale Revolution Saves
Consumers $’s at the Pump
Impacts on crude oil and gasoline
Without US Shale from 2008 to 2013:
• Crude oil prices per barrel would have averaged $122 to $150 in 2013 – an
increase of $12 to $40.
• Gasoline and other refined products would have been $0.29 to $0.94 per
gallon higher.
U.S. consumers saved an estimated $63 to $248 billion in 2013. From 2008 to
2013, the cumulative savings for U.S. consumers ranged from $165 to $624
billion.
Source: U.S. Oil Impacts: The Impacts of Horizontal Multi-stage Hydraulic Fracturing Technologies on
Historical Oil Production, International Oil Costs, and Consumer Petroleum Product Costs
1220 L Street, NW • Washington, DC 20005-4070 • www.api.org 49
0.07 – 0.23 Euros per Liter

1220 L Street, NW • Washington, DC 20005-4070 • www.api.org 50
Eagle Ford – South Texas
Satellite Photo
of activity
225 Rigs
operating

51
Additional Questions?
Thank You..

52
Additional Slides

1220 L Street, NW •
Washington, DC 20005-
4070 • www.api.org
53

1220 L Street, NW •
Washington, DC 20005-
4070 • www.api.org
54
US Major Shale Crude Oil Plays

1220 L Street, NW •
Washington, DC 20005-
4070 • www.api.org
55
US Major Shale Natural Gas Plays

56

1220 L Street, NW • Washington, DC 20005-4070 • www.api.org 57
The US is #1 in natural gas production and total liquids
production (just behind Saudi Arabia in crude production)

58
Improved
Technology
Provides
Economic
Results

1220 L Street, NW • Washington, DC 20005-4070 • www.api.org 59
Below Ground….

60
Hydraulic fracturing
fluid is 99.5% water
and sand.
Fracturing Fluid Components

1220 L Street, NW • Washington, DC 20005-4070 • www.api.org 61
Timeline of a Well
HYDRAULIC
FRACTURING
3 – 5 DAYS
PLANNING
12 – 18 months
EXPLORATION
3-5 years
SITE & WELL
CONSTRUCTION
2-3 months
PRODUCTION
30 + Years

What is the surface impact after hydraulic fracturing?
Before After
Reclaimed Marcellus Horizontal Well Site

Federal Regulations
Clean Water Act
Clean Air Act
Safe Drinking Water Act
National Environmental Policy Act
Resource Conservation and Recovery Act
Emergency Planning and Community Right to
Know Act
Endangered Species Act
Occupational Safety and Health Act
Key federal regulations governing shale
development include:
63

0.3 0.40.8
1.2
6 6
0
1
2
3
4
5
6
7
Natural Gas Coal Biomass Nuclear Wind Solar
Natural gas has the smallest footprint of any energy source
Acre
s
Source: R.W. Beck and Black and Veatch for NGSA
Acres of land needed to produce the fuel and generate
enough electricity to serve 1,000 households for one year
Natural gas generates more electricity
from less land than other power sources.

Adam Sieminski , WAMM, April 18, 2013 65
Crude oils are NOT the same.
Crude varies in weight and sulfur content.
Each refinery