changing gender relations, declining fertility? an
TRANSCRIPT

DEMOGRAPHIC RESEARCH
VOLUME 41, ARTICLE 30, PAGES 873-912PUBLISHED 8 OCTOBER 2019http://www.demographic-research.org/Volumes/Vol41/30/DOI: 10.4054/DemRes.2019.41.30
Research Article
Changing gender relations, declining fertility?An analysis of childbearing trajectories in 19th-century Netherlands
Hilde Bras
Reto Schumacher
This publication is part of the Special Collection on “The Power of theFamily,” organized by Guest Editors Hilde Bras and Rebecca Sear.
© 2019 Hilde Bras & Reto Schumacher.
This open-access work is published under the terms of the Creative CommonsAttribution 3.0 Germany (CC BY 3.0 DE), which permits use, reproduction,and distribution in any medium, provided the original author(s) and sourceare given credit.See https://creativecommons.org/licenses/by/3.0/de/legalcode.

Contents
1 Introduction 874
2 Background 8762.1 Gender relations in explanations of a fertility decline 8762.2 Gender relations and social networks 8772.3 Spousal age differences 878
3 Setting 878
4 Hypotheses 881
5 Data, measures, and methods 8835.1 Data 8835.2 Measures 8835.2.1 Dependent variable: Childbearing trajectories 8835.2.2 Independent variables 8855.3 Methods 888
6 Results 8886.1 Descriptive statistics 8886.1.1 Spousal age differences 8886.1.2 Childbearing trajectories 8896.2 Determinants of childbearing trajectories 893
7 Conclusion and discussion 898
8 Acknowledgments 901
References 902

Demographic Research: Volume 41, Article 30Research Article
http://www.demographic-research.org 873
Changing gender relations, declining fertility? An analysis ofchildbearing trajectories in 19th-century Netherlands
Hilde Bras1
Reto Schumacher2
Abstract
BACKGROUNDA long-standing and still unresolved debate has developed on whether the historicalfertility transition was caused by ‘spacing’ (increasing the time between births) or bystopping (terminating childbearing at younger ages). Moreover, there is little consensusabout the relative importance of gender relations in effecting reproductive change.OBJECTIVEFirst, we wish to shed new light on the stopping versus spacing debate by applying asequence analysis approach, allowing us to describe changes in complete childbearingtrajectories. Second, we want to understand the association between gender relations,among other factors, and reproductive trajectories during the historical fertility decline.
METHODSWe use longitudinal data from GENLIAS, a dataset constructed from linked civilregisters of the province of Zeeland, the Netherlands, covering the period 1811‒1911.We employ cluster and sequence analysis to identify different types of childbearingtrajectories and logistic regression to estimate their correlates.RESULTSWe identified five often-experienced trajectories: two high-fertility traditionaltrajectories (differing in the length of the reproductive phase), a ‘Stoppers’ trajectory, a‘Late Starters’ trajectory, and an ‘Almost Childless’ trajectory. Our results show thatstopping was the way through which couples controlled their fertility during the earlyphase of the historical fertility transition in Zeeland, the Netherlands. Although coupleswith more egalitarian relationships had a higher likelihood to follow a Stopperstrajectory rather than the highest-fertility trajectory, stopping was most clearly linked tobirth cohort and social class.
1 University of Groningen, the Netherlands. Email: [email protected] Statistique Vaud (Service Cantonal de Recherche et d’Informations Statistiques [SCRIS]), Switzerland.

Bras & Schumacher: An analysis of childbearing trajectories in 19th-century Netherlands
874 http://www.demographic-research.org
CONTRIBUTIONOur paper extends the literature on the process of the historical fertility decline and itsdeterminants via a detailed empirical examination of childbearing trajectories and theconditions under which these trajectories took place. With our sequence analysisapproach we add both substantively and methodologically to long-standing debates.
1. Introduction
During the 19th century and first decades of the 20th century, most European societieswent through the fertility transition, the shift from high to low fertility. Amonghistorical demographers, a long-standing and still unresolved debate has developedabout whether this fertility decline was caused by ‘spacing’ (increasing the timebetween births) or by ‘stopping’ (terminating childbearing at younger ages). Althoughby now an impressive body of theoretical and empirical knowledge about theseprocesses has accumulated, very little is known about the trends and determinants ofcomplete reproductive pathways during the historical fertility decline. Most studieshave focused on changes in the timing of single markers of reproduction, such asstarting, spacing, or stopping, or of completed fertility (Anderton and Bean 1985;Knodel 1987; Knodel and Van de Walle 1979; Szreter and Garrett 2000; Van Bavel2004; Van Bavel and Kok 2005, but cf. Darak et al. 2015; Schumacher, Matthijs, andMoreels 2013). Yet, societal changes affect reproductive careers as a whole, not just theseparate transitions of which they are part. The notion of trajectories or ‘socialpathways’ (Bras, Liefbroer, and Elzinga 2010; Elder, Johnson, and Crosnoe 2003;Macmillan 2005) captures this idea of life-course dynamics taking place over extendedperiods of (life) time. Moreover, the endogenous causality (Mayer 1987) or biographicopportunity costs (Birg, Flöthmann, and Reiter 1991; Schumacher, Matthijs, andMoreels 2013) of life courses is better examined by investigating holistic trajectoriesthan through the study of separate transitions. Thus, a first question of our study iswhether new light can be shed on an old debate by applying a sequence analysisapproach to describe changes in complete reproductive trajectories in a Europeansociety undergoing fertility decline.
Second, we want to understand the differences in childbearing trajectories acrossindividuals and over time. More specifically, we want to understand what thedeterminants of reproductive trajectories were that had a shorter reproductive phase andresulted in families smaller than was common before the transition. With thereproductive phase we denote the specific subsequence of the reproductive life coursebetween the age at first birth and the age at last birth (stopping). Recent research has

Demographic Research: Volume 41, Article 30
http://www.demographic-research.org 875
confirmed the relevance of blended models for understanding fertility behaviour,positing structural factors, such as social class and urbanisation, alongside factorsemphasising the role of social relations and social interactions (Bras 2014; Casterline2001; Van Bavel 2004). In terms of the latter, the idea that gender relations should be inthe centre of the academic debate on the historical fertility decline has been frequentlyemphasised. It has been suggested that as a result of industrialisation and thedevelopment of capitalism, patriarchal inequalities decreased, enhancing women’sbargaining power. This would have enabled them to implement their desires for smallerfamilies (Folbre 1983; Gittins 1982; Janssens 2007a; MacKinnon 1995; Seccombe1993; Watkins 1993). Dovetailing closely with the previous explanation, otherresearchers have understood changes in gender relations from the perspective of acultural shift towards romantic love and egalitarian partnerships. Spouses in egalitarianunions would have been better able to communicate about fertility, which allowed themto reach their preferred family size more easily than couples with more inegalitarianrelationships (Coontz 2005; Matthijs 2002; Shorter 1975; Van De Putte et al. 2009).Yet, there is little consensus about the relative importance of changing gender relationsin effecting reproductive change. One of the reasons is that empirical evidence hasremained relatively scant. Although a number of inspiring studies based onautobiographies, oral testimonies, and letters have produced important new insights(Fisher 2000, 2006; Fisher and Szreter 2003, 2010; Hilveych 2016; Humphries 2007;Pooley 2013; Seccombe 1990), few studies have systematically integrated genderrelations in explanatory models of reproductive behaviour.
In this article, we examine the childbearing trajectories of more than 15,000women aged 15 to 45 years from the province of Zeeland, the Netherlands. Ouranalytical sample of full reproductive pathways is derived from a large-scalelongitudinal database consisting of linked civil registers covering the long 19th century(1811‒1911). We use spousal age differences as a proxy of gender relations. There is awidespread consensus that the size of the spousal age gap indicates differences in powerand equality in the relationship between husbands and wives (Mitterauer and Sieder1983; Atkinson and Glass 1985; Wheeler and Gunter 1987; Cain 1993; Van de Putte etal. 2009). Using sequence and cluster analysis, we identify five reproductive trajectoriesfrom our data. Exploiting multivariate logistic regression, we estimate the mostimportant determinants of each of these trajectories. The remainder of this article isstructured as follows. In the next section, we elaborate the different explanationsconnecting changing gender relations and fertility decline. Next, we sketch the settingof our study and formulate specific hypotheses. After describing our data, measures,and methods, we show trends in spousal age differences and fertility trajectories acrossbirth cohorts and discuss the results of our multivariate binomial and multinomiallogistic regressions charting the associations between gender relations, as well as other

Bras & Schumacher: An analysis of childbearing trajectories in 19th-century Netherlands
876 http://www.demographic-research.org
factors, and women’s reproductive trajectories. In the conclusion and discussion, wesummarise our results and reflect on their implications for the debate on stopping versusspacing during the historical fertility decline and the significance of gender relations asa determinant. We conclude by indicating the limitations of the study and offeringsuggestions for further research using our sequence analysis approach.
2. Background
2.1 Gender relations in explanations of a fertility decline
Demographic research on fertility transitions has traditionally been dominated bysupply-demand (Easterlin 1978; Easterlin and Crimmins 1985) and innovation-diffusion explanations (e.g., Bongaarts and Watkins 1996; Casterline 2001; Cleland2001). Both perspectives see the couple as the major decision-making unit and assumethat couple relations were neutral and unanimous. Whether and how conflict, power,and inequality in household relations influenced reproductive decision-making is oftennot problematised (Janssens 2007b; MacKinnon 1995; Seccombe 1990; Watkins 1993).A growing number of researchers, however, have started to incorporate gender relationsin their studies of fertility and parenthood (Abadian 1996; Folbre 1983, 1994;Greenhalgh 1995; Hilevych 2015, 2016; Hollerbach 1980; Pooley 2013; Praz 2007,2009; Rusterholz 2015). By gender relations we understand the specific subset of socialrelations uniting women and men as social groups in a particular community, includinghow power and access to resources are distributed between the sexes. Gender relationsintersect with all other influences on social relations (age, ethnicity, race, religion,etc.) to determine the position and identity of people in a social group. Since genderrelations are a social construct, they can change or be transformed over time.
A number of important explanations have been advanced that connect changes ingender relations with fertility decline. A first body of research has argued that shifts inthe distribution of interests, resources, and power in the relationship between husbandsand wives played an important role (Gittins 1982; MacKinnon, Batson, and Petersen-Gray 2007; McLaren 1992; Praz 2007; Rusterholz 2015; Seccombe 1992). For instance,according to Nancy Folbre (1983), the rise of capitalism altered the political economyof fertility decisions. As a result of the growth of market production and wage labour,and the growing opportunities for female work, men’s control over women decreased.This influenced the relative power positions of wives versus husbands, giving womenmore leeway in fertility decision-making and implementing their desires for smallerfamilies.

Demographic Research: Volume 41, Article 30
http://www.demographic-research.org 877
Another body of research holds that the fertility decline was the result of a culturalshift towards more egalitarian spousal relations, emphasising romantic love and theheightened emotional quality of marital relations (Bras 2014; Coontz 2005; Gillis 1996;Mitterauer and Sieder 1983; Matthijs 2002; Shorter 1975; Van de Putte et al. 2009; VanPoppel et al. 2001). As of the second half of the 19th century, a new marriage patternwould have developed, characterised by less celibacy, earlier and more universalmarriage, and smaller spousal age gaps than had been common before (Matthijs 2002;Van de Putte et al. 2009). Marriages were less often contracted for instrumental reasonsand became increasingly based on love, equality, and spousal companionship. This newmarriage pattern was accompanied by a rise in emotionalism, sentimentalism, and moreegalitarian marriage relations. It has been suggested that partners in these egalitarianunions were better able to communicate and reach consensus about fertility, andachieve their preferred family size, than couples with less egalitarian relations (Coontz2005; Matthijs 2002; Shorter 1975; Van De Putte et al. 2009).
2.2 Gender relations and social networks
Apart from the nature of the marital relationship, gender relations in couples’ socialnetworks may have been important too. For example, the gender relations and norms ofthe couples’ parents or siblings can exert, via processes of social learning, socialpressure, and support or competition, pro- or anti-natal influences on couples’reproductive decisions (Bernardi 2003; Bernardi and Klärner 2014; Bernardi and White2010; Lyngstad and Prskawetz 2010; Murphy and Knudsen 2008; Sear and Coall 2011).Women’s reproductive trajectories may also have been influenced by the gender normsof the local community. Localities or ‘communication communities’ may sharecommon conceptions of parental duties, as well as (perceived) norms of familyformation and family size (Szreter 1996:533; see also: Duncan and Smith 2002;Jappens and Van Bavel 2012; Mason 2001; Massey 1984; Pfau-Effinger 2000).Previous studies in contemporary developing countries have shown the significance ofsuch community-level gender effects on women’s fertility behaviour (Balk 1994; Bates,Maselko, and Schuler 2007; Benefo 1995; DeRose and Ezeh 2010; Malhotra,Vanneman, and Kishor 1995; Pallitto and O’Campo 2005). Some of these studies haveeven found larger effects of community-level than of household-level gender relations.

Bras & Schumacher: An analysis of childbearing trajectories in 19th-century Netherlands
878 http://www.demographic-research.org
2.3 Spousal age differences
In this study we use the spousal age gap as an indicator of couples’ gender relations.The age difference expresses the extent of power and equality in spousal relations. Alarge age gap, particularly between older husbands and younger wives, is usuallyunderstood as an indication of patriarchal gender relations, meaning that women haveless power in the relationship (Atkinson and Glass 1985; Cain 1993; Carmichael 2011;Carmichael, de Moor, and Van Zanden 2011; Mitterauer and Sieder 1983; Skinner1993; Therborn 2004; Wheeler and Gunter 1987). Unequal power may affect thequality of marital relations by impeding conjugal intimacy (Barbierbi and Hertrich2005), the standard of marital sexuality (Mitterauer and Sieder 1983), and women’sbargaining position to realise her desired family size. The age difference also indicateswhether the life courses of spouses were synchronous, that is, whether they weregenerational peers and could easily communicate about future life goals, such ascontraception and the number of children, or were less able to do so (Barbieri andHertrich 2005; Safilios-Rothschild 1972).
The spousal age gap is a widely available and convenient measure. It can bederived from marriage certificates, which are accessible for large parts of the populationin most Western countries since the early 19th century. Yet, the age gap also has anumber of limitations. First, age differences between spouses may result fromdemographic constraints and marriage market conditions. Age differences have alsobeen found to differ by gender and fluctuate over time, partly because of changes in theage at marriage. There is often a positive association between the spousal age differenceand the age of the groom (Ní Bhrolcháin 1992, 2005). Thus, when marriage agedecreases over time, particularly of males, this automatically leads to smaller age gaps.Secondly, the spousal age gap may influence fertility not only via the nature of thegender relationship in terms of power or equality but also via the age at marriage andthe accompanying fecundity of the spouses (Bongaarts and Potter 1983). Additionally,nonphysiological factors related to marriage age, such as marital satisfaction andsexuality, may also influence fertility (Casterline, Williams, and McDonald 1986; Fenget al. 2010). Hence, to be able to interpret the measure correctly, both the age-sexstructure of the marriage market and the ages at marriage of both the bride and thegroom need to be carefully controlled for.
3. Setting
Our study is situated in the province of Zeeland, which is located in the utmost south-western corner of the Netherlands. The region consists of peninsulas, islands, and a

Demographic Research: Volume 41, Article 30
http://www.demographic-research.org 879
mainland area that borders Belgium to the south. During the 16th and 17th centuries,Zeeland played an important role as a region of industry and trade and boastedinfluential trading towns such as Middelburg, Zierikzee, and Veere. After 1585, whenthe Spaniards conquered Antwerp, the significance of Zeeland’s trade and industrydeclined and a process of ruralisation took place, which made the region increasinglydependent on its agricultural sector (Priester 1998). During the 19th century, Zeeland’seconomy was mainly based on market-oriented, capital-intensive farming specialisingin the production of cash crops, such as wheat, flax, madder, and sugar beets (Priester1998). The social structure of the countryside was highly polarised. A large gap existedbetween the wealthy gentlemen farmers, who imitated the lifestyle of the urban middleclasses, and the mass of proletarianised agricultural labourers. In our sample, some 55%of all grooms were farmworkers, while 10% were farmers (see Table 1). During the 19th
century, the occupational structure hardly changed. Social class barriers were rigid andonly little social mobility took place (Kok 1998). Only as of 1900 did occupationalheterogamy start to rise (Bras and Kok 2005).
The cash crops cultivated in Zeeland were labour intensive and stimulated thedemand for cheap female labour. Both married and unmarried women were employedin agriculture. According to the occupational census of 1849, 16% of the femalepopulation was employed as a field labourer. Female fieldworkers were estimated tocomprise half of all gainfully employed agricultural labourers (Jansen 1989:17).Women’s tasks did not differ much from those of men. Female workers for instancetied the grain, a job that in other parts of Europe was considered male work. In general,however, typical female agricultural activities, such as weeding, planting, cutting grain,lifting potatoes, and harvesting peas and beans, involved a lower level of productivityand technology. Thus, both the societal recognition of women’s work and female wageswere lower than those of men. Despite of this, the remunerative contribution brought inby women and children was absolutely necessary to sustain the family income. Thehusband provided about two-thirds of the costs of maintenance, while the wife andcoworking children contributed one-third. Because children were essential contributorsto the family budget, most women bore and raised many children (Jansen 1989).
The agricultural depression of the last two decades of the 19th century led to aprocess of mechanisation and rationalisation of Zeeland’s agriculture. Men’s wagesrose, which increasingly made for a male breadwinner family wage. At the same time,the ideals of domesticity and women’s roles of wives and mothers were intensivelypromoted. During the early 20th century, the number of women and children active infieldwork strongly decreased, as the occupational census of 1909 showed (Jansen1989). Moreover, as of the last decades of the 19th century, school attendance becamecompulsory and was monitored more strictly, making it more difficult to let children do

Bras & Schumacher: An analysis of childbearing trajectories in 19th-century Netherlands
880 http://www.demographic-research.org
fieldwork. Therefore, around the turn of the century the costs and benefits of childrenhad changed drastically (De Regt 2004).
Although the agricultural sector made up the largest part of Zeeland’s economy,part of our study population lived in urban areas. The Zeeland towns fulfilled a regionalfunction in trade, industry, and administration. Industrialisation took off after about1850 when shipbuilding, beer brewing, shoemaking, textiles, concrete production, andwood sawing started to grow. These industries were located in the two largest cities,Middelburg and Vlissingen (known historically in English as Flushing), and in severalsmaller communities (Franken and Adriaanse 2004; Zijdeman 2010).
The Zeeland population was a mixture of Catholics, liberal, and orthodoxProtestants, differing considerably in religious rigidity. The Catholic Church wasopposed to birth control and exerted a strong pronatalist pressure on married couples(Engelen and Kok 2003; Van Bavel and Kok 2005; Van Heek 1956; Van Poppel 1992).In predominantly Catholic communities, the power position of parents and the localclergy were strong, making it almost impossible for couples not to compel to the idealof large families. Orthodox Protestants adhered to roughly the same firm morality andchildbearing norms as Catholics, staying virulently opposed to birth control withinmarriage until at least the 1920s (Van Heek 1956; Van Poppel 1985).
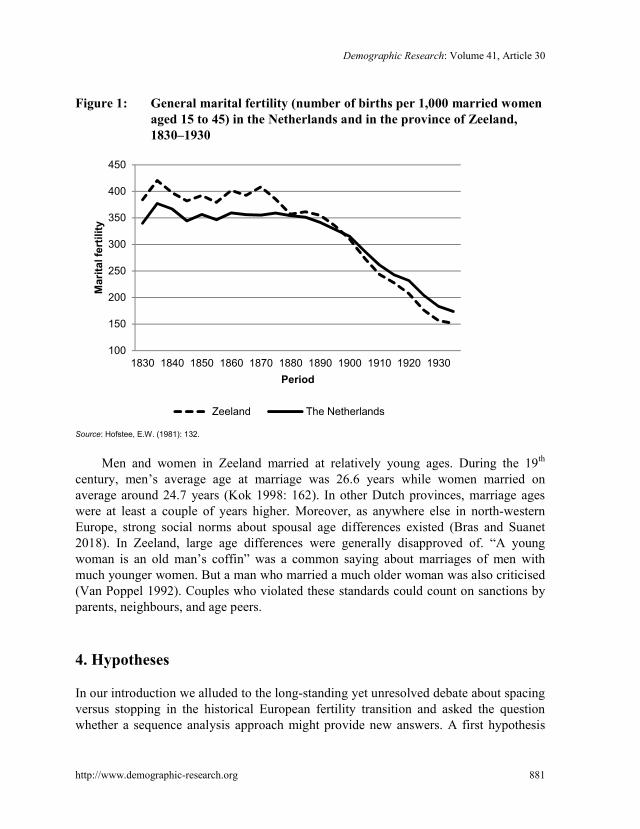
The Netherlands had a relatively late fertility transition in comparison to otherEuropean countries, starting only after 1880, but with strong regional differences.Zeeland followed a more or less average path to low fertility. Until about 1880, fertilitylevels were higher than the Dutch average. The eventual fertility decline, which startedaround 1870, was much steeper with fertility levels dropping considerably below theDutch average after about 1900 (see Figure 1).
Gender relations in Zeeland could be characterised as patriarchal, just as elsewherein 19th-century Europe (Therborn 2004). Dutch marriage law stipulated that thehusband, as head of the household, had absolute control over his family, while the wifehad to be compliant. Women could not carry out business transactions withoutpermission of their husbands, while as late as 1900, marriage was still thought to beincompatible with the equality between men and women (Sevenhuisen 1987: 235). Theideal of domesticity, with women’s typical roles of mother and housewife, was verymuch alive in Dutch society. However, in household matters, Dutch women hadrelatively much power vis-à-vis their husbands. This was reinforced by Dutch law,which specified women’s ‘key power’ in domestic matters (Kloek 2009: 141).
Demographic Research: Volume 41, Article 30
http://www.demographic-research.org 881
Figure 1: General marital fertility (number of births per 1,000 married womenaged 15 to 45) in the Netherlands and in the province of Zeeland,1830‒1930
Source: Hofstee, E.W. (1981): 132.
Men and women in Zeeland married at relatively young ages. During the 19th
century, men’s average age at marriage was 26.6 years while women married onaverage around 24.7 years (Kok 1998: 162). In other Dutch provinces, marriage ageswere at least a couple of years higher. Moreover, as anywhere else in north-westernEurope, strong social norms about spousal age differences existed (Bras and Suanet2018). In Zeeland, large age differences were generally disapproved of. “A youngwoman is an old man’s coffin” was a common saying about marriages of men withmuch younger women. But a man who married a much older woman was also criticised(Van Poppel 1992). Couples who violated these standards could count on sanctions byparents, neighbours, and age peers.
4. Hypotheses
In our introduction we alluded to the long-standing yet unresolved debate about spacingversus stopping in the historical European fertility transition and asked the questionwhether a sequence analysis approach might provide new answers. A first hypothesis
100
150
200
250
300
350
400
450
1830 1840 1850 1860 1870 1880 1890 1900 1910 1920 1930
Mar
ital f
ertil
ity
Period
Zeeland The Netherlands

Bras & Schumacher: An analysis of childbearing trajectories in 19th-century Netherlands
882 http://www.demographic-research.org
thus pertains to the shape of women’s childbearing trajectories over time. So far, theempirical evidence for stopping over spacing has been stronger (Knodel 1987; Timæusand Moultrie 2008). However, disagreement on how to correctly measure birth spacinghas brought the debate to a dead-end. We thus start from the following hypothesis:
Hypothesis 1a: Across cohorts, we expect to observe an increasing share offertility trajectories that were characterised by a shorter reproductive phase and asmaller number of children.
Hypothesis 1b: Alternatively, we expect that the childbearing trajectories ofconsecutive cohorts were marked by increasing intentional spacing during thereproductive phase, resulting in a smaller number of children.
Our second question pertained to the determinants of different types ofchildbearing trajectories and specifically the role of gender relations. In section 2 wepresented two closely related branches of literature on the relationship betweenchanging gender relations and declining fertility. One perspective emphasised that thefertility decline was a result of the rise of capitalism, growing opportunities forremunerative women’s work, and increased female bargaining power, while anotherstrand of literature held that the fertility decline was a consequence of a cultural shiftfrom instrumentality towards romantic love and more egalitarian partnerships. Giventhe fact that Zeeland agriculture, the province’s main economic sector, was alreadyhighly capitalised in the early 19th century – including full, and remunerative, labourparticipation of women – we expect that the rise of romantic love and egalitarianpartner relations in particular must have been related to the fertility transition inZeeland. We also argued that the gender relations in couples’ social networks should betaken into account. Hence, we formulate the following hypothesis:
Hypothesis 2a: It is expected that Zeeland couples with more egalitarian genderrelations (marriages between spouses of equal age versus ones where the wife orhusband is older), or whose parents, siblings, or community members had moreegalitarian gender relations, experienced a childbearing trajectory characterised bya shorter reproductive phase and a smaller number of children.
Hypothesis 2b: Alternatively, we expect that there is no association betweengender relations and a fertility trajectory characterised by a shorter reproductivephase and a smaller number of children.
Demographic Research: Volume 41, Article 30
http://www.demographic-research.org 883
5. Data, measures, and methods
5.1 Data
Our study is based on a large historical database, named GENLIAS, which contains allavailable birth, marriage, and death certificates from the province of Zeeland for theperiod 1811‒1911. Our point of departure is a data file that includes coded informationfrom all birth certificates for the period 1811‒1866 that could be linked with themarriage certificates of the parents of the newborn child (N = 209,300, among which40,939 girls and 36,595 boys who got married in the province of Zeeland). Therestriction that the youngest cohort should be born no later than 1866 was based on thefact that we need to reconstruct the reproductive histories of these people, while we donot have access to documents more recent than 1911 (= 1866 + 45) for legal reasonsimplied by Dutch privacy laws. The precondition that a match could be made with themarriage of the parents was necessary to enable the inclusion of parental characteristics,specifically parental gender relations. Since we need information about the fullreproductive lifespan, and since we only collected such information within the provinceof Zeeland, we dropped all individuals for which we could not find a death certificatebecause absence of a death certificate (in the province of Zeeland) is a strong indicationof outmigration. Among the 40,939 women with observed marriage certificates, 15,014remained married until age 45 (bride’s and groom’s death occurred after the bride’s 45th
birthday, and no second marriage was observed for the bride until that date). Hence, alimitation of our sample is that it is quite selected. We will come back to this in thediscussion section. The GENLIAS database (release Siblings.01) provides the exactdates of the births of the first six children, the total number of children ever born, andthe exact date of the birth of the last child. Our sample of 15,014 full birth historiescomprises a total of 87,204 observed births, which is on average 5.8 children ever bornper woman (see Table 2).
5.2 Measures
5.2.1 Dependent variable: Childbearing trajectories
Our dependent variable reflects different types of childbearing trajectories, or birthhistories, the construction and analysis of which was carried out in the context of statesequence analysis (Ritschard et al. 2008). In order to simultaneously study starting,stopping, and spacing in the reproductive life course, we represent women’schildbearing trajectories as sequences of 31 yearly states from ages 15 to 45. We

Bras & Schumacher: An analysis of childbearing trajectories in 19th-century Netherlands
884 http://www.demographic-research.org
distinguish three categories of states, each corresponding to the main subsequences ofthe reproductive life course. The first state represents the starting component and spansfrom age 15 to the age at first birth. The second state stands for the reproductivesubsequence, which starts at the age at first birth and ends at the age at last birth. It isdivided into substates representing the number of children ever born. The last state isequal to the stopping phase in a fertility trajectory and corresponds to the period ofcompleted family size between the age at last birth and the onset of sterility. Using theTraMineR package available in R (Gabadinho et al. 2011), we assess the share ofbehavioural fertility subtypes in each cohort by first computing pair-wise optimalmatching distances between all trajectories of a given generation. Based on thesedissimilarity matrices we then perform a cluster analysis (using the PAM algorithm;Kaufman and Rousseeuw 1990) to identify specific reproductive subtypes.
Figure 2 demonstrates how childbearing trajectories have been coded into statesequences by showing four individual birth histories. Birth history 1 refers to a womanwho had her first child at the age of 33 and her second child at the age of 35. Sheremained therefore in the state ‘1 child ever born’ for two years. Further childrenfollowed at the ages of 36, 38, 39, and 41. Her ninth and last child was born when shewas 47 years old, which means that in her case, the final state of ‘no more childrenborn’ is not observed before age 45. Birth history 2 refers to a woman who had a firstchild at the age of 37 and a second and last child at the age of 40. She entered the laststate of completed family size the following year of age. In birth history 3, thechildbearing phase starts much earlier, at the age of 25 and lasts until the age of 43,when the eighth and last child was born. Birth history 4 refers to a woman who startedearly with a first child at age 24 and who also stopped early by having her third and lastchild when she was 28 years old.
Figure 2: Four examples of childbearing trajectories
birth history 1
birth history 2
birth history 3
birth history 4
age 15 16 17 18 19 20 21 22 23 24 25 26 27 28 29 30 31 32 33 34 35 36 37 38 39 40 41 42 43 44 45
no children 4 children ever born
1 child ever born 5 children ever born
2 children ever born 6 and more children ever born
3 children ever born no more children born

Demographic Research: Volume 41, Article 30
http://www.demographic-research.org 885
5.2.2 Independent variables
Spousal age difference. We base our measure of gender relations on spousal agedifferences, one of the few indicators of gender relations, which are generallyquantifiable and comparable across time, space, and social group. Following previousresearch we constructed nominal categories to distinguish between the different types ofage gaps: spouses of more or less equal age (allowing 2 years older or younger), grooms3 to 6 years older, grooms 7 or more years older, brides 3 to 6 years older, and brides 7or more years older. These categories were constructed for the couple, the bride’sparents, the bride’s siblings, and the bride’s community of origin. Social connectionswere traced along only the bride’s line because brides were central in the constructionof the birth histories. Moreover, information on grooms’ family members andcommunities of origin were missing for 3,000 cases because these family memberswere already dead and/or these grooms came from municipalities outside of Zeeland.As can be seen in Table 1, the data shows clear generational differences, with siblingshaving a similar distribution of spousal-age-difference categories as the couple, while inthe parental generation a higher prevalence of marriages with older husbands werefound.
Groom’s and bride’s ages. Because the size of the spousal age gap may be relatedto age at marriage, we controlled for the groom’s and bride’s marriage age, includingfour categories: groom/bride <24 years old, groom/bride 24 to 26 years old,groom/bride 27 to 29 years old, groom/bride 30 years or older.
Birth cohort. Dummies for six (in general one decade long) birth cohorts wereincluded, with the cohort 1820‒1829, for example referring to individuals born between1820 and 1829, the latter year included. Clearly, the oldest birth cohort contains thesmallest number of cases.
Urbanisation. Furthermore, birth places were classified as urban or rural on thebasis of the historical designation of the municipality as a town. As can be seen inTable 1, the sample consists for 88% of couples living in the countryside. Among theurban places were fairly large cities such as Middelburg and Vlissingen and somewhatsmaller towns that primarily fulfilled a regional function in terms of trade, industry, andadministration, like Goes, or that had been given legal rights as a town, like Veere.
Social class. Social class was indicated by the occupation of the groom taken fromthe marriage certificate. All occupations were grouped according to the historical socialclass categorisation HISCO (Historical International Standard Classification ofOccupations) (Van Leeuwen, Maas, and Miles 2002). HISCO is synchronised with theInternational Standard Classification of Occupations (ISCO68). The occupationalcategories were then grouped into HISCLASS, a historical social class schemeproposed by Van Leeuwen and Maas (2011). We employ the following categories inour analyses: (1) higher and middle class, (2) skilled workers, (3) farmers and

Bras & Schumacher: An analysis of childbearing trajectories in 19th-century Netherlands
886 http://www.demographic-research.org
fishermen, (4) unskilled workers, and (5) farmworkers. In Zeeland, more than half of allindividuals belonged to the farmworkers class, 20% were skilled workers, and 10%were farmers.
Table 1: Summary statistics of the data and variables usedNumber of childbearing trajectories 15,014Number of families (parental marriages) 11,439Birth cohort
1811–1819 535 (4%)1820–1829 1,708 (11%)1830–1839 2,814 (19%)1840–1849 3,281 (22%)1850–1859 3,630 (24%)1860–1866 3,046 (20%)
UrbanisationRural 13,157 (88%)Urban 1,857 (12%)
Social classHigher and middle class 1,264 (8%)Skilled workers 3,059 (20%)Farmers 1,494 (10%)Unskilled workers 834 (6%)Farmworkers 8,205 (55%)No class, unknown 158 (1%)
Spousal age difference coupleGroom ≥ 7 years older 16.06%Groom 3–6 years older 27.21%Spouses equal age (–2–2 years) 43.77%Bride 3–6 years older 10.44%Bride ≥7 years older 2.52%
Groom’s ageGroom <24 years old 22.64%Groom 24–26 years old 27.39%Groom 27–29 years old 24.46%Groom 30+ years old 25.51%
Bride’s ageBride <24 years old 38.20%Bride 24–26 years old 25.98%Bride 27–29 years old 15.69%Bride 30+ years old 20.12%
Spousal age difference bride’s parentsBride’s father ≥ 7 years older 20.51%Bride’s father 3–6 years older 28.57%Bride’s parents equal age 38.04%Bride’s mother 3–6 years older 9.16%Bride’s mother ≥7 years older 3.72%
Demographic Research: Volume 41, Article 30
http://www.demographic-research.org 887
Table 1: (Continued)Spousal age difference bride’s siblings
Share of siblings groom ≥ 7 years older 16.68%Share of siblings groom 3–6 years older 27.55%Share of siblings equal age spouses 43.34%Share of siblings bride 3–6 years older 9.71%Share of siblings bride ≥7 years older 2.71%
Spousal age difference bride’s birth communityCommunity share groom ≥ 7 years older 12.87%Community share groom 3–6 years older 28.73%Community share spouses equal age 46.78%Community share bride 3–6 years older 9.50%Community share bride ≥7 years older 2.11%
Religious climate birthplace<10% orthodox Protestants and Catholics 2,881 (19%)10%–60% orthodox Protestants and Catholics 10,527 (70%)>60% orthodox Protestants and Catholics 1,606 (11%)
Province-level sex ratio at marriageSex ratio 20–24 0.980Sex ratio 25–29 0.958Sex ratio 30–34 0.975Sex ratio 35–39 0.966
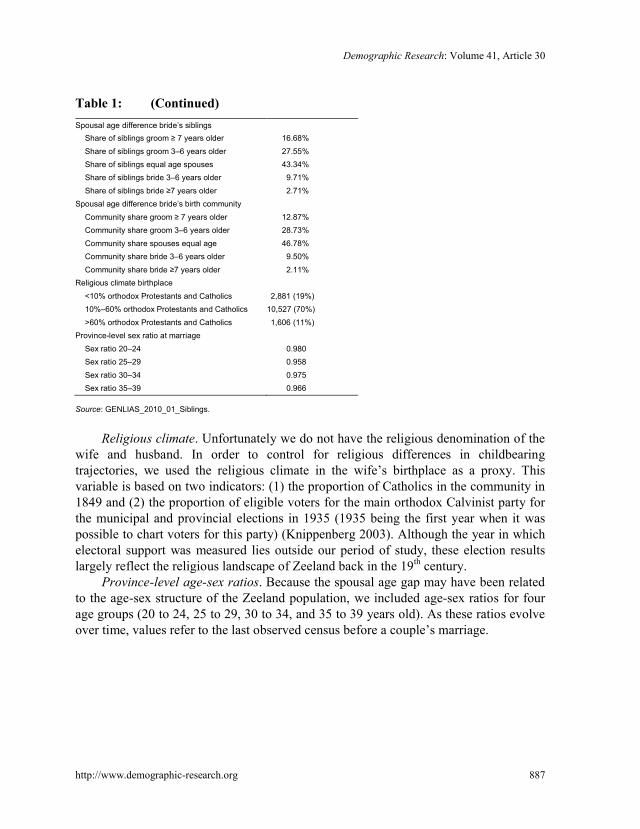
Source: GENLIAS_2010_01_Siblings.
Religious climate. Unfortunately we do not have the religious denomination of thewife and husband. In order to control for religious differences in childbearingtrajectories, we used the religious climate in the wife’s birthplace as a proxy. Thisvariable is based on two indicators: (1) the proportion of Catholics in the community in1849 and (2) the proportion of eligible voters for the main orthodox Calvinist party forthe municipal and provincial elections in 1935 (1935 being the first year when it waspossible to chart voters for this party) (Knippenberg 2003). Although the year in whichelectoral support was measured lies outside our period of study, these election resultslargely reflect the religious landscape of Zeeland back in the 19th century.
Province-level age-sex ratios. Because the spousal age gap may have been relatedto the age-sex structure of the Zeeland population, we included age-sex ratios for fourage groups (20 to 24, 25 to 29, 30 to 34, and 35 to 39 years old). As these ratios evolveover time, values refer to the last observed census before a couple’s marriage.

Bras & Schumacher: An analysis of childbearing trajectories in 19th-century Netherlands
888 http://www.demographic-research.org
5.3 Methods
In order to assess the impact of these factors on childbearing trajectories, we estimatedmultivariate binomial and multinomial logistic regressions predicting (sequence) clustermembership as a function of the independent variables. Although implying a certainloss of information, cluster analysis has often been used to split state sequences intomeaningful categories that can then be used as dependent variables in regression models(Barbiano di Belgiojose and Terzera 2018; Fulda 2016; Madero-Cabib 2015).Specifically, we estimated a binomial logistic regression, modelling the probability thata woman’s reproductive trajectory belongs to the stopping trajectory in comparison toall other trajectories. Moreover, using multinomial logistic regressions we estimated theodds of belonging to the Stoppers trajectory versus each of the other pathwaysseparately. In order to account for the multilevel structure of our sample (individualsnested in families and in communities), we computed robust standard errors for two-dimensionally clustered observations using proc surveylogistic in SAS.
6. Results
6.1 Descriptive statistics
6.1.1 Spousal age differences
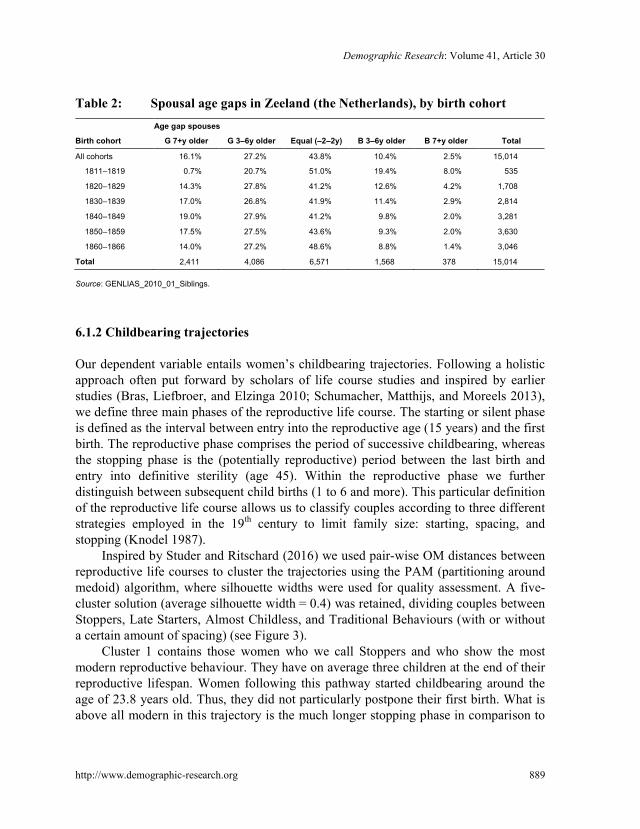
One of the goals of our study is to understand the association of spousal age differencesand reproductive careers. But to what extent did Zeeland brides and grooms differ inage and how did spousal age gaps change during the 19th century? Table 2 shows thatalmost 44% of all couples were of approximately the same age (allowing 2 yearsyounger or older). In 27% of all unions, husbands were 3 to 6 years older than theirwives, while in 16% of all marriages husbands were more than 7 years older than theirwives. Only 10% of the sample consisted of couples of which the wife was 3 to 6 yearsolder, while in 3% of all unions the bride was 7 or more years older than her husband.This indicates that despite social norms of marital age homogamy, there was quite somevariation in the age differences between the spouses (see also Bras and Suanet 2018).
Table 2 further shows that the distribution of different categories of spousal agegaps remained relatively stable across the consecutive birth cohorts. Only in the last twocohorts (1850‒1859 and 1860‒1869) do we observe a modest increase in the proportionof age-homogamous couples. Most striking is the decline in marriages in which thewife is older across cohorts.
Demographic Research: Volume 41, Article 30
http://www.demographic-research.org 889
Table 2: Spousal age gaps in Zeeland (the Netherlands), by birth cohortAge gap spouses
Birth cohort G 7+y older G 3–6y older Equal (–2–2y) B 3–6y older B 7+y older Total
All cohorts 16.1% 27.2% 43.8% 10.4% 2.5% 15,014
1811–1819 0.7% 20.7% 51.0% 19.4% 8.0% 535
1820–1829 14.3% 27.8% 41.2% 12.6% 4.2% 1,708
1830–1839 17.0% 26.8% 41.9% 11.4% 2.9% 2,814
1840–1849 19.0% 27.9% 41.2% 9.8% 2.0% 3,281
1850–1859 17.5% 27.5% 43.6% 9.3% 2.0% 3,630
1860–1866 14.0% 27.2% 48.6% 8.8% 1.4% 3,046
Total 2,411 4,086 6,571 1,568 378 15,014
Source: GENLIAS_2010_01_Siblings.
6.1.2 Childbearing trajectories
Our dependent variable entails women’s childbearing trajectories. Following a holisticapproach often put forward by scholars of life course studies and inspired by earlierstudies (Bras, Liefbroer, and Elzinga 2010; Schumacher, Matthijs, and Moreels 2013),we define three main phases of the reproductive life course. The starting or silent phaseis defined as the interval between entry into the reproductive age (15 years) and the firstbirth. The reproductive phase comprises the period of successive childbearing, whereasthe stopping phase is the (potentially reproductive) period between the last birth andentry into definitive sterility (age 45). Within the reproductive phase we furtherdistinguish between subsequent child births (1 to 6 and more). This particular definitionof the reproductive life course allows us to classify couples according to three differentstrategies employed in the 19th century to limit family size: starting, spacing, andstopping (Knodel 1987).
Inspired by Studer and Ritschard (2016) we used pair-wise OM distances betweenreproductive life courses to cluster the trajectories using the PAM (partitioning aroundmedoid) algorithm, where silhouette widths were used for quality assessment. A five-cluster solution (average silhouette width = 0.4) was retained, dividing couples betweenStoppers, Late Starters, Almost Childless, and Traditional Behaviours (with or withouta certain amount of spacing) (see Figure 3).
Cluster 1 contains those women who we call Stoppers and who show the mostmodern reproductive behaviour. They have on average three children at the end of theirreproductive lifespan. Women following this pathway started childbearing around theage of 23.8 years old. Thus, they did not particularly postpone their first birth. What isabove all modern in this trajectory is the much longer stopping phase in comparison to

Bras & Schumacher: An analysis of childbearing trajectories in 19th-century Netherlands
890 http://www.demographic-research.org
more traditional trajectories. As we have described elsewhere, a trajectory with earlychildbearing and family formation became the new standard trajectory to adulthoodbetween the late 19th century and the first half of the 20th century (Bras, Liefbroer, andElzinga 2010).
In contrast, all other trajectories have a much longer reproductive phase. TheTraditional 1 trajectory has a very short starting phase – women in this cluster marry onaverage when they are 21.5 years old. Most striking is the extremely long reproductivephase and the very short stopping phase. Hence, it is not surprising that the completedfertility of these women is very high (i.e., 10.5 children on average). The Traditional 2pathway differs from the Traditional 1 trajectory in that women start childbearing morethan three years later (average age at marriage is 24.9), space their births more, and stopreproducing earlier (have a longer stopping phase). However, Traditional 2 can still beconsidered a traditional pre-transition trajectory as completed fertility with on average7.2 births per woman is still very high. This trajectory makes up the biggest share ofwomen.
The next cluster is that of Late Starters, women who married and startedchildbearing at a very late age (on average around 30.8 years old) and who have, as aconsequence, on average (only) 3.8 children. Late starting can be seen as a sign ofeither traditional or modern behaviour. When interpreted from the perspective of theWest-European marriage pattern, late starting may result from the inability to set up ahousehold according to one’s own standing and lifestyle. However, it may also expressa conscious strategy to reduce family size (Knodel 1988). A fifth cluster, which wenamed Almost Childless, contains women who remained childless or who had only oneor two births at a very late age.
Figure 3: Types of childbearing trajectories (transversal state distribution percluster)
Stoppers : 2,561 couples Traditional 1 : 3,582 couples

Demographic Research: Volume 41, Article 30
http://www.demographic-research.org 891
Figure 3: (Continued)
Traditional 2 : 4,502 couples Late starters : 2,372 couples
Almost childless : 1997 couples
How did the different phases (i.e., starting, reproductive, and stopping) changeacross the fertility transition? To what extent were smaller families a result of shifts inthe length of the different phases? As we can observe from Figure 4, the reproductivephase of women born between 1811 and 1866 hardly changed in length. We dohowever see an increase in the duration of the stopping phase (i.e., the potentiallyreproductive period between the last birth and entry into definitive sterility, which isage 45) for younger cohorts of women. However, at the same time, the length of thestarting or silent phase, the period between the age of entry into reproduction (age 15),and a woman’s first birth all decreased.

Bras & Schumacher: An analysis of childbearing trajectories in 19th-century Netherlands
892 http://www.demographic-research.org
Figure 4: Length (in months) of different phases in childbearing trajectories,by birth cohort (N = 15,014)
To what extent did the prevalence of the trajectory characterised by early stoppingincrease over the successive cohorts? Figure 5 depicts for each birth cohort thepercentage of women who experienced the different trajectories. The figure indeedshows that the Stoppers trajectory became more important over time. Whereas only12% of all women in the oldest cohort experienced this pathway, a quarter of all womenin the youngest cohort stopped early. However, at the same time, the high-fertilitytrajectory Traditional 1 did not decline significantly. On the contrary, we initiallyobserve a relative increase among women in the later cohorts who followed thistrajectory. It’s only in the last observed cohort (1860‒1866) that we see a start ofdecline. The proportion of women experiencing a Traditional 2 trajectory also increasedacross birth cohorts, but the 1830‒1839 cohort started to decrease. Hence, for both theTraditional 1 and 2 trajectories we discern a so-called ski-jump pattern of increasingfertility preceding fertility decline (Dyson and Murphy 1985; Van de Walle 1974).Figure 5 also shows that the Late Starters pathway decreased as the fertility transitionprogressed; 20.7% of all women belonging to the oldest birth cohort experienced thistrajectory compared to 13.2% of the youngest cohort. Late starting was thus mostly atraditional way of fertility reduction. The same can be said for the Almost Childlesspathway, which slightly decreased across cohorts as well, constituting 17.2% of allwomen in the oldest cohort and 12.6% in the youngest cohort. Given this decrease,
0
2
4
6
8
10
12
14
16
18
1811-1819 1820-1829 1830-1839 1840-1849 1850-1859 1860-1866
starting phase stopping phase reproductive phase

Demographic Research: Volume 41, Article 30
http://www.demographic-research.org 893
having no or only a few children most likely did not result from active fertilitylimitation but may have been a result of women’s or men’s reduced fecundity.
Figure 5: Percentage of women experiencing different reproductivetrajectories, by birth cohort (N = 15,014).
6.2 Determinants of childbearing trajectories
To examine whether couples with small age differences, signifying more equal genderrelations, more often followed a ‘modern’ stopping trajectory, or whether othercharacteristics played a more important role, we conducted two types of multivariateanalyses. First, we performed a binomial logistic regression to provide a broadoverview of which characteristics distinguished those who followed the Stopperstrajectory from all others. Next, we conducted a multinomial logistic regression tounderstand what attributes differentiated Stoppers from couples following each of theother trajectories. Results of both analyses are presented in Table 3.
The results of the binomial logistic regression confirm the findings in Figure 5 thatacross cohorts, there is an increase in the likelihood of couples to follow a Stopperstrajectory. The multinomial regression shows that the rise of the Stoppers trajectoryoccurred most clearly at the expense of the Traditional 1 pathway. However, the rise ofstopping also occurred at the expense of other reproductive pathways. Women bornbetween 1830 and 1839 had decreased odds of following the Stoppers trajectory in

Bras & Schumacher: An analysis of childbearing trajectories in 19th-century Netherlands
894 http://www.demographic-research.org
comparison to the Traditional 2 pathway, a finding which confirms the ski-jump patternof the Traditional 2 trajectory found in Figure 5. Furthermore, the odds of following aStoppers trajectory compared with following the Late Starters trajectory were stronglyenhanced for the youngest birth cohort but not for the other cohorts. The odds ofpracticing stopping in comparison with experiencing an Almost Childless pathway weresignificantly lower for the three eldest cohorts (1811‒1819, 1820‒1829, and 1830‒1839) in comparison with the other cohorts.
The results show that couples who followed a Stoppers trajectory distinguishedthemselves from those experiencing other trajectories in that they were more often fromthe higher and middle class, skilled workers class, and farmers class. Stopping was areproductive pathway that was surprisingly often experienced by farmers. As indicatedbefore, in Zeeland this social group (10% of the population) consisted mainly ofwealthy gentleman farmers who imitated the lifestyle of the urban middle classes. Themultinomial analyses show that the higher and middle classes, skilled workers, andfarmers were particularly more prone to follow a Stoppers trajectory rather than theTraditional 1 trajectory. Skilled workers and farmers also had a relatively strongpreference for stopping over a Traditional 2 pathway. Farmers had an elevated risk ofstopping rather than late starting as well. Finally, the higher and middle classes haddecreased odds of stopping in comparison to following an Almost Childlesschildbearing trajectory.
Our central hypothesis predicted that couples with more egalitarian genderrelations (equal-age couples) more often practiced stopping than those in marriageswith a husband or wife who was older. The results of our logistic regressions onlypartly confirm this hypothesis. The binomial regression shows that, in comparison to allothers, stoppers did not distinguish themselves specifically from all others by smallerspousal age differences. The multinomial regression does however show that coupleswith older husbands were less likely to experience a Stoppers rather than a Traditional 1trajectory. But they more often followed a Stoppers rather than a Traditional 2, LateStarters, or Almost Childless pathway. The results also show that couples with olderwives had decreased odds of practicing stopping in comparison to late starting orremaining almost childless. But women who were the older one in their unions hadhigher odds of practicing stopping rather than following a Traditional 1 trajectory.
The results of the binomial regression show that younger brides (<24 years) andolder brides (>27 years) had smaller odds of practicing stopping in comparison to allother trajectories. The multinomial analyses show that younger brides had particularlylower risks of stopping in comparison to a Traditional 1 trajectory. In contrast, they hadhigher odds of experiencing stopping in comparison to Traditional 2 and Late Startertrajectories, confirming our results in Figure 3. Older brides had lower odds toexperience stopping in comparison to Late Starters or Almost Childless pathways but

Demographic Research: Volume 41, Article 30
http://www.demographic-research.org 895
higher odds of practicing stopping rather than following the two traditional pathways.The binomial regression shows that, in comparison to all others, Stoppers did notdistinguish themselves by the grooms’ age. According to the multinomial findings,however, men who married young had a reduced risk of practicing stopping incomparison to following a Traditional 1 pathway and an increased risk of stoppingrather than remaining almost childless. Men who married at older ages (27 to 29 yearsand 30 or more years) had elevated odds of practicing stopping rather than experiencinga Traditional 1 trajectory and decreased odds of stopping in comparison to those whostarted late and remained almost childless.
Following theories on social influences on fertility behaviour, we predicted that thesmaller the spousal age differences of parents, siblings, and community members, thehigher the likelihood that couples’ childbearing trajectories would be characterised bysmaller family size. Overall, we find a number of significant associations that arelargely in line with the results for spousal age differences. The binomial regressionshows that couples of whom the brides’ parents were in marriages in which the husbandwas older (father was 7 or more years older) had smaller odds of practicing stopping incomparison to all other trajectories. The multinomial regression shows that this ismainly the result of a reduced risk of stopping at the expense of a Traditional 1trajectory. Brides with same-aged parents or parents in marriages in which the wife wasolder (mother was 7 or more years older) had a lower likelihood of stopping rather thanlate starting.
Sibling effects are less prevalent. The binomial regression shows that the higherthe share of siblings in unions where the bride is 3 to 6 years older, the greater couples’odds are of stopping rather than experiencing all other trajectories. The multinomialregression shows that this is due to a heightened likelihood of stopping versus followinga Traditional 2 trajectory. Conversely, with a higher percentage of siblings in marriageswith older brides, couples had a lower risk of stopping rather than remaining childless.
The results for community-level spousal age gaps replicate some of the parentaland sibling effects. Brides from communities with higher percentages of unions witholder husbands (grooms were 7 or more years older) had decreased odds of stopping,while brides from localities with a higher share of marriages with older wives (wiveswere 3 to 6 years older) had an increased likelihood of stopping versus all othertrajectories. The multinomial results show that the decreased odds of stopping of bridesfrom localities where the husbands were older occurred mainly at the expense of theTraditional 1 and Traditional 2 reproductive pathways. The increased likelihood ofstopping of brides from communities where wives tended to be older happened at theexpense of the Traditional 1, Traditional 2, and Almost Childless trajectories.
Finally, the results for urbanisation, religious composition, and age-specificprovincial sex ratios at marriage are worth noticing. There are no significant differences

Bras & Schumacher: An analysis of childbearing trajectories in 19th-century Netherlands
896 http://www.demographic-research.org
between brides born in urban compared to rural areas in opting for specific reproductivecareers, most likely because social class already captures the largest part of the urban-rural differential in fertility. Those living in very religious communities with more than60% orthodox Protestants had decreased odds of stopping rather than following one ofthe other trajectories. The results of the multinomial regression point out that this heldtrue also for stopping versus each of the pathways separately. Those living incommunities with 10% to 60% orthodox Protestants had decreased the odds offollowing a Stoppers rather than a Traditional 1 trajectory as well. Provincial sex ratiosat marriage were not significantly related with the odds of a Stoppers trajectory ratherthan all other pathways. However, the findings of the multinomial regression show thatthe higher the sex ratio in the age group 30 to 34 years old, the lower was the chance ofwomen experiencing a Stoppers versus a Late Starters trajectory. High sex ratios in theage category 20 to 24 years were associated with elevated odds of stopping rather thanremaining almost childless.
Table 3: Results of binomial and multinomial logistic regression analyses ofthe determinants of childbearing trajectories: Odds ratios(N = 15,014)
Variable Stoppers vs.all others
Stoppers vs.Traditional 1
Stoppers vs.Traditional 2
Stoppers vs.Late Starters
Stoppers vs.AlmostChildless
Birth cohort1811–1819 0.70* 0.46*** 0.72 0.89 0.47**1820–1829 0.70* 0.62** 0.74 0.72 0.38***1830–1839 0.77* 0.72* 0.71** 0.76 0.68*1840–1849 0.96 0.91 0.94 0.78* 0.961850–1859 (ref.) 1 1 1 1 11860–1866 1.27** 1.27* 1.17 1.38*** 1.23
Social classHigher/middle class 1.19* 1.41** 1.19 1.12 0.73*Skilled workers 1.17* 1.30*** 1.14* 1.10 0.85Farmers 1.61*** 1.92*** 1.58*** 1.42** 1.06Unskilled workers 0.92 0.97 0.87 0.81 0.91Farmworkers 1 1 1 1 1No class/unknown 1.50 1.57 1.68 3.32** 0.89
Spousal age differencesGroom 7+ years older 1.23 0.46*** 1.49** 4.84*** 4.26***Groom 3–6 years older 1.01 0.68*** 1.21* 2.59*** 2.47***Spouses equal age 1 1 1 1 1Bride 3–6 years older 1.16 1.49* 0.95 0.43*** 0.56***Bride 7+ years older 0.53 >1000*** 0.59 0.10*** 0.09***

Demographic Research: Volume 41, Article 30
http://www.demographic-research.org 897
Table 3: (Continued)
Variable Stoppers vs.all others
Stoppers vs.Traditional 1
Stoppers vs.Traditional 2
Stoppers vs.Late Starters
Stoppers vs.AlmostChildless
Bride’s age<24 years 0.88* 0.33*** 1.77*** 13*** n 1.1524–26 years 1 1 1 1 127–29 years 0.72*** 197*** 0.91 0.49*** 1.0030+ years 0.11*** 12* 4.12*** 0.03*** 0.04***
Groom’s age<24 years 0.94 0.64*** 1.15 2.45 1.95***24–26 years 1 1 1 1 127–29 years 1.06 1.80*** 0.95 0.38*** 0.46***30+ years 0.86 2.62*** 0.81 0.15*** 0.10***
Age difference bride’s parentsFather 7+ years older 0.64* 0.62* 0.69 0.63 0.71Father 3–6 years older 1 1 1 1 1Parents equal age 0.88 0.90 0.94 0.74* 0.78Mother 3–6 years older 0.95 0.92 1.02 0.88 0.83Mother 7+ years older 0.90 0.99 0.93 0.69** 0.76
Age difference bride’s siblings% sibs groom 7+ years older 1.00 1.00 1.00 1.00 1.00% sibs groom 3–6 years old 1 1 1 1 1% sibs equal age 1.00 1.00 1.00 1.00 1.00% sibs bride 3–6 years old 1.00* 1.00 1.00* 1.00 0.99*% sibs bride 7+ years older 1.00 1.00 1.00 1.00 1.00
Age differences bride’s community% community groom 7+ years older 0.98* 0.98* 0.97** 0.99 1.01% community groom 3–6 years older 1 1 1 1 1% community spouses equal age 1.01 1.01 1.00 1.01 1.03*% community bride 3–6 years older 1.05*** 1.07*** 1.04** 1.03 1.04*% community bride 7+ years older 1.02 1.05 1.02 1.06 0.99
Urban 0.98 1.13 0.95 0.81 0.79Religion
<10% orthodox 1 1 1 1 110%–60% orthodox 0.93 0.86* 0.94 1.04 1.03>60% orthodox 0.60*** 0.61** 0.57*** 0.52*** 0.67*
Sex ratios at marriageSex ratio 20–24 1.01 0.97 0.99 1.02 1.19***Sex ratio 25–29 1.00 1.02 1.02 1.01 0.97Sex ratio 30–34 0.98 0.98 0.98 0.94** 0.97Sex ratio 35–39 1.00 0.97 0.98 1.06 1.01
Constant 0.60 371* 11.2 0.08 0.00***McFadden’s pseudo R2 0.07 0.28
Source: GENLIAS_2010_01_Siblings.Note: *p<0.05; **p<0.01; ***p<0.001.

Bras & Schumacher: An analysis of childbearing trajectories in 19th-century Netherlands
898 http://www.demographic-research.org
7. Conclusion and discussion
Two central questions guided this study. First of all, we asked ourselves to what extentnew light could be shed on the long-standing and unresolved debate on stopping versusspacing by applying a sequence analysis approach to chart changes in childbearingtrajectories in a European society undergoing fertility decline. The second question waswhether there was an association between changing gender relations and decliningfertility during the historical fertility transition. On the basis of our analyses of theGENLIAS data, we can now answer these questions.
First, we expected the reproductive phase of childbearing trajectories to becomeshorter over time and result in fewer children. This hypothesis was supported by ourdata. On the basis of the cluster analysis we identified five types of often-experiencedtrajectories: two high-fertility traditional trajectories (differing in the length of thereproductive phase), a Stoppers trajectory, a Late Starters trajectory, and an AlmostChildless trajectory. Our data shows that over consecutive cohorts the prevalence ofwomen experiencing a trajectory of early stopping and completed fertility of around 3children increased. However, besides the rise of parity-dependent family limitation, theTraditional 1 trajectory characterised by early starting and late stopping with on averagemore than 10 children per woman and the Traditional 2 trajectory characterised bywomen relatively postponing the first birth and spacing more between births, but stillbearing on average more than 7 children, remained highly prevalent trajectories amongall cohorts of women (1811‒1866) studied in this article. Conversely, Late Starters andAlmost Childless trajectories were on the decline; they were associated with thetraditional West-European marriage pattern. In summary, we find that while stoppingincreased over time, the incidence of high fertility reproductive pathways remainedlargely the same for the cohorts studied here.
Second, we expected that women in more egalitarian marriages (those betweenspouses of almost equal age versus ones with a husband or wife who is older), or whoseparents, siblings, or community members were in such marriages, more often followeda Stoppers trajectory. The results of our binomial and multinomial regressions, in whichwe carefully controlled for the changing structure of the marriage market and themarriage ages of brides and grooms, only partly supported our hypothesis. We foundthat women in more egalitarian relationships (where partners were the same age) hadindeed a higher likelihood of following a Stoppers trajectory rather than a high fertilityTraditional 1 trajectory. But in comparison to other trajectories, stoppers were notparticularly characterised by more equal spousal relations. For instance, in comparisonto the Traditional 2 trajectory, women practicing stopping were more often married toolder husbands. We found that gender relations at the family level (bride’s parents andsiblings) and the community level (bride’s community of origin) supported some of the

Demographic Research: Volume 41, Article 30
http://www.demographic-research.org 899
results found at the couple level. Nevertheless, gender relations at the couple level weremost strongly related to women’s childbearing trajectories.
The likelihood of practicing parity-dependent family limitation turned out to bemost clearly linked to birth cohort and social class. Stopping was a trajectory thatgradually gained significance among cohorts of women born as of 1850. In particular,women from the group of rich gentlemen farmers, the higher and middle classes, andthe skilled workers, the latter two groups being predominantly located in the towns,were the forerunners of stopping in Zeeland. Instead of following their traditionallyclass-based trajectories of late childbearing or remaining (almost) childless, these socialgroups now increasingly turned to a new reproductive pathway: that of marrying early(indeed, much earlier than was common before), starting childbearing early, and alsostopping early, thus limiting their families to around three children. During our studyperiod, the two traditionally high-fertility reproductive pathways were followed mainlyby the mass of farmworkers (55% of the sample) and the unskilled workers (6%). Ourresults regarding class differences in stopping trajectories confirm and supplement theresults of an earlier study on the standardisation of trajectories to adulthood amongcohorts born between 1850 and 1900 in the Netherlands. There we also found thatfarmers’ daughters were the forerunners of a standard trajectory to adulthood marked byearly family formation (Bras, Liefbroer, and Elzinga 2010). Our results confirm thisfinding and extend it further into the reproductive life course: these women did not onlymarry early but also stopped childbearing early.
In a previous work on the emergence of the new marriage pattern, marked bydeclining celibacy, earlier marriage, and smaller spousal age gaps, Van De Putte et al.(2009) found that it were especially the lower classes who first adopted the pattern ofage homogamy, not the farmers. Moreover, the authors hypothesise that the shift inspousal age differences may have had important consequences for the 19th centuryfertility decline. Our study partly confirms and adds to their results. The Zeelandfarmers and higher and middle classes were indeed not particularly the forerunners inthe trend towards egalitarian marriages, as indicated by their spousal age differences,although they were not complete laggards either. However, in contrast to the predictionof Van de Putte et al. (2009), our study shows, for Zeeland at least, that the trends ofincreasing age homogamy and increasing family limitation (stopping) cannot beregarded as completely parallel processes. While the higher and middle classes, the richfarmers, and the skilled workers were forerunners in the fertility transition, the lowerclasses (particularly those following the Traditional 2 trajectory) were the precursors ofa marriage revolution in terms of having smaller spousal age differences. Future studiescovering a longer time period than ours will have to show how and when theseprocesses converged.

Bras & Schumacher: An analysis of childbearing trajectories in 19th-century Netherlands
900 http://www.demographic-research.org
Our study has a number of limitations. A first constraint is our indicator of genderrelations (i.e., the age difference between the spouses). Spousal age differences may notonly reflect gender relations but may also result from demographic constraints andmarriage market conditions. Although we controlled for the age-sex structure ofZeeland province and for the marriage ages of the bride and groom in our multivariateanalyses, specific age-sex structures in particular communities may still explain part ofour results. Moreover, the spousal age gap measures only initial gender relations (at themoment of marriage). Although this is meaningful by itself ‒ research in contemporarydeveloping countries has found independent and significant effects of women’s initialempowerment conditions on their ensuing reproductive trajectories (Lee-Rife 2010) – amore dynamic proxy, charting gender relations over the life course, would have beenbetter. And last but not least, age differences are likely not the only, or the best,indicator of romantic or intimate spousal relations.
Second, since we study only the reproductive trajectories of women who wereborn and died in Zeeland, and whose husbands, parents, and siblings remained theirwhole lives in Zeeland, too, our analytical sample is quite selected and biased towards asedentary, mostly rural-based population. Most likely, a part of the more moderncouples, displaying egalitarian gender relations and stopping behaviour, may havemigrated to urban areas elsewhere. Had we followed Zeeland-born couples also outsidethe province in the urbanised provinces of South-Holland and North-Holland, we mayhave found more conclusive support for the association between egalitarian spousalrelations and reproductive trajectories characterised by stopping. Third, with the dataavailable to us (covering the period 1811‒1911) we could study only a relatively shortperiod (about 30 years) since the onset of the fertility transition in Zeeland. In order toassess more fully whether changes in spousal relations were associated with earlierstopping, our window of observation should be extended further into the 20th century.
To our knowledge, our study is one of the first to exploit sequence analysis tounderstand processes and pathways of fertility decline. There is great potential forfuture studies to use our methodology to understand the fertility transition in otherEuropean regions but also in other time periods and other parts of the world. Acomparative approach to reproductive trajectories in historical Europe, 20th-centuryAsia, and contemporary sub-Saharan Africa where the fertility transition is stillunderway, thereby integrating the surprisingly separate literatures on gender andfertility in historical and contemporary demography, will likely generate new synergiesand innovative findings.

Demographic Research: Volume 41, Article 30
http://www.demographic-research.org 901
8. Acknowledgments
The study was supported by a VIDI Innovational Research Grant from the NetherlandsOrganization for Scientific Research (NWO) granted to dr. H.A.J. Bras for the researchproject entitled ‘The Power of the Family: Family Influences on Long-Term FertilityDecline in Europe, 1850-2010’ (contract grant number 452-10-013).

Bras & Schumacher: An analysis of childbearing trajectories in 19th-century Netherlands
902 http://www.demographic-research.org
References
Abadian, S. (1996). Women’s autonomy and its impact on fertility. World Development24(12): 1793–1809. doi:10.1016/S0305-750X(96)00075-7.
Anderton, D.L. and Bean, L.L. (1985). Birth spacing and fertility limitation: Abehavioral analysis of a nineteenth century frontier population. Demography22(2): 169–183. doi:10.2307/2061176.
Atkinson, M.P. and Glass, B.L. (1985). Marital age heterogamy and homogamy, 1900to 1980. Journal of Marriage and the Family 47(3): 685–700. doi:10.2307/352269.
Balk, D. (1994). Individual and community aspects of women’s status and fertility inrural Bangladesh. Population Studies 48(1): 21–45. doi:10.1080/0032472031000147456.
Barbiano di Belgiojose, E. and Terzera L. (2018). Family reunification: Who, when,and how? Family trajectories among migrants in Italy. Demographic Research38(28): 737–772. doi:10.4054/DemRes.2018.38.28.
Barbieri, M. and Hertrich, V. (2005). Age difference between spouses and contraceptivepractice in sub-Saharan Africa. Population 60(5): 671–654. doi:10.3917/pope.505.0617.
Bates, L.M., Maselko, J., and Schuler, S.R. (2007). Women’s education and the timingof marriage and childbearing in the next generation: Evidence from ruralBangladesh. Studies in Family Planning 38(2): 101–112. doi:10.1111/j.1728-4465.2007.00121.x.
Benefo, K.D. (1995). The determinants of the duration of postpartum sexual abstinencein West Africa: A multilevel analysis. Demography 32(2): 139–157.doi:10.2307/2061737.
Bernardi, L. (2003). Channels of social influence on reproduction. Population Researchand Policy Review (5–6): 427–455. doi:10.1023/B:POPU.0000020892.15221.44.
Bernardi, L. and Klärner, A. (2014). Social networks and fertility. DemographicResearch 30(22): 641–670. doi:10.4054/DemRes.2014.30.22.
Bernardi, L. and White, R.G. (2010). Close kin influences on fertility behaviour. In:Heady, P. and Kohli, M. (eds.) Family, kinship and state in contemporaryEurope. Vol. 3. Perspectives on theory and policy. Frankfurt: Campus Verlag:177‒202.

Demographic Research: Volume 41, Article 30
http://www.demographic-research.org 903
Birg, H., Flöthmann E.J., and Reiter, I. (1991). Biographische Theorie derdemographischen Reproduktion. Frankfurt: Campus Verlag.
Bongaarts, J. and Potter, R.J. (1983) Fertility biology and behavior: An analysis of theproximate determinants of fertility. New York: Academic Press.
Bongaarts, J. and Watkins, S.C. (1996). Social interactions and contemporary fertilitytransitions. Population and Development Review 22(4): 639–682. doi:10.2307/2137804.
Bras, H. (2014). Structural and diffusion effects in the Dutch fertility transition, 1870‒1940. Demographic Research 30(5): 151‒186. doi:10.4054/DemRes.2014.30.5.
Bras, H. and Kok, J. (2005). ‘They live in indifference together’: Marriage mobility inZeeland, The Netherlands, 1796‒1922. International Review of Social History50(Supplement): 247‒274.
Bras, H., Liefbroer, A.C., and Elzinga, C.H. (2010). Standardization of pathways toadulthood? An analysis of Dutch cohorts born between 1850 and 1900.Demography 47(4): 1013‒1034. doi:10.1007/BF03213737.
Bras, H. and Suanet, B. (2018). Family systems and spousal age differences innineteenth and early twentieth century Netherlands. In: Puschmann, P. andRiswick, T. (eds.). Building bridges: Scholars, history and historicaldemography. A Festschrift in Honor of Professor Theo Engelen. Nijmegen:Valkhof Pers: 421‒446.
Cain, M. (1993). Patriarchal structure and demographic change. In: Federici, N.,Mason, K.O., and Sogner, S. (eds.). Women’s position and demographic change.Oxford: Clarendon Press: 43‒60.
Carmichael, S. (2011). Marriage and power: Age at first marriage and spousal age gapin lesser developed countries. The History of the Family 16(4): 416–436.doi:10.1016/j.hisfam.2011.08.002.
Carmichael, S., De Moor, T., and Van Zanden, J.L. (2011). ‘When the heart is baked,don’t try to knead it’: Marriage age and spousal age gap as a measure of female‘agency’. Utrecht: Center for Global Economic History (CGEH Working PaperSeries 19).
Casterline, J.B. (2001). Diffusion processes and fertility transition: Introduction. In:Casterline, J.B. (ed.). Diffusion processes and fertility transition: Selectedperspectives. Washington, D.C.: National Academy Press: 1–38.

Bras & Schumacher: An analysis of childbearing trajectories in 19th-century Netherlands
904 http://www.demographic-research.org
Casterline, J.B., Williams, L., and McDonald, P. (1986). The age difference betweenspouses: Variations among developing countries. Population Studies 40(3): 353–374. doi:10.1080/0032472031000142296.
Cleland, J. (2001). Potatoes and pills: An overview of innovation-diffusioncontributions to explanations of fertility decline. In: Casterline, J.B. (ed.).Diffusion processes and fertility transition: Selected perspectives. Washington,D.C.: National Academy Press: 39–65.
Coontz, S. (2005). Marriage, a history. How love conquered marriage. New York:Viking Press.
Darak, S., Mills, M, Kulkarni, V., Kulkarni, S., Hutter, I., and F. Janssen (2015).Trajectories of childbearing among HIV infected Indian women: A sequenceanalysis approach. PLoS ONE 10(4): e0124537. doi:10.1371/journal.pone.0124537.
De Regt, A. (2004). Children in the 20th-century family economy: From co-providers toconsumers. The History of the Family 9(4): 371–384. doi:10.1016/j.hisfam.2003.01.003.
DeRose, L.F. and Ezeh, A.C. (2010). Decision-making patterns and contraceptive use:Evidence from Uganda. Population Research and Policy Review 29(3): 423–439. doi:10.1007/s11113-009-9151-8.
Duncan, S. and Smith, D. (2002). Geographies of family formations: spatial differencesand gender cultures in Britain. Transactions of the Institute of BritishGeographers 27(4):471–493. doi:10.1111/1475-5661.00066.
Dyson, T., and Murphy, M. (1985). The onset of fertility transition. Population andDevelopment Review 11(3): 399–440. doi:10.2307/1973246.
Easterlin, R.A. (1978). The economics and sociology of fertility: A synthesis. In: Tilly,C. (ed.). Historical studies of changing fertility. Princeton: Princeton UniversityPress: 57–134.
Easterlin, R.A., and E. Crimmins (1985). The fertility revolution: A supply‒demandanalysis. Chicago: University of Chicago Press.
Elder, G.H., Johnson, M.K., and Crosnoe, R. (2003). The emergence and developmentof life course theory. In: Mortimer, J.T. and Shanahan, M. (eds.). Handbook ofthe life course. New York: Kluwer Academic Publishers: 3–19. doi:10.1007/978-0-306-48247-2_1.

Demographic Research: Volume 41, Article 30
http://www.demographic-research.org 905
Engelen, T. and Kok, J. (2003). Permanent celibacy and late marriage in theNetherlands, 1890-1960. Population 58(1): 67‒96. doi:10.3917/pope.301.0067.
Feng, W., Lee, J.Z., Tsuya, N.O., Kurosu, S., Oris, M., Dribe, M., and Manfredini, M.(2010). Household organization, co-resident kin, and reproduction. In: Tsuya,N.O., Feng, W., Alter, G., and Lee, J.Z. (eds.). Prudence and pressure:Reproduction and human agency in Europe and Asia, 1700‒1900. Cambridge,MA: The MIT Press: 67‒95.
Fisher, K. (2000). ‘She was quite satisfied with the arrangements I made’: Gender andbirth control in Britain 1920‒1950. Past and Present 169(1): 161‒193.doi:10.1093/past/169.1.161.
Fisher, K. (2006). Birth control, sex and marriage in Britain, 1918–1960. New York:Oxford University Press. doi:10.1093/acprof:oso/9780199267361.001.0001.
Fisher, K. and Szreter, S. (2003). They prefer withdrawal: The choice of birth control inBritain, 1918–1950. Journal of Interdisciplinary History 34(2): 263–291.doi:10.1162/002219503322649507.
Fisher, K. and Szreter, S. (2010). Sex before the sexual revolution: Intimate life inEngland 1918–1963. Cambridge: Cambridge University Press.
Folbre, N. (1983). Of patriarchy born: The political economy of fertility decisions.Feminist Studies 9(2): 261–283. doi:10.2307/3177490.
Folbre, N. (1994). Who pays for the kids? Gender and the structures of constraints.New York: Routledge. doi:10.4324/9780203168295.
Franken, T. and Adriaanse, L. (2004). Op stoom! Industrieel erfgoed in Zeeland (1850–1970). Middelburg: Provincie Zeeland.
Fulda, B.E. (2016). The diversity in longitudinal partnership trajectories during thetransition to adulthood: How is it related to individual characteristics andregional living conditions? Demographic Research 35(37): 1101–1134.doi:10.4054/DemRes.2016.35.37.
Gabadinho, A., Ritschard, G., Müller, N.S., and Studer, M. (2011). Analyzing andvisualizing state sequences in R with TraMineR. Journal of Statistical Software40(4): 1–37. doi:10.18637/jss.v040.i04.
Gillis, J.R. (1996). A world of their own making: Myth, ritual, and the quest for familyvalues. Cambridge: Harvard University Press.

Bras & Schumacher: An analysis of childbearing trajectories in 19th-century Netherlands
906 http://www.demographic-research.org
Gittins, D. (1992). Fair sex: Family size and structure 1900–1939. London:Hutchinson.
Greenhalgh, S. (1995). Anthropology theorizes reproduction: Integrating practice,political economic, and feminist perspectives. In: Greenhalgh, S. (ed.). Situatingfertility: Anthropology and demographic inquiry. Cambridge: CambridgeUniversity Press: 3–28. doi:10.1017/CBO9780511621611.002.
Hilevych, Y. (2015). Abortion and gender relationships in Ukraine, 1955–1970. TheHistory of the Family 20(1): 86–105. doi:10.1080/1081602X.2014.996913.
Hilevych, Y. (2016). Strong families and declining fertility: A comparative study offamily relations and reproductive careers in Soviet Ukraine [PhD thesis].Wageningen: Wageningen University and Research, Faculty of Social Sciences.
Hofstee, E.W. (1981). Korte demografische geschiedenis van Nederland van 1800 totheden [Short demographic history of the Netherlands from 1800 to the present].Haarlem: Fibula-Van Dishoeck.
Hollerbach, P.E. (1980). Power in families, communication, and fertility decision-making. Population and Environment 3(2): 146–173. doi:10.1007/BF01254155.
Humphries, J. (2007). ‘Because they are too menny...’ Children, mothers and fertilitydecline: The evidence from working-class autobiographies of the eighteenth andnineteenth centuries. In: Janssens, A. (ed.). Gendering the fertility decline in thewestern world. Bern: Peter Lang: 113–150.
Jansen, M. (1989). Ik was niet de enige vrouw: Zeeuwse landarbeidsters in de tweedehelft van de negentiende eeuw. In: Backerra, F. (ed.). Vrouwen van het land:Anderhalve eeuw plattelandsvrouwen in Nederland. Zutphen: De Walburg Pers:15–27.
Janssens, A. (2007a). ‘Were women present at the demographic transition?’ A questionrevisited. The History of the Family 12(1): 43–49. doi:10.1016/j.hisfam.2007.05.003.
Janssens, A. (2007b). Gendering the fertility decline in the western world. In: Janssens,A. (ed.). Gendering the fertility decline in the western world. Bern: Peter Lang:1–23.
Jappens, M. and Van Bavel, J. (2012). Regional family norms and child care bygrandparents in Europe. Demographic Research 27(4): 85–120. doi:10.4054/DemRes.2012.27.4.

Demographic Research: Volume 41, Article 30
http://www.demographic-research.org 907
Kaufman, L. and Rousseeuw, P.J. (1990). Finding groups in data: An introduction tocluster analysis. New York: Wiley. doi:10.1002/9780470316801.
Kloek, E. (2009). Vrouw des huizes: Een cultuurgeschiedenis van de Hollandsehuisvrouw. Amsterdam: Balans.
Knippenberg, H. (2003). Van verzuilde naar zwevende kiezers: De politieke kaart in denegentiende en twintigste eeuw. In: Beekink, E., Boonstra, O., Engelen, T., andKnippenberg, H. (eds.). Nederland in verandering: Maatschappelijkeveranderingen in kaart gebracht 1800–2000. Amsterdam: Aksant: 123–152.
Knodel, J. (1987). Starting, stopping, and spacing during the early stages of fertilitytransition: The experience of German village populations in the 18th and 19th
centuries. Demography 24(2): 143–162. doi:10.2307/2061627.
Knodel, J. (1988). Demographic behavior in the past: A study of fourteen Germanvillage populations in the eighteenth and nineteenth centuries. Cambridge:Cambridge University Press. doi:10.1017/CBO9780511523403.
Knodel, J. and Van de Walle, E. (1979). Lessons from the past: Policy implications ofhistorical fertility studies. Population and Development Review 5(2): 217‒245.
Kok, J. (1998). ‘Vrijt daar je zijt’: Huwelijk en partnerkeuze in Zeeland tussen 1830 en1950. Zeeland: Tijdschrift van het Koninklijk Zeeuwsch genootschap derwetenschappen 7(3): 131–143.
Lee-Rife, S.M. (2010). Women’s empowerment and reproductive experiences over thelife course. Social Science and Medicine 71(3): 634–642. doi:10.1016/j.socscimed.2010.04.019.
Lyngstad, T.H. and Prskawetz, A. (2010). Do siblings’ fertility decisions influence eachother? Demography 47(4): 923–934. doi:10.1007/BF03213733.
MacKinnon, A. (1995). Were women present at the demographic transition? Questionsfrom a feminist historian to historical demographers. Gender and History 7(2):222–240. doi:10.1111/j.1468-0424.1995.tb00022.x.
MacKinnon, A., Batson, C., and Petersen-Gray, J. (2007). ‘...But I’m so embarrassed, Isaid, if it’s another baby!’: Schooling, girls and declining fertility in urban SouthAustralia in the late nineteenth and early twentieth century. In: Janssens, A.(ed.). Gendering the fertility decline in the western world. Bern: Peter Lang:205–235.
Macmillan, R. (2005). The structure of the life course: Classic issues and currentcontroversies. In: Macmillan, R. (ed.). The structure of the life course:

Bras & Schumacher: An analysis of childbearing trajectories in 19th-century Netherlands
908 http://www.demographic-research.org
Standardized? Individualized? Differentiated? Amsterdam: Elsevier: 3–24.doi:10.1016/S1040-2608(04)09001-X.
Madero-Cabib, I. (2015). The life course determinants of vulnerability in late careers.Longitudinal and Life Course Studies 6(1): 88–106. doi:10.14301/llcs.v6i1.299.
Malhotra, A., Vanneman, R., and Kishor, S. (1995). Fertility, dimensions of patriarchy,and development in India. Population and Development Review 21(2): 281–305.doi:10.2307/2137495.
Mason, K.O. (2001). Gender and family systems in the fertility transition. Populationand Development Review 27: 160–176.
Massey, D. (1984). Spatial divisions of labour. London: Macmillan.
Matthijs, K. (2002). Mimetic appetite for marriage in nineteenth-century Flanders:Gender disadvantage as an incentive for social change. Journal of FamilyHistory 27(2): 101–127. doi:10.1177/036319900202700203.
Mayer, K.U. (1987). Lebenslaufsforschung. In: Voges, W. (ed). Methoden derBiographie- und Lebenslaufsforschung. Opladen: Leske and Budrich: 51–73.doi:10.1007/978-3-322-92595-4_3.
McLaren, A. (1992). The sexual politics of reproduction in Britain. In: Gillis, J.R.,Tilly, L.A., and Levine, D. (eds.). The European experience of declining fertility.A quiet revolution 1850–1970. Oxford: Blackwell: 85–100.
Mitterauer, M. and Sieder, R. (1983). The European family: Patriarchy to partnershipfrom the middle ages to the present. Chicago: University of Chicago Press.
Murphy, M. and Knudsen, L.B. (2008). The relationship of parents’, brothers’ andsisters’ fertility histories with the onset of childbearing in contemporaryDenmark. In: Festy, P. and Sardon, J.P. (eds.). Profession démographe:Hommage à Gérard Calot. Paris: INED: 265–285.
Ní Bhrolcháin, M. (1992). Age difference asymmetry and a two-sex perspective.European Journal of Population 8: 23–45. doi:10.1007/BF01797120.
Ní Bhrolcháin, M. (2005). The age difference between partners: A matter of femalechoice? In: Sauvain-Dugerdil, C., Leridon, H., and Mascie-Taylor, N. (eds.).Human clocks: The bio-cultural meanings of age. Bern: Peter Lang: 289–312.
Pallitto, C.C. and O’Campo, P. (2005). Community level effects of gender inequality onintimate partner violence and unintended pregnancy in Columbia: Testing the

Demographic Research: Volume 41, Article 30
http://www.demographic-research.org 909
feminist perspective. Social Science and Medicine 60(10): 2205–2216.doi:10.1016/j.socscimed.2004.10.017.
Pfau-Effinger, B. (2000). Gender cultures and the gender arrangements and socialchange in the European context. In: Duncan, S. and Pfau-Effinger, B. (eds.).Gender, economy and culture in the European Union. London: Routledge: 262–276.
Pooley, S. (2013). Parenthood, child-rearing and fertility in England, 1850–1914.History of the Family 18(1): 83–106. doi:10.1080/1081602X.2013.795491.
Praz, A.-F. (2007). Gender and religion shaping the pace of the fertility decline: Acomparative analysis of two Swiss cantons (1860–1930). In: Janssens, A. (ed.).Gendering the fertility decline in the western world. Bern: Peter Lang: 275–307.
Praz, A.-F. (2009). Religion, masculinity and fertility decline: A comparative analysisof Protestant and Catholic culture (Switzerland 1890–1930). The History of theFamily 14(1): 88–106. doi:10.1016/j.hisfam.2009.01.001.
Priester, P. (1998). Geschiedenis van de Zeeuwse landbouw circa 1600–1910 [Historyof Zeeland agriculture, ca. 1600–1900]. ‘t Goy-Houten: HES Uitgevers.
Ritschard, G., Gabadinho, A., Müller, N.S., and Studer, M. (2008). Mining eventhistories: A social science perspective. International Journal of Data Mining,Modelling and Management 1(1): 68–90. doi:10.1504/IJDMMM.2008.022538.
Rusterholz, C. (2015). Costs of children and models of parenthood: Comparativeevidence from two Swiss cities, 1955–1970. Journal of Family History 40(2):208–229. doi:10.1177/0363199015569710.
Safilios-Rothschild, C. (1972). The relationship between work commitment andfertility. International Journal of Sociology of the Family 2(1): 64–71.
Schumacher, R., Matthijs, K., and Moreels, S. (2013). Migration and reproduction in anurbanizing context: Family life courses in 19th century Antwerp and Geneva.Revue Quetelet 1(1): 19‒40.
Sear, R. and Coall, D. (2011). How much does family matter? Cooperative breedingand the demographic transition. Population and Development Review 37(S1):81–112. doi:10.1111/j.1728-4457.2011.00379.x.
Seccombe, W. (1990). Starting to stop: Working-class fertility decline in Britain. Pastand Present 126(1): 151–188. doi:10.1093/past/126.1.151.

Bras & Schumacher: An analysis of childbearing trajectories in 19th-century Netherlands
910 http://www.demographic-research.org
Seccombe, W. (1992). Men’s ‘marital rights’ and women’s ‘wifely duties’: Changingconjugal relations in the fertility decline. In: Gillis, J.R., Tilly, L.A., and Levine,D. (eds.). The European experience of declining fertility: A quiet revolution1850–1970. Oxford: Blackwell: 66–84.
Seccombe, W. (1993). Weathering the storm: Working-class families from theindustrial revolution to the fertility decline. London: Verso.
Sevenhuisen, S. (1987). De orde van het vaderschap. Amsterdam: Universiteit vanAmsterdam.
Shorter, E. (1975). The making of the modern family. New York: Basic Books.
Skinner, G.W. (1993). Conjugal power in Togugawa Japanese families: A matter of lifeand death. In: Miller, B.D. (ed.). Sex and gender hierarchies. New York:Cambridge University Press: 236–270.
Studer, M. and Ritschard, G. (2016). What matters in differences between lifetrajectories: A comparative review of sequence dissimilarity measures. Journalof the Royal Statistical Society Series A: Statistics in Society 179(2): 481–511.doi:10.1111/rssa.12125.
Szreter, S. (1996). Fertility, class, and gender in Britain 1860–1940. Cambridge:Cambridge University Press. doi:10.1017/CBO9780511582240.
Szreter, S. and Garrett, E. (2000). Reproduction, compositional demography, andeconomic growth: Family planning in England long before the fertility decline.Population and Development Review 26(1): 45–80. doi:10.1111/j.1728-4457.2000.00045.x.
Therborn, G. (2004). Between sex and power: Family in the world, 1900–2000.London: Routledge. doi:10.4324/9780203643297.
Timæus, I.M. and Moultrie, T.A. (2008). On postponement and birth intervals.Population and Development Review 34(3): 483–510. doi:10.1111/j.1728-4457.2008.00233.x.
Van Bavel, J. (2004). Deliberate birth spacing before the fertility transition in Europe:Evidence from nineteenth-century Belgium. Population Studies 58(1): 95–107.doi:10.1080/0032472032000167706.
Van Bavel, J. and Kok, J. (2005). The role of religion in the Dutch fertility transition:Starting, spacing, and stopping in the heart of the Netherlands, 1845–1945.Continuity and Change 20(2): 247–263. doi:10.1017/S0268416005005473.
Demographic Research: Volume 41, Article 30
http://www.demographic-research.org 911
Van de Putte, B., Van Poppel, F., Vanassche, S., Sanchez, M., Jidkova, S., Eeckhaut,M., Oris, M., and Matthijs, K. (2009). The rise of age homogamy in 19th centuryWestern Europe. Journal of Marriage and Family 71(5): 1234–1253.doi:10.1111/j.1741-3737.2009.00666.x.
Van de Walle, E. (1974). The female population of France in the nineteenth century: Areconstruction of 82 départements. Princeton: Princeton University Press.
Van Heek, F. (1956). Roman-Catholicism and fertility in the Netherlands. PopulationStudies 10(2): 125–138. doi:10.1080/00324728.1956.10404535.
Van Leeuwen, M.H.D., Maas, I., and Miles, A. (2002). HISCO: HistoricalInternational Standard Classification of Occupations. Leuven: LeuvenUniversity Press.
Van Leeuwen, M.H.D. and Maas, I. (2011). HISCLASS: A historical internationalsocial class scheme. Leuven: Leuven University Press.
Van Poppel, F.W.A. (1985). Le retard du déclin de la fécondité néerlandaise: Rôles dela religion, de la catégorie socio-économique et de la région. European Journalof Population 1(4): 347–373. doi:10.1007/BF01797148.
Van Poppel, F. (1992). Trouwen in Nederland: Een historisch-demografische studie vande 19e en vroeg 20ste eeuw [PhD thesis]. Wageningen: Landbouw UniversiteitWageningen.
Van Poppel, F., Liefbroer, A., Vermunt, J., and Smeenk, W. (2001). Love, necessityand opportunity: Changing patterns of marital age homogamy in theNetherlands, 1850–1993. Population Studies 55(1): 1–13. doi:10.1080/00324720127681.
Watkins, S.C. (1993). If all we knew about women was what we read in ‘Demography,’what would we know? Demography 30(4): 551–577. doi:10.2307/2061806.
Wheeler, R.H. and Gunter, B.G. (1987). Change in spouse age difference at marriage: Achallenge to traditional family and sex roles? The Sociological Quarterly 28(3):411–421. doi:10.1111/j.1533-8525.1987.tb00303.x.
Zijdeman, R.L. (2010). Status attainment in the Netherlands, 1811–1941: Spatial andtemporal variation before and during industrialization [PhD thesis]. Groningen:University of Groningen.

Bras & Schumacher: An analysis of childbearing trajectories in 19th-century Netherlands
912 http://www.demographic-research.org