changing bacterial growth efficiencies across a natural
TRANSCRIPT

Florida International UniversityFIU Digital Commons
FIU Electronic Theses and Dissertations University Graduate School
3-27-2015
Changing Bacterial Growth Efficiencies across aNatural Nutrient Gradient in an OligotrophicEstuaryAmber A. KigerFlorida International University, [email protected]
DOI: 10.25148/etd.FI15032176Follow this and additional works at: https://digitalcommons.fiu.edu/etd
Part of the Biogeochemistry Commons, and the Environmental Microbiology and MicrobialEcology Commons
This work is brought to you for free and open access by the University Graduate School at FIU Digital Commons. It has been accepted for inclusion inFIU Electronic Theses and Dissertations by an authorized administrator of FIU Digital Commons. For more information, please contact [email protected].
Recommended CitationKiger, Amber A., "Changing Bacterial Growth Efficiencies across a Natural Nutrient Gradient in an Oligotrophic Estuary" (2015). FIUElectronic Theses and Dissertations. 1758.https://digitalcommons.fiu.edu/etd/1758

FLORIDA INTERNATIONAL UNIVERSITY
Miami, Florida
CHANGING BACTERIAL GROWTH EFFICIENCES ACROSS A NATURAL
NUTRIENT GRADIENT IN AN OLIGOTROPHIC ESTUARY
A thesis submitted in partial fulfillment of the
requirements for the degree of
MASTER OF SCIENCE
in
GEOSCIENCES
by
Amber Alexis Kiger
2015

ii
To: Dean Michael Heithaus College of Arts and Sciences
This thesis, written by Amber Alexis Kiger, and entitled Changing Bacterial Growth Efficiencies across a Natural Nutrient Gradient in an Oligotrophic Estuary, having been approved in respect to style and intellectual content, is referred to you for judgment. We have read this thesis and recommend that it be approved.
________________________________________ Leonard J. Scinto
________________________________________ Joseph N. Boyer, Co-Major Professor
________________________________________ William Anderson, Co-Major Professor
Date of Defense: March 27, 2015 The thesis of Amber Alexis Kiger is approved.
________________________________________ Dean Michael Heithaus
College of Arts and Sciences
________________________________________ Dean Lakshmi N. Reddi
University Graduate School
Florida International University, 2015

iii
DEDICATION
This thesis is dedicated to my family for encouraging me to reach this point in my
academic and scientific career.
iv
ACKNOWLEDGMENTS
I would like to thank the members of my committee for their support and
guidance during the completion of this project. Dr. Leonard J. Scinto provided
challenging questions and critiques that pushed my abilities as a scientist. Dr. Joseph
Boyer was especially helpful during the early phases of this project, and I appreciate that
he continued to be very involved in this work after leaving Florida International
University. I particularly would like to thank my major professor, Dr. William Anderson
for adopting me as a graduate student after Dr. Boyer left the university and dealing with
my numerous questions and mini-crises.
I would also like to thank everyone who taught me various lab procedures and
sampling methods, including Rafael Guevara, Sandro Stumpf, John Harris, Rachel
Kotkowski, Amel Said, and George Berberian. Without the unique expertise of each of
these individuals, this interdisciplinary project would have been less successful. I also
wish to thank the Florida Coastal Everglades Long-Term Ecological Research program
(DBI-0620409) for financial support of this research.

v
ABSTRACT OF THE THESIS
CHANGING BACTERIAL GROWTH EFFICIENCIES ACROSS A NATURAL
NUTRIENT GRADIENT IN AN OLIGOTROPHIC ESTUARY
by Amber Alexis Kiger
Florida International University, 2015
Miami, Florida
Professor William Anderson, Co-Major Professor
Professor Joseph N. Boyer, Co-Major Professor
Recent studies have characterized coastal estuarine systems as important
components of the global carbon cycle. This study investigated carbon cycling through
the microbial loop of Florida Bay by use of bacterial growth efficiency calculations.
Bacterial production, bacterial respiration, and other environmental parameters were
measured at three sites located along a historic phosphorus-limitation gradient in Florida
Bay and compared to a relatively nutrient enriched site in Biscayne Bay. A new method
for measuring bacterial respiration in oligotrophic waters involving tracing respiration of
13C-glucose was developed. The results of the study indicate that 13C tracer assays may
provide a better means of measuring bacterial respiration in low nutrient environments
than traditional dissolved oxygen consumption-based methods on the basis of strong
correlations between incubation length and δ13C values. Results also suggest that overall
bacterial growth efficiency may be lower at the most nutrient limited sites.

vi
TABLE OF CONTENTS
CHAPTER PAGE
1. INTRODUCTION ......................................................................................................... 1 2. METHODOLOGY ........................................................................................................ 9
2.1 Study Site Description ............................................................................................ 9 2.2 Sample Collection ................................................................................................. 13 2.3 Sample Analysis.................................................................................................... 17 2.4 Statistical Methods ................................................................................................ 19
3. RESULTS .................................................................................................................... 20
3.1 Environmental Parameters .................................................................................... 20 3.2 Bacterial Abundance and Bacterial Production .................................................... 21 3.3 Bacterial Respiration ............................................................................................. 22
4. DISCUSSION .............................................................................................................. 41 5. CONCLUSION ............................................................................................................ 44

vii
LIST OF FIGURES
FIGURE PAGE
Figure 1: Diagram of the classical marine food chain and the microbial loop (modified from Robinson 2008). ..........................................................................................................3
Figure 2: Range of BGE reported in previous literature in rivers, oceans, lakes, and estuaries (modified from del Giorgio and Cole 1998). ....................................................... 4
Figure 3: Aerial image of Florida Bay and field collection sites (modified from Google Earth)................................................................................................................................. 11
Figure 4: Aerial image of northern Biscayne Bay and the Oleta River Park sampling site (modified from Google Earth). ....................................................................................12
Figure 5: Process diagram showing sample collection scheme and sample treatments. .. 16
Figure 6: Average bacterial production values for each sampling event. ......................... 22
Figure 7: Carbon respired over time measured by Winkler titration for Sampling Event 1..........................................................................................................................................23
Figure 8: Carbon respired over time measured by Winkler titration for samples collected on June 11th, 2013 (Sampling Event 2). .............................................................24
Figure 9: Carbon respired over time measured by Winkler titration for samples collected on June 26th, 2013 (Sampling Event 3). .............................................................25
Figure 10: Carbon production determined by Winkler titration at TS-9, TS-10 and TS-11 on July 24th, 2013 (Sampling Event 4). ........................................................................26
Figure 11: δ13C-DIC values at varying incubation times in samples labeled with 13C-glucose collected on May 23rd 2013. ................................................................................ 27
Figure 12: δ13C-DIC values at varying incubation times in unlabeled samples collected on May 23rd 2013. ..............................................................................................................28
Figure 13: δ13C-DIC values at varying incubation times in labeled samples collected from Biscayne Bay on June 11th, 2013. .............................................................................29
Figure 14: δ13C-DIC values at varying incubation times in unlabeled samples collected from Biscayne Bay on June 11th, 2013. ............................................................................ 30
Figure 15: δ13C-DIC values at varying incubation times in labeled samples collected from Florida Bay site TS-9 on June 26th, 2013. .................................................................31

viii
Figure 16: δ13C-DIC values at varying incubation times in unlabeled samples collected from Florida Bay site TS-9 on June 26th, 2013. ................................................................ 31
Figure 17: Changes in δ13C-DIC in incubated 13C-labeled samples collected from TS-9, TS-10, and TS-11 on July 24th, 2013. ............................................................................33
Figure 18: Changes in δ13C-DIC in incubated unlabeled samples collected from TS-9, TS-10, and TS-11 on July 24th, 2013. ............................................................................... 34
Figure 19: Linear regression between mass 44 peak amplitude measured via GC-IRMS and DIC measured in parts per million for each sampling event. Graph A was generated for May 23rd data, graph B for June 11th data, graph C for June 26th data and graph D for July 24th data. .................................................................................................36
Figure 20: Relationship between δ13C-DIC values converted into μg C L−1 and incubation time for samples collected on May 23rd, 2013. ................................................37
Figure 21: Relationship between δ13C-DIC values converted into μg C L−1 and incubation time for samples collected on June 26th, 2013. ................................................37
Figure 22: Relationship between δ13C-DIC values converted into μg C L−1 and incubation time for unlabeled samples collected on July 24th, 2013. Graph A represents TS-9 data, graph B represents TS-10 data, and graph C represents TS-11 data. ....................................................................................................................................38
Figure 23: Relationship between δ13C-DIC values converted into μg C L−1 and incubation time for 13C-labeled samples collected on July 24th, 2013. Graph A represents TS-9 data, graph B represents TS-10 data, and graph C represents TS-11 data. ....................................................................................................................................39

1
1. INTRODUCTION
In light of increasing greenhouse gas concentrations and the threat of climate
change, recent studies designed for quantifying potential carbon sinks have indicated that
coastal marine systems are capable of storing carbon on a globally significant scale
(Boullion et al. 2011, McLeod et al. 2011). A study by Donato et al. (2011) quantified
carbon storage within mangrove systems, which are common along tropical and
subtropical coastlines. The study indicated that mangrove systems on average store 1,023
megagrams carbon per hectacre (Mg C ha−1), storing significantly more carbon on
average than upland tropical forests (300 Mg C ha−1) that are typically considered in
carbon sequestration efforts. Another study by Fourqurean et al. (2012a) quantified
carbon storage within seagrass beds. The study concluded that seagrass meadows
globally can store up to 829 Mg C ha−1. As research continues in this field, more detailed
quantification of coastal carbon budgets will be necessary in order to better understand
the role of coastal communities in the global carbon cycle.
Current research is characterizing carbon budgets across different habitats and
communities within the Everglades and Florida Bay. Fourqurean et al. (2012b) examined
carbon storage under seagrass beds in Florida Bay, and showed that on average, Florida
Bay seagrass beds store 163.5 Mg C ha−1. The highest percentage of organic carbon
(8%) was found in sediment adjacent to the shoreline in Central Florida Bay. Smoak et
al. (2013) measured carbon storage at two mangrove sites in the southwestern Everglades
located on the Shark River and Harney River. The overall carbon burial rate, measured
by 210Pb dating of sediment cores, was 151-168 g C m−2 yr−1. A study by Engel et al.
(2011), however, suggests that most carbon uptake in these mangrove forests is exported
2
through tides as dissolved inorganic or organic carbon and does not accumulate in
sediment. Although these components of the coastal Everglades carbon budget have
been determined, more research is needed, particularly for carbon cycling within the
Florida Bay water column.
Previous work has characterized air-water CO2 exchange in different parts of
Florida Bay. DuFore (2012) measured CO2 exchange through floating chambers at 24
sites throughout Florida Bay. At Eastern Florida Bay sampling stations, water was found
to be oversaturated with CO2. DuFore (2012) hypothesized that this oversaturation was a
consequence of freshwater input from Taylor Slough. In Central Florida Bay, water was
generally undersaturated with CO2 and acted as an atmospheric CO2 sink. DuFore (2012)
did not quantify microbial data in this study; thus, the role of microbes in the sink or
source status of Florida Bay is still unknown.
Water column microbial communities can often be a significant component of
coastal and estuarine carbon cycles (Azam et al. 1983). Bacteria, phytoplankton and
zooplankton can move C and nutrients across air-land-water boundaries and transform C
into different organic and inorganic forms (Arrigo 2005). One particularly important
energy and nutrient pathway utilized by bacteria is the microbial loop, which is
considered separate from the classical marine food chain (Azam et al. 1983). Within the
microbial loop, water column bacteria take up dissolved organic carbon (DOC) produced
by other tropic levels and either respire the carbon as CO2 or convert it into bacterial
biomass that moves back into the traditional food chain (Figure 1).

3
Figure 1: Diagram of the classical marine food chain and the microbial loop (modified from Robinson 2008).
Microbial loop carbon cycling processes can be quantified through bacterial
growth efficiency measurements. Bacterial growth efficiency (BGE) is a ratio that
indicates the proportion of bacterial carbon uptake that is used to produce biomass
relative to the amount of carbon respired (del Giorgio et al. 1997). Bacterial growth
efficiency is represented by the equation BGE = BP/(BP + BR), in which BP is bacterial
production and BR is bacterial respiration (del Giorgio and Cole 1998). Both BP and BR
are reported in μg C L−1 hr−1. Numerous factors influence BGE, which ultimately
influences the sequestration of carbon into biomass or loss of carbon to respiration in an
aquatic or marine system. According to a review of global BGE calculations by del
Giorgio and Cole (1998), BGE varies in different aquatic environments and increases
along productivity gradients (Figure 2). Low BGE is expected in oligotrophic
environments as a result of the energy cost of maintaining active transport systems and

4
basic metabolic machinery. Mesotrophic and eutrophic areas, however, do not need to
allocate as much energy for utilization of nutrients, so BGE tends to be higher in these
waters.
Figure 2: Range of BGE reported in previous literature in rivers, oceans, lakes, and estuaries (modified from del Giorgio and Cole 1998).
Although the del Giorgio and Cole (1998) study indicated that trophic state index
was a main factor influencing BGE, other studies have investigated additional potential
controls of BGE. Eiler et al. (2003) found that DOC concentration correlates with BGE
in an asymptotic pattern, suggesting that DOC concentration affects BGE only in the
most oligotrophic conditions. A study by Apple and del Giorgio (2007) showed that
BGE positively correlated with long-term DOC lability in a temperate estuary, indicating
that dissolved organic matter (DOM) source (quality) may impact BGE. A study
5
conducted by Lennon and Pfaff (2005) showed that DOM with low C:P ratios (less than
160:1 by mol) from different sources was associated with high bacterial productivity,
indicating that P availability can affect BGE values. A weak negative correlation
between BGE and salinity was found in a study by Griffiths et al. (1984), but this
correlation may have been an effect of productivity gradients rather than an effect of
salinity gradients (del Giorgio and Cole 1998). Other potential controls on BGE, such as
N, are also examined in the del Giorgio and Cole (1998) review.
Methods to analyze BGE often involve measurement of BP via tritiated thymidine
or leucine incorporation (Fuhrman and Azam 1982, Kirchman et al. 1985, Simon and
Azam 1989) and measurement of BR through O2 consumption (Biddanda et al. 1994,
Chin-Leo and Benner 1992). Samples collected for BR measurements are usually filtered
to separate bacteria from larger organisms and then incubated in dark conditions to
measure initial and final dissolved oxygen (DO) levels. Although the vast majority of
BR measurements are made in this way (Robinson 2008), this method may not be ideal,
especially for oligotrophic systems. Bacterial respiration measurements in oligotrophic
waters often require long incubations (24 hours or greater) to obtain a detectable change
in DO levels (del Giorgio and Cole 1998). A study by Aranguren-Gassis et al. (2012)
concluded that DO consumption measurements lead to overestimation of BR rates in
oligotrophic waters because of long incubation times altering the natural microbial
community structure. In addition to long incubation times altering community structure,
contamination of samples with atmospheric oxygen may impact results. Earth’s
atmosphere contains 21% O2 while water contains DO at a concentration several orders
of magnitude smaller (approximately 1-10 parts per million); thus, careful methodology

6
must be used to avoid aeration of samples and atmospheric contamination (Friederich et
al. 1991). Because DO consumption measurements may not be representative of natural
BR in an oligotrophic environment, alternative methods should be developed to better
assess BR and hence, BGE.
Carbon isotope tracer experiments may serve as an alternative method to
determine BR. Early work on quantifying uptake and respiration of C focused on
bacterial consumption of radiolabeled compounds, such as 14C-labeled glucose (Parsons
and Strickland 1961, Hobbie and Crawford 1969). Although these studies were sensitive
enough to measure respiration in low productivity systems (del Giorgio and Cole 1998),
these measurements led to overestimates of BGE because of the simplicity of the
compounds compared to natural food sources as well as isotopic dilution within the
intracellular carbon pool (King and Berman 1984, Bjørnson 1986, Kirchman 2003).
Measurement of natural stable isotope ratios before and after incubation rather than use
of radioactive tracers may provide a way to measure BR in oligotrophic systems while
overcoming concerns about use of simple tracer compounds. Natural stable isotope ratio
measurement would involve bacterial consumption of a variety of simple and complex
compounds, producing BR values more representative of field conditions. Ratios of 12C
and 13C are utilized frequently in ecological studies (Fry 2006) and are usually reported
as δ13C values (Craig 1957). Recent developments in isotope ratio mass spectrometry
have created more precise methods for measuring δ13C in dissolved inorganic carbon
(DIC) (St. Jean 2003, Torres et al. 2005). Tracking changes in δ13C-DIC before and after
dark incubation may serve as an alternative to both DO consumption methods and
radioisotope methods for measuring BR.

7
Past studies have shown that DIC concentration, as well as δ13C-DIC values, can
be impacted by microbial activity (Torres et al. 2005); thus, known microbial impacts to
δ13C-DIC can be used to produce respiration measurements in the current study.
Preferential uptake of 12C by phytoplankton during photosynthesis can lead to δ13C-DIC
increases. Decay and bacterial processing of organic matter impacted by this biological
fractionation, conversely, tends to decrease δ13C-DIC values (Li and Liu 2011). Thus,
size-filtered BR samples containing only natural sources of DOM (previously impacted
by phytoplankton and higher trophic levels) would decrease in δ13C-DIC over time.
Samples with an isotopically labeled substrate, however, would have increasing δ13C-
DIC values over time as the labeled DIC is consumed and respired.
Studies that assess δ13C-DIC values typically involve addition of a preservative to
a water sample in order to prevent this microbial activity from occurring (Doctor et al.
2008, Li and Liu 2011). A study by Taipale and Sonninen (2009) specifically addressed
the effects of collection vial type and preservation method on δ13C-DIC values and found
significant changes when samples were not properly stored or preserved. Other methods
used to keep δ13C-DIC values unchanged include filtration of samples, storage of samples
under refrigeration, and complete filling of sample vials to prevent fractionation with air
(Taipale and Sonninen 2009). In this study, the inhibition methods described above were
used to stop biological activity at specific incubation intervals.
The primary objective of this study was to calculate baseline bacterial growth
efficiency values at three historically oligotrophic sites (Childers et al. 2006) located in
Florida Bay from bacterial production and bacterial respiration measurements. A
secondary goal of this study was to develop an alternative method of measuring bacterial
8
respiration using changes in δ13C-DIC values. On the basis of previous research, BGE
values were expected to positively correlate with historic trophic state index (TSI) and
were expected to be lowest at the most oligotrophic site. In mesotrophic waters,
traditional DO consumption methods were expected to be effective for measuring
bacterial respiration and were expected to not differ significantly from the δ13C-DIC
method. In oligotrophic waters, however, the DO method was expected to be ineffective.
Under these conditions, the δ13C-DIC method was expected to detect respiration after less
than 24 hours of incubation, while the DO method was expected to require incubations of
24 hours or longer to detect respiration. In summary, this study was expected to address
the following three objectives and hypotheses:
Objective 1: To determine bacterial growth efficiencies across a natural nutrient
gradient in Florida Bay.
H1: Bacterial growth efficiencies will positively correlate with historic trophic
state index and nutrient stoichiometry.
Objective 2: To develop a method that detects BR in oligotrophic waters which is
more sensitive and requires a shorter incubation time than traditional DO
consumption-based measurements.
H2: In oligotrophic waters, δ13C-DIC changes and DIC increases will be
detectable after less than 24 hours of incubation. DO consumption, however, will
not be detectable within 24 hours.
Objective 3: To determine whether measurements of δ13C-DIC before and after
dark incubation can serve as an alternative to traditional DO consumption
measurements when determining bacterial respiration in a marine water sample.

9
H3: Bacterial respiration values calculated by δ13C-DIC measurements will not be
significantly different than standard oxygen-based methods under mesotrophic or
eutrophic conditions.
2. METHODOLOGY
2.1 Study Site Description
Florida Bay is a 1,600 km2 lagoonal estuary located between the southern tip of
mainland Florida and the Florida Keys. Carbonate mud banks that restrict water
circulation divide Florida Bay into shallow basins (Fourqurean and Robblee 1999).
Taylor Slough, located north of the eastern side of the Bay, is the main terrestrial surface
water source and provides over 90% of the freshwater in Eastern Florida Bay (Swart and
Price 2002). Conversely, Western Florida Bay lacks direct terrestrial surface water input
resulting in rainfall being the primary freshwater input. Seasons are primarily defined by
wet-dry precipitation cycles rather than air temperature. Approximately 60% of rainfall
occurs from June-September, while 25% of rainfall occurs between November-April
(Obeysekera et al. 1999). Florida Bay is characterized by occasional periods of
hypersalinity, ranging up to 70 psu, when freshwater input from the Everglades is low
(Boyer and Jones 2001, Robblee et al. 2001).
The geology of Florida Bay was briefly reviewed by Obeysekera et al. (1999).
Oolitic Miami Limestone forms the bedrock foundation of Florida Bay. The Lower
Florida Keys are composed of higher relief portions of oolitic Miami Limestone, while
the Upper Florida Keys are composed of fossilized coral (Key Largo Limestone). The
geologic foundations of the Florida Keys and Florida Bay were formed approximately
10
100,000 years ago during the Sangamon interglacial (Hoffmeister 1974, Obeysekera et al.
1999). During this time, warm shallow seas covered the present-day Everglades and
Florida Keys, creating conditions for both inorganic limestone formation (Miami
Limestone- Oolitic) and biologic limestone formation (Key Largo Limestone, Miami
Limestone- Bryozoan). The limestone foundation of Florida Bay is fairly flat; however,
calcareous sediments have produced a network of banks and shallow basins throughout
Florida Bay. The beginning of this sediment deposition began approximately 4000 years
ago as sea level rise began to flood present-day Florida Bay. The bank and basin system
is hypothesized to be a product of converging currents during flooding of Florida Bay,
drowned marsh rills or minor bedrock depressions (Wanless and Tagett 1989,
Obeysekera et al. 1999).
Physical, chemical, and nutrient limitation characteristics have been used to
divide the bay into three biogeochemically distinct regions: Eastern Florida Bay, Central
Florida Bay and Western Florida Bay (Boyer et al. 1997). Eastern Florida Bay, which is
influenced by freshwater input from Taylor Slough, is strongly P-limited and is
considered the most oligotrophic part of the Bay. Western Florida Bay is less P-limited
and is more strongly influenced by oceanic connections with the Gulf of Mexico (Boyer
et al. 1997). Central Florida Bay lies in the middle of this nutrient gradient and is
characterized by high DOM, long water residence time, and periodic cyanobacterial
blooms dominated by Synechococcus (Phlips et al. 1999, Boyer et al. 2006). This
nutrient limitation pattern has led to Florida Bay being described as an “upside-down”
estuary, meaning that limiting nutrients are derived from marine sources rather than
terrestrial sources (Childers et. al 2006).
11
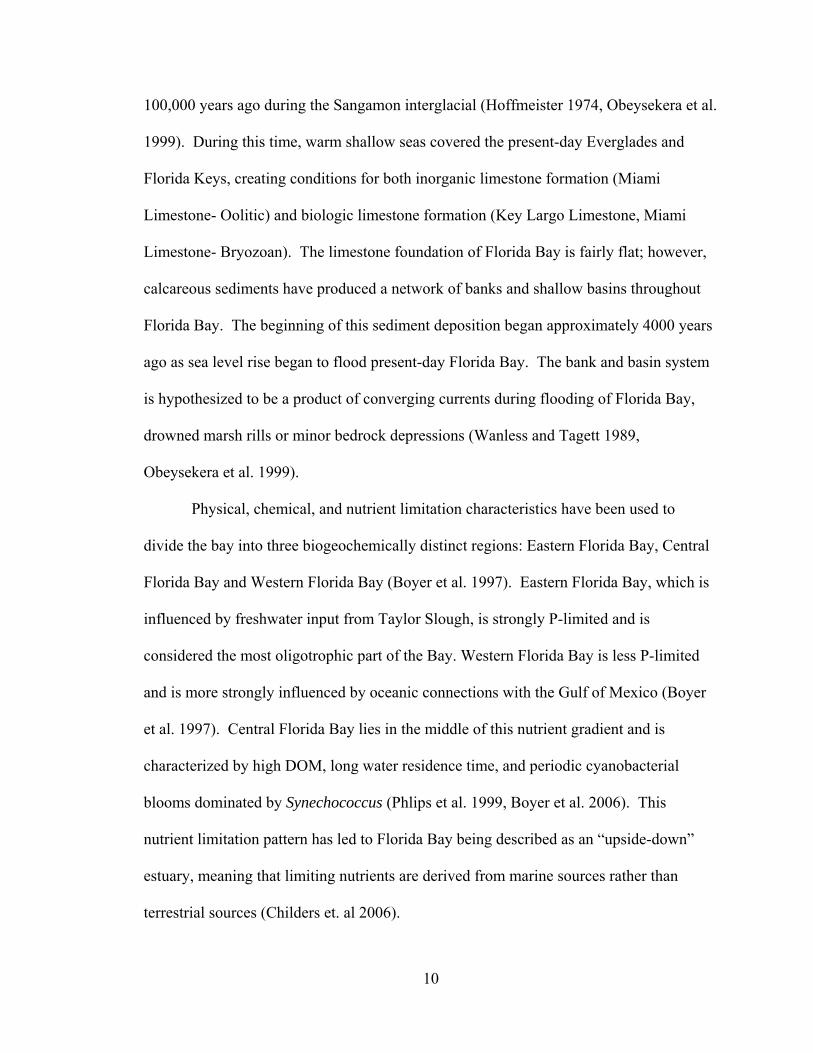
Samples for this study were collected from three sites in Florida Bay that belong
to the Florida Coastal Everglades Long-Term Ecological Research (FCE-LTER)
network: TS-9, TS-10 and TS-11 (Figure 3). Each of these sites is representative of
different biogeochemical conditions that exist in Florida Bay. TS-9 is a shallow estuarine
site and is most representative of conditions in Eastern Florida Bay (Boyer et al. 2006).
TS-10 and TS-11 are both representative of Central Florida Bay, but TS-11 experiences
more exchange with the Gulf of Mexico and is located farther west along the nutrient
gradient.
Figure 3: Aerial image of Florida Bay and field collection sites (modified from Google Earth).
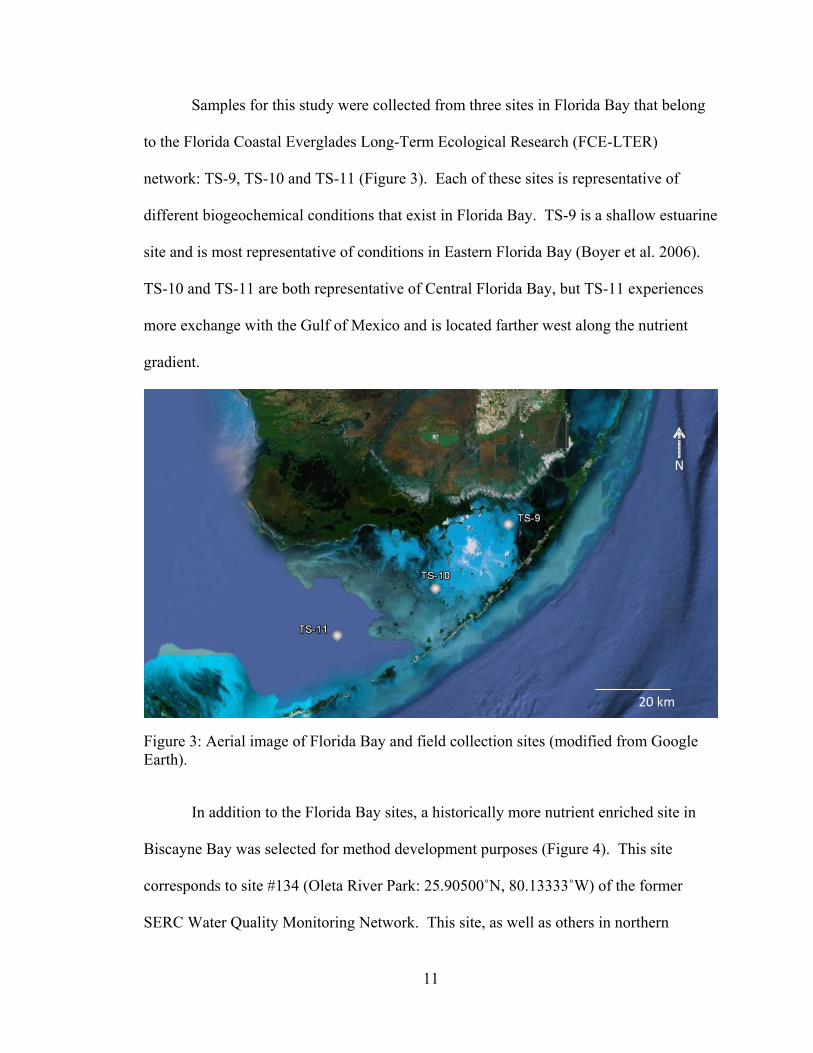
In addition to the Florida Bay sites, a historically more nutrient enriched site in
Biscayne Bay was selected for method development purposes (Figure 4). This site
corresponds to site #134 (Oleta River Park: 25.90500˚N, 80.13333˚W) of the former
SERC Water Quality Monitoring Network. This site, as well as others in northern
20 km
N

12
Biscayne Bay, has been previously characterized as having elevated total P (up to 0.18
mg L−1), high chlorophyll a (0.96 μg L−1) , and low DO (<4ppm) in comparison to the
rest of the Bay. These conditions have been attributed to nutrient input from canals,
surrounding urban land use, and possible influence from the Munisport landfill (Caccia
and Boyer 2005, Caccia and Boyer 2007). As a consequence of the mesotrophic nature
of the site, changes in DO should be detectable over relatively short incubation times.
Therefore, water samples collected from this site were expected to have matching
bacterial respiration values whether measured by DO consumption or through 13C
respiration assays.
Figure 4: Aerial image of northern Biscayne Bay and the Oleta River Park sampling site (modified from Google Earth).
13
2.2 Sample Collection
Initial samples for this study were collected on May 23, 2013 from the Biscayne
Bay site starting at 9:50 AM. Thirty two samples for 13C-DIC analysis and twelve
samples for DO analysis were collected. All samples collected during the initial
sampling event were unfiltered, allowing the detection of maximum community
respiration. Dissolved oxygen samples were collected first via peristaltic pump (E/S
Environmental Sampler) from a depth of approximately 0.3 m into 1 liter amber narrow-
mouth HDPE bottles. Bottles were rinsed three times with sample water then gently
filled from the bottom to prevent introduction of atmospheric O2 into the sample. Sample
bottles were permitted to overflow by approximately one bottle volume before tubing was
removed. The DO bottles were then sealed without headspace with parafilm (as a
secondary gas barrier), capped (as a primary gas barrier), and placed into a box.
Three of the DO samples were collected directly into 125 ml glass flasks for
initial measurements (t0 = 0 h). Flasks were also filled from the bottom via silicone
tubing until the flask overflowed. One ml of 3 M manganous chloride solution and 1 ml
of 4 M sodium iodate/8 M sodium hydroxide solution were then added to the flasks
(Carpenter 1966, Friederich et al. 1991). The flasks were then capped with glass stoppers
and inverted several times until a precipitate was distributed throughout each sample. At
8, 12, and 24 h after collection (initiation of dark incubations), water was transferred via
peristaltic pump from the amber bottles into 125 ml glass flasks. The procedure
described for the initial samples (t0 = 0 h) was repeated for the 8, 12 and 24 h DO
samples.
14
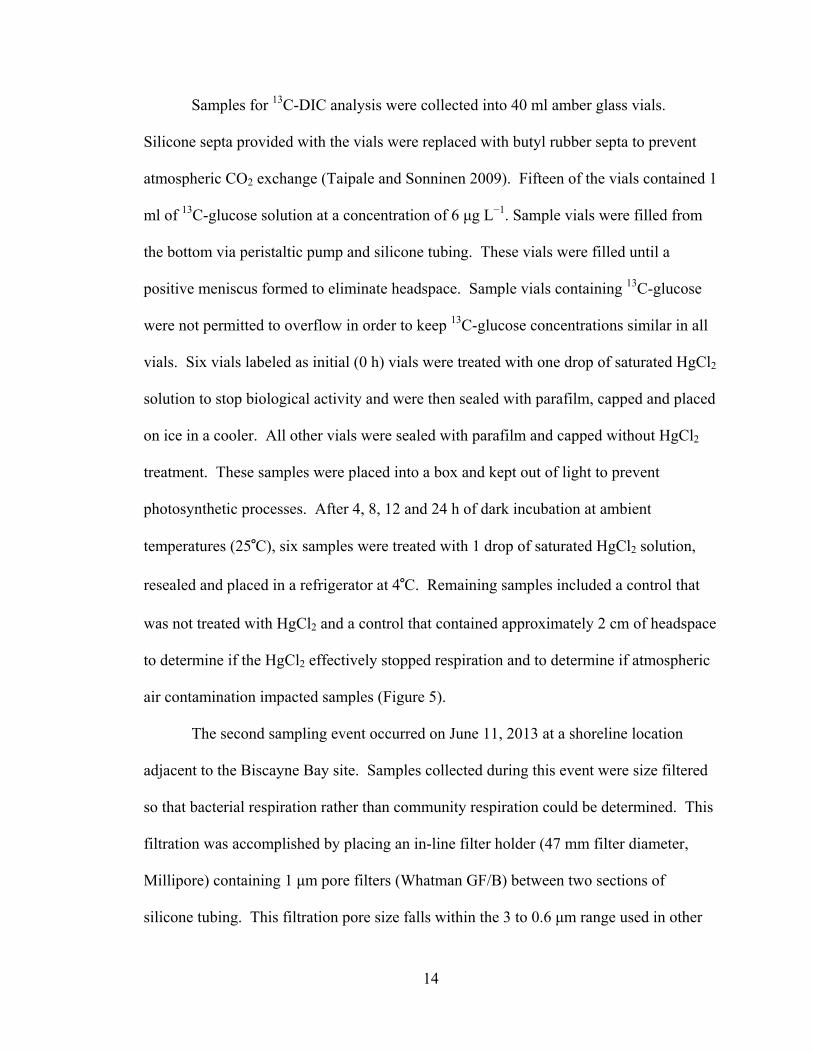
Samples for 13C-DIC analysis were collected into 40 ml amber glass vials.
Silicone septa provided with the vials were replaced with butyl rubber septa to prevent
atmospheric CO2 exchange (Taipale and Sonninen 2009). Fifteen of the vials contained 1
ml of 13C-glucose solution at a concentration of 6 μg L−1. Sample vials were filled from
the bottom via peristaltic pump and silicone tubing. These vials were filled until a
positive meniscus formed to eliminate headspace. Sample vials containing 13C-glucose
were not permitted to overflow in order to keep 13C-glucose concentrations similar in all
vials. Six vials labeled as initial (0 h) vials were treated with one drop of saturated HgCl2
solution to stop biological activity and were then sealed with parafilm, capped and placed
on ice in a cooler. All other vials were sealed with parafilm and capped without HgCl2
treatment. These samples were placed into a box and kept out of light to prevent
photosynthetic processes. After 4, 8, 12 and 24 h of dark incubation at ambient
temperatures (25°C), six samples were treated with 1 drop of saturated HgCl2 solution,
resealed and placed in a refrigerator at 4°C. Remaining samples included a control that
was not treated with HgCl2 and a control that contained approximately 2 cm of headspace
to determine if the HgCl2 effectively stopped respiration and to determine if atmospheric
air contamination impacted samples (Figure 5).
The second sampling event occurred on June 11, 2013 at a shoreline location
adjacent to the Biscayne Bay site. Samples collected during this event were size filtered
so that bacterial respiration rather than community respiration could be determined. This
filtration was accomplished by placing an in-line filter holder (47 mm filter diameter,
Millipore) containing 1 μm pore filters (Whatman GF/B) between two sections of
silicone tubing. This filtration pore size falls within the 3 to 0.6 μm range used in other

15
BGE studies to separate bacteria from larger organisms (Aranguren-Gassis 2012). All
other sample treatments remained identical to the initial collection event. Incubation
times were changed to 24, 48 and 72 hours for both δ13C-DIC and DO samples after a
review of previous results.
The third sampling event occurred on June 26, 2013 at the TS-9 site in Florida
Bay. Samples were size filtered as previously described. Incubation times were reduced
to 12, 24 and 48 hours after analysis of June 11th results. The overall goal of the third
sampling event was to determine the shortest incubation time that yielded significant
results for oligotrophic Florida Bay samples. The fourth sampling event occurred on July
24th, 2013 and involved sample collection from all 3 Florida Bay sites. Initial samples
and samples for 24 hour incubations were collected at each site.
During all sampling events, salinity and water temperature were measured for
water density calculations and for use as general environmental parameters. An
additional 1 liter water sample was collected during all sampling events for BP and
bacterial abundance (BA) measurements. The bottles for BP/BA analysis were rinsed
three times, filled via peristaltic pump, and placed on ice in a cooler.

16
Figure 5: Process diagram showing sample collection scheme and sample treatments.

17
2.3 Sample Analysis
The DO samples were analyzed using an automated Winkler titration system
(modified from Friederich et al. 1991). Within one week of sample collection, flasks
were opened and treated with 1 ml of 5 M sulfuric acid. Sodium thiosulfate solution
(0.14N) was then titrated into each sample, and the endpoint of each titration was
detected via amperometric methods. Values were initially reported in μmol O2 kg−1 H2O
and were converted into μg C respired L−1 using water density calculations and a
respiration quotient of 1 for conversion of O2 consumed to CO2 produced (del Giorgio
and Cole 1998).
Samples collected for δ13C-DIC measurements were analyzed using a Gas Bench
II coupled to a Thermo Delta V GC-IRMS at the University of Miami Stable Isotope
Laboratory (modified from Torres et al. 2005). Excess acid was added to each sample,
allowing CO2 to accumulate in a headspace purged with helium above each sample. The
accumulated CO2 was then processed by the GC-IRMS. δ13C values produced by the
GC-IRMS were reported in reference to the Vienna Peedee Belemnite (VPDB) standard.
δ13C-DIC values were further analyzed and converted into μg C respired. First,
δ13C values were converted into atom percent 13C via the following equation:
atom % = 100 × AR × (δ13C/1000 + 1)/ 1 + AR × (δ13C/1000 + 1)
in which AR is the absolute molar ratio of 13C to 12C (0.0111796). Next, peak amplitudes
measured by GC-IRMS for 12CO2 were converted into parts per million by plotting a
linear regression between standards of known DIC concentration prepared for each
sample run and measured peak amplitudes. The equation produced by the linear
regression was then applied to convert peak amplitudes for each sample into 12C-DIC

18
ppm. The resulting values were then multiplied by atom % 13C and ultimately converted
to μg C L−1.
Both bacterial abundance (BA) and bacterial production (BP) were determined
using methods described by Boyer et al. (2006). Bacterial abundance assays were
performed using the DAPI staining technique (Coleman 1980, Porter and Feig 1980).
Samples were fixed by treating 10 ml of unfiltered water with 2 ml of 20% formalin
solution. After storage, samples were incubated for 20 minutes in dark conditions with
DAPI stain at a final concentration of 25 μg ml−1. These samples were then filtered onto
black 0.2 μm polycarbonate filters and subsequently mounted onto slides. The slides
were examined with an epifluorescence microscope illuminated with a 100 W Hg bulb.
The number of fluorescent bacteria within 10 different sampling fields of a known size
per slide were counted. BA as cells ml−1 was then determined through use of the
following formula:
BA = (filtration area/field area)*N/D
in which N is the total number of cells counted divided by the number of fields, and D is
the volume of sample stained divided by the total volume of sample available.
Bacterial production was measured in unfiltered water samples via 3H-thymidine
incorporation incubations (Bell 1993, Boyer et al. 2006). In summary, 10 ml triplicates
of each sample were placed into 50 ml centrifuge tubes in addition to a 4% formalin
blank sample. Samples were then treated with 100 μl of 3H-thymidine solution and
incubated for 1 hour. After incubation, samples were filtered, dried overnight, and
treated with 10 ml of scintillation cocktail. Samples were then placed into a liquid

19
scintillation counter. Disintegrations per minute (dpm) were converted into moles
thymidine L−1 hr−1 using the following equation:
Moles thymidine L−1 hr−1 = [(dpmsample – dpmblank)(C)/SA × t × v] × 10−3 × f
in which C is the number of curies per dpm, SA is the specific activity of the 3H-
thymidine solution, t is the incubation time in hours, v is the filtered volume in liters, and
f is a correction factor for addition of formaldehyde.
The result of the preceding equation was then converted into μg C L−1 hr−1 using
the following formula:
μg C L−1 hr−1 = (moles thymidine L−1 hr−1) × (2×1018) × (1×10−14)
in which 2×10¹⁸ is the number of cells per mole thymidine and 1×10⁻¹⁴ is the number of
grams C per cell.
2.4 Statistical Methods
One way analysis of variance (ANOVA) was used to determine whether BR
results were significantly different among incubation times for each sampling event, with
significance set at p < 0.05. Sets of incubation times that were found to be significantly
different were then analyzed by Tukey’s post hoc test to determine which pairs of
incubation times were significantly different from each other. Welch’s t-test was also
used to compare pairs of incubation times with unequal variance among replicates.
Incubation time averages, as well as BP results, were graphed with error bars
representing a one sigma error unless otherwise noted. Tests of statistical significance
were not used for salinity, water temperature, and BA.

20
3. RESULTS
3.1 Environmental Parameters
As a result of the shallow estuarine nature of the study sites, salinity and water
temperature varied between sampling events (Table 1). Salinity ranged from 17.0 to 34.7
practical salinity units, with the lowest salinity measured during the June 11th Biscayne
Bay sampling event and the highest measured at TS-10 on July 24th. Water temperature
ranged from 27.3°C on May 23rd in Biscayne Bay to 30.7°C on July 24th at TS-10. Light
rainfall occurred during the June 11th sampling event, while all other sampling occurred
under dry, sunny conditions. Salinity on June 11th was likely impacted by a tropical
storm that left up to 13 inches of rain in localized parts of northern Miami-Dade County
on June 7th (Rainfall data from S29, South Florida Water Management District).
Table 1: Salinity and water temperature during each sampling event
Sampling Location
Sampling Date Sampling
Time Salinity
Water Temperature (°C)
Biscayne Bay-1 May 23, 2013 9:55 AM 27 27.3
Biscayne Bay-2 June 11, 2013 11:50 AM 17 28.4
TS-9 June 26, 2013 10:00 AM 33.4 28.9
TS-9 July 24, 2013 9:25 AM 21.1 29.2
TS-10 July 24, 2013 10:40 AM 34.7 30.7
TS-11 July 24, 2013 12:05 PM 34.6 30.3

21
3.2 Bacterial Abundance and Bacterial Production
BA ranged from 4.7 to 9.5 × 10⁶ cells ml−1 (Table 2). The highest counts were
observed on June 11th in Biscayne Bay, while the lowest valid counts were observed on
July 24th at TS-9. The May 23rd counts fell below 300 cells per 10 visual fields
(estimated total of 1.8 × 10⁶ cells ml−1); thus, these results are not valid (Boyer et al.
2006) and are not considered with the rest of the data set.
Table 2: Bacterial abundance at each sampling site
Sampling Location Sampling Date Bacterial Abundance (cells ml-1)
Biscayne Bay-1 May 23, 2013 1.68E+06
Biscayne Bay-2 June 11, 2013 9.49E+06
TS-9 June 26, 2013 5.69E+06
TS-9 July 24, 2013 4.72E+06
TS-10 July 24, 2013 4.80E+06
TS-11 July 24, 2013 4.94E+06
Bacterial production triplicate measurements for each sampling event were
averaged without removing values that fell below the blank dpm measurement. Average
BP measurements for Biscayne Bay on May 23rd were below zero. This is a common
result when BP is below method detection and does not truly denote negative production.
The remaining BP averages ranged from 0.29 to 45.22 μg C L−1 day−1. The highest
average was observed on June 11th in Biscayne Bay and was an order of magnitude
higher than all other averages. The two lowest averages, observed at TS-9 on June 26th

22
and TS-10 on July 24th, include triplicate values below the blank dpm measurement
(Figure 6).
Figure 6: Average bacterial production values for each sampling event.
3.3 Bacterial Respiration
Dissolved oxygen levels measured by Winkler titrations were expected to
decrease with increasing incubation time. During every sampling event, however, DO
levels and corresponding C production calculations showed no statistically valid
relationship with incubation length. DO levels measured for the first sampling event
ranged from 185.6 to 199.5 μmol O2 kg−1 H2O. During the first sampling event, DO
levels at each incubation length were found to not significantly differ from each other

23
(ANOVA, p = 0.39). After DO values were converted to C respired over time, a
significant correlation between incubation length and carbon increase was not found
(Pearson r = 0.75, p = 0.18, Figure 7).
Figure 7: Carbon respired over time measured by Winkler titration for Sampling Event 1.
High replicate sample variability affected June 11th DO results. DO levels
measured for the June 11th sampling event ranged from 171.5 to 193.7 μmol O2 kg−1 H2O.
When converted to C respired over time, a significant negative correlation was found
between incubation time and C concentration (r = −0.89, p = 0.049, Figure 8). Because
this correlation was negative rather than positive, respiration of carbon cannot be
determined from this data set. Although the correlation seems to indicate that DO
concentrations increased during the incubation, DO values for each incubation time were
found to not significantly differ from each other (ANOVA, p = 0.73).

24
Figure 8: Carbon respired over time measured by Winkler titration for samples collected on June 11th, 2013 (Sampling Event 2).
Winkler titration results for June 26th were also not reliable for determination of C
respiration. Raw DO values ranged from 183.6 to 194.8 μmol O2 kg−1 H2O. Unlike
Winkler titration data from May 23rd and June 11th, significant differences were found
between incubation times (ANOVA, p = 0.03). Post-hoc analysis indicated that only the
12 hour and 48 hour O2 concentrations were significantly different. Similar to the June
11th results, a negative correlation was found between carbon concentration and
incubation time (Figure 9). This negative correlation, however, was statically
insignificant (r = −0.81, p = 0.13), indicating replicate sample variability may have
produced a false decreasing trend.

25
Figure 9: Carbon respired over time measured by Winkler titration for samples collected on June 26th, 2013 (Sampling Event 3).
Samples collected on July 24th had an overall higher range of initial and final DO
concentrations. The highest DO concentrations were observed at TS-10 (221.5 to 234.1
μmol kg−1), while the lowest overall concentrations were observed at TS-11 (187.2 to
211.9 μmol O2 kg−1). Initial DO concentrations at each site showed high variability. The
average initial DO concentration at TS-9 was 217.3 ± 5.8 μmol O2 kg−1 (reported with
standard deviation), the average initial concentration at TS-10 was 229.9 ± 7.3 μmol O2
kg−1, and the average initial concentration at TS-11 was 196.9 ± 13.2 μmol O2 kg−1. A
series of one-tailed Welch’s t-tests performed on the DO concentrations at each site
indicated that there were no significant differences between initial DO concentrations and
final DO concentrations (p = 0.11, 0.15, 0.41 for TS-9, TS-10 and TS-11, respectively).
Although the difference between the initial and final DO values was not statistically
significant, BR was still estimated for each site after conversion of O2 consumed to C

26
produced (Figure 10). Results calculated from this conversion were 69.5 μg C L−1 day−1
for TS-9, 71.7 μg C L−1 day−1 for TS-10, and 23.5 μg C L−1 day−1 for TS-11.
Figure 10: Carbon production determined by Winkler titration at TS-9, TS-10 and TS-11 on July 24th, 2013 (Sampling Event 4).
Use of 13C isotope ratios to determine BR produced better results overall than the
Winkler titration method. The labeled tracer method in comparison to the natural isotope
ratio method produced stronger changes in δ13C-DIC between incubation times. Clear
BR results, however, were not observed for May 23rd samples as a consequence of the
very low 13C-glucose concentrations added to these samples (1 ml of 6 μg L−1 13C glucose
solution). δ13C values for samples collected on May 23rd both before and after incubation
ranged from −3.67‰ to −3.04‰. The sample δ13C range did not differ from either the
air contamination control sample (δ13C = −3.32‰) or the live control sample (sample not
27
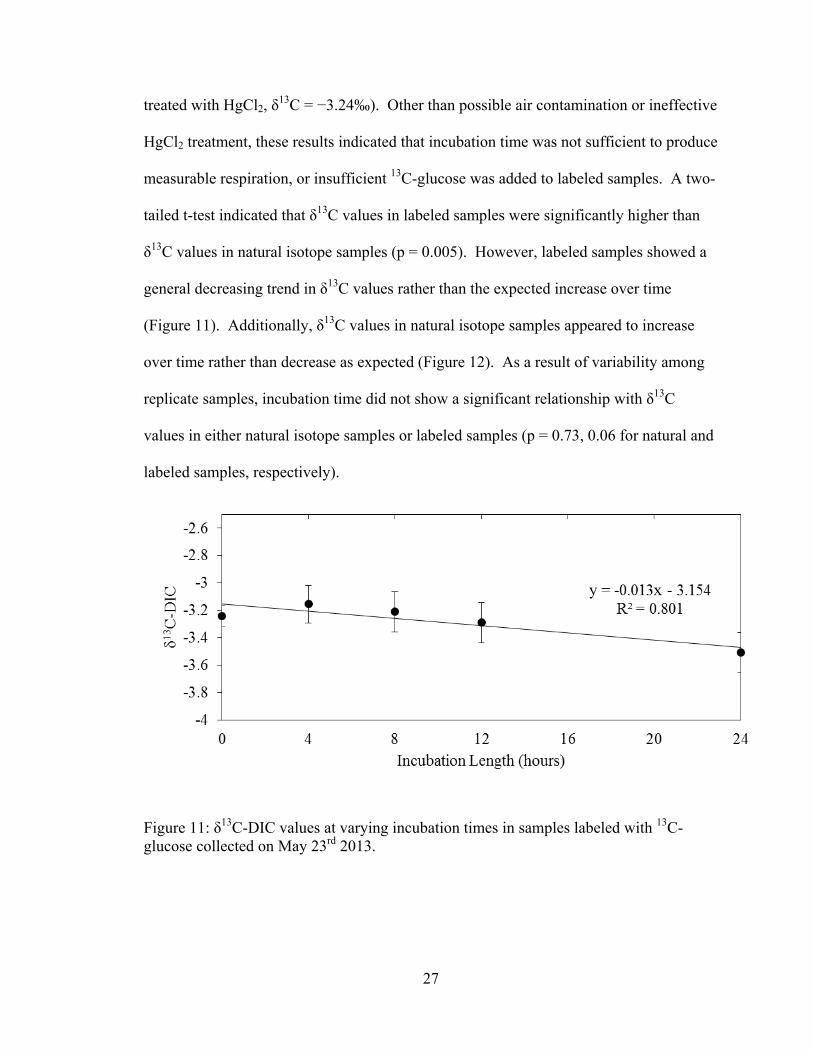
treated with HgCl2, δ13C = −3.24‰). Other than possible air contamination or ineffective
HgCl2 treatment, these results indicated that incubation time was not sufficient to produce
measurable respiration, or insufficient 13C-glucose was added to labeled samples. A two-
tailed t-test indicated that δ13C values in labeled samples were significantly higher than
δ13C values in natural isotope samples (p = 0.005). However, labeled samples showed a
general decreasing trend in δ13C values rather than the expected increase over time
(Figure 11). Additionally, δ13C values in natural isotope samples appeared to increase
over time rather than decrease as expected (Figure 12). As a result of variability among
replicate samples, incubation time did not show a significant relationship with δ13C
values in either natural isotope samples or labeled samples (p = 0.73, 0.06 for natural and
labeled samples, respectively).
Figure 11: δ13C-DIC values at varying incubation times in samples labeled with 13C-glucose collected on May 23rd 2013.

28
Figure 12: δ13C-DIC values at varying incubation times in unlabeled samples collected on May 23rd 2013.
Although May 23rd results showed a significant difference between labeled
samples and unlabeled samples, more 13C-glucose was added to June 11th labeled vials
with the intention of increasing signal to noise ratios and to ensure 13C-glucose was being
used as the primary bacterial food source. Concentration of 13C-glucose was increased to
0.6 mg L−1 in the stock 13C-glucose solution. 1 ml of the stock solution was then added
to each labeled vial before sample collection. Additionally, incubation times were
increased from a maximum of 24 hours to a maximum of 72 hours.
δ13C values observed in samples collected on June 11th showed stronger terrestrial
influence, with initial δ13C-DIC values ranging from −8.28‰ to −8.10‰ in both labeled
and unlabeled samples. As a result of the increased concentration of 13C-glucose as a
bacterial food source, a stronger correlation between incubation time and δ13C values was
observed, and statistical differences were found among differing incubation times

29
(ANOVA, p = 2.40 × 10⁻⁶). The most significant change in δ13C-DIC was observed
between the initial sample and the 24 hour labeled sample, with δ13C-DIC values
increasing from an average of −8.15‰ ± 0.08 to −4.32‰ ± 0.13 (Figure 13, q > qcritical).
The air contaminated control sample and the non-preserved sample also differed from the
24 hour labeled sample (air control δ13C = −7.78‰, live control δ13C = −8.52‰). Beyond
the 24 hour incubation point, δ13C-DIC values did not significantly increase (Tukey’s
HSD, q < qcritical for 24hr vs. 48 hr, 24hr vs. 72hr, 48hr vs. 72hr), indicating that
maximum biological uptake of 13C-glucose occurred at or before 24 hours (represented
by dotted line in Figure 13). Unlabeled samples showed a general decrease in δ13C-DIC
over time (Figure 14). However, this decreasing trend in δ13C-DIC was not statistically
significant (ANOVA, p = 0.09).
Figure 13: δ13C-DIC values at varying incubation times in labeled samples collected from Biscayne Bay on June 11th, 2013.

30
Figure 14: δ13C-DIC values at varying incubation times in unlabeled samples collected from Biscayne Bay on June 11th, 2013.
After examination of June 11th results, incubation times were shortened to a
maximum of 48 hours on June 26th. δ13C-DIC values in initial samples showed stronger
marine influence than Biscayne Bay samples, with δ13C-DIC values of −2.28‰ ± 0.18
and −2.30‰ ± 0.27 in unlabeled and labeled samples, respectively. Labeled samples
showed a strong correlation between δ13C-DIC values and incubation time (Figure 15).
δ13C-DIC values increased from −2.30‰ ± 0.27 to 7.46‰ ± 0.88 over the course of 48
hours. Significant differences were found among incubation times (ANOVA, p < 0.001),
and post-hoc analysis indicated δ13C-DIC values for each incubation time significantly
differed from all others. In unlabeled samples, a weak decrease in δ13C-DIC values was
observed (Figure 16). Although a high Pearson correlation coefficient was found (r =
−0.98), analysis of unlabeled sample results indicated that δ13C-DIC values for each

31
incubation time did not significantly differ from each other because of high replicate
sample variability (ANOVA, p = 0.55).
Figure 15: δ13C-DIC values at varying incubation times in labeled samples collected from Florida Bay site TS-9 on June 26th, 2013.
Figure 16: δ13C-DIC values at varying incubation times in unlabeled samples collected from Florida Bay site TS-9 on June 26th, 2013.

32
Initial δ13C-DIC values from samples collected on July 24th varied among sample
sites. TS-9 had initial δ13C-DIC values ranging from −3.52‰ to −3.33‰ in labeled and
unlabeled samples. δ13C-DIC initial values in TS-10 samples ranged from −1.44‰ to
−1.13‰, and initial δ13C-DIC values at TS-11 ranged from −1.89‰ to −1.42‰. Further
analysis indicated that all 3 sample sites had significantly different initial δ13C-DIC
values from each other (ANOVA, p = 8.89 × 10⁻¹⁴; Tukey’s HSD, q > qcritical for all site
combinations). In labeled samples incubated for 24 hours, δ13C-DIC increased for TS-9
and TS-11, but not for TS-10 (Figure 17). TS-11 showed the largest change in δ13C-DIC,
increasing from an average of −1.56‰ to +6.28‰ over the 24 hour incubation period.
Samples from TS-9 had a smaller increase from an average of −3.35‰ to −0.90‰.
Statistical analysis confirmed that the increases in δ13C-DIC over time at TS-9 and TS-11
were significant (Welch’s one-tailed t-test; TS-9, p = 0.03; TS-11, p = 0.01). Labeled
samples from TS-10, however, showed an apparent decrease in δ13C-DIC values over
time. The initial samples from TS-10 had an average δ13C-DIC value of −1.39‰, while
final samples had an average value of −1.43‰. Further analysis indicated that this
decrease was not significant (p = 0.11).

33
Figure 17: Changes in δ13C-DIC in incubated 13C-labeled samples collected from TS-9, TS-10, and TS-11 on July 24th, 2013.
Similar to samples collected on other dates, unlabeled samples from July 24th
overall did not considerably change in δ13C-DIC during the incubation period (Figure
18). In samples from TS-10, δ13C-DIC values decreased from −1.30‰ to −1.64‰. High
sample variance caused this apparent decrease to be statistically invalid (p = 0.11). In
samples from TS-11, δ13C-DIC values increased from an average of −1.60‰ to −1.56‰
during the incubation; again, this change was not supported statistically (p = 0.36). TS-9
samples, however, did undergo a significant decrease from −3.40‰ to −3.55‰ (p =
0.02).

34
Figure 18: Changes in δ13C-DIC in incubated unlabeled samples collected from TS-9, TS-10, and TS-11 on July 24th, 2013.
δ13C-DIC values were converted into μg C L−1 using a linear regression between
DIC standards and peak amplitudes measured by the GC-IRMS (Figure 19), as well as
additional calculations previously described in the methods section. Conversion of δ13C-
DIC to μg C L−1 generally weakened correlations with incubation time. This resulted
from highly variable peak amplitudes playing a larger role than δ13C values in
calculations. Significant differences between incubation times were not found for
unlabeled samples from May 23rd and June 26th (p = 0.35, 0.20) or for labeled samples
from June 11th (p = 0.45). A significant difference among incubation times was found for
labeled May 23rd samples (p = 0.02). However, an apparent decrease in μg C L−1
occurred rather than an increase over time (Figure 20). Similar results were found for
unlabeled June 11th samples. Although differences were found between 24 hour and 48
hour samples (p = 0.02, q > qcritical), calculated C concentrations decreased from an

35
average of 532 to an average of 393 μg C L−1 during those hours. A significant
difference was also found between initial and 48 hour samples for June 26th samples (p =
0.03, q > qcritical). Although this significant difference was found, the relationship
between μg C L−1 and incubation time on June 26th (r = 0.82, Figure 21) was much
weaker than the relationship previously shown between unconverted δ13C and incubation
time (r = 0.99).

36
Figure 19: Linear regression between mass 44 peak amplitude measured via GC-IRMS and DIC measured in parts per million for each sampling event. Graph A was generated for May 23rd data, graph B for June 11th data, graph C for June 26th data and graph D for July 24th data.
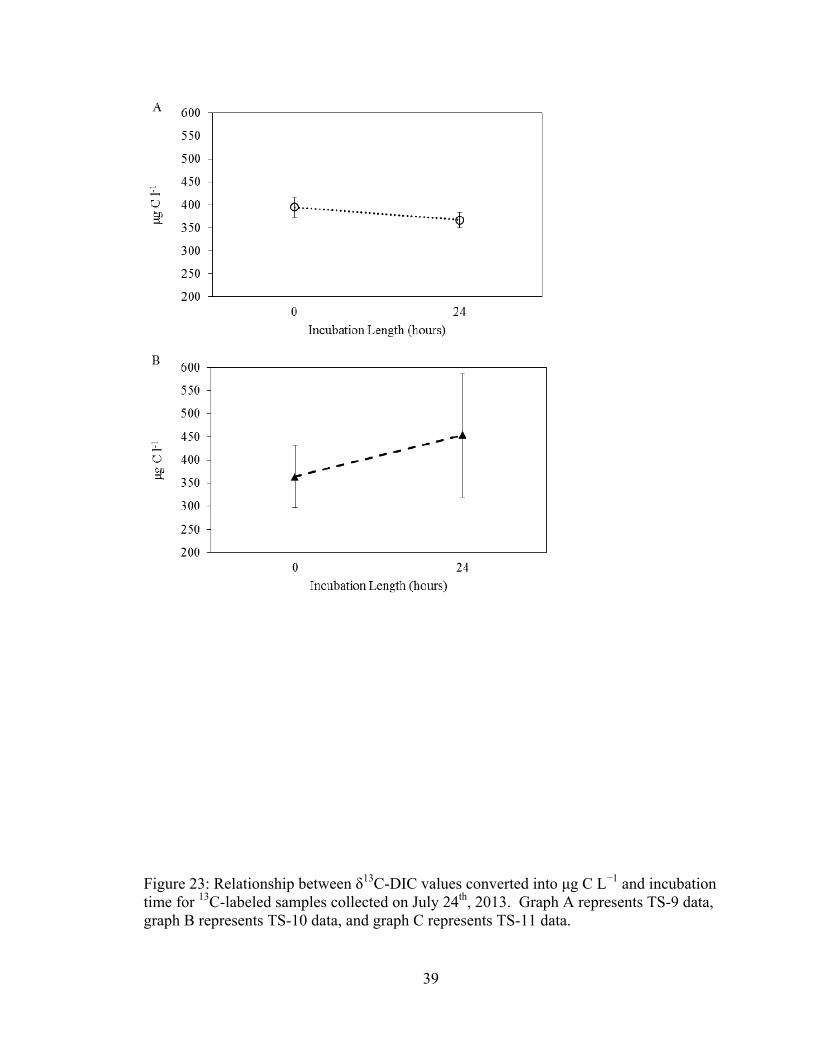
Conversion from δ13C-DIC to μg C L−1 also weakened trends observed for July
24th samples (Figure 22, Figure 23). Although significant changes in δ13C-DIC were
found for labeled TS-9 and TS-11 samples, no significant change was observed during
incubation for all three sites when data were converted to μg C L−1 (p = 0.15, 0.09 and

37
0.18 for TS-9, TS-10 and TS-11, respectively). Significant changes were also not
observed for unlabeled samples collected on July 24th after data conversion to μg C L−1 (p
= 0.12, 0.16 and 0.11 for TS-9, TS-10 and TS-11, respectively).
Figure 20: Relationship between δ13C-DIC values converted into μg C L−1 and incubation time for samples collected on May 23rd, 2013.
Figure 21: Relationship between δ13C-DIC values converted into μg C L−1 and incubation time for samples collected on June 26th, 2013.

38
Figure 22: Relationship between δ13C-DIC values converted into μg C L−1 and incubation time for unlabeled samples collected on July 24th, 2013. Graph A represents TS-9 data, graph B represents TS-10 data, and graph C represents TS-11 data.
39
Figure 23: Relationship between δ13C-DIC values converted into μg C L−1 and incubation time for 13C-labeled samples collected on July 24th, 2013. Graph A represents TS-9 data, graph B represents TS-10 data, and graph C represents TS-11 data.

40
Respiration rates calculated from both Winkler titrations and δ13C-DIC were used
to create estimates of baseline bacterial growth efficiency for each sampling site and
location (Table 3). As reviewed previously, a large portion of the BR results were
negative because of calculated decreases in DIC rather than increases expected during the
respiration process (these are represented as <0.001 in Table 3). Additionally, conversion
of raw respiration data to μg C L−1 resulted in labeled TS-9 results from June being the
only statistically significant positive result. Although data conversion weakened
statistical significance of the results, general trends can still be noted in relation to the
raw data. For example, raw labeled 13C-DIC results for TS-9 and TS-11 in July were
statistically significant. Respiration calculated from the labeled 13C method as well as BP
were higher at TS-11 than TS-9. When BGE is calculated from these results, TS-11
shows a higher BGE (0.108) than TS-9 (<0.001). The same relationship is observed in
BGE calculations from the traditional Winkler titration method (BGE TS-9 = 0.039, BGE
TS-11 = 0.258).
Table 3: Bacterial production, bacterial respiration (in ug C L−1 hr−1) and bacterial growth efficiency calculations for all sampling events. Asterisks represent statistically signficant differences during incubation after conversion of raw data to μg C L−1.
Sampling Location
BP BR
Unlabeled 13C
BR Labeled
13C
BR Winkler
BGE Unlabeled
13C
BGE Labeled
13C
BGE Winkler
Biscayne Bay 1
<0.001 2.440 <0.001* 2.960 <0.001 0.001 <0.001
Biscayne Bay 2
1.884 0.090 <0.001* <0.001 0.954 ≥1.000 ≥1.000
TS-9 (June) 0.012 <0.001 1.325* <0.001* <0.001 0.009 <0.001 TS-9 (July) 0.118 <0.001 <0.001* 2.890 <0.001 <0.001 0.039 TS-10 (July) 0.029 <0.001 3.738 2.990 <0.001 0.008 0.010 TS-11 (July) 0.340 <0.001 2.795 0.980 <0.001 0.108 0.258
41
4. DISCUSSION
Previous characterization of BA, BP, BR and BGE in Florida Bay is highly
limited. Bacterial abundance and BP have been examined by Boyer et al. (2006) at TS-9
and TS-10. Data from that study were gathered monthly between July 2001 and July
2002. Median BA values reported in the Boyer et al. (2006) study at TS-9 and TS-10
were 2 × 10⁶ cells ml−1 and 3 × 10⁶ cells ml−1, respectively. Bacterial abundance values
in Florida Bay produced from the current study range from 4.7 to 5.7 × 10⁶ cells ml−1.
Though these results are higher than median values reported by Boyer et al. (2006), these
values are still within range of the range of BA reported in the previous study. July 2013
BA results were similar across all three Florida Bay sites (4.7 to 4.9 × 10⁶ cells ml−1) and
were higher at TS-9 in June (5.7 × 10⁶ cells ml−1), suggesting that temporal variation
rather than spatial variation was an influence on BA in the current study.
Bacterial production was also examined in the Boyer et al. (2006) study at TS-9
and TS-10. The BP median was approximately 1 μg C L day-1 at TS-9, while the median
at TS-10 was approximately 0.75 μg C L day-1. Average BP values in the current study
were 0.29 μg C L day-1 in June at TS-9, 2.84 μg C L day-1 in July at TS-9, 0.70 in July at
TS-10, and 8.16 μg C L day-1 in July at TS-11. Results from July in the current study
show TS-9 having a higher BP rate than TS-10, similar to results in the Boyer et al.
(2006) study. June TS-9 results, however, were lower than those found at TS-10. These
BP results suggest that seasonal variation, such as incoming Everglades runoff at TS-9
during the wet season, may impact microbial parameters. Additionally, comparatively
higher BP results at TS-11 suggest that BP may also be influenced by nutrient limitation
gradients.

42
The challenge of measuring BR in oligotrophic environments has limited BR
research in Florida Bay. Budgen et al. (1998) examined heterotrophic activity through
bacterial 14CO2 uptake and respiration. Bugden et al. (1998) found that heterotrophic
activity was generally higher in western Florida Bay (0.5 μg C h-1) than in eastern Florida
Bay (0.25 μg C h-1). The Bugden et al. (1998) study linked differences in heterotrophic
activity among sample sites to seagrass health rather than nutrient limitation status. Clear
BR differences among sites were not apparent in the current study as a result of
methodological challenges. Bacterial respiration calculations using all three methods
ranged from negative to 2.89 μg C h-1 at TS-9, negative to 3.74 μg C h-1 at TS-10, and
negative to 2.80 μg C h-1 at TS-11. Raw δ13C-DIC data, however, suggest that respiration
may be highest at TS-11. TS-11 showed the greatest change in δ13C in 13C-labeled
samples (−1.56‰ to +6.28‰) in comparison to TS-9 and TS-10 in July. Although
Winkler titration data suggests that TS-11 had the lowest BR among the Florida Bay
sites, the Winkler titration results from all three sites were found to be nonsignificant.
The 13C-labeling method of measuring BR may be a viable alternative to Winkler
titrations on the basis of strong correlations between δ13C-DIC and incubation time.
Conversion of δ13C-DIC to μg C L−1 using the methods previously described weakened
correlations. In future studies employing δ13C-DIC as a way to measure BR, a more
complete tracing of carbon pathways could result in better correlations. For example,
both DIC and DOC concentrations could be measured, in addition to δ13C-DIC and δ13C-
DOC measurements using GC-IRMS. Additionally, more work will be needed for
applying the method to eutrophic systems. BR results from June 11th suggest that a
shorter incubation length is needed in mesotrophic and eutrophic systems in order to

43
observe a linear uptake of 13C-glucose. Although a significant change in δ13C-DIC was
observed between 0 and 24 hours of incubation during the June 11th sampling event,
respiration of consumed 13C-glucose may have plateaued before 24 hours of incubation.
Thus, inclusion of shorter incubation times in these environments may produce better
data to describe BR.
Typical values for BGE in the literature range from 0.01 to 0.50, with a maximum
literature value of 5 (del Giorgio and Cole 1998). When excluding negative BGE
calculations, most the results from this study fall into the low range when compared to
literature values. The resulting BGE calculations matched overall expectations of low
BGE being present in historically low nutrient environments.
Evidence of terrestrial runoff impacting microbial results is present in the current
data set and is supported by previous studies. Previous work has shown that freshwater
runoff into estuaries lowers both salinity and δ13C-DIC values (Mook and Tan 1991, Fry
2002, Atekwana et al. 2003). Additionally, previous studies have also indicated that
terrestrial runoff can impact bacterial parameters. Cotner et al. (2000) found that site
proximity in Florida Bay to Everglades runoff can influence BP and also found that BP is
up to an order of magnitude higher during the wet season than during the dry season.
Lavrentyev et al. (1998) found that nutrient input and freshwater inflow in Florida Bay
impacted microbial community structure, resulting in three distinct microbial community
structures dependent upon location within Florida Bay. In the current data set, impacts of
terrestrial runoff may be present in June Biscayne Bay samples and July TS-9 samples.
June Biscayne Bay samples had lower salinity (17 psu) and lower initial δ13C-DIC values
(−8.28‰ to −8.10‰) than all other samples collected. The June Biscayne Bay samples

44
also had the highest BP and BA values. Although May Biscayne Bay samples had BP
and BR results more similar to oligotrophic Florida Bay samples, differences between
May and June samples can be attributed to minor differences in sampling location (center
of navigation channel in May vs. shoreline location in June) and rainfall influence (recent
tropical storm for June samples). Similar comparisons can be made between June TS-9
and July TS-9 samples. June TS-9 samples had a higher salinity (33.4 psu) and higher
initial δ13C-DIC values (−2.45‰ to −2.48‰) than July TS-9 samples (21.1 psu, −3.52‰
to −3.33‰), indicating July TS-9 samples may have been influenced by freshwater input.
July TS-9 samples also had higher BP rates, though BA was higher in June at TS-9 than
in July. Stronger similarities were present between June TS-9 and July TS-10 results,
particularly in regard to salinity (33.4 vs. 34.7) and BP rates (0.012 vs. 0.029 μg C L−1
h−1). These comparisons suggest that freshwater influence at TS-9 increased in July after
the start of the wet season. Although the Florida Bay sampling events were separated by
only one month, potential seasonal influences are present in the data.
5. CONCLUSION
The results of this study indicated that tracing of 13C may serve as a better method
of measuring BR in oligotrophic systems than traditional Winkler titration-based DO
consumption measurements. The original hypothesis that the Winkler titration method
could be used in a mesotrophic environment to calibrate the 13C-based methods was
incorrect. In both Florida Bay and Biscayne Bay, changes in DO before and after dark
incubation were found to be either insignificant or highly variable, making the Winkler
titration an invalid method of determining BR in these environments. Bacterial
45
abundance and BP results indicated that Biscayne Bay was a higher productivity site than
the Florida Bay sites; however, BR was still not measureable by Winkler titration. In
future studies, the labeled and natural 13C BR methods can be compared to BR measured
by Winkler titration in a more eutrophic environment.
In comparison to the tracing of natural 13C ratios, the 13C-glucose consumption
method, also referred to as the 13C labeling method, produced better BR results. Changes
in natural δ13C-DIC ratios before and after dark incubation were largely insignificant
throughout the study. Samples spiked with 13C-glucose, however, produced strong
correlations between δ13C-DIC and incubation time during 3 of the 4 sampling events.
While the tracing of natural 13C ratios would have been more ideal for determining
realistic BR values on the basis of bacterial consumption of natural DOC sources, the
correlations produced by this method were too weak to be used reliably for BR
measurements.
The correlations produced by the labeled 13C method suggest that this method
could be used to measure BR and BGE in oligotrophic systems. When δ13C-DIC values
were converted into μg C respired, correlations were greatly weakened. Peak amplitudes
measured by GC-IRMS were used to produce DIC concentrations during this conversion.
While concentrations of DIC can be produced from GC-IRMS data, future studies could
use more specialized instrumentation specifically designed for DIC and DOC
measurements, such as a total organic carbon analyzer. In order to address potential
concerns about isotopic dilution, future experiments can also examine 13C-glucose
additions at varying concentrations, similar to methods used in radiotracer studies (Simon

46
and Azam 1989). These additional measurements may refine bacterial energy pathways
and improve conversion of δ13C-DIC into respiration values.
This study was designed to measure BR, BGE and other carbon pathways
specifically within the Florida Bay ecosystem. Beyond determination of Florida Bay
carbon cycling components, the 13C tracing method may be a way to determine BR and
BGE in other environments where these measurements are difficult to make, such as low-
productivity pelagic marine environments. Currently, techniques are being developed to
measure δ13C-DIC using lower cost and more portable cavity ring-down mass
spectroscopy (CRDS) systems (Hartland et al. 2012). While GC-IRMS would be
impractical to utilize in field studies, CRDS has the potential to be used outside of
traditional laboratories. The GC-IRMS method described in this study can ultimately be
adapted to CRDS systems, allowing a field-based alternative to traditional techniques of
quantifying microbial respiration in open oceanic waters.
The BR methodologies described in this study will need further refinement before
reliable BGE values can be calculated from Florida Bay. Overall, data gathered in this
study suggest that BGE is lower in highly nutrient limited Eastern Florida Bay than in
Western Florida Bay. Further application of the methods described in this study can be
used to explore other factors in Florida Bay that could affect BGE. Differences between
June and July results suggest that seasonal variation, particularly in relation to water input
from the Everglades, could impact BR, BP and BGE in Florida Bay. Additional long-
term studies could explore the influence of this potential variable on BGE. Further
laboratory and mesocosm studies could isolate other variables that may impact Florida
Bay BGE, such as salinity and nutrient concentrations. With the addition of these

47
suggested long-term BGE studies, the role of Florida Bay water column microbes can be
better understood in relation to carbon cycles in Florida Bay and the southern Everglades.
Because the southern Everglades and Florida Bay may serve as an important carbon sink,
further assessment of BGE throughout this system is warranted.

48
REFERENCES Apple, J.K., and P.A. del Giorgio. 2007. Organic substrate quality as the link between
bacterioplankton carbon demand and growth efficiency in a temperate salt-marsh estuary. ISME Journal 1(8): 1-14.
Aranguren-Gassis, M., E. Teira, P. Serret, S. Martinez-Garcia, and E. Fernandez. 2012.
Potential overestimation of bacterial respiration rates in oligotrophic plankton communities. Mar. Ecol. Prog. Ser. 453: 1-10.
Arrigo, K. 2005. Marine microorganisms and global nutrient cycles. Nature 437: 349-
355. Atekwana, E.A., L.P. Tedesco, and L.R. Jackson. 2003. Dissolved inorganic carbon
(DIC) and hydrologic mixing in a subtropical marine estuary, Southwest Florida, USA. Estuaries 26(6): 1391-1400.
Azam, F., T. Fenchel, J.G. Field, J.S. Gray, L.A. Meyer-Reil, and F. Thingstad. 1983.
The ecological role of water-column microbes in the sea. Mar. Ecol. Prog. Ser. 10: 257-263.
Bell, R.T. 1993. Estimating production of heterotrophic bacterio-plankton via
incorporation of tritiated thymidine, pp. 495-503. In P.F. Kemp, B.F. Sherr, E.B. Sherr and J.J. Cole (Eds.), Handbook of Methods in Aquatic Microbial Ecology. Lewis Publishers.
Biddanda, B., S. Opsahl, and R. Benner. 1994. Plankton respiration and carbon flux
through bacterioplankton. Limnol. Oceanogr. 39: 1259-1275. Bjørnsen, P.K. 1986. Bacterioplankton growth yield in continuous seawater cultures.
Mar. Ecol. Prog. Ser. 30: 191-196. Bouillon, S. 2011. Carbon cycle: Storage beneath mangroves. Nat. Geosci. 4: 282-283. Boyer, J.N., J.W. Fourqurean and R.D. Jones. 1997. Spatial characterization of water of
water quality in Florida Bay and Whitewater Bay by multivariate analyses: Zones of similar influence. Estuaries 20: 743-758.
Boyer, J.N., and R.D. Jones. 2001. Long-term trends in water quality of Florida Bay
(June 1989-June 1999) pp 64-66. In 2001 Florida Bay Science Conference. (Abstract).
Boyer, J.N., S.K. Dailey, P.J. Gibson, M.T. Rodgers, and D. Mir-Gonzalez. 2006. The
role of dissolved organic matter bioavailability in promoting phytoplankton blooms in Florida Bay. Hydrobiologia 569: 71-85.
49
Bugden, J.B., M.A. Guerrero, and R.D. Jones. 1998. Spatial and temporal variation of
marine bacterioplankton in Florida Bay, USA. J. Coastal Res. 14(4): 1304-1313. Carpenter, J.H. 1965. The Chesapeake Bay Institute technique for the Winkler dissolved
oxygen method. Limnol. Oceanogr. 10(1): 141-143. Caccia, V.G., and J.N. Boyer. 2005. Spatial patterning of water quality in Biscayne
Bay, Florida as a function of land use and water management. Mar. Pollut. Bull. 50: 1416-1429.
Caccia, V.G. and J.N. Boyer. 2007. A nutrient loading budget for Biscayne Bay,
Florida. Mar. Pollut. Bull. 54: 994-1008. Childers, D., J. Boyer, S. Davis, C. Madden, D. Rudnick, and F. Sklar. 2006. Relating
precipitation and water management to nutrient concentrations in the oligotrophic “upside-down” estuaries of the Florida Everglades. Limnol. Oceanogr. 51(1): 602-616.
Chin-Leo, G., and R. Benner. 1992. Enhanced bacterioplankton production and
respiration at intermediate salinities in the Mississippi River plume. Mar. Ecol. Prog. Ser. 87: 87-103.
Coleman, A. 1980. Enhanced detection of bacteria in natural environments by
fluorochrome staining of DNA. Limnol. Oceanogr. 25(5): 948-951. Cotner, J.B., R.H. Sada, H.A. Bottsma, T.H. Johengen, and W.S. Gardner. 2000.
Nutrient limitation of heterotrophic bacteria in Florida Bay. Estuaries 23(5): 611-620.
Craig, H. 1957. Isotopic standards for carbon and oxygen and correction factors for
mass-spectrometric analysis of carbon dioxide. Geochim. Cosmochim. Acta 12(1): 133-149.
del Giorgio, P.A., J.J. Cole, and A. Cimberlis. 1997. Respiration rates in bacteria exceed
phytoplankton production in unproductive systems. Nature 385: 148-151. del Giorgio, P.A., and J.J. Cole. 1998. Bacterial growth efficiency in natural aquatic
systems. Annu. Rev. Ecol. Sys. 29: 503-541. Doctor, D.H., C. Kendall, S.D. Sebestyen, J.B. Shanley, N. Ohte, and E.W. Boyer. 2008.
Carbon isotope fractionation of dissolved inorganic carbon (DIC) due to outgassing of carbon dioxide from a headwater stream. Hydrol. Process. 22(14): 2410-2423.

50
Donato, D.C., J.B. Kauffman, D. Murdiyarso, S. Kurnianto, M. Stidham, and M. Kanninen. 2011. Mangroves among the most carbon-rich forests in the tropics. Nat. Geosci. 4 (5): 293-297.
DuFore, C. 2012. Spatial and Temporal Variations in the Air-Sea Carbon Dioxide
Fluxes of Florida Bay. Master’s Thesis, University of South Florida. Eiler, A. S. Langenheder, S. Bertilsson, and L. Tranvik. 2003. Heterotrophic bacterial
growth efficiency and community structure at different natural organic carbon concentrations. Appl. Environ. Microbiol. 69(7): 3701-3709.
Engel, V., J.G. Barr, J.D. Fuentes, V.H. Rivera-Monroy, E. Castaneda-Moya, T. Troxler,
D. Ho, S. Ferron-Smith, J.M. Smoak, T.J. Smith, and R.R. Twilley. 2011. Net ecosystem carbon balance in a tidal mangrove forest. Presentation at the AmeriFlux Science Meeting & 3rd NACP All-Investigators Meeting. New Orleans, Louisiana, February 03, 2011.
Friederich, G.E., L.A. Codispoti, and C.M. Sakamoto. 1991. An easy-to-construct
automated Winkler titration system. Monterey Bay Aquarium Research Institute Technical Report No. 91-6.
Fry, B. 2002. Conservative mixing of stable isotopes across estuarine salinity gradients:
a conceptual framework for monitoring watershed influences on downstream fisheries production. Estuaries 25(2): 264-271.
Fry, B. 2006. Stable Isotope Ecology. Springer. Fuhrman, J.A., and F. Azam. 1982. Thymidine incorporation as a measure of
heterotrophic bacterioplankton production in marine surface waters: evaluation and field results. Mar. Biol. 66: 109-120.
Fourqurean, J.W., C.M. Duarte., H. Kennedy, N. Marbà, N. Holmer, M.A. Mateo, E.T.
Apostolaki, G.A. Kendrick, D. Krause-Jensen, K.J. McGlathery, and O. Serrano. 2012. Seagrass ecosystems as a globally significant carbon stock. Nature Geosci. 5: 505-509.
Fourqurean, J., G. Kendrick, L. Collins, R. Chambers, and M. Vanderklift. 2012.
Carbon, nitrogen and phosphorus storage in subtropical seagrass meadows: Examples from Florida Bay and Shark Bay. Mar. Freshwater Res. 63(11): 967-983.
Fourqurean, J., and M. Robblee. 1999. Florida Bay: a history of recent ecological
changes. Estuaries 22(28): 345-357.

51
Griffiths, R.P., B.A. Caldwell, and R.Y. Morita. 1984. Observations on microbial percent respiration values in arctic and subarctic marine waters and sediments. Microb. Ecol. 10: 151-164.
Hartland, A., A. Baker, W. Timms, Y. Shutova, and D. Yu. 2012. Measuring dissolved
organic carbon δ13C in freshwaters using total organic carbon cavity ring-down spectroscopy. Environ. Chem Lett. 10(3): 309-315.
Hobbie, J.E. and C.C. Crawford. 1969. Respiration corrections for bacterial uptake of
dissolved organic compounds in natural waters. Limnol. Oceanogr. 14: 528-532. Hoffmeister, J. 1974. Land from the Sea: The Geologic Story of South Florida.
University of Miami Press. King, G.M., and T. Berman. 1984. Potential effects of isotopic dilution on apparent
respiration in 14C heterotrophy experiments. Mar. Ecol. Prog. Ser. 19: 175–80. Kirchman, D.L., E. K’Nees, and R.E. Hodson. 1985. Leucine incorporation and its
potential as a measure of protein synthesis by bacteria in natural aquatic systems. Appl. Environ. Microbiol. 49: 599-607.
Kirchman, D. L. 2003. The contribution of monomers and other low-molecular weight
compounds to the flux of dissolved organic material in aquatic ecosystems pp 218-237. In S.E. Findlay, and R.L. Sinsabaugh (Eds.), Aquatic Ecosystems: Interactivity of Dissolved Organic Matter. Academic Press.
Lavrentyev, P.J. H.A. Bootsma, T.J. Johengen, J.F. Cavaletto, and W.S. Gardner. 1998.
Microbial plankton response to resource limitation: insights from the community structure and seston stoichiometry in Florida Bay, USA. Mar. Ecol. Prog. Ser. 165: 45-57.
Lennon, J.T., and L.E. Pfaff. 2005. Source and supply of terrestrial organic matter affects
aquatic microbial metabolism. Aquat. Microb. Ecol. 39: 107-119. Li, X. and W. Liu. 2011. Effect of preservation on the δ13C value of dissolved inorganic
carbon in different types of water samples. Isot. Environ. Healt. S. 47: 379-389. Mcleod, E., G.L. Chmura, S. Bouillon, R. Salm, M. Björk, C.M. Duarte, C.E. Lovelock,
W.H. Schlesinger, and B.R. Silliman. 2011. A blueprint for blue carbon: toward an improved understanding of vegetated coastal habitats in sequestering CO2. Front. Ecol. Environ. 9: 552-560.
Mook, W.G. and F.C. Tan. 1991. Stable carbon isotopes in rivers and estuaries pp 245-
264. In E.T. Degens, S. Kempe, and J.E. Richey (Eds.), Biogeochemistry of Major World Rivers, SCOPE 42. John Wiley & Sons, Inc.

52
Obeysekera, J., J. Browder, L. Hornung, and M. Harwell. 1999. The natural South
Florida system I: Climate, geology, and hydrology. Urban Ecosyst. 3: 223-244. Parsons, T.R. and J.D.H. Strickland. 1961. On the production of particulate organic
carbon by heterotrophic processes in sea water. Deep Sea Res. 8(3): 211-222. Phlips, E.J., S. Badylak, and T.C. Lynch. 1999. Blooms of the picoplanktonic
cyanobacterium Synechococcus in Florida Bay, a subtropical inner-shelf lagoon. Limnol. Oceanogr. 44: 1166-1175.
Porter, K. and Y. Feig. 1980. The use of DAPI for identifying and counting aquatic
microflora. Limnol. Oceanogr. 25(5): 943-948. Robblee, M.B., G. Clement, D. Smith, and R. Halley. 2001. Salinity patterns in Florida
Bay: A synthesis (1900-2000) pp 34-36. In 2001 Florida Bay Science Conference. (Abstract).
Robinson, C. 2008. Heterotrophic bacterial respiration pp 299-334. In D.L. Kirchman
(Ed.), Microbial Ecology of the Oceans, 2nd Edn. John Wiley & Sons, Inc. Simon, M., and F. Azam. 1989. Protein content and protein synthesis rates of planktonic
marine bacteria. Mar. Ecol. Prog. Ser. 51: 201-213. Smoak, J.M., J.L. Breithaupt, T.J. Smith III, and C.J. Sanders. 2013. Sediment accretion
and organic carbon burial relative to sea-level rise and storm events in two mangrove forests in Everglades National Park. Catena 104: 58-66.
Swart, P. and R. Price. 2002. Origin of salinity variations in Florida Bay. Limnol.
Oceanogr. 47(4): 1234-1241. St. Jean, G. 2003. Automated quantitative and isotopic (13C) analysis of dissolved
inorganic carbon and dissolved organic carbon in continuous‐flow using a total organic carbon analyser. Rapid Commun. Mass Sp. 17(5): 419-428.
Taipale, S.J. and E. Sonninen. 2009. The influence of preservation method and time on
the δ13C value of dissolved inorganic carbon in water samples. Rapid Commun. Mass Sp. 23: 2507–2510.
Torres, M.E., A.C. Mix, and W.D. Rugh. 2005. Precise δ13C analysis of dissolved
inorganic carbon in natural waters using automated headspace sampling and continuous-flow mass spectrometry. Limnol. Oceanogr. Meth. 3: 349-360.
Wanless, H. and M. Tagett. 1989. Origin, growth and evolution of carbonate mudbanks
in Florida Bay. B. Mar. Sci. 44(1): 454-489.