changes in the age dependence of mortality and disability ...€¦ · changes in the age dependence...
TRANSCRIPT

Changes in the Age Dependence of Mortality and Disability: Cohort and Other DeterminantsAuthor(s): Kenneth G. Manton, Eric Stallard and Larry CorderSource: Demography, Vol. 34, No. 1, The Demography of Aging (Feb., 1997), pp. 135-157Published by: Springer on behalf of the Population Association of AmericaStable URL: http://www.jstor.org/stable/2061664 .
Accessed: 23/07/2013 09:42
Your use of the JSTOR archive indicates your acceptance of the Terms & Conditions of Use, available at .http://www.jstor.org/page/info/about/policies/terms.jsp
.JSTOR is a not-for-profit service that helps scholars, researchers, and students discover, use, and build upon a wide range ofcontent in a trusted digital archive. We use information technology and tools to increase productivity and facilitate new formsof scholarship. For more information about JSTOR, please contact [email protected].
.
Springer and Population Association of America are collaborating with JSTOR to digitize, preserve and extendaccess to Demography.
http://www.jstor.org
This content downloaded from 193.54.110.35 on Tue, 23 Jul 2013 09:42:43 AMAll use subject to JSTOR Terms and Conditions

CHANGES IN THE AGE DEPENDENCE OF MORTALITY AND DISABILITY: COHORT AND OTHER DETERMINANTS*
KENNETH G. MANTON, ERIC STALLARD, AND LARRY CORDER
Though the general trend in the United States has been to- ward increasing life expectancy both at birth and at age 65, the temporal rate of change in life expectancy since 1900 has been variable and often restricted to specific population groups. There have been periods during which the age- and gender-specific risks of particular causes of death have either increased or decreased. These periods partly reflect the persistent effects of population health factors on specific birth cohorts. It is important to under- stand the ebbs andflows of cause-specific mortality rates because general life expectancy trends are the product of interactions of multiple dynamic period and cohort factors. Consequently, wefirst review factors potentially affecting cohort health back to 1880 and explore how that history might affect the current andfuture cohort mortality risks of major chronic diseases. We then examine how those factors affect the age-specific linkage of disability and mor- tality in three sets of birth cohorts assessed using the 1982, 1984, and 1989 National Long Term Care Surveys and Medicare mortal- ity data collectedfrom 1982 to 1991. Wefind large changes in both mortality and disability in those cohorts, providing insights into what changes might have occurred and into what future changes might be expected.
U.S. and British studies in the 1930s and 1940s found that males with high socioeconomic status (SES) had high risk of coronary heart disease (Antonovsky 1968). U.S. mortality from 1954 to 1968 showed few declines, and the National Center for Health Statistics (1964) suggested that life expectancy may have reached a limit in 1962. Kitagawa and Hauser (1973:4) summarize: "The secular decline in mortality... seems to have come to a halt in the early 1950s...Not only did the crude death rate level off but so also did age specific rates.. .between 1954 and 1963 in large part due to the increase in death rates for 12 of the 15 lead- ing causes of death..."
Social epidemiologists theorized that industrial society promoted chronic disease incidence and mortality (Dubos 1965). In the final stage of the theory of epidemiological transitions, chronic diseases were thought to limit life ex- pectancy (Omran 1971). Bourgeois-Pichat (1978) projected life expectancy limits of 73.8 years for mnales and 80.3 years for females. The 1974 Social Security Trust Fund projections assumed that mortality rates would reach ultimate levels by 2000 (Myers 1981).
Kenneth G. Manton, Center for Demograplhic Studies, Duke Univer- sity, Box 90088, Durham, NC 27708-0088; e-mail: kgm(cds.duke.edu. Eric Stallard and Larry Corder, Center for Demograpllic Studies, Duke Uni- versity. This research was supported by the Nationlal Institute on Aging.
U.S. mortality trends, however, changed dramatically after 1968. Those changes represent both midrange (the pe- riod 1950-1990) public health and medical care effects, and long-term cohort effects on chronic disease and mortality. Consequently, we applied a state variable model to three eld- erly cohorts represented in the National Long Term Care Sur- veys (NLTCS) in 1982, 1984, and 1989 and linked Medicare data collected from 1982 to 1991. In the model we define an individual's "state" in terms of chronic disability and its changes with age. Compared to the age trajectory of mortal- ity rates, changes in chronic disability provide far more in- formation on state processes within cohorts because disabil- ity summarizes the differential cohort accumulation of health effects of lifetime exposures. For example, physical activity early in life significantly affects stroke risk and mortality at late ages (e.g., Shinton and Sagar 1993). The number of years of education achieved early in life is inversely related to Alzheimer's disease risk at late ages. Bone density, deter- mined by both nutrition and level of weight-bearing physical activity up to menopause, is related to the age rate of pro- gression of female osteoporosis and fracture risks. Many can- cers are influenced by early life exposures (e.g., breast can- cer and age at first pregnancy; lung cancer and smoking) that, because of disease latencies of 10-50 years, are manifest late in life (Manton and Stallard 1992).
Though most demographers accept the premise that there are significant cohort differences in health and mortality, many federal projections series (e.g., for the Social Security Trust Fund) do not use data on those cohort differences. Thus we first review major health factors identified in epidemio- logical studies as contributing to cohort differences. lin some cases, these factors arise from previously unexpected sources (e.g., the effects of pathogens on chronic degenerative pro- cesses). This review suggests hypotheses about the sources and timing of cohort differences, and how to interpret ob- served differences.
FACTORS POTENTIALLY AFFECTING COHORT HEALTH AND MORTALITY Chronic diseases have been studied since the mid-nineteenth century (e.g., Virchow's (1856) study of atherosclerosis). Yet large-scale longitudinal studies of chronic disease in human populations were not conducted until after WWII. The Na- tional Heart Institute started in 1949; the Framingham Study in 1950. Other longitudinal studies (e.g., The Seven Coun- try, Charleston Heart, and Evans County) studies started in the early 1960s. Thus when U.S. mortality stagnated from
Demography, Volume 34-Number 1, February 1997: 135-157 135
This content downloaded from 193.54.110.35 on Tue, 23 Jul 2013 09:42:43 AMAll use subject to JSTOR Terms and Conditions

136 DEMOGRAPHY, VOLUME 34-NUMBER 1, FEBRUARY 1997
1954 to 1968, the risk factors or behaviors involved and their relation to cohort experiences were unknown.
Problems in Documenting Risk-Factor Intervention Effects Because coronary heart disease and strokes evolve slowly, risk-factor effects could not be documented for 10 or more years after the studies were started. Further delaying the identification of risk factors is that risk factors had to be respecified and better measured as data were gathered. For example, though cholesterol is a risk factor for coronary heart disease, more accurate risk estimates were made from the identification of its components: high density lipoprotein (HDL; "good" cholesterol) and low density lipoprotein (LDL; "bad" cholesterol). Repeating cholesterol measures over time more accurately predicted individual risks (Coo- per et al. 1992; Davis et al. 1990; Law, Thompson, and Wald 1994). Risk factor effects were evident in select populations with special lifestyles (e.g., religious groups such as Seventh Day Adventists and Mormons; occupational groups such as physicians and nurses) who had higher life expectancies than the U.S. population as a whole (Manton, Stallard, and Tolley 1991). In those studies, however, multiple factors "changed" at once so isolating a specific risk-factor effect was difficult. Clinicians and biomedical researchers require evidence from randomized trials before accepting the relationship between a risk factor and a disease as causal. Such evidence could be developed relatively rapidly in secondary prevention trials using persons with manifest disease. For example, choles- terol reduction was shown to benefit those with coronary heart disease (Levine, Keaney, and Vita 1995) and antiplatelet therapy reduced mortality for persons with an- gina, prior heart attacks, or prior strokes. (Antiplatelet Trialists' Collaboration 1994). Benefits of interventions were more difficult to show in primary prevention trials because chronic disease mortality is the result of a long process (10- 25 years), and altering risk factors might not affect an estab- lished disease.
Scientific knowledge when interventions were initially designed, however, was often incomplete. For example, di- uretics were used early in the Multiple Risk Factor Interven- tion Trial study to control hypertension. Diuretics aggravated cardiac arrythmias and diabetes and did not reduce total mor- tality (Gordon et al. 1989). Later when new drugs were used, total mortality declined (Multiple Risk Factor Intervention Trial Research Group 1990a, 1990b). Cholesterol reduction has been shown to affect some non-coronary heart disease conditions adversely (e.g., very low cholesterol increased the risk of some stroke types; Iso et al. 1989; Jacobs et al. 1992), making total mortality reduction difficult. Difficulties in demonstrating benefits of intervention in primary prevention trials (e.g. Moser 1991; Jacobs et al. 1992) suggested that the side effects of some therapies counterbalanced their posi- tive effects in "healthy" populations making the risk/benefit difference small-at least for the early attempts at interven- tion (e.g. Kalon et al. 1993; Bishop 1994). If interventions proved effective in middle-aged populations, the question is
then whether those interventions work at later ages-at age 80 or older (Farnsworth and Heseltine 1993; Maggioni et al. 1993).
Population Trends in Risk Factors Despite difficulties in showing the benefits of risk-factor in- terventions in primary prevention trials, from 1950 to 1992 age-standardized heart disease mortality declined 53.0%; stroke mortality declined 70.4%. Cancer mortality overall increased 6.2%-an increase of 20.2% for males and a de- cline of 7.6% for females. Thus all three causes of death de- clined for females, with female mortality declining 0.8% per year from 1954 to 1968. The positive association between coronary heart disease and SES for males reversed from 1940 to 1960. Coronary heart disease mortality and SES were never positively related for females (Kaplan and Keil 1993). Furthermore, public health programs (e.g., smoking reduc- tion, blood pressure control) started in the 1960s were shown to have population effects in four National Health and Nutri- tion Examination surveys conducted from 1960 to 1991. Hy- pertension (having blood pressure over 140/90 or taking anti- hypertensive drugs) prevalence for males ages 65-74 de- clined from 68.8% in 1960 to 59.0% in 1990 (a relative de- cline of 14.2%); for females in the same age group, hyper- tension prevalence declined from 81.5% in 1960 to 57.8% in 1990 (a relative decline twice as large as that for males: 29.1%). Elevated cholesterol (> 240 mng/dl) declined for males ages 65-74 from 38.0% in 1960 to 27.7% in 1990; females' cholesterol declined from 68.5% to 43.2% (a rela- tive decline of 36.9%) in the same period. Smoking preva- lence at ages 65 and older declined from 28.5% in 1965 to 13.5% in 1993 for males; females' smoking prevalence re- mained low: 13.7% in 1987 and 10.5% in 1993 (National Center for Health Statistics 1995).
Changes in the National Health Care System Simultaneous with public health programs were major changes in the U.S. health care system. Medicare, which started in 1965, now covers 98.3% of persons' ages 65 and older, but it is often supplemented by private insurance: Joint coverage increased 11.1% (from 64.4% to 75.5%) from 1980 to 1993, increasing most (from 51.2% to 66.7%) for those ages 85 and older (National Center for Health Sta- tistics 1995). Medicare supported teaching hospitals and clinical research, thereby stimulating treatment innovations for the U.S. elderly and oldest old populations. Surgical management of coronary heart disease beginning in 1970 (Muhlbaier et al. 1992)-even for persons aged 80 and older (Ko et al. 1992). Hosking et al. (1989) found that op- erative mortality in patients ages 90-103 was 8%-down from 30% in the 1960s-with survival improved from 2 to 5 years after surgery. Outcomes of simple procedures (e.g., plastic lens implants for cataracts; Taylor 1993; Salive et al. 1994) and complex procedures (e.g., heart valve replace- ment; Elayda et al. 1993) improved.
Medicaid, instituted on a state-by-state basis starting in 1965, covers indigent persons and provides much of the in-
This content downloaded from 193.54.110.35 on Tue, 23 Jul 2013 09:42:43 AMAll use subject to JSTOR Terms and Conditions

CHANGES IN THE AGE DEPENDENCE OF MORTALITY AND DISABILITY 137
stitutional long term care to the U.S. elderly population. This was particularly important in the 1960s and 1970s when state and community mental hospitals discharged many elderly persons. Nursing home use increased between 1963 and 1977. By 1985 restrictions on bed construction were being imposed by states so that relatively less nursing home care was paid for by Medicaid in 1993 (30.2%) than in 1988 (35.2%; National Center for Health Statistics 1995).
Long-Term Health Factor Trends: Effects of Nutrition While cause-specific mortality declines between 1950 and 1992 are correlated with changes in risk factors, in medical therapy, and in the U.S. health care system, many cohort health changes must have started much earlier and must be produced by different mechanisms. Fogel (1994) compared chronic disease prevalence in Civil War veterans aged 65 and older by 1910 (cohorts born between 1825 and 1844) with WWII veterans aged 65 and older in the period 1985-1988. He found that chronic disease prevalence declined 6% per decade from 1910 to 1985. Heart disease risk was 2.9 times higher for Civil War veterans than for WWII veterans, a find- ing he related to early nutritional deficiencies in the 1825- 1844 birth cohort. In a study of 13,249 men born between 1907 and 1930 and of deaths occurring after 1951, Martyn, Barker, and Osmond (1996) found that stroke risks were linked to deficient early maternal nutrition (manifest in de- formation of the bony pelvis), whereas heart disease was as- sociated with fetal growth restrictions due to insufficient fe- tal nutrition. For males aged 45-59 first assessed in the pe- riod 1979-1983, the relation of fetal nutrition restrictions to heart disease mortality over 10 years was most manifest in those with a high body mass index (Frankel et al.1996). Thus mechanisms relating both maternal and fetal malnutrition to adult coronary heart disease and stroke risks were found in large longitudinal studies.
Long-term mortality trends also correlate with micronu- trient intake vitamins (e.g., vitamins C and E used as anti- oxidants or vitamins A, D, and E used in cell repair; Prasad and Edwards-Prasad 1992). Cod liver oil (a source of vita- min D) was found to cure rickets in 1917 (Moon, Bandy, and Davison 1992). The United States imported 0.5 million gal- lons of fish liver oil in 1923 and 2.8 million gallons in 1930. Ultra violet irradiation of milk started in 1924. The effects of vitamin D supplementation, which increased until 1970, are reflected in IHD mortality's gender ratio-1:1 in the 1920s. Males' risks increased until 1970 in part due to toxic levels of vitamin D affecting calcium metabolism, parathy- roid activity, hypertension, and the oxidation of LDL in plaques: Vitamin D increases iron absorption, and men have higher iron levels. Females' osteoporosis risk increased si- multaneously with males' IHD risks. Excess vitamin D ad- versely affects the bone's use of calcium and females, hav- ing less skeletal reserve, are more susceptible to these ad- verse effects ( Moon et al. 1992).
Increasing meat consumption in the early twentieth century increased risks of excess homocysteine (a product
of animal protein metabolism) due to vitamin B6 deficiency. Excess homocysteine produces fibrous lesions in artery walls in adults (McCully 1983). If cholesterol is elevated, the lesions absorb lipids and atherosclerosis is accelerated. Homocysteine also affects human growth hormone and in- sulin-like growth hormone production (Kelijman 1991), which affect muscle growth, lean body mass, and cartilage. Thus atherogenic effects are most evident after the body's long bones and lean muscle mass reach maximum size- say, after age 25.
To track these effects over time in the United States, we can examine the manufacture of vitamin B6. U.S. vitamin B6 production was 1,900 kg in 1944 and 30,000 kg in 1963. Imports rose from 9,100 kg in 1963 to 275,000 kg in 1978. Because vitamin B6 prevents arterial damage, but may not reverse it, circulatory disease reduction due to increased vi- tamin B6 consumption should be greater in younger cohorts. Increases in vitamin B6 consumption from 1944 to 1972 are consistent with the coronary heart disease declines starting in 1968 for males aged 25 or younger in 1944 (McCully 1983).
Long-Term Health Factor Trends: Chronic Disease and Pathogens Chronic diseases may be initiated by viral or bacterial infec- tions. Linnanmaki et al. (1993) and Melnick and Schattner (1992) found evidence of the effects of pathogens on coro- nary heart disease. Mozar, Bal, and Farag (1990) examined the relation of pathogens to atherosclerosis in the U.S. popu- lation over time by tracing heart disease changes from 1910, when they caused 8% of U.S. deaths, until 1968, when they caused 54%. These trends may be due partly to ingestion of atherogenic viruses from 1900-1950. Mozar et al. (1990) ar- gued that commercial food processing, in which thermal food preparation inactivated atherogenic viruses (e.g., in meat products), was responsible for circulatory disease declines after 1950. Commercial food processing beginning at the turn of the century, however, accelerated after 1950 due to improved economic conditions. Efforts to eliminate viruses from meat products intensified when new pathogens were discovered (e.g., a new viral disease of swine was discov- ered in 1932, and control efforts started in 1945) or outbreaks of livestock infections (e.g., in 1952 and 1962) occurred (Mozar et al. 1990).
Pathogens also accelerate atherosclerosis by stimulating autoimmunological and inflammatory processes (Buja and Willerson 1994). Cohort differences in the chronic effects of rheumatic heart disease (e.g., valvular defects and myocar- dial lesions) may be due to changes in the prevalence of viru- lent streptococcal strains, which largely disappeared from the United States 30-40 years ago (Kaplan 1993).
Pathogens also affect cancer risks. Helicobactor pylori, a bacteria identified in 1983, is associated with stomach cancer (Forman 1991) and liver cancer (Nightingale and Gruber 1994). Early in life, infection with Helicobactor py- lori damages the stomach and reduces acid secretion, in- creasing stomach ulcer risks. Lower stomach acidity allows
This content downloaded from 193.54.110.35 on Tue, 23 Jul 2013 09:42:43 AMAll use subject to JSTOR Terms and Conditions

138 DEMOGRAPHY, VOLUME 34-NUMBER 1, FEBRUARY 1997
carcinogen-producing bacteria to flourish (Correa et al. 1975). Duodenal ulcers are negatively related to stomach cancer and to stomach ulcers, but positively related to hy- peracidity, which may reduce carcinogen production (Hansson et al. 1996). Cohorts born before and during the Industrial Revolution had a low incidence of stomach can- cer and duodenal ulcers, despite high Helicobactor pylori infection rates, because of low life expectancy (Sonnenberg 1995). At the start of the twentieth century, life expectancy increases coincided with high stomach ulcer and cancer mortality. As hygiene and economic conditions improved, the average age of Helicobactor pylori infection increased and stomach cancer incidence declined. Duodenal ulcer in- cidence increased with the age of infection. Peak mortality for' duodenal ulcers lagged that for stomach ulcers by sev- eral decades (Parsonnet 1995). All three diseases now show declines.
Helicobactor pylori infection also interacts with salt, commonly used as a preservative before refrigeration was widespread (in the United States in the late 1930s). Salt in- creases both Helicobactor pylori infection (Tsugane et al. 1994) and stomach cancer risks (Joossens et al. 1996). Salt also raises blood pressure, a stroke risk factor. Thus a "salt hypothesis" (Joossens 1968) accounts for both stroke and stomach cancer cohort mortality declines starting in the 1930s (Joossens et al. 1983, 1996). Stomach cancer also in- volves salt and nitrate interactions. When salt consumption is high gastric acid production decreases, and when nitrate intake increases (e.g., due to use of agricultural fertilizers) more nitrogen compounds are available for conversion to carcinogens. Although the consumption of fresh vegetables and fruits raises nitrate levels, it lowers salt intake, thereby reducing stomach cancer incidence. Consumption of fresh fruits and vegetables also increases potassium and vitamin C intake. Increased potassium (and decreased sodium) reduces blood pressure, suggesting a correlation of stomach cancer, stroke, and hypertensive heart disease mortality declines within cohorts (Joossens 1996).
This review suggests three things. First, epidemiologi- cal studies have identified mechanisms operating over a long enough period to influence the mortality risks of currently elderly cohorts. Second, though there were clear period ef- fects (e.g, risk factor interventions) reducing chronic disease mortality for the period 1950-1990, variation within that pe- riod suggested the presence of other risk factors possibly re- lated to cohort exposures. Third, because major changes in cohort health exposures continue, if current cohort differen- tials are large, then one could expect cohort factors to have major effects on mortality in the future.
ANALYSIS OF DISABILITY AND MORTALITY DATA GoM Analysis
In prior NLTCS analyses, education and gender affected the age trajectories of disability, morbidity, and mortality (e.g., Manton and Stallard 1996a; Manton, Stallard, and Corder 1997). In the NLTCS, the prevalence of medical conditions
(Manton, Corder, and Stallard 1993; Manton, Stallard, and Corder 1995) and of chronic disability declined between 1982 and 1989. Those results suggest that cohort member- ship is a cofactor. Studies of cohort mortality (e.g., Manton and Stallard 1988, 1996a; Manton, Stallard, and Vaupel 1986) showed that differences in individual risks could be modeled as a continuous distribution whose parameters var- ied across cohorts for circulatory disease, cancer (e.g., stomach, lung, and breast cancer), and total mortality. Co- hort mortality differences suggest persistent changes in health characteristics due to early life exposures with their size related to cohort differences in the intensity, timing, and duration of exposure. Above we examined cohort expo- sures occurring between 1900 and 1950 (e.g., increased meat consumption increasing both early pathogen exposure and the prevalence of homocysteine toxicity between 1900 and 1950; trends in consumption of vitamins D and B6; and the use of refrigeration in place of salt preservation starting in the 1930s), which created different age ranges and peri- ods of exposure for cohorts born in the period 1880-1920. Consequently, we analyzed the mortality and disability of three sets of male and female cohorts, born in the periods 1907-1917, 1897-1907, and 1887-1897, identified from 1982, 1984, and 1989 NLTCS data linked to Medicare mor- tality data 1982 to 1991.
NLTCS interviews were conducted in two stages. First, persons were screened for chronic disability-an impairment in an Activity of Daily Living (ADL) or in an Instrumental Activity of Daily Living (IADL) lasting, or expected to last, 90 or more days (See Table 1 for a list of impairments). Per- sons identified as chronically disabled were given a detailed community interview, or (for those born in 1984 or 1989) an institutional interview. The linked data set contained records for 30,308 persons who received a total of 76,000 interviews in the three NLTCS (55,000 screening interviews; 21,000 in- person community or institutional interviews) and for whom 11,000 deaths were identified.
Grade of Membership (GoM) is a multivariate proce- dure that uses discretely coded variables to identify latent classes where a person can have a partial membership in more than one class represented by similarity scores calcu- lated for each person for each class (Manton, Woodbury, and Tolley 1994). GoM was used to generate scores for K latent types of disability because NLTCS items are dis- cretely coded, are rare events measured with error, and are descriptive of multiple dimensions of functioning. The NLTCS samples represent multiple subpopulations. Prin- ciple components, one way to analyze multidimensional data, is sensitive to sampling from populations with differ- ent covariance matrices. Linear discriminant analysis mod- els differences in the vectors of means for K groups with the same covariance matrix; quadratic discriminant analysis models differences in the vectors of means for K groups with different covariance matrices. Both forms of discrimi- nant analysis require each person's membership in the K groups be known a priori. Latent class models describe samples composed of K discrete groups where a person's
This content downloaded from 193.54.110.35 on Tue, 23 Jul 2013 09:42:43 AMAll use subject to JSTOR Terms and Conditions

CHANGES IN THE AGE DEPENDENCE OF MORTALITY AND DISABILITY 139
membership is unknown. GoM generalizes latent class mod- els by allowing membership in a group to vary in degree. This procedure is more flexible in that within-state hetero- geneity can be described by scores relating individuals to each of K states. For example, GoM fit the data better than did latent class models in analyses of psychiatric diagnoses both in general population samples (Woodbury and Manton 1989) and in nursing home populations (Manton, Cornelius, and Woodbury 1995). GoM also showed higher content va- lidity by conforming more closely to the psychiatric defini- tions of disease and to the expert judgement of physician panels assessing traits of nursing home residents.
GoM was developed as an alternative to diagnostic al- gorithms which assigned patients to discrete disease catego- ries (Woodbury 1963) because: (1) few patients exhibited classic, "textbook" lists of symptoms; (2) diseases interact, so a disease's presentation can be confounded with other dis- eases' symptoms; and (3) diseases interact with age-related physiological changes, so their presentation changes with age. For example, in colo-rectal cancer the tumor site is known, but its biological behavior is not because while tu- mor initiation requires acquiring N genetic errors, they may not be the same errors. Different genetic errors can affect a tumor's response to chemotherapy, its growth rate, ability to form metastases, and stimulation of immune responses. These problems are multiplied in describing a disability that is a heterogeneous phenomenon caused by multiple diseases at late ages. Most persons aged 85 or older report some dis- ability. Thus the simple presence or absence of disability is less meaningful at late ages. Representing the intensity of disability on multiple dimensions is necessary to describe the age trajectory of functional changes in elderly persons.
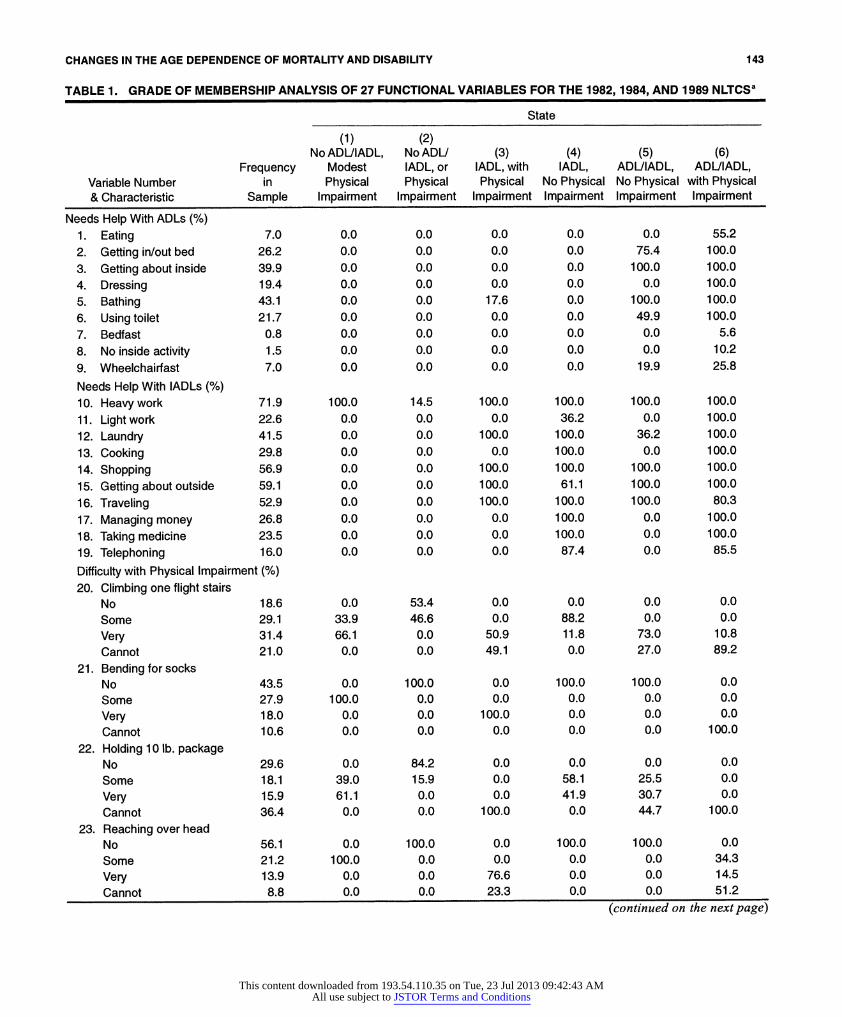
To generate scores, we applied GoM to 27 ADL, IADL, and physical impairment variables identically assessed in the three NLTCS (see Table 1). GoM assumes that the prob- ability of an outcome is a linear function of a set of unob- served probabilities (khl), with weights representing each person's grade of membership (gik) in each of K latent states:
Prob(x1,,(t) = 1.0) =Egik(t) X k,(t), (1) k
where the data are coded as binary variables (xij,(t)) indicat- ing if person i had the lth response to variable] for the 1982, 1984, or 1989 NLTCS (i.e., t= 1,2,3; T= 3). Thus Eq. (1) is based on I x T cases. Because a person has only one of Lj responses, each variable in Table 1 is binomially or multi- nomially distributed. The values of kkjl(t) are the probability of response 1, on the jth variable (i = 1,..., J; 1 = 1,..., Lj), for each of K states (k = 1,...,K) at time t. In Table 1, to save space we present only the probability of a positive response for variables with two responses: variables 1-19 and 27. For example, we report that 7% of persons had trouble eating. There are four outcomes for variables 20-26, and Xkjl iS pre- sented for all four.
In the likelihood used to estimate Eq. (1) the values of Xkkl(t) are constrained to be equal over time (i.e., Xkkj(1) = Xkjl(2) = Xkkj3)). Thus, the values of Xkkj-) define the values of gik(t)
identically at each time. This means that the K types defined 1982 to 1989 will represent all period and cohort effects present in the time interval. If observations were further ex- tended (e.g., a new survey were conducted in 1994), one would impose constraints in the likelihood equations to de- termine if the same K types describe all of the disability di- mensions present at later ages. Changes in the distribution of individuals across dimensions are fully recoverable from the values of gik(t), which do vary with time (see Manton, Stallard, and Singer 1992, 1994).
We calculated log likelihood ratio x2 statistics to com- pare the fit of models with K and K + 1 states to select the best K. The gik(t)'s describe the degree to which person i, at time t, manifests traits associated with the kth state. If the data are described by discrete homogeneous states, the Xki s
suffice to describe the distribution of traits: With no within group heterogeneity all nonzero values of gik for a state are 1.0. If discrete states do not describe the data, then partial group membership is represented by values of gik varying between 0 and 1. Scores sum over k to 1.0, for each person so the model additively reproduces the population frequen- cies of traits.
Estimation of Parameters Describing Disability Changes To describe functional losses, the change of the maximum likelihood estimates of the I x T gik(t)'s between surveys must be parameterized in time. One could assume the gik's are constant from t to t + 1; that is, when a person is reas- sessed at t + 1, gik instantly changes to gik(t + 1). Uncertainty about the value of the gik increases to t + 1. When new mea- sures are made (determining the values of gik(t + 1)) their variabilities are 0. Inconsistent with the assumption that a function is constant between measurements, however, stud- ies of functioning in elderly persons suggest that function de- clines over age. Thus we assumed a linear function connects the values of gik between t and t + 1. For persons evaluated at the beginning and end of an interval, values of gik(t) were as- sumed to change linearly over time; that is the values of gik(t,,,) were calculated for each month in the interval. For a person observed once and deceased before the next survey, it is reasonable to expect functional state to change before death. For right-censored cases (censoring could also be due to withdrawal from the study) we identified another person closely matched in terms of age, gender, and functional scores, and used the estimated monthly change in scores for the matched person to project changes up to the time of death (or censoring) for the person without a second measurement.
Thus interviews, conducted up to three times with 30,308 persons and assessing 27 measures of function, were translated into monthly records with K = 7 gik(t,,,)'s for each person. The first step in this process was to define a base weight and set its value to 1.0. Records for persons with weights higher than the base weight were replicated to re- flect the ratio of the individual's sample to the base weight. Though changes in function between intervals were assumed linear, the mortality record provided information on the date
This content downloaded from 193.54.110.35 on Tue, 23 Jul 2013 09:42:43 AMAll use subject to JSTOR Terms and Conditions
140 DEMOGRAPHY, VOLUME 34-NUMBER 1, FEBRUARY 1997
of death: The number of months of a person's record was extrapolated and determined by the date of death on the Medicare files. The monthly scores define a K-dimensional disablement process, where g (t,) is a K-element vector of scores for person i at age (month) t,,,:
g ,(tl,, + 1) = Qt ... )gl(t,)+eI(t,, +) (2)
where C(t,,,) is a time-dependent K x K matrix of gik(t,,,)
changes, and e (t,,, + 1) is a K-element vector of errors in pre- dicting g(t,, + 1). Because g (t,,, + 1) is a bounded variable, e(t,, + 1) is heteroscedastic. Thus coefficients in C(t,,,) were evaluated by a minimum entropy algorithm (see Manton et al. 1992) that produces estimates with the same properties as maximum-likelihood estimators (Kullback and Leibler 1951). Elements of C(tj,) represent monthly changes in the degree to which a person is characterized by each of K states. If each person were exactly like one of the K states, then one gik(t,,,) =
1; all other scores are 0. If each person were to change from being exactly like one state to being exactly like another, then C(t,,) would reduce to a transition probability matrix.
If each state is defined by a number of variables (e.g., 27), then the likelihood of a person being exactly in one state is small: for a fixed number of states, K, the likelihood that a person exactly matches one state declines as the number of variables increases. In GoM, within-state heterogeneity is handled by allowing a person's observed traits to be a weighted function of the traits associated with each state. If individuals move from one discrete state to another, GoM reduces to the special case of K discrete states. GoM, how- ever, does not require a person to be a member of only one state. It can describe the case in which individuals are partial members of multiple states and in which the degrees of par- tial membership change. The values of gik(tnl) indicate how closely a person matches the profile of traits (described by the values of Xkjl) for each state. For example, if states de- scribed the number of disabilities, the number of disabilities expected for a person would be the weighted number of dis- abilities for each state.
Institutional residents were coded as a separate, seventh discrete state because institutional residents do not perform IADL functions and because variation in the number of ADL disabilities was limited (the average number of disabilities was 4.8 of 6 possible). Over time a person's attributes may cease to be like those of an institutional resident and more like those of persons in other states: For example, a person may be discharged to the community in a nondisabled or a partially disabled state after rehabilitation for a hip fracture. With time, residential alternatives to nursing homes have grown, and the medical intensity of nursing home care has risen. Thus, in the overall disability distribution, there is a net transfer of persons with intermediate disability levels from institutional to community residence.
Estimation of the Mortality Function The mortality rate, g(j), is assumed to be a quadratic func- tion of the g(t,,):
g g (t,,, ) = L2 (g,(,, )) Bg(t,, ))]e 3 2 ~~~~~~~~~~(3)
where superscript T represents transposition and B is a K x K nonnegative definite matrix of coefficients representing quadratic and cross-product effects of the functional scores on mortality.
We estimated the coefficients in B (and the parameter q) using a maximum likelihood procedure (Manton and Stallard 1988). Tests of the fit of Eq. (3) to data require cal- culating x2 approximations to the ratio of likelihood values for two different models. The x2's presented in Tables 3 and 4 for the three cohorts are tests of the explanatory power of the disability scores, their values squared and interactions against a "null" model of constant mortality. In B, a nondisabled functional state defines the point of minimum mortality for Eq. (3). Increasing scores for the six other states represent deviations from the origin into regions of higher mortality. The exponential term, e""", , reflects the age-related average effect of unobserved variables. We made each coefficient in B a function of age by multiplying B it by this term: B(t,,,) = B .e"'". The better the information in the g (t,,,) terms, the smaller the estimate of q.
We made interactions of disability dynamics and mor- tality explicit by substituting Eq. (2) in Eq. (3):
( Qt., -= [{ g(C(t,,, -1) g,(t,,, -1) +
so that mortality depends on deterministic (C(t,,)) and sto- chastic ( e(t,,)) changes in function.
Estimating Disability Dynamics and Mortality Functions for Cohorts To use Eqs. (2) and (3), we separated the data into male and female cohorts born: (1) mid-1907 to mid-1917 (those aged 65-74.999 in mid-1982 and 74.5-84.499 by 1991); (2) mid- 1897 to mid-1907 (those aged 75-84.999 in mid-1982 and 84.5-94.499 by 1991); and (3) mid- 1887 to mid- 1897 (those aged 85-94.999 in mid-1982 and 94.5-104.499 by 1991). Because the 1907-1917 cohort was observed to age 84.5, we combined its experience with that of older cohorts above age 84.5 to estimate survival and disability changes. More generally, for cohort age (here in years) x to (x + 9.999) in 1982 (i.e., born 1982-x to 1982-(x + 9.999)) we identified all disability changes and mortality to ages (x + 9.5) to (x + 19.499) in 1991. This includes both the gik(t,,,) and the monthly mortality experience for the 19.5 years in the age x time window of observation for cohort y (y = 1, 2, 3). The experience for the second cohort aged 75.0-84.999 in 1982, extends to ages 84.5-94.499 in 1991, and was appended to experience above ages 94.5 in the period 1982-1991. Ad- justments were also made to the oldest cohort.
This content downloaded from 193.54.110.35 on Tue, 23 Jul 2013 09:42:43 AMAll use subject to JSTOR Terms and Conditions

CHANGES IN THE AGE DEPENDENCE OF MORTALITY AND DISABILITY 141
CALCULATING COHORT LIFE TABLE PARAMETERS DEPENDENT ON DISABILITY DYNAMICS
To calculate life table parameters that are functions of the trajectories of the K scores, we used Eqs. (5)-(12) to inte- grate coefficients from Eqs. (2) and (3) in a model of a cohort process. In Eq. (2) the coefficients describe deterministic (i.e., C(tJ,)) and stochastic (i.e., eQ QM + 1)) changes in scores. The covariance matrix of the error terms is the "diffusion matrix" of the process. The sum of deterministic and diffusion vari- ance matrices is the total variance matrix for the cohort scores. If mortality and disability did not interact over time, we could calculate a hazard observed for each cohort at age 19.5 and extrapolate that function to later ages. In (3), how- ever, functional state affects mortality through the age-de- pendent hazard coefficients in B(t,). In Eq. (2) functional state changes with age; Eq. (3) determines who has the high- est risk of death. Thus mortality affects the flow of persons between states changing their age-specific memberships. Eqs. (5)-(12) then reflect the simultaneity of functional state and mortality changes within each cohort over each age interval.
In addition to the coefficients in Eqs. (2) and (3), we need estimates of initial conditions-the mean vector, g(tm), and the variance-covariance matrix, V(t",), of the scores at the first observed age-calculated directly from the person month file. With initial conditions and the coeffi- cients in Eqs. (2) and (3), we can calculate the probability of survival, the mean of each functional state score, and the covariance matrix of scores for each month, m, in a cohort life table. The probability of survival depends on changes in the means and variances of the functional scores, and is dif- ferent than in a life table computed only from mortality ob- served for ages at and beyond those observed for a cohort, or for all ages in a given period. Eqs. (5)-(12) must be cal- culated for each interval in a specific order because param- eters modified in one equation are needed in another.
First, the covariance matrix, V(tm), of the scores is ad- justed for mortality, B, at age ta,,
V* (t,,, = (I + V(t,,, )B(t,,,)-' V(t.,) (5)
With V*(tnl) we can adjust the average scores for mortality using a function of both the unadjusted means g(t,,, ) and the adjusted variance-covariance matrix (V(tJ)) of the gik(tfl), or
k;((t. )-V*(t. )B(Qm )9(t. ) (6) kk
Eqs. (5) and (6) are initialized with the g(t,,) and V(tm,) for the first age observed for a cohort. In the numerator of Eq. (6), g(t,,,), is decremented by the age-specific force of mor- tality B(tnl) weighted by the variance-covariance matrix r(tm,)
calculated in Eq. (5). The denominator, in Eq. (6) rescales (t) to ensure that each person's scores sum to 1.0 after we
adjust for mortality selection (B(t,,)) in the numerator. The functional status-dependent probability of survival
l(tn,+l), given 1(t,,), is calculated as
l(t,,, + 1) = I(t,)II + V(t,..)B(t,..)|-'/2
9R(9(t., )) +F(*t, ( k(t,,, ) + *t,)] expX 2 2 J (7)
The initial value of l(tJ) in Eq. (7) is 1.0. The probability of survival to t", + 1 is calculated by multiplying l(t",) by a func- tion of the covariances (V(t,,,)) and means (g(t..)) of the functional scores and the functional state-specific, age-de- pendent hazard coefficients (B(t,,J)). In addition, mortality adjusted means, g (t,,), calculated in Eq. (6), are used in Eq. (7).
Eqs. (5)-(7) are special cases of a general result derived in Woodbury and Manton (1983) for the impact of quadratic mortality selection on a normally distributed population. In our application, these equations are treated as approxima- tions rather than as exact results because the boundary con- ditions on the gik values imply that their distribution cannot be truly normal.
After the mortality decrement and renormalization of the g(t, over the interval in Eq. (6), the g*(t,,,) terms are up-
dated for deterministic dynamics t to t + 1:
9(tt,, + 1) = C(t,, ) g (t0g ) . (8)
This produces the means, k(tn, + 1), for survivors to age t,,, + 1. Calculation of the variance-covariance matrix adjusted for dynamics is more difficult here than in models assuming that variables are normally distributed because boundary condi- tions on the gik(tn,) values imply that the effects of random shocks to the process (i.e., the e.(t,,, + 1) terms in Eq. (2)) are not normally distributed (i.e., diffusion is not Gaussian, where the means and variances of state variables are uncorrelated), but are distributed as correlated variables whose variances are at most equal to that of Bernoulli variables with the same means. Thus, V(tm,+1) is a function of three matrices: (1) W(t,,,+1), a K x K diagonal matrix of updated Bernoulli stan-
dard deviations with diagonals Fgk (t4 + 1) x [1 - *k (tm + 1)]; (2) St,,, a K x K diagonal matrix of the square roots of the ratio of adjusted variances of g1k(t,m+l) values to updated Bernoulli variances; and (3) R,,,, a K x K correlation matrix of gik(t..) values conditional on age. S,,,, and R,,,, are both assumed to be independent of age. Thus, dropping subscripts on S and R, the updated covariance matrix is:
V(tm + 1) = W(tm, + 1)SRS W(t,, +1). (9)
This content downloaded from 193.54.110.35 on Tue, 23 Jul 2013 09:42:43 AMAll use subject to JSTOR Terms and Conditions

142 DEMOGRAPHY, VOLUME 34-NUMBER 1, FEBRUARY 1997
Diffusion is the residual variance after subtracting determin- istic score changes:
; (t,. + 1) = V(t,. + 1) - C(t ,,)V (t, )C(t, )., (1 0)
or, substituting Eq. (9) in Eq. (10),
X(t,,, + 1) = [W(t,,, + l)SRSW(t,,, + 1)]
-C(t,,, )V* (t,,,.)C(t.,) ,(1
or
Eft(tm + 1) + C(t,,,)V- (tm,)C(t,,)T
= [W(t,. + l)SRSW(t,,, + 1)] = V(t,,, + 1). (12)
Eqs. (5)-(12) are calculated for each age, ta,, in the life table. In sum, to calculate the cohort life tables we first esti-
mate two sets of equations-Eqs. (2) and (3)-from the data. The first equation provides estimates of coefficients describ- ing deterministic and stochastic changes in disability with age; the second provides estimates of the risk of death as a function of disability scores. These two equations provide the information necessary to calculate life table functions from differential equations describing the interactions of disabil- ity dynamics and disability-dependent mortality. The life table equations are based on a general model of human aging and mortality, developed by Woodbury and Manton (1977), which is generalized to deal with variables that are not nor- mally distributed (Manton, Stallard, and Singer 1994).
RESULTS State Definitions
To define the gik(tm) terms, we applied GoM to all commu- nity respondents in the three rounds of the NLTCS (e.g., Manton, Stallard, Woodbury, et al. 1994) with Xkkl(t) values set equal over t for each survey so that the values of gik(tm,)
could be compared over time. The Xkj l(t) estimates are pre- sented in Table 1.
The six states for community residents can be described by evaluating the patterns of O's and l's (100%) for the val- ues of Xkjl for each state k. A 0 indicates a characteristic that never occurs in a state; a 1 (100%) indicates a characteristic that always occurs. We evaluated Xkjl values between 0 and 1 by comparing the Xkjl values to the marginal probability of each-trait and selecting traits most strongly characterizing a state. For example, the likelihood of being bedfast in the sixth state was 5.6% versus 0.8% in the sample. This 7:1 ra- tio suggests that the sixth state is strongly characterized by being bedfast. All other states have a zero-probability of bedfastness: The trait does not distinguish them. Using this process, we characterized six states: (1) No ADL or IADL disability, with modest physical im-
pairment. (2) No ADL or IADL disability and no physical impairment. (3) IADL disability with physical impairment. (4) IADL disability and no physical impairment.
(5) Moderate ADL and IADL disability, but no physical im- pairment.
(6) ADL or IADL disability with physical impairment. A seventh state was created for institutional residents
(gi7 was set equal to 0 or 1). Persons with no ADL or IADL disability (on the screening interview) were assigned a score of 1 on the first state. Because the first two states had little disability, one could have added "screened out" per- sons to the second state. The screen, however, checked only for ADL and IADL disability; heavy housework disability was not checked. To be conservative, we added "screen- outs" to the first state, which included heavy housework disability and a small degree of physical impairment consis- tent with the absence of ADL or IADL disability. Thus we created scores for the seven states for all sample persons. We processed this file as described above using replication factors to adjust for sample weights and the matching pro- cedure. We also used a linear model of functional status dy- namics, creating gik(t,,,) values for each month in the obser- vation period for each sample person (and for each sample person's replicates).
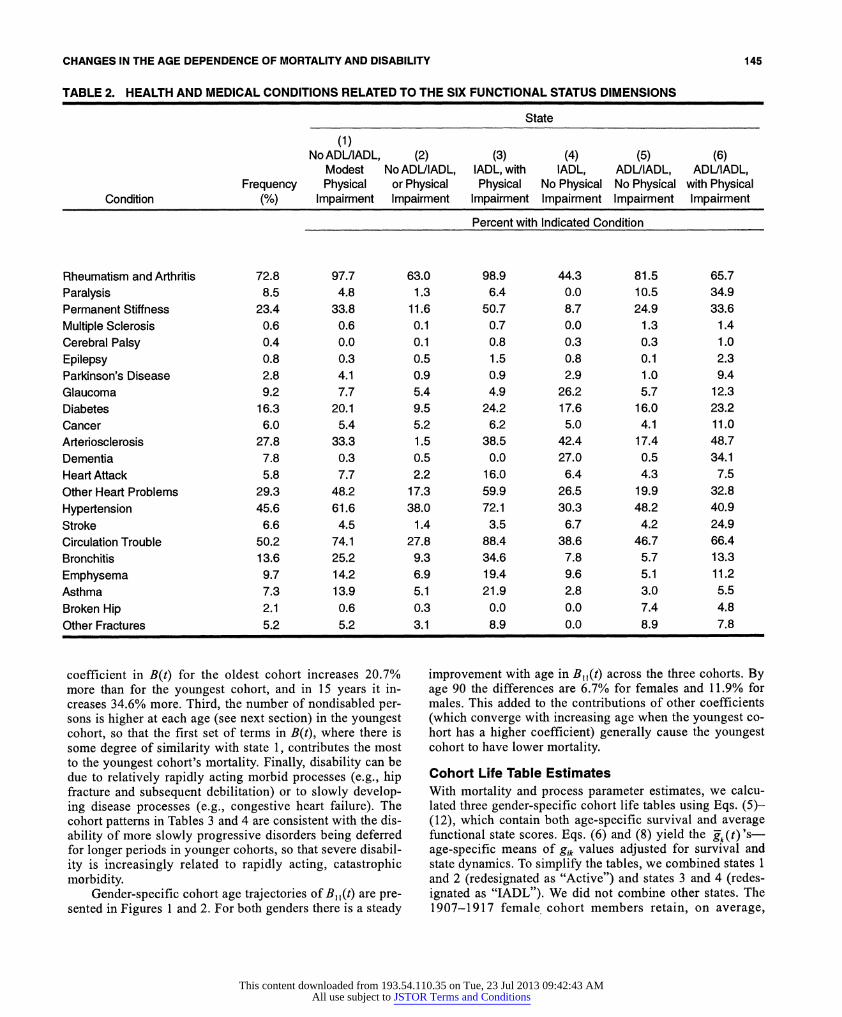
The linkage between morbidity and mortality is well es- tablished in the concept of causes of death statistics. Less well established is the linkage between morbidity and dis- ability. In Table 2, we present the probabilities (Qk/'ls) that a state manifests one of 22 morbid conditions.
The profiles of medical problems in Table 2 describe health differences between the six states for community resi- dents. The first state shows arthritis and joint problems and moderate cardiopulmonary problems. The second has a lower prevalence on all medical conditions than the total sample. The third has serious arthritis problems (e.g., more perma- nent stiffness), diabetes, and cardiopulmonary conditions (little stroke and hip fracture risk). State four has the fewest joint problems, but the second highest level of dementia (27.0%) and arteriosclerosis (42.43%), and the most glau- coma (26.2%). State five has moderate medical problems, but not dementia, cancer, heart attack, or stroke. It has the most hip and other fractures. State six has the most paralysis (34.9%), neurological problems (including dementia: 34. 1%), arteriosclerosis (48.7%), stroke (24.9%), and cancer (11.0%); it ranks second in diabetes (23.2%) and has a significant risk of fractures.
To the extent that there is a causal relation between mor- bidity and disability, rows of Table 2 identify functional states associated with specific conditions or groups of condi- tions. For example, arthritis and cardiopulmonary conditions are most frequent in states 1 and 3. Diabetes is most frequent in states 3 and 6. Arteriosclerosis and dementia are most fre- quent in states 4 and 6. Fractures are most frequent in state 5. Cancer, stroke, paralysis, and neurological problems are most frequent in state 6.
Gender- and Cohort-Specific Mortality Function With the gik(tm1) values, we estimated an age specific quadratic hazard function for males and females: We related mortality in each month (identified from the date of death on the Medi-
This content downloaded from 193.54.110.35 on Tue, 23 Jul 2013 09:42:43 AMAll use subject to JSTOR Terms and Conditions
CHANGES IN THE AGE DEPENDENCE OF MORTALITY AND DISABILITY 143
TABLE 1. GRADE OF MEMBERSHIP ANALYSIS OF 27 FUNCTIONAL VARIABLES FOR THE 1982, 1984, AND 1989 NLTCSa
State
(1) (2) No ADUIADL, No ADU (3) (4) (5) (6)
Frequency Modest IADL, or IADL, with IADL, ADUIADL, ADUIADL, Variable Number in Physical Physical Physical No Physical No Physical with Physical & Characteristic Sample Impairment Impairment Impairment Impairment Impairment Impairment
Needs Help With ADLs (%) 1. Eating 7.0 0.0 0.0 0.0 0.0 0.0 55.2 2. Getting in/out bed 26.2 0.0 0.0 0.0 0.0 75.4 100.0
3. Getting about inside 39.9 0.0 0.0 0.0 0.0 100.0 100.0 4. Dressing 19.4 0.0 0.0 0.0 0.0 0.0 100.0 5. Bathing 43.1 0.0 0.0 17.6 0.0 100.0 100.0
6. Using toilet 21.7 0.0 0.0 0.0 0.0 49.9 100.0 7. Bedfast 0.8 0.0 0.0 0.0 0.0 0.0 5.6
8. No inside activity 1.5 0.0 0.0 0.0 0.0 0.0 10.2
9. Wheelchairfast 7.0 0.0 0.0 0.0 0.0 19.9 25.8
Needs Help With IADLs (%) 10. Heavy work 71.9 100.0 14.5 100.0 100.0 100.0 100.0
11. Light work 22.6 0.0 0.0 0.0 36.2 0.0 100.0 12. Laundry 41.5 0.0 0.0 100.0 100.0 36.2 100.0
13. Cooking 29.8 0.0 0.0 0.0 100.0 0.0 100.0
14. Shopping 56.9 0.0 0.0 100.0 100.0 100.0 100.0
15. Getting about outside 59.1 0.0 0.0 100.0 61.1 100.0 100.0
16. Traveling 52.9 0.0 0.0 100.0 100.0 100.0 80.3
17. Managing money 26.8 0.0 0.0 0.0 100.0 0.0 100.0
18. Taking medicine 23.5 0.0 0.0 0.0 100.0 0.0 100.0
19. Telephoning 16.0 0.0 0.0 0.0 87.4 0.0 85.5
Difficulty with Physical Impairment (%) 20. Climbing one flight stairs
No 18.6 0.0 53.4 0.0 0.0 0.0 0.0 Some 29.1 33.9 46.6 0.0 88.2 0.0 0.0
Very 31.4 66.1 0.0 50.9 11.8 73.0 10.8 Cannot 21.0 0.0 0.0 49.1 0.0 27.0 89.2
21. Bending for socks No 43.5 0.0 100.0 0.0 100.0 100.0 0.0 Some 27.9 100.0 0.0 0.0 0.0 0.0 0.0 Very 18.0 0.0 0.0 100.0 0.0 0.0 0.0 Cannot 10.6 0.0 0.0 0.0 0.0 0.0 100.0
22. Holding 10 lb. package No 29.6 0.0 84.2 0.0 0.0 0.0 0.0 Some 18.1 39.0 15.9 0.0 58.1 25.5 0.0 Very 15.9 61.1 0.0 0.0 41.9 30.7 0.0 Cannot 36.4 0.0 0.0 100.0 0.0 44.7 100.0
23. Reaching over head No 56.1 0.0 100.0 0.0 100.0 100.0 0.0 Some 21.2 100.0 0.0 0.0 0.0 0.0 34.3 Very 13.9 0.0 0.0 76.6 0.0 0.0 14.5 Cannot 8.8 0.0 0.0 23.3 0.0 0.0 51.2
(continued on the next page)
This content downloaded from 193.54.110.35 on Tue, 23 Jul 2013 09:42:43 AMAll use subject to JSTOR Terms and Conditions

144 DEMOGRAPHY, VOLUME 34-NUMBER 1, FEBRUARY 1997
(Table I continuedfrom the previous page)
State
(1) (2) No ADL/IADL, No ADU (3) (4) (5) (6)
Frequency Modest IADL, or IADL, with IADL, ADUIADL, ADUIADL, Variable Number in Physical Physical Physical No Physical No Physical with Physical & Characteristic Sample Impairment Impairment Impairment Impairment Impairment Impairment
24. Combing hair No 71.6 0.0 100.0 0.0 100.0 100.0 0.0 Some 16.0 100.0 0.0 43.0 0.0 0.0 33.5 Very 7.0 0.0 0.0 57.0 0.0 0.0 11.7 Cannot 5.4 0.0 0.0 0.0 0.0 0.0 54.8
25. Washing hair No 55.8 0.0 100.0 0.0 100.0 100.0 0.0 Some 14.8 100.0 0.0 0.0 0.0 0.0 0.0 Very 9.4 0.0 0.0 100.0 0.0 0.0 0.0 Cannot 20.0 0.0 0.0 0.0 0.0 0.0 100.0
26. Grasping small objects No 66.0 0.0 100.0 0.0 100.0 100.0 24.6 Some 20.3 100.0 0.0 0.0 0.0 0.0 34.3 Very 10.1 0.0 0.0 95.4 0.0 0.0 14.9 Cannot 3.6 0.0 0.0 4.6 0.0 0.0 26.2
27. See well enough to read newspaper 74.3 100.0 100.0 100.0 0.0 100.0 45.4
aN = 16,485
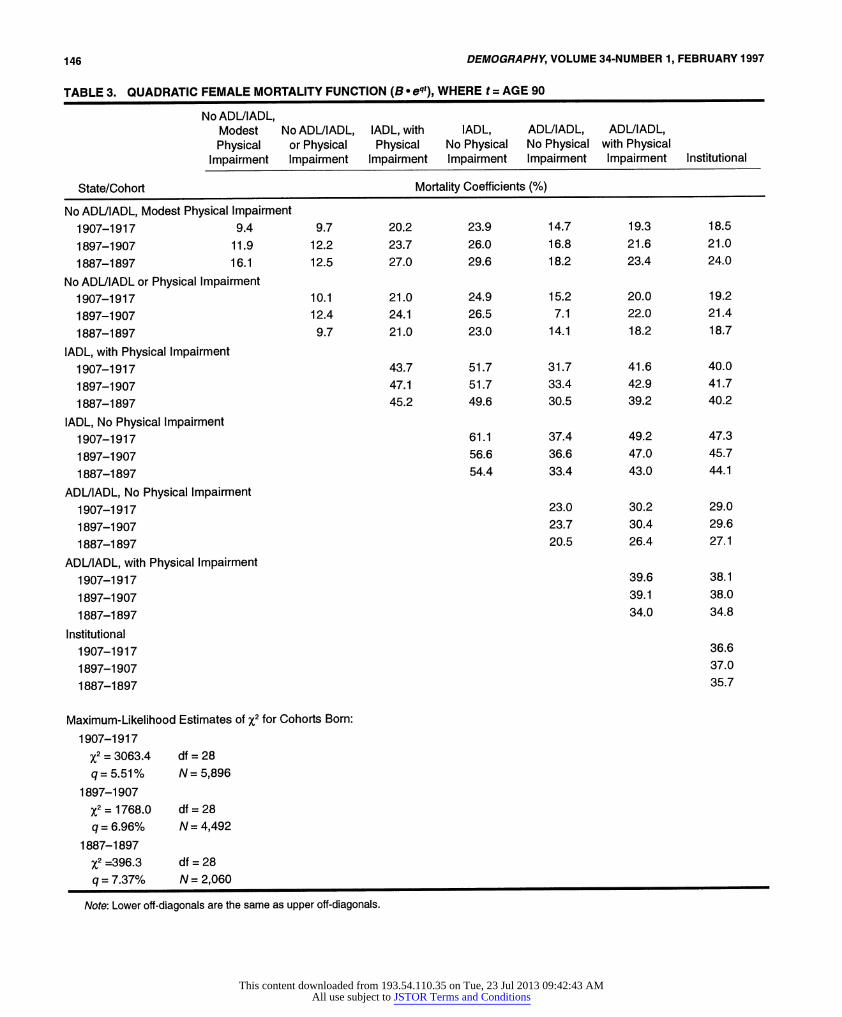
care file) to the functional scores at the start of the month. The hazard coefficients for the mortality function in Eq. (3), presented in Table 3, represent the effect on mortality of be- ing in each state or pair of states for females.
The hazard coefficients in Table 3 were evaluated at age 90 (B(90) = B x e q90), the midpoint age of the oldest cohort (i.e., persons aged 85-94.999) in 1982, to facilitate cohort comparisons. Table 3 shows that, for state 1, the youngest cohort has the lowest mortality: The two oldest cohorts' mor- tality rates at age 90 (16.1% and 11.9%) are 71.3% and 26.6% higher than the 1907-1917 cohort's mortality rate (9.4%). For a person with a nonzero score on state 1, and one of the states with disability (i.e., the first three rows of coefficients in Table 3), the youngest cohort always has the lowest rate. This implies that a subset of the traits associated with a disabled state is combined with the lack of such traits for the nondisabled state.
For persons aged 90 with no loading on state 1, the three cohorts show a mixed pattern because disability has the most predictive power in the youngest cohort. For ex- ample, the relative risk for females in the fourth state (IADL and no physical impairment) is 3.4 to 1.0 for the old- est cohort compared to 6.5 to 1.0 for the youngest cohort. The youngest cohort also has the highest x2 value (i.e., 3063.4 versus 393.4 for the oldest cohort) and the smallest q (5.5% versus 7.4% for the oldest cohort), suggesting that
age-related unobserved variables have the most influence in the oldest cohort.
Males exhibit similar patterns (See Table 4). For state 1, the mortality rate for the 1887-1897 cohort (28.9%) is 70.0% higher than the mortality rate for the 1907-1917 cohort (17.0%).
The male mortality function for the youngest cohort again shows greater discriminability for disability than for the two older cohorts. The risk for the fourth state (IADL and no physical impairment) relative to the first state is 4.2 to 1.0 for the youngest male cohort compared to 2.6 to 1.0 for the oldest male cohort. As for females, the youngest male cohort has the highest %2 value (1515.2 versus 98.6) and a lower q (5.2 versus 7.2%).
There are four reasons for the observed effects of dis- ability on cohort mortality. First, nursing home care has changed due to restrictions on the growth of nursing home populations and changes in the care provided in acute care settings (e.g., in hospitals). These restrictions will tend to raise the overall medical acuity, and mortality, of the insti- tutional population-especially for younger persons. Sec- ond, the cohort q estimates imply that eventually all of the coefficients in B(t,,) will reach an age at which the younger cohort has a lower rate than for the two older cohorts. Coef- ficients for the oldest male cohort increase 2% faster per year of age than for the youngest cohort: In 10 years, each
This content downloaded from 193.54.110.35 on Tue, 23 Jul 2013 09:42:43 AMAll use subject to JSTOR Terms and Conditions
CHANGES IN THE AGE DEPENDENCE OF MORTALITY AND DISABILITY 145
TABLE 2. HEALTH AND MEDICAL CONDITIONS RELATED TO THE SIX FUNCTIONAL STATUS DIMENSIONS
State
(1) No ADUIADL, (2) (3) (4) (5) (6)
Modest No ADL/IADL, IADL, with IADL, ADUIADL, ADUIADL, Frequency Physical or Physical Physical No Physical No Physical with Physical
Condition (%) Impairment Impairment Impairment Impairment Impairment Impairment
Percent with Indicated Condition
Rheumatism and Arthritis 72.8 97.7 63.0 98.9 44.3 81.5 65.7 Paralysis 8.5 4.8 1.3 6.4 0.0 10.5 34.9 Permanent Stiffness 23.4 33.8 11.6 50.7 8.7 24.9 33.6 Multiple Sclerosis 0.6 0.6 0.1 0.7 0.0 1.3 1.4 Cerebral Palsy 0.4 0.0 0.1 0.8 0.3 0.3 1.0 Epilepsy 0.8 0.3 0.5 1.5 0.8 0.1 2.3 Parkinson's Disease 2.8 4.1 0.9 0.9 2.9 1.0 9.4 Glaucoma 9.2 7.7 5.4 4.9 26.2 5.7 12.3 Diabetes 16.3 20.1 9.5 24.2 17.6 16.0 23.2 Cancer 6.0 5.4 5.2 6.2 5.0 4.1 11.0 Arteriosclerosis 27.8 33.3 1.5 38.5 42.4 17.4 48.7 Dementia 7.8 0.3 0.5 0.0 27.0 0.5 34.1 Heart Attack 5.8 7.7 2.2 16.0 6.4 4.3 7.5 Other Heart Problems 29.3 48.2 17.3 59.9 26.5 19.9 32.8 Hypertension 45.6 61.6 38.0 72.1 30.3 48.2 40.9 Stroke 6.6 4.5 1.4 3.5 6.7 4.2 24.9 Circulation Trouble 50.2 74.1 27.8 88.4 38.6 46.7 66.4 Bronchitis 13.6 25.2 9.3 34.6 7.8 5.7 13.3 Emphysema 9.7 14.2 6.9 19.4 9.6 5.1 11.2 Asthma 7.3 13.9 5.1 21.9 2.8 3.0 5.5 Broken Hip 2.1 0.6 0.3 0.0 0.0 7.4 4.8 Other Fractures 5.2 5.2 3.1 8.9 0.0 8.9 7.8
coefficient in B(t) for the oldest cohort increases 20.7% more than for the youngest cohort, and in 15 years it in- creases 34.6% more. Third, the number of nondisabled per- sons is higher at each age (see next section) in the youngest cohort, so that the first set of terms in B(t), where there is some degree of similarity with state 1, contributes the most to the youngest cohort's mortality. Finally, disability can be due to relatively rapidly acting morbid processes (e.g., hip fracture and subsequent debilitation) or to slowly develop- ing disease processes (e.g., congestive heart failure). The cohort patterns in Tables 3 and 4 are consistent with the dis- ability of more slowly progressive disorders being deferred for longer periods in younger cohorts, so that severe disabil- ity is increasingly related to rapidly acting, catastrophic morbidity.
Gender-specific cohort age trajectories of B1 (t) are pre- sented in Figures 1 and 2. For both genders there is a steady
improvement with age in B,,(t) across the three cohorts. By age 90 the differences are 6.7% for females and 11.9% for males. This added to the contributions of other coefficients (which converge with increasing age when the youngest co- hort has a higher coefficient) generally cause the youngest cohort to have lower mortality.
Cohort Life Table Estimates With mortality and process parameter estimates, we calcu- lated three gender-specific cohort life tables using Eqs. (5)- (12), which contain both age-specific survival and average functional state scores. Eqs. (6) and (8) yield the gk(t) '- age-specific means of gik values adjusted for survival and state dynamics. To simplify the tables, we combined states 1 and 2 (redesignated as "Active") and states 3 and 4 (redes- ignated as "IADL"). We did not combine other states. The 1907-1917 female cohort members retain, on average,
This content downloaded from 193.54.110.35 on Tue, 23 Jul 2013 09:42:43 AMAll use subject to JSTOR Terms and Conditions
146 DEMOGRAPHY, VOLUME 34-NUMBER 1, FEBRUARY 1997
TABLE 3. QUADRATIC FEMALE MORTALITY FUNCTION (B. eqt), WHERE t = AGE 90
No ADUIADL, Modest No ADUIADL, IADL, with IADL, ADUIADL, ADUIADL, Physical or Physical Physical No Physical No Physical with Physical
Impairment Impairment Impairment Impairment Impairment Impairment Institutional
State/Cohort Mortality Coefficients (%)
No ADL/IADL, Modest Physical Impairment 1907-1917 9.4 9.7 20.2 23.9 14.7 19.3 18.5
1897-1907 11.9 12.2 23.7 26.0 16.8 21.6 21.0
1887-1897 16.1 12.5 27.0 29.6 18.2 23.4 24.0
No ADL/IADL or Physical Impairment 1907-1917 10.1 21.0 24.9 15.2 20.0 19.2
1897-1907 12.4 24.1 26.5 7.1 22.0 21.4
1887-1897 9.7 21.0 23.0 14.1 18.2 18.7
IADL, with Physical Impairment 1907-1917 43.7 51.7 31.7 41.6 40.0
1897-1907 47.1 51.7 33.4 42.9 41.7
1887-1897 45.2 49.6 30.5 39.2 40.2
IADL, No Physical Impairment 1907-1917 61.1 37.4 49.2 47.3
1897-1907 56.6 36.6 47.0 45.7
1887-1897 54.4 33.4 43.0 44.1
ADL/IADL, No Physical Impairment 1907-1917 23.0 30.2 29.0
1897-1907 23.7 30.4 29.6
1887-1897 20.5 26.4 27.1
ADL/IADL, with Physical Impairment 1907-1917 39.6 38.1
1897-1907 39.1 38.0
1887-1897 34.0 34.8
Institutional 1907-1917 36.6
1897-1907 37.0
1887-1897 35.7
Maximum-Likelihood Estimates of X2 for Cohorts Born:
1907-1917
x2-3063.4 df=28 q=5.51% N=5,896
1897-1907
x2 1768.0 df =28 q = 6.96% N = 4,492
1887-1897 %2 =396.3 df =28
q = 7.37% N =2,060
Note: Lower off-diagonals are the same as upper off-diagonals.
This content downloaded from 193.54.110.35 on Tue, 23 Jul 2013 09:42:43 AMAll use subject to JSTOR Terms and Conditions

CHANGES IN THE AGE DEPENDENCE OF MORTALITY AND DISABILITY 147
TABLE 4. MALE QUADRATIC MORTALITY FUNCTION (B* eqt), WHERE t = AGE 90
No ADL/IADL, Modest No ADL/IADL, IADL, with IADL, ADL/IADL, ADL/IADL, Physical or Physical Physical No Physical No Physical with Physical
Impairment Impairment Impairment Impairment Impairment Impairment Institutional
State/Cohort Mortality Coefficients (%)
No ADUIADL, Modest Physical Impairment 1907-1917 17.0 19.3 29.1 34.9 27.5 32.6 28.3 1897-1907 23.7 25.8 41.1 42.1 33.8 36.9 34.0 1887-1897 28.9 29.3 36.7 46.3 33.6 37.2 35.2
No ADL/IADL or Physical Impairment 1907-1917 21.9 33.0 39.6 31.2 37.0 32.1 1897-1907 28.1 44.8 45.9 36.8 40.1 37.0 1887-1897 29.8 37.2 47.0 34.1 37.7 35.7
IADL, with Physical Impairment 1907-1917 49.7 59.6 47.0 55.6 48.4 1897-1907 71.3 71.3 58.7 63.9 58.9 1887-1897 46.6 58.8 42.6 47.2 44.6
IADL, No Physical Impairment 1907-1917 71.5 56.4 66.8 58.0 1897-1907 74.8 60.1 65.4 60.3 1887-1897 74.1 53.8 59.5 56.3
ADUIADL, No Physical Impairment 1907-1917 44.5 52.6 45.8 1897-1907 48.2 52.6 48.4 1887-1897 39.0 43.2 40.8
ADUIADL, with Physical Impairment 1907-1917 62.3 54.2 1897-1907 57.3 52.8 1887-1897 47.8 45.2
Institutional 1907-1917 47.1 1897-1907 48.6 1887-1897 42.8
Maximum-Likelihood Estimates of X2 for Cohorts Born: 1907-1917
X2=1,515.2 df=28 q = 5.23% N = 4,456
1897-1907
x2 713.2 df=28 q=7.18% N=2,558
1887-1897 %2 = 98.6 df = 28
q= 7.24% N = 724
Note: Lower off-diagonals are the same as upper off-diagonals.
This content downloaded from 193.54.110.35 on Tue, 23 Jul 2013 09:42:43 AMAll use subject to JSTOR Terms and Conditions

148 DEMOGRAPHY, VOLUME 34-NUMBER 1, FEBRUARY 1997
FIGURE 1. AGE TRAJECTORY OF B,1(t) FOR THREE FEMALE COHORTS
50
45
40 - | -- 1907-1917 q= 5.23%
35 -.| * 1897-1907q=7.18%
- 4---1887-1897 q= 7.24% 30
B11 (t) 25
20
15
10
5
65 70 75 80 85 90 95 100 105
Age
FIGURE 2. AGE TRAJECTORY OF B,,(t) FOR THREE MALE COHORTS
90
80 -4| ---1907-1917q=5.51%
70 - 1897-1907 q= 6.96% -4---- 1887-1897 q= 7.37%
60
B11 (t) 50
40
30
20
10
65 70 75 80 85 90 95 100 105
Age
This content downloaded from 193.54.110.35 on Tue, 23 Jul 2013 09:42:43 AMAll use subject to JSTOR Terms and Conditions

CHANGES IN THE AGE DEPENDENCE OF MORTALITY AND DISABILITY 149
o | L O C It t0o ) t 1- 0) N N O O
Co | C t o Co t) 'C ')C' n oto N-C1't tO. 10| w~~~ N Co 't ~ ) 00
< EL m Co |- LO cn c\j c t | o | | N l
C)
z
Go C'J U~
1- r- C0 N - U 0 Co
t _ D >-cb C X O O O CD O 0D 0D Cf) Cf) s C\ CY) CY O\ CY C) \ \l C Y)0
z 0)~~~~~~C
Go EC C O ' O ) -' c ) (000 (6 6Ojcj c c3i ci C' J C'JC o o.
cm 0 CO~00 0001 C)0 LC) 0 '0
0 o = C r ) c - O) Cy) 000 Cy) 000C t 't 0 000 0 00 C\J - v-0CO
w _ EL a. CL CO CLO(
6 L C- 00N - r 0 0 N00
6 00
o z
I- cn g icm cmur o t t o O ) L C LO _00 Co o Cm Co c CO
I |* o .O Q:> oz eD a) N-D '00 00)( C1)C)J Ct o0 D
0 | ? |\ c6 |6 q q o ? co t P- 6 cui co c6 cD L c6 o S
U) . C
IL a) 2 | |Lo 0z o Co Lo Co Lo Cy 1" Co Cy) cm Cy
I--
O~~~~~~ CM
,o l I> I II I 9 0 0 ( 0 ( .c c c j tn
L U O ON t t t O00 0 N-N-ONNOttO .too
w -< O i : X C)M~ C1) C\J d CO h v?C oCO C?MCMC M CO CO a I
~~1 2 N 1 1 0 0 CM i)6 c oi P- ci I c6 L 6 I: 6 ci y y 6 I C)6
llW C/ 0
0 ) CO o L o O o O Lo
LI - > CJCO (00 N
CflcoO *- >Q o o0o io 0 co oO oo 0 i0
'- O- O 00 ' 00 ' 00 0) ' 00 0) ' 00 0) ' 00 0) O 00)o ~~0c2 0 00000 ))O 0))O 00C ))O 00C
F~~~ 0 0 0) 0 ) 0 0 O 0 0) Coo 0o 0 CO 0 )CO 0 )C
w
cr. 0-0UflU) 0 U 0 C~~ ) () 0 L) 0 L( 0
I- ~ ~ JI- (0 N-~~ N- o Co C Co 0q C) 0)M
This content downloaded from 193.54.110.35 on Tue, 23 Jul 2013 09:42:43 AMAll use subject to JSTOR Terms and Conditions

150 DEMOGRAPHY, VOLUME 34-NUMBER 1, FEBRUARY 1997
I- U)I)c~ 1111 IC( 0 LOt 't c 0, ) C1) co (0o)O-
z .~~~> <?O dC C OO
o
tn)~~~ O0)'t,''-(I 6i1(.C ~.I
:E I <: L I -1 N- I I I I 1I IC) I CI )IIoIII
C)
Z 6 . U S CO CO O ~~w 0 0 t O Mo CM SOOC 0~~~ c)
.C =.O O Cs~~i C \i CO L O 0 ) LO C CCl ) C)N h00
C) Z~~~~~~~~- CD CD LO 'I C) I, C\ C, . c6 cs (6 O \ Oc c6 O c6 6 o6N
(< N- C1 c) 1C) c( 0) ( 0 10 0 o c - 6 LO
0~~~~~~~~~~66 |-o ? <1cB
co CzC U zU o o O O C O C\] CM O t o
<?0EE <- P-- c'j CO CO c J LO T C C) CCO o C) - N - C ( C\
I- cn QO cm a) c\1 c ( u6 c 0(00) 0) 0) c6 1 )C ) C1) ( o0 0 t CO W I ~< < E E
o o0
(e& -, s Oo>)@nsS ,OtO 4 | = c Lo C| N- Lo Co Co CoO Lo co co N LoL C!
0.
I- q
0O O + at ( . N 0 ( C (0 C u o o) 0 Co C! C! (0 (0o c1
0 N | n m C,.) CD C \ CO C) C It l N- LO LO '- C CO -'O- co 't c1 o
U) U a D N o L 0 Loo r co Lo CD) (10 6cv,c1 i (D -0 C
ao1 > cuI a O ) I-r O N c- Gi 6 4 c6 6 vi O r- 6 6 -: 6\ 4 : r> C6 (6 cO U
ll (
O 2 N C D Oi Oi 6 N 00 N C 00 '- C 00 00 0
04 I
U . < , -m m ) ( m 0 C--0 -- (1 0 0 C1) O co co ' tC co O LO
1 < DS ooo4O
~~~~~~~~C)~~~~~~~~~~~~, 0~~=0' 0 -0 0 clq N~~(0( -N N(0) 1)1
WOa . - v 00
N- c N-NN- N-N- N--- NNN --N --- NNN
w ci ui oi 't~iiiTT
U.~~~~~~~~U ,rn0 U)lU)0 1 I- ~ ~ JI- CQ 'i 6 6 c (0 N- N- (0 ( 0) 0 viv ~vi- ~
This content downloaded from 193.54.110.35 on Tue, 23 Jul 2013 09:42:43 AMAll use subject to JSTOR Terms and Conditions
CHANGES IN THE AGE DEPENDENCE OF MORTALITY AND DISABILITY 151
FIGURE 3. COHORT-SPECIFIC CHANGES IN THE SURVIVAL RATES OF THREE FEMALE COHORTS
100
90
80
70
60
40 1907~-191 X
C.) ~~ 50 -*---- ~~~1907-1917/12t
40
30 - x 1907-1917 3t
20 1897-1907 /3t
-10-- t1887-1897 /3t
10
0
65 70 75 80 85 90 95 100 105
Age
Note: The survival probabilities were renormed to facilitate cross-cohort comparisons.
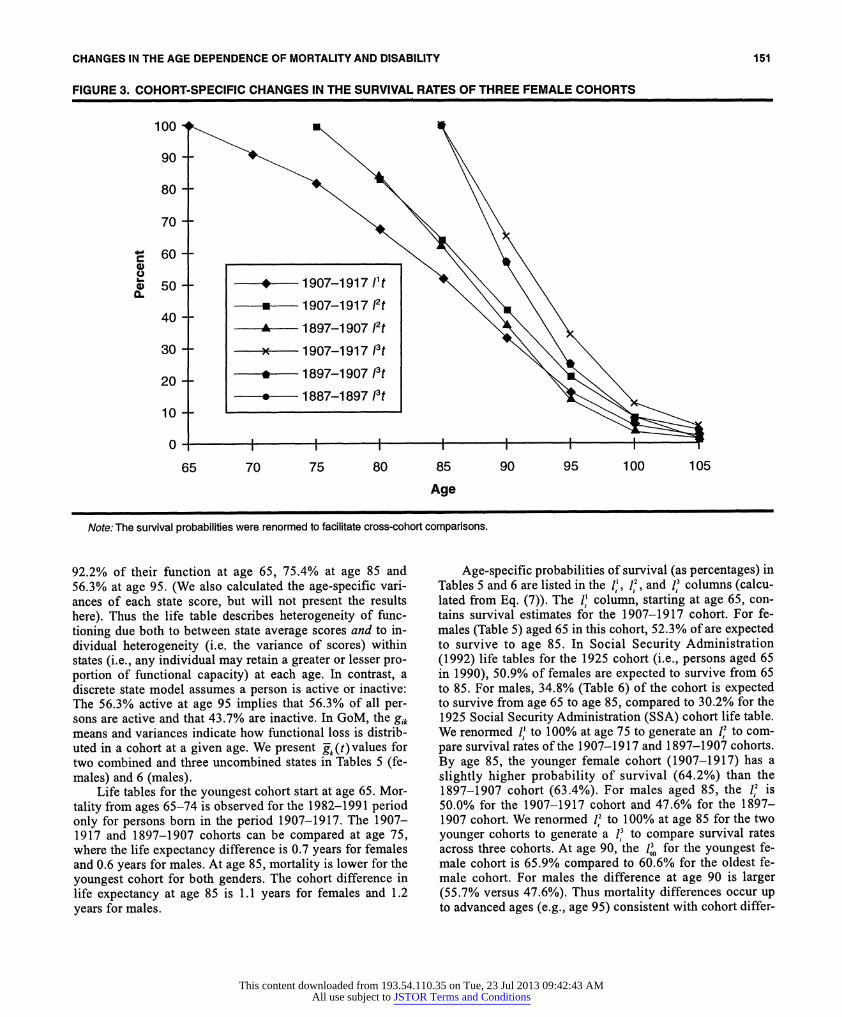
92.2% of their function at age 65, 75.4% at age 85 and 56.3% at age 95. (We also calculated the age-specific vari- ances of each state score, but will not present the results here). Thus the life table describes heterogeneity of func- tioning due both to between state average scores and to in- dividual heterogeneity (i.e. the variance of scores) within states (i.e., any individual may retain a greater or lesser pro- portion of functional capacity) at each age. In contrast, a discrete state model assumes a person is active or inactive: The 56.3% active at age 95 implies that 56.3% of all per- sons are active and that 43.7% are inactive. In GoM, the gik
means and variances indicate how functional loss is distrib- uted in a cohort at a given age. We present g-k(t) values for two combined and three uncombined states in Tables S (fe- males) and 6 (males).
Life tables for the youngest cohort start at age 65. Mor- tality from ages 65-74 is observed for the 1982-1991 period only for persons born in the period 1907-1917. The 1907- 1917 and 1897-1907 cohorts can be compared at age 75, where the life expectancy difference is 0.7 years for females and 0.6 years for males. At age 85, mortality is lower for the youngest cohort for both genders. The cohort difference in life expectancy at age 85 is 1.1 years for females and 1.2 years for males.
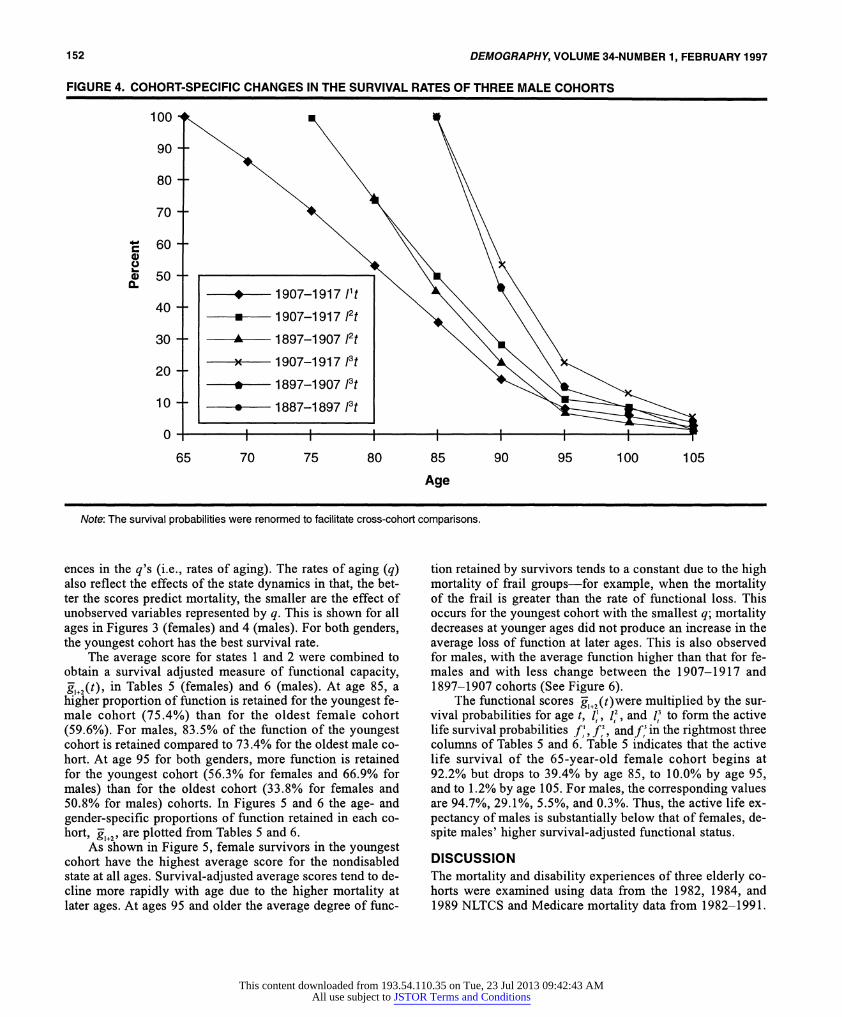
Age-specific probabilities of survival (as percentages) in Tables 5 and 6 are listed in the 1,, I,2, and 13 columns (calcu- lated from Eq. (7)). The 1' column, starting at age 65, con- tains survival estimates for the 1907-1917 cohort. For fe- males (Table 5) aged 65 in this cohort, 52.3% of are expected to survive to age 85. In Social Security Administration (1992) life tables for the 1925 cohort (i.e., persons aged 65 in 1990), 50.9% of females are expected to survive from 65 to 85. For males, 34.8% (Table 6) of the cohort is expected to survive from age 65 to age 85, compared to 30.2% for the 1925 Social Security Administration (SSA) cohort life table. We renormed 1' to 100% at age 75 to generate an 12 to com- pare survival rates of the 1907-1917 and 1897-1907 cohorts. By age 85, the younger female cohort (1907-1917) has a slightly higher probability of survival (64.2%) than the 1897-1907 cohort (63.4%). For males aged 85, the 12 is 50.0% for the 1907-1917 cohort and 47.6% for the 1897- 1907 cohort. We renormed 12 to 100% at age 85 for the two younger cohorts to generate a 13 to compare survival rates across three cohorts. At age 90, the 11,, for the youngest fe- male cohort is 65.9% compared to 60.6% for the oldest fe- male cohort. For males the difference at age 90 is larger (55.7% versus 47.6%). Thus mortality differences occur up to advanced ages (e.g., age 95) consistent with cohort differ-
This content downloaded from 193.54.110.35 on Tue, 23 Jul 2013 09:42:43 AMAll use subject to JSTOR Terms and Conditions
152 DEMOGRAPHY, VOLUME 34-NUMBER 1, FEBRUARY 1997
FIGURE 4. COHORT-SPECIFIC CHANGES IN THE SURVIVAL RATES OF THREE MALE COHORTS
100
90
80
70
60
~550 ----- 1907-1 917 lit
-u0--1907-1 917 12t 30 - 4- 1897-1907 /2t
20 - 1907-1917 /3t
- *---- 1897-1907 /3t
10 ---1887-1897 13t
0-
65 70 75 80 85 90 95 100 105
Age
Note: The survival probabilities were renormed to facilitate cross-cohort comparisons.
ences in the q's (i.e., rates of aging). The rates of aging (q) also reflect the effects of the state dynamics in that, the bet- ter the scores predict mortality, the smaller are the effect of unobserved variables represented by q. This is shown for all ages in Figures 3 (females) and 4 (males). For both genders, the youngest cohort has the best survival rate.
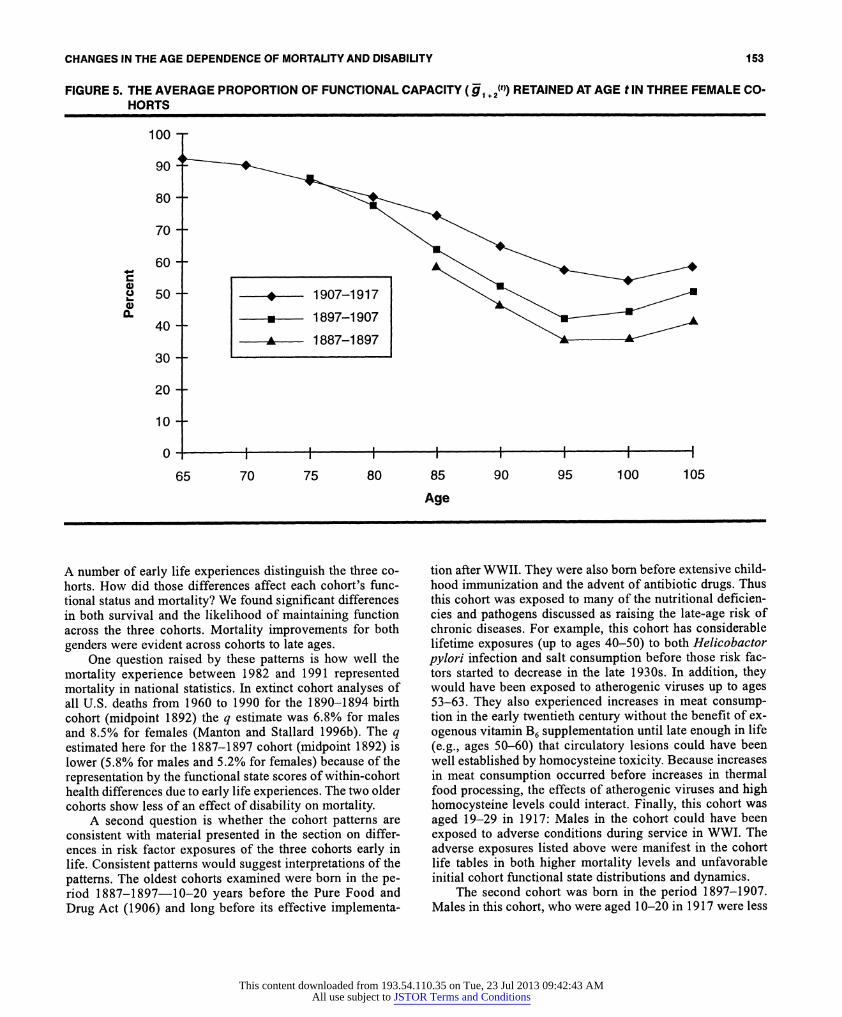
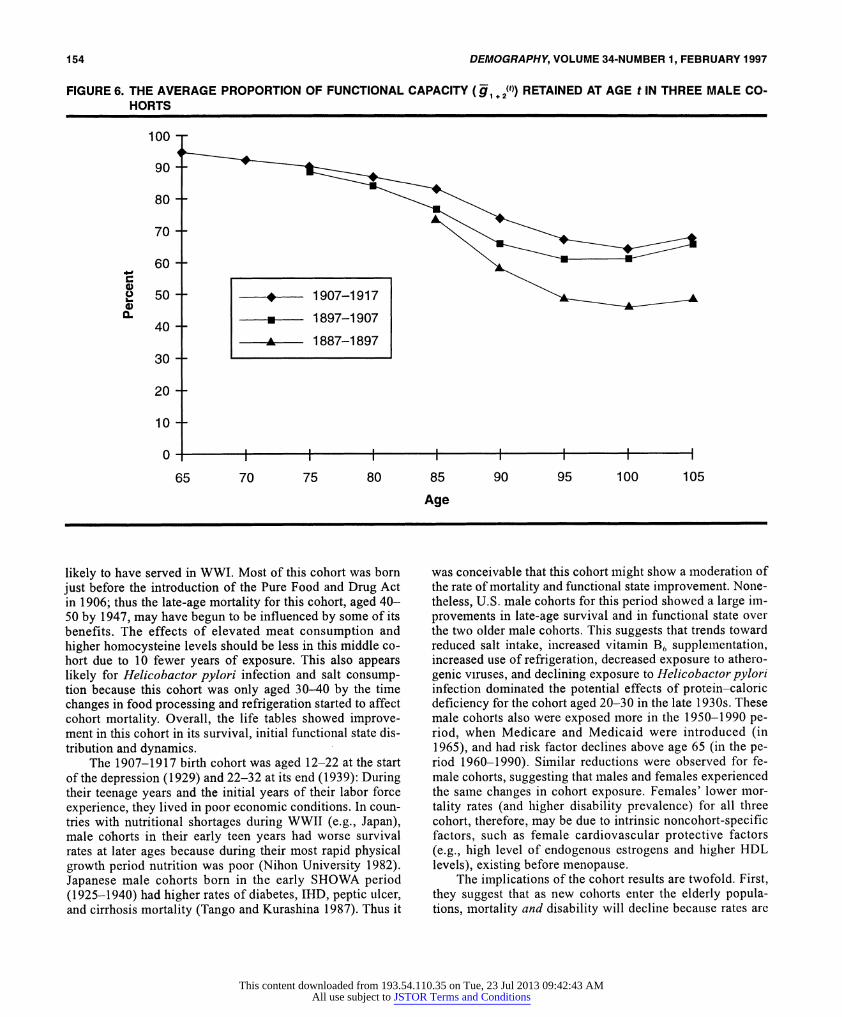
The average score for states 1 and 2 were combined to obtain a survival adjusted measure of functional capacity, k1+2(t), in Tables 5 (females) and 6 (males). At age 85, a higher proportion of function is retained for the youngest fe- male cohort (75.4%) than for the oldest female cohort (59.6%). For males, 83.5% of the function of the youngest cohort is retained compared to 73.4% for the oldest male co- hort. At age 95 for both genders, more function is retained for the youngest cohort (56.3% for females and 66.9% for males) than for the oldest cohort (33.8% for females and 50.8% for males) cohorts. In Figures 5 and 6 the age- and gender-specific proportions of function retained in each co- hort, k,+2, are plotted from Tables 5 and 6.
As shown in Figure 5, female survivors in the youngest cohort have the highest average score for the nondisabled state at all ages. Survival-adjusted average scores tend to de- cline more rapidly with age due to the higher mortality at later ages. At ages 95 and older the average degree of func-
tion retained by survivors tends to a constant due to the high mortality of frail groups-for example, when the mortality of the frail is greater than the rate of functional loss. This occurs for the youngest cohort with the smallest q; mortality decreases at younger ages did not produce an increase in the average loss of function at later ages. This is also observed for males, with the average function higher than that for fe- males and with less change between the 1907-1917 and 1897-1907 cohorts (See Figure 6).
The functional scores -1+2(t)were multiplied by the sur- vival probabilities for age t, i 1,2 . and 1,3 to form the active life survival probabilities f, f,2, andf3 in the rightmost three columns of Tables 5 and 6. Table 5 indicates that the active life survival of the 65-year-old female cohort begins at 92.2% but drops to 39.4% by age 85, to 10.0% by age 95, and to 1.2% by age 105. For males, the corresponding values are 94.7%, 29.1%, 5.5%, and 0.3%. Thus, the active life ex- pectancy of males is substantially below that of females, de- spite males' higher survival-adjusted functional status.
DISCUSSION The mortality and disability experiences of three elderly co- horts were examined using data from the 1982, 1984, and 1989 NLTCS and Medicare mortality data from 1982-1991.
This content downloaded from 193.54.110.35 on Tue, 23 Jul 2013 09:42:43 AMAll use subject to JSTOR Terms and Conditions
CHANGES IN THE AGE DEPENDENCE OF MORTALITY AND DISABILITY 153
FIGURE 5. THE AVERAGE PROPORTION OF FUNCTIONAL CAPACITY (g1 + 2(t)) RETAINED AT AGE t IN THREE FEMALE CO-
HORTS
100
90
80
70
60
504 1907-1917
30
20
10
0
65 70 75 80 85 90 95 100 105
Age
A number of early life experiences distinguish the three co- horts. How did those differences affect each cohort's func- tional status and mortality? We found significant differences in both survival and the likelihood of maintaining function across the three cohorts. Mortality improvements for both genders were evident across cohorts to late ages.
One question raised by these patterns is how well the mortality experience between 1982 and 1991 represented mortality in national statistics. In extinct cohort analyses of all U.S. deaths from 1960 to 1990 for the 1890-1894 birth cohort (midpoint 1892) the q estimate was 6.8% for males and 8.5% for females (Manton and Stallard 1996b). The q estimated here for the 1887-1897 cohort (midpoint 1892) is lower (5.8% for males and 5.2% for females) because of the representation by the functional state scores of within-cohort health differences due to early life experiences. The two older cohorts show less of an effect of disability on mortality.
A second question is whether the cohort patterns are consistent with material presented in the section on differ- ences in risk factor exposures of the three cohorts early in life. Consistent patterns would suggest interpretations of the patterns. The oldest cohorts examined were born in the pe- riod 1887-1897-10-20 years before the Pure Food and Drug Act (1906) and long before its effective implementa-
tion after WWII. They were also born before extensive child- hood immunization and the advent of antibiotic drugs. Thus this cohort was exposed to many of the nutritional deficien- cies and pathogens discussed as raising the late-age risk of chronic diseases. For example, this cohort has considerable lifetime exposures (up to ages 40-50) to both Helicobactor pylori infection and salt consumption before those risk fac- tors started to decrease in the late 1930s. In addition, they would have been exposed to atherogenic viruses up to ages 53-63. They also experienced increases in meat consump- tion in the early twentieth century without the benefit of ex- ogenous vitamin B6 supplementation until late enough in life (e.g., ages 50-60) that circulatory lesions could have been well established by homocysteine toxicity. Because increases in meat consumption occurred before increases in thermal food processing, the effects of atherogenic viruses and high homocysteine levels could interact. Finally, this cohort was aged 19-29 in 1917: Males in the cohort could have been exposed to adverse conditions during service in WWI. The adverse exposures listed above were manifest in the cohort life tables in both higher mortality levels and unfavorable initial cohort functional state distributions and dynamics.
The second cohort was born in the period 1897-1907. Males in this cohort, who were aged 10-20 in 1917 were less
This content downloaded from 193.54.110.35 on Tue, 23 Jul 2013 09:42:43 AMAll use subject to JSTOR Terms and Conditions
154 DEMOGRAPHY, VOLUME 34-NUMBER 1, FEBRUARY 1997
FIGURE 6. THE AVERAGE PROPORTION OF FUNCTIONAL CAPACITY (g1 + 2(t)) RETAINED AT AGE t IN THREE MALE CO-
HORTS
100
90
80
70
60
40 1597-1917
40
-A--- 1887-1897 30
20
10-
10
65 70 75 80 85 90 95 100 105
Age
likely to have served in WWI. Most of this cohort was born just before the introduction of the Pure Food and Drug Act in 1906; thus the late-age mortality for this cohort, aged 40- 50 by 1947, may have begun to be influenced by some of its benefits. The effects of elevated meat consumption and higher homocysteine levels should be less in this middle co- hort due to 10 fewer years of exposure. This also appears likely for Helicobactor pylori infection and salt consump- tion because this cohort was only aged 30-40 by the time changes in food processing and refrigeration started to affect cohort mortality. Overall, the life tables showed improve- ment in this cohort in its survival, initial functional state dis- tribution and dynamics.
The 1907-1917 birth cohort was aged 12-22 at the start of the depression (1929) and 22-32 at its end (1939): During their teenage years and the initial years of their labor force experience, they lived in poor economic conditions. In coun- tries with nutritional shortages during WWII (e.g., Japan), male cohorts in their early teen years had worse survival rates at later ages because during their most rapid physical growth period nutrition was poor (Nihon University 1982). Japanese male cohorts born in the early SHOWA period (1925-1940) had higher rates of diabetes, IHD, peptic ulcer, and cirrhosis mortality (Tango and Kurashina 1987). Thus it
was conceivable that this cohort might show a moderation of the rate of mortality and functional state improvement. None- theless, U.S. male cohorts for this period showed a large im- provements in late-age survival and in functional state over the two older male cohorts. This suggests that trends toward reduced salt intake, increased vitamin B, supplementation, increased use of refrigeration, decreased exposure to athero- genic viruses, and declining exposure to Helicobactorpylori infection dominated the potential effects of protein-caloric deficiency for the cohort aged 20-30 in the late 1930s. These male cohorts also were exposed more in the 1950-1990 pe- riod, when Medicare and Medicaid were introduced (in 1965), and had risk factor declines above age 65 (in the pe- riod 1960-1990). Similar reductions were observed for fe- male cohorts, suggesting that males and females experienced the same changes in cohort exposure. Females' lower mor- tality rates (and higher disability prevalence) for all three cohort, therefore, may be due to intrinsic noncohort-specific factors, such as female cardiovascular protective factors (e.g., high level of endogenous estrogens and higher HDL levels), existing before menopause.
The implications of the cohort results are twofold. First, they suggest that as new cohorts enter the elderly popula- tions, mortality and disability will decline because rates are
This content downloaded from 193.54.110.35 on Tue, 23 Jul 2013 09:42:43 AMAll use subject to JSTOR Terms and Conditions

CHANGES IN THE AGE DEPENDENCE OF MORTALITY AND DISABILITY 155
lower in younger cohorts. Second, we suggest several inter- pretations for cohort mortality differences. The disability dif- ferences might be influenced more by midrange factors (i.e., those operating in the period 1950-1990). One factor is that the youngest cohort received Medicare benefits from the time they first reached age 65. Older cohorts were less completely covered by Medicare. Alternatively, cohort differences in function could be due to the early health effects that affected mortality. Each cohort lived different lengths of time in the 1900-1950 period for which we documented improvements in micro- and macronutrients affecting chronic disease mor- bidity. The slower age increases of mortality and disability rates in the younger cohort are consistent with the cohort's greater exposure after 1950-from an average age of 38 years for the youngest cohort to an average age of 58 years for the oldest cohort. Even younger cohorts may have better mortality and disability rates because considerable chronic disease risk is fixed by age 38.
Cohort differences could be more accurately assessed with data on additional older and younger cohorts. The ef- fects of changes in health care might be observed using data on older cohorts: For example, the effects of Medicare are limited by the amount of time the cohort lives past 1965. The effects of increased vitamin B6 reduced vitamin D, and changes in health care might be observed using data on younger cohorts, who spent more time in the period when such nutritional changes occurred. The 1994 NLTCS will help to examine the effects of recent changes in biomedical technologies by extending the time of observation of these and additional cohorts and by covering more recent periods.
REFERENCES Antiplatelet Trialists' Collaboration. 1994. "Collaborative Over-
view of Randomized Trials of Antiplatelet Therapy-I: Preven- tion of Death, Myocardial Infarction, and Stroke by Prolonged Antiplatelet Therapy in Various Categories of Patients." British Medical Journal 308:81-106.
Antonovsky, A. 1968. "Social Class and the Major Cardiovascular Diseases." Journal of Chronic Diseases 21:65-106.
Bishop, M.C. 1994. "Treatment of Advanced Prostate Cancer." The Lancet 343:110-11.
Bourgeois-Pichat, J. 1978. "Future Outlook for Mortality Declines in the World." Population Bulletin of the United Nations Num- ber 11.
Buja, L.M. And J.T. Willerson. 1994. "Role of Inflammation in Coronary Plaque Disruption." Circulation 89(1):503-505.
Cooper, G.R., G.L. Myers, S.J. Smith, and R.C. Schlant. 1992. "Blood Lipid Measurements: Variations and Practical Utility." Journal of the American Medical Association 267(12):1652-60.
Correa, P. et al. 1975. "A Model for Gastric Cancer Epidemiol- ogy." The Lancet 2:58-60.
Davis, C.E., B.M. Rifkind, H. Brenner, and D.J. Gordon. 1990. "A Single Cholesterol Measurement Underestimates the Risk of Coronary Heart Disease: An Empirical Example from the Lipid Research Clinics Morality Followup Study." Journal of Ameri- can Medical Journal 264:3044-46.
Dubos, R. 1965. Man Adapting. New Haven: Yale University Press.
Elayda, M.A.A., R.J. Hall, R.M. Reul, D.M. Alonzo, N. Gillette, G.J. Reul, and D.A. Cooley. 1993. "Aortic Valve Replacement in Patients 80 Years and Older: Operative Risks and Long-Term Results." Circulation 88(Part 2):11-16.
Farnsworth, T.A. and D. Heseltine. 1993. "Treatment of Elderly Hypertensives: Some Questions Remain Unanswered." Age and Ageing 22:1-4.
Fogel, R.W. 1994. "Economic Growth, Population Theory, and Physiology: The Bearing of Long-term Processes on the Mak- ing of Economic Policy." American Economic Review 84(3): 369-95.
Forman, D. 1991. "Helicobacter Pylori Infection: A Novel Risk Factor in the Etiology of Gastric Cancer." Journal of the Na- tional Cancer Institute 83(23): 1702-1703.
Frankel, S., P. Elwood, P. Sweetnam, J. Yarnell, and G.D. Smith. 1996. "Birthweight, Body-Mass Index in Middle Age, and Inci- dent Coronary Heart Disease." The Lancet 348:1478-80.
Gordon, D.J., J.L. Pobstfield, R.J. Garrison, J.D. Neaton, W.P. Castelli, J.D. Knoke, D.R. Jacobs, S. Bangdiwala, and H.A. Troyler. 1989. "High-Density Lipoprotein Cholesterol and Car- diovascular Disease: Four Prospective American Studies." Cir- culation 79:8-15.
Hansson, L.E., 0. Nyren, A.W. Hsing, R. Bergstrom, S. Josefsson, W.H. Chow, J.F. Fraumeni, and H.O. Adami. 1996. "The Risk of Stomach Cancer in Patients with Gastric or Duodenal Ulcer Disease." New England Journal of Medicine 335(4):242-80.
Hosking, M.P., M.A. Warner, C.M. Lodbell, K.P. Offord, and L.J. Melton. 1989. "Outcomes of Surgery in Patients 90 Years of Age and Older." Journal of the American Medical Association 261:1909-15.
Iso, H., D.R., Jacobs, Jr., D. Wentworth, J.D. Neaton, and J.D. Cohen. 1989. "Serum Cholesterol Levels and Six-Year Mortal- ity from Stroke in 350,977 Men Screened for the Multiple Risk Factor Intervention Trial." New England Journal of Medicine 320(14):904-10.
Jacobs, D, Blackburn, H, Higgins, M, Reed, D, Iso, H, McMillan, G, Neaton, J, Nelson, J, Potter, J, Rifkind, B, Rossouw, J, Shekelle, R and Yusuf, S. "Report of the conference on low blood cholesterol: Mortality association." Circulation 86(3): 1046-1060, 1992.
Joossens, J.V. 1968. "La Relation Entre 1'Epidemiologie des Acci- dents Cerebro-Vasculaires et du Cancer de l'Estomac." L'evo- lution Medicale 12:381-85.
Joossens, J.V. and J. Geboers. 1983. "Epidemiology of gastric can- cer: A Clue to Etiology." Pp. 97-113 in Precancerous Lesions of the Gastrointestinal Tract, edited by P. Sherlock, B.C. Morson, L. Barbari, et al. New York: Raven Press.
Joossens, J.V., M.J. Hill, P. Elliott, R. Stamler, J. Stamler, E. Lesaffre, A. Dyer, R. Nichols, and H. Kesteloot, (European Can- cer Prevention (ECP) and the INTERSALT Cooperative Re- search Group). "Dietary Salt, Nitrate, and Stomach Cancer Mor- tality in 24 Countries." International Journal of Epidemiology 25(3):494--504.
Kalon, K.L., K.M. Anderson, W.B. Kannel, W. Grossman, and D. Levy. 1993. "Survival After the Onset of Congestive Heart Fail- ure in Framingham Heart Study Subjects." Circulation 88(1): 107-15.
This content downloaded from 193.54.110.35 on Tue, 23 Jul 2013 09:42:43 AMAll use subject to JSTOR Terms and Conditions

156 DEMOGRAPHY, VOLUME 34-NUMBER 1, FEBRUARY 1997
Kaplan, E.L. 1993. "Global Assessment of Rheumatic Fever and Rheumatic Heart Disease at the Close of the Century. Influences and Dynamics of Populations and Pathogens: A Failure to Real- ize Prevention?" Circulation 88(4): 1964-72.
Kaplan, G.A. And J.E. Keil. 1993. "Socioeconomic Factors and Cardiovascular Disease: A Review of the Literature." Circula- tion 88(4):1973-98.
Kelijman, M. 1991. "Age-Related Alterations of the Growth Hor- mone/Insulin-Like-Growth-Factor I Axis." Journal of the American Geriatrics Society 39:295-307.
Kitagawa, E. and P. Hauser. 1973. Differential Mortality in the United States: A Study in Socio-Economic Epidemiology. Bos- ton: Harvard University Press.
Ko, W., J.P. Gold, R. Lazzaro, J.A. Zelano, S. Lang, O.W. Isom, and K.H. Kreiger. 1992. "Survival Analysis of Octogenarian Patients with Coronary Artery Disease Managed by Elective Coronary Artery Bypass Surgery Versus Conventional Medical Treatment." Circulation 86(Suppl. II):191-97.
Kullback, S. and R.A. Leibler. 1951. "On Information and Suffi- ciency." Annals of Mathematical Satistics 22:79-86.
Law, M.R., S.G. Thompson, and N.J. Wald. 1994. "Assessing Pos- sible Hazards of Reducing Serum Cholesterol." British Medical Journal 308:373-79.
Levine, G.N., J.F. Keaney, and J.A. Vita. 1995. "Cholesterol Re- duction in Cardiovascular Disease." New England Journal of Medicine 332(8):512-21.
Linnanmaki, E., M. Leinonen, K. Mattila, M.S. Nieminen, V. Valtonen, and P. Saikku. 1993. "Chlamydia Pneumoniae-Spe- cific Circulating Immune Complexes in Patients with Chronic Coronary Heart Disease." Circulation 87(4): 1130-34.
Maggioni, A.P., A. Maseri, C. Fresco, M.G. Franzosi, F. Mauri, E. Santoro, and G. Tognoni. 1993. "Age Related Increase in Mor- tality Among Patients with First Myocardial Infarctions Treated with Thrombolysis." New England Journal of Medicine 329(20): 1442-48.
Manton, K.G., L.S. Corder, and E. Stallard. 1993. "Estimates of Change in Chronic Disability and Institutional Incidence and Prevalence Rates in the U.S. Elderly Population from the 1982, 1984, and 1989 National Long Term Care Survey." Journal of Gerontology: Social Sciences 47(4):S 153-66.
Manton, K.G., ES. Cornelius, and M.A. Woodbury. 1995. "Nurs- ing Home Residents: A Multivariate Analysis of Their Medical, Behavioral, Psycho-Social and Service Use Characteristics." Journal of Gerontology: Biological Sciences and Medical Sci- ences 50(5):M242-5 1.
Manton, K.G. and E. Stallard. 1988. Chronic Disease Modeling: Measurement and Evaluation of the Risks of Chronic Disease Processes. London: Charles Griffin Ltd. - 1992. "Demographics (1950-1987) of Breast Cancer in Birth Cohorts of Older Women." Journal of Gerontology 47:32- 42.
1995. "Program Payment and Utilization Trends for Medi- care Beneficiaries with Disabilities." In Persons with Disabili- ties; Issues in Health Care Financing and Service Delivery, ed- ited by J.M. Wiener, SB. Clauser, and D.L. Kennell. Washing- ton, DC: Brookings Institution.
1996a. "Change in Health, Mortality, and Disability and
the Impact on Long Term Care." Copublished simultaneously in Journal ofAging and Social Policy 7(3/4):25-52 and pp. 25-52 in From Nursing Homes to Home Care, edited by M.E. Cowart and J. Quadagno. Binghampton, NY: Haworth Press.
. 1996b. "Longevity in the U.S.: Age and Sex Specific Evi- dence on Life Span Limits from Mortality Patterns: 1962- 1990." Unpublished manuscript. Center for Demographic Stud- ies, Duke University.
Manton K.G., E. Stallard, and L.S. Corder. 1997. "Education Spe- cific Estimates of Life Expectancy and Age Specific Disability in the U.S. Elderly Population: 1982 to 1991." Journal ofAging and Health.
Manton K.G., E. Stallard, and B.H. Singer. 1992. "Projecting the Future Size and Health Status of the U.S. Elderly Population." International Journal of Forecasting 8:433-58.
. 1994. "Methods for Projecting the Future Size and Health Status of the U.S. Elderly Population." Pp. 41-77 in Studies of the Economics of Aging, edited by D. Wise. Chicago: Univer- sity of Chicago Press for National Bureau of Economic Re- search.
Manton K.G., E. Stallard, and H.D. Tolley. 1991. "Limits to Hu- man Life Expectancy: Evidence, Prospects, and Implications." Population and Development Review 1 7(4):603-38.
Manton K.G., E. Stallard, and J.W. Vaupel. 1986. "Alternative Models for the Heterogeneity of Mortality Risks Among The Aged." Journal of the Anmerican Statistical Association 81:635- 44.
Manton K.G., E. Stallard, M.A. Woodbury, and J.E. Dowd. 1994. "Time-Varying Covariates in Models of Human Mortality and Aging: Multidimensional Generalization of the Gompertz." Journal of Gerontology: Biological Sciences 49:B 169-90.
Manton K.G., M.A. Woodbury, E. Stallard, and L.S. Corder. 1992. "The Use of Grade of Membership Techniques to Estimate Re- gression Relationships." Pp. 321-81 in Sociological Methodol- ogy.
Manton K.G., M.A. Woodbury, and H.D. Tolley. 1994. Statistical Applications Using Fuzzy Sets. New York: John Wiley & Sons.
Martyn, C.N., D.J.P. Barker, and C. Osmond. 1996. "Mothers' Pel- vic Size, Fetal Growth, and Death from Stroke Andcoronary Heart Disease in Men in the U.K." The Lancet 348:1264-68.
McCully, K.S. 1983. "Homocysteine Theory of Arteriosclerosis: Development and Current Status." Atherosclerosis Review 2:157-246.
Melnick, J.L. and A. Schattner. 1992. "Viruses and Atherosclero- sis." Israel Journal of Medical Science 28:463-65.
Moon, J., B. Bandy, and A.J. Davison. 1992. "Hypothesis: Etiol- ogy of Atherosclerosis and Osteoporosis: Are Imbalances in the Calciferol Endocrine System Implicated." Journal of the Amleri- can College of Nutrition 11 (5):567-83.
Moser, M. 1991. "An Overview of the Meta-Analysis of the Hy- pertension Treatment Trials Commentary." Archives of Internal Medicine. 151:1277-79.
Mozar, H.N., D.G. Bal,and S.A. Farag. 1990. "The Natural History of Atherosclerosis: An Ecologic Perspective." Atherosclerosis 82:157-64.
Muhlbaier, L.H., D.B. Pryor, S. Rankin, L.R. Smith, D.B. Mark, R.H. Jones, D.D. Glower, F.E. Harrell, K.L. Lee, R.M. Califf,
This content downloaded from 193.54.110.35 on Tue, 23 Jul 2013 09:42:43 AMAll use subject to JSTOR Terms and Conditions

CHANGES IN THE AGE DEPENDENCE OF MORTALITY AND DISABILITY 157
and D.C. Sabiston. 1992. "Observational Comparison of Event- Free Survival with Coronary Artery Disease: 20 Years of Fol- low-Up." Circulation 86(5):198-204.
Multiple Risk Factor Intervention Trial Research Group. 1990a. "Mortality Rates After 10.5 Years for Participants in the Mul- tiple Risk Factor Intervention Trial." Journal of the American Medical Association 263:1795-1801.
. 1990b. "Mortality After 10.5 Years for Hypertensive Par- ticipants in the Multiple Risk Factor Intervention Trial." Circu- lation 82:1616-28.
Myers, G.C. 1981. "Future Age Projections and Society." Pp. 248- 60 in Aging: A Challenge to Science and Social Policy, edited by A.G. Gilmore. New York: Oxford University Press.
National Center for Health Statistics. 1964. "The change in Mor- tality Trends in the United States." Public Health Service, Se- ries 3 No. 1. Washington, DC: National Center for Health Sta- tistics.
. 1995. Health, United States, 1994. Hyatsville, MD: Public Health Service.
Nightingale, T.E. And J. Gruber. 1994. "Helicobacter and Human Cancer." Journal of the National Cancer Institute 86(20): 1505- 1509.
Nihon University. "Population aging in Japan: Problems and policy issues in the 21st century." In International Conference on an Aging Society: Strategies for the 21st Century Japan, edited by T. Kuroda. Japan: Nihon University Population Research Insti- tute.
Omran, A.R. 1971. "The Epidemiologic Transition: A Theory of the Epidemiology of Population Change." Milbank Memorial Quarterly XLIX(4):509-38.
Parsonnet, J. 1995. "The Incidence of Helicobacter pylori Infec- tion." Alimentary Pharmacology and Therapeutics 9(2):45-41.
Prasad, K.N. and J. Edwards-Prasad. 1992. "Vitamin E and Cancer Prevention: Recent Advances and Future Potentials." Journal of the American College of Nutrition 1 (5):487-500.
Salive, M.E., J. Guralnik, R.J. Glynn, W. Christen, R.B. Wallace,
and A.M. Ostfeld. 1994. "Association of Visual Impairment with Mobility and Physical Function." Journal of the American Ge- riatrics Society 42:287-92.
Shinton, R. and G. Sagar. 1993. "Lifelong Exercise and Stroke." British Medical Journal 307:231-34.
Social Security Administration. 1992. Life Tables for the United States Social Security Area 1900-2080 Actuarial study 107. So- cial Security Administration (SSA Pub No. 11- 11536), August.
Sonnenberg, A. 1995. "Temporal Trends and Geographical Varia- tions of Peptic Ulcer Disease." Alimentary Pharmacology and Therapeutics 9(2):3-12.
Tango, T. and S. Kurashina. 1987. "Age, Period and Cohort Analy- sis of Trends in Mortality from Major Diseases in Japan, 1955 to 1979: Peculiarity of the Cohort Born in the Early Showa Era. Statistics in Medicine 6:709-26.
Taylor, A. 1993. "Cataract: Relationships Between Nutrition and Oxidation. Journal of the American College of Nutrition 12(2): 138-46.
Tsugane, S., Y. Tei, T. Takahashi, S. Wtanabe, and K. Sugano. 1994. Salty Food Intake and Risk of Helicobacter pylori Infection." Japanese Journal of Cancer Research 85:474-78.
Virchow, R. 1856. Phlogose und Thrombose im Gefass-System. Frankfurt: Gesammelte Abhandlungen zur Wissenschaftlichen Medizin.
Woodbury, M. 1963. "Inapplicability of Bayes Theorem of Diag- nosis." Fifth Intemational Conference of Medical Electronics. Liege, Belgium.
Woodbury, M.A. and K.G. Manton. 1977. "A Random Walk Model of Human Mortality and Aging." Theoretical Population Biol- ogy 11:37-48.
. 1983. "A theoretical model of the physiological dynamics of circulatory disease in human populations." Human Biology 55:417-41.
. 1989. "Grade of Membership Analysis of Depression-Re- lated Psychiatric Disorders." Sociological Methods and Re- search 18(l):126-63.
This content downloaded from 193.54.110.35 on Tue, 23 Jul 2013 09:42:43 AMAll use subject to JSTOR Terms and Conditions