changes in nitrogen fertilizer cost positions investment caps margin and creates long term price...
TRANSCRIPT

Changes in Nitrogen Fertilizer Cost Positions
Dr Dimitrios Dimitriou

Agenda
Nitrogenous Fertilizer Value Chain
Drivers for Developing Nitrogenous Fertilizer Capacity
Natural Gas Prices
Oil Price Influence on Natural Gas Prices
Cost Curve at Low Oil Environment
Cost Curve at Medium Oil Environment
Cost Curve at High Oil Environment
New Natural Gas Production Locations
Summary
2

Nitrogen Fertilizers Overview
3
Fertilizer Value Chain Fertilizer Types
Type N content (%)
Ammonia 82.2 (N)
Urea 46 (N)
AN 32 - 35.5 (N)
CAN 26 – 30 (N)
UAN 28 – 32 (N)
TSP 46 (P)
MAP 11(N):48(P)
DAP 18(N):46(P)
NPK varies
Phosphate Rock
Natural Gas
Potassium Chloride
(Potash)
Dolomite
Phosphoric
Acid
Nitric
Acid
DAP
MAP
Urea
AN
CAN
UAN
NPK
Compounds
and
Bulk Blends
Ammonia
Sulphuric Acid
Source : Nexant

Raw material costs typically make up the largest proportion of a
producer’s total costs per ton of output.
4
Source : Nexant
Variable Costs
Fixed Costs
Freight &
Handling Costs
Duties
Margin
Price
Low Gas / Coal
Prices
Low Labour &
Financing Costs
Location close to
target markets
Trade within duty
free zones
Goal Maximise
Minimise
Most Influential
Factors
Producers have no influence on prices but can aim to lower costs in order to
maximise margins.
Investment decisions are typically driven by expected high achievable margins
(excl. political motivations).
Cost of
Production and
Marketing
Choices
Supply/Demand
+
=

During market upturn high cost producers generate positive margin.
5
Leader L
aggard
Leader margin
Price
All capacity operates
$/ton
Cumulative Capacity
Price Setting in Supply Limited Environment
Laggard
margin
New investment caps margin and creates long term price ceiling

Laggards set prices in demand limited environment.
6
Leader
Laggard
Leader margin
Price at margin producer’s cost
Market Demand
$/ton
Cumulative CapacityIdle Capacity
Price Setting in Demand Limited Environment
Lower cost of production will also increase a company’s competitiveness.

Global crude oil price have been rather volatile particularly in recent
history.
Brent Crude in Constant 2015 US Dollars
How are natural gas prices affected around the world?
7
0
20
40
60
80
100
120
140
1985 2001 2017
Dol
lars
per
Bar
rel
Brent Crude History Brent Crude $100/bbl Brent Crude $70/bbl Brent Crude $40/bbl
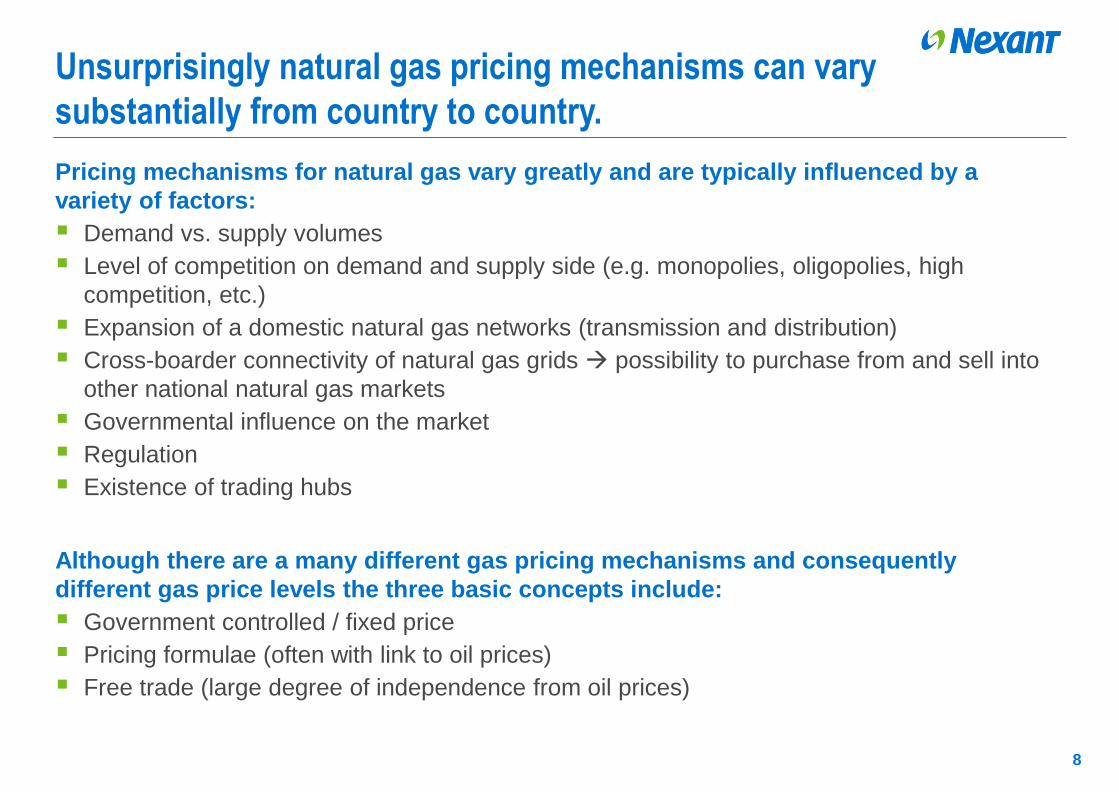
Unsurprisingly natural gas pricing mechanisms can vary
substantially from country to country.
Pricing mechanisms for natural gas vary greatly and are typically influenced by a
variety of factors:
Demand vs. supply volumes
Level of competition on demand and supply side (e.g. monopolies, oligopolies, high
competition, etc.)
Expansion of a domestic natural gas networks (transmission and distribution)
Cross-boarder connectivity of natural gas grids possibility to purchase from and sell into
other national natural gas markets
Governmental influence on the market
Regulation
Existence of trading hubs
Although there are a many different gas pricing mechanisms and consequently
different gas price levels the three basic concepts include:
Government controlled / fixed price
Pricing formulae (often with link to oil prices)
Free trade (large degree of independence from oil prices)
8

Volatility in crude oil prices has different effects on individual
pricing mechanisms.
Government controlled / fixed price Little to no effect
Pricing formulae (often with link to oil price) Medium to high effect depending on
individual formulae
Free trade – low to medium effect depending on energy mix structure and energy /
feedstock substitution options
Pricing mechanisms (and levels) in individual countries can also change for various
reasons:
US & WE – move towards free (hub) trade of natural gas
Indonesia – move towards LNG netback pricing
Middle East – Step increase of fixed prices due to various factors (e.g. demand increase)
Various natural gas pipeline transition countries move to netback pricing from end-
consuming markets.
As such cost curves are dynamic and change constantly depending on natural gas
prices (and other cost factors).
9

Lack of global market and the social importance of gas leads to
different pricing mechanisms in different regions.
…
10
Regulated
Market prices at
wholesale level
Regulated
Market prices at
wholesale level
Combination of market
prices and some oil linkage
Regulated / imports
oil linked
Regulated / imports
oil linked
Regulated / imports
often market priced
North America
~$2-3/MMBtu
South America
$3-4/MMBtu
Western Europe
$6/MMBtuCIS
~$1.5-3/MMBtu
North East Asia
~$5-6/MMBtu
South East Asia
$9/MMBtu
Middle East
$1.25-2.5/MMBtu
West Africa
$0.5-1.5/MMBtu
North Africa
~$3-4/MMBtu
The concept of “stranded” gas gives rise to pricing below that of major fertilizer markets but logistics is an issue.
Source: Nexant – Strategic Business AnalysisSource : Nexant
2015

Gas price has tracked oil price in Europe, but has decoupled from
oil price in the US
European gas price is in transition, whereas U.S. gas has already decoupled from oil since 2008.
11
WE Crude Oil and Gas Prices(1990 – Q22015)
U.S. Crude Oil and Gas Prices(1990 – Q22015)
0
2
4
6
8
10
12
14
0
20
40
60
80
100
120
140
1990 1994 1998 2002 2006 2010 2014
Dol
lars
per
MM
BT
U
Dol
lars
per
Bar
rel
Brent CrudeNatural Gas (MMBtu)
0
2
4
6
8
10
12
14
0
20
40
60
80
100
120
140
1990 1994 1998 2002 2006 2010 2014
Dol
lars
per
MM
BT
U
Dol
lars
per
bar
rel
WTI(Dollar per Barrel)Natural Gas (HH, MMBtu)
Decoupling of U.S.
gas and oil; Impact
of Shale Gas
Source : Nexant

0
100
200
300
400
500
600
700
800
900
2004 2005 2006 2007 2008 2009 2010 2011 2012 2013 20142015.1 2015.3 2016.1
Dol
lar
per
Ton
USGC,fob
NWE,c&f
Far East,c&f
Black Sea,fob
Arab Gulf,fob
Global urea prices continued to decline in the second quarter of
2016 as a result of continued oversupply.
Prices in export regions are typically lower than in import regions reflecting the cost of
freight.
Despite this, investment in nitrogen is on-going…….
12

Integrated urea cash cost margins also decreased globally due to
global oversupply and low urea prices.
Margins for the Middle East Leader (feedstock not linked to oil prices) have been
decreasing due to rise of feedcost cost and lower product prices.
The profitability gap between lowest and highest cost producers has
been slashed resulting in a flatter industry curve.13
-200
-100
0
100
200
300
400
500
600
700
800
2003 2004 2005 2006 2007 2008 2009 2010 2011 2012 2013 2014 2015 2016
Dol
lars
per
ton
United States (Leader) Western Europe (Leader)Middle East China CoastalChina mine mouth

Indicative global cash cost curve on low oil based on a “typical”
plant representing the average plant in the respective global region.
At low oil environment oil the global cash cost curve is rather flat indicating lower
margins.
In a low oil price environment the US and several Middle Eastern
countries has a lower feedstock advantage.
14

Indicative global cash cost curve medium oil based on a “typical”
plant representing the average plant in the respective global region.
The steepness of the global cash cost curve increases with a higher oil price.
Gas prices in most countries still have a correlation to crude oil
prices.
15

Indicative global cash cost curve at high oil based on a “typical”
plant representing the average plant in the respective global region.
Countries with fixed gas prices or largely decoupled natural gas prices have a higher
cost advantage in a high crude oil price scenario.
An increase in oil price often does not have a strong effect on the
positioning of individual countries on the cash cost curve.
16

Competition, trade flows and cost curves will also be influenced by
new market entrants.
Nitrogenous fertilizer production and sales are often an attractive option for monetizing
natural gas reserves.
Countries with new and developing natural gas industries could potentially increase
global competition, alter trade flows and change positions of individual producers on
the cost curve.
Major new recent natural gas finds & potential new feedstock locations?
17

Summary
Competitive landscape of nitrogen industry has changed with range of production
costs narrowing as a result of lower energy prices. This makes it hard to locate
industry margins.
Cost of raw materials / natural gas is typically the largest component in determining cost of
production for nitrogenous fertilizers.
Lowering cost of production increases margins as well as enhances competitiveness.
A low oil prices scenario typically results in a flatter cost curve shrinking the competitive
advantage of low cost producers which have low degree of oil linkage.
An increase in oil price typically results in a steeper cost curve with considerable difference
in producer’s margins and competitiveness.
Potential new low cost producers in different parts of the world can alter trade flows,
increase competition and even push high cost producers out of the market.
Traditional low cost producers look out for opportunities elsewhere such as improving
operational efficiency and cost, downstream value chain optimisation.
18

Nexant provides support to management and investors
in the energy and chemical industries
19<Insert job number using 'Insert - Header & Footer'> <Insert date using ‘Insert – Header & Footer’>
Nexant Training
Commercial and
Market Analysis
Technology Evaluation
and Management
Project Finance
Merger and
Acquisition
Energy Independent
Expert/Litigation
and Expert Witness
Nexant Thinking
Strategic Planning Project Feasibility