changes in land cover and land use and carbon dynamics in ... · conceitos de pesquisa de...
TRANSCRIPT

Changes in land cover and land use and carbon dynamics in a frontier in expansion in
western Amazonia, Acre, Brazil
Foster BrownWHR C/UFAC
Conceitos de pesquisa de sustentabilidade e de proteção da Floresta Amazônica/ Simpósio científico no contexto do Ano Brasil-Alemanha de Ciência, Tecnologia e
Inovação 2010/2011,
University of Applied Sciences, Hamburg, Germany
04 March 2011GOES12
02mar11 1445
www.cptec.inpe.br1

A conversation in 1991
• Well-known scientist from Pará: “Foster, where are you going?”
• Foster: “To Acre.”
• Scientist: “To that end of the world?”
• Who wants to take care of the ‘end of the world?’
• As a result, we began a concerted effort to portray Acre as the Center of the World (later of the Universe).
http://earthobservatory.nasa.gov/Features/BlueMarble/Images/BlueMarble_2005_SAm_09_4096.png2

Beware what you wish for…
you may get it.
http://earthobservatory.nasa.gov/Features/BlueMarble/Images/BlueMarble_2005_SAm_09_4096.png
Former end
of the world
3

250 km
1.000 km
750 km500 km
Acre -centric
More people (~30 million) reside within 750 km of Acre than live
in the entire Brazilian Amazon (or in metropolitan Rio de Janeiro).
Most of them speak Spanish, Quechua or Aymara.
They are just an Interoceanic highway away.
Acre
Govenro do Acre 20094

Acre and contiguous Madre de Dios, Peru and Pando, Bolivia (MAP Region): A disproportional share of mega-investment experiments.
(sources: M. Steinenger/ NASA, various)
Beni
CobijaRondônia
Pando
Lago Titicaca
Acre
HIghwayIñapari- Pacific–US$ 810 millon
UHE St. Antonio3,600 MW
UHE Jirau3,900 MW
UHE Binational3,000 MW
US$ 10 billion
HIghwayGuayaramerin-Yucumo US$460 millon
PuertoMaldonado
4,000 km de Navegable Rivers
Rio Branco
Highway toCruzeiro do SulUS$ 250 millon
Inambari Dam
2,000 MW
US$ 4 billion.
Iberia
CachuelaEsperanza1,000 MW
5

Inambari
CachuelaEsperanza
Binacional
Sto. Antonio
Jirau
15+ billion dollar experiment of hydroelectric dams being constructed
or planned for SW Amazonia.
RioBranco
Cobija
PuertoMaldonado
ACRE
MADRE DE DIOS
PANDO
6

Acre – epicenters for two majordroughts – 2005 and 2010
2005 2010
7

One of the focal areas for the drop in net primary production is Acre
Acre
8

Feijó, Acre, Brasil 20-21 de março de 2009
Observations of Indigenous Leaders in Acre
9

Concerns of the Nova Vida Shanenawa village, 20mar09 before the drought de 2010.
10

Observations of Brazil nut gathers and rubber tappers
from Madre de Dios, Acre and Pando – 19Oct10, Iberia,
Madre de Dios.
11

Madre de Dios
12

Acre
13

Pando
14
A philosophical question
Is the burden of proof on those who would say that
these climate perturbations are a result of our
geophysical experiments or on those who would say that they are not a result of our geophysical experiments?
http://en.wikipedia.org/wiki/ The_Thinker
15

Most recently, Experiment of fixing global geophysical
experiments. Memorandum of Understanding (MOU) between Acre and California
to develop subnational agreements on carbon credits (Nov10)
Acre Agencia, nov1016

http://earthobservatory.nasa.gov/Features/BlueMarble/Images/BlueMarble_2005_SAm_09_4096.png
Getting back to carbon and land cover change.Nothing is created or destroyed, all is transformed .
(a more poetic description of the law of mass conservation).
Carbon in the landscape or political unit ≈ carbon in biomass + carbon in soil
17

http://earthobservatory.nasa.gov/Features/BlueMarble/Images/BlueMarble_2005_SAm_09_4096.png
A mass-balance approach for a stratified landscape or political unit
1
2
3
45 (… n)
C = carbon in the landscape, Av = Area of component v, zv = soil
depth with carbon exchange to/from the atmosphere, Bv = biomass per
unit volume, fv fraction of carbon in biomass, ρv = soil density, Sv = soil
carbon fraction. (Brown et al. 2001)
[it is possible to integrate Bv by zv to create Bv by area.]18

http://earthobservatory.nasa.gov/Features/BlueMarble/Images/BlueMarble_2005_SAm_09_4096.png
Conceptual model based on elementary calculus – differentiating with respect to
time. (Brown et al. 2001)
Carbon
flux
associated
with a
landscape
or political
unit (Acre)
Change in
area (dA/dt)
(1)
Change in
biomass (dB/dt)
(fixed area)
(2)
Change from
soil carbon
transport
(3)
Change in
soil carbon
(4)
Deforestation.
Pasture
>>sugar cane,
Expansion of
bamboo
Secondary growth,
mature forest
dynamics, logging,
fire impact.
Erosion/
Deposition
Decomposition
Fixation
19

Carbon fluxes associated with biomass in a landscape.
1
2
34
5
Fire
LoggingGrowth/
Mortal.
De-
forestation
dB x Area
dt
dA x (difference in carbon contents)
dt
pasture forest
Other factor: time interval for integration:1 yr, 10 yrs, 100 yrs.
http://earthobservatory.nasa.gov/Features/BlueMarble/Images/BlueMarble_2005_SAm_09_4096.png20

Carbon dynamics in Acre (integrating over a year)
Type of flux Process Scale of Area Estimates
dA/dt Deforestation 102 to 103 km2/yr~ 6 million tC/yrSee subsequent
slides
dA/dtBamboo expansion/
contraction105 km2 ?
dB/dt Logging activity 104 km2 ?
dB/dt Forest fires 103 km2 ~3 million tC in 2005 (?)
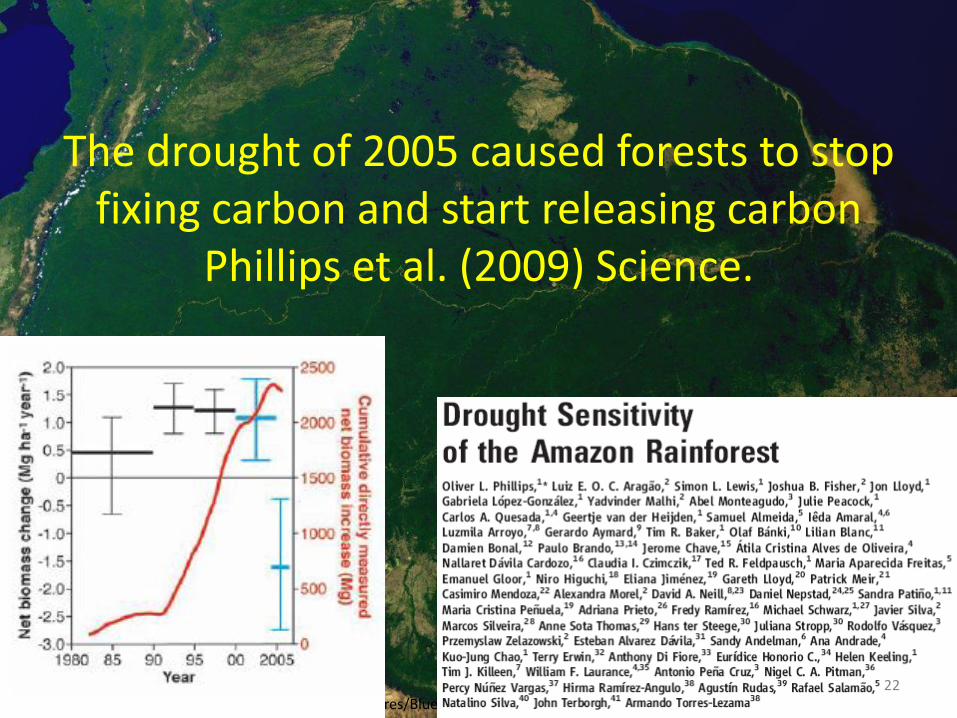
dB/dtDrought
impacts/carbonsequestration
105 km2
~+/- 7 million tC/yr(see SOM Phillips et
al. 2009)
dB/dt Forest regrowth 103 km2 ? 21
http://earthobservatory.nasa.gov/Features/BlueMarble/Images/BlueMarble_2005_SAm_09_4096.png
The drought of 2005 caused forests to stop fixing carbon and start releasing carbon
Phillips et al. (2009) Science.
22

Estimated deforestation by 2030 following a Business-As-Usual projection (adapt. Soares et al. 2006)
23

Acre Government Goals for Reduced Emissions
from Deforestation (RED)
0
200
400
600
800
1000
1200
14001
99
5
19
96
19
97
19
98
19
99
20
00
20
01
20
02
20
03
20
04
20
05
20
06
20
07
20
08
20
09
20
10
20
11
20
12
20
13
20
14
20
15
20
16
20
17
20
18
20
19
20
20
Km2 / ano Redução km2
Média histórica 2 (2001 - 2010)
Média histórica 1 ( 1996 - 2005)
Média histórica 3 (2006 - 2015)
Linha de base 1
Linha de base 2
Linha de base 3
Variables 2006-2010 2011-2015 2016-2020 TOTAL
Base line (km2/yr) 602 514 255
Goal of avoided deforestation (km2) 1.438 1.108 655 3.200
Avoided Deforestation (km2) 1.570 1.460 618 3.649
Avoided Emissions in the state (tCO2) 57.462.000 53.447.302 22.635.166 133.544.468
Proposed Avoided Emissions in Pirority Areas (tCO2 ) 62.500.000 Gov. Acre 201024

05out05, Leste do Acre
Carbon fluxes from deforestationmore complex than appear.
• The previous graph generated from data from INPE and assuming 100 tC/ha carbon density (alive aboveground biomass)
• 123 tC/ha (derived from Salimon et al. Sub.)
• Dead and belowground biomass carbon not included – systematic difference of ~30%. (Brown et al. 1992).
• Difference (123 tC/ha x 1.3 / 100 tC/ha - 1) = + 60%
• Is the reported carbon flux the real carbon flux in REDD projects?
• Official deforestation rates also often diverge.
25

Comparison of INPE and Acre State deforestation rates
20%
45%
-5%
-35%
15%
45%
110%
6%
-27%
37%
Relative differences in Acre State deforestation rates between PRODES/INPE and Acre-Imazon (Brown et al. in sub.)
26
05out05Leste do Acre
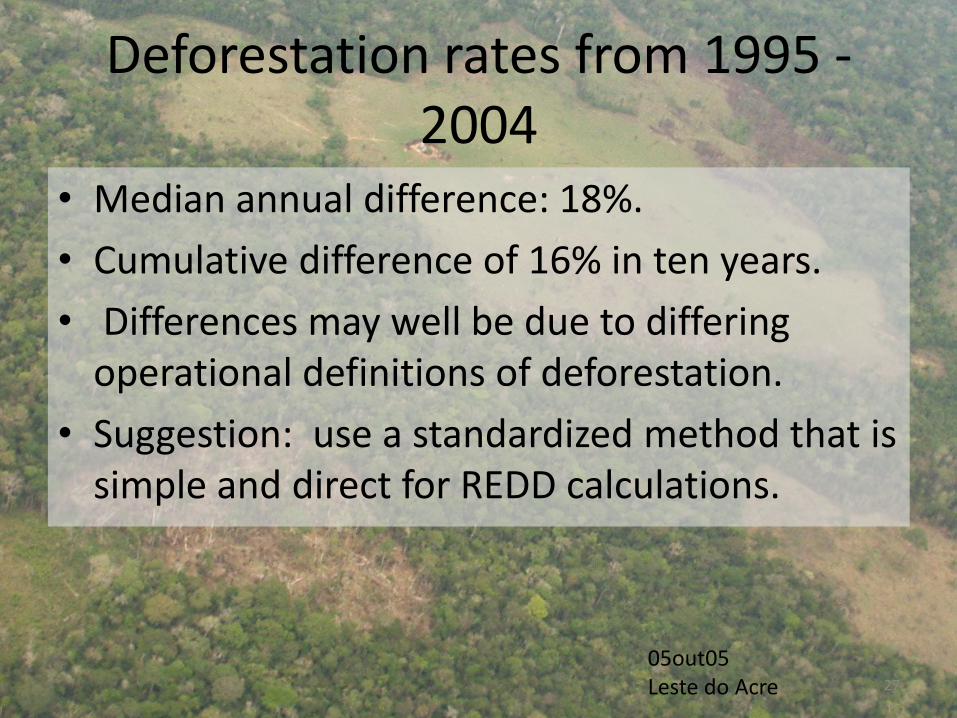
Deforestation rates from 1995 -2004
• Median annual difference: 18%.
• Cumulative difference of 16% in ten years.
• Differences may well be due to differing operational definitions of deforestation.
• Suggestion: use a standardized method that is simple and direct for REDD calculations.
27

Is estimating the carbon dynamics the main goal, or is determining the
importance of forests for climate?
• What about transpiration services, avoiding aerossols from biomass burning, etc?
• They increase the importance of maintaining forests, but also increase the uncertainty of measurements.
• A situation similar to measuring the impact of air travel.
28

Conclusions
• Be careful what you wish for – Acre has become the center of the world– Crossroads for mega-investments in dams and interoceanic highways
– Epicenter for droughts and reduced net primary production
– Subnational discussions of carbon credits and REDD
• Carbon dynamics in Acre becoming increasingly influenced by dB/dt – changing carbon stocks due to climate and fire impacts, with implications for those who depend on forest productivity.
• Estimates of landcover change are most accurately made for multi-year periods. 29

Thank you/Obrigado!Foster Brown
Woods Hole Research Center /
Universidade Federal do Acre
[email protected]/[email protected]
55-68-9984-0336Parroquia, Iberia, Madre de Dios, Perú
09Mai200930