changes in employment in the principal industrial fields: january 1
TRANSCRIPT

This PDF is a selection from an out-of-print volume from the NationalBureau of Economic Research
Volume Title: Business Cycles and Unemployment
Volume Author/Editor: Committee of the President's Conferenceon Unemployment, and a Special Staff of the National Bureau
Volume Publisher: NBER
Volume ISBN: 0-87014-003-5
Volume URL: http://www.nber.org/books/comm23-1
Publication Date: 1923
Chapter Title: Changes in Employment in the Principal IndustrialFields: January 1, 1920 to March 31, 1922
Chapter Author: Willford I. King
Chapter URL: http://www.nber.org/chapters/c4663
Chapter pages in book: (p. 80 - 100)

CHAPTER VI
CHANGES IN EMPLOYMENT IN THE PRINCIPALINDUSTRIAL FIELDS
JANUARY 1, 1920 TO MARCH 31, 1922
WILLFORD I. KING
NATIONAL BUREAU OF ECONOMIC RESEARCH
I. THE COMPARATIVE MEASURABILITY OF EMPLOYMENT ANDUNEMPLOYMENT
How important was the reduction in the volume of employmentbrought about by the decline in business activity occurring between1920 and 1922? The object of this chapter is to answer the abovequestion.'
In Chapter IV, W. A. Berridge has derived an index number showingthe fluctuations in employment which. have occurred in recent years,but he makes no attempt to measure the absolute amount of unemploy-ment at any time. In taking this course, he is following the precedentaccepted by most statisticians. The fact is that unemployment is sodifficult to define that there are likely to be as many definitions as thereare writers on the subject. There may, however, be some points onwhich accord is possible. Most persons, presumably, would say thatonly those desiring gainful employment can be subject to unemployment.But who are those that seek gainful employment? Experience showsthat thousands of persons are on the border line. Many women workintermittently. The same holds true of many old men and boys. Thenumber seeking gainful work is then, at best, subject only to approxima-tion and not to accurate measurement.
Furthermore, even if the number seeking employment could beascertained, how could we determine when an individual was involun-tarily idle? Is the man who is sick unemployed? Granted that he is,if he remains disabled for years, does he still continue in this status?Shall we count an aged man whose health permits him to work onlyoccasionally as unemployed for the remainder of the time? How shallwe class the striker? What about the man who is eager for work at$1.00 an hour but refuses work at half the pay?
'More detailed information concerning this query and also regarding earnings andhours worked is to be found in the report of the National Bureau of Economic Researchentitled, "Employment, Hours, and Earnings in Prosperity and Depression."
78

EMPLQYMENT IN 1920-1922 79
True, arbitrary rules can be made to fit all of these cases, but theshould not be overlooked that these rules must be empirical and
may represent the exact views of few but the framers. As Mr. Wolman;hows in a later chapter, the British have worked out elaborate definitions
use in the administration of unemployment insurance. TheseJefinitions are, however, exceedingly complex and require constantinterpretation and expansion.
Since it is so difficult to obtain a definite measure of unemployment,it is desirable to attack the problem from another angle. For a longbime Massachusetts has furnished monthly records of the number ofpersons on the pay-rolls of part or all of the factories in that state. Therehas been a marked growth during recent years in the available supplyof this type of statistics.
Owing to the difficulty of defining unemployment, we mayhesitate to attempt a statistical measurement, but in these pay-rollrecords have we not a source of accurate information concerningemployment?
One can safely say that pay-roll records represent perfectly definitefacts and that their use eliminates most of the difficulties connectedwith definitions and subjective opinions. If pay-roll statistics areavailable in complete form, one can ascertain not only the fluctuations inthe number of persons on the pay-roll but also the changes occurringin the number of employee-hours worked. With complete data of thissort at hand, it would certainly be possible to answer the query madeat the beginning of this chapter and show the magnitude of the cyclicalvariations in employment.
However, until very recent years, as Miss Van Kleeck points outin Chapter XIX, the data of this sort available have been decidedly scanty.Recent statistics from other states have proved that records for Massa-chusetts factories indicate reasonably well the course of factory employ-ment in the country as a whole, and hence we can estimate with someconfidence the course of factory employment for several decades;' butcan we assume that fluctuations in factory pay-rolls are representativeof the oscillations occurring in agriculture, in merchandising, in banks,or in public utilities? Such an assumption takes too much for granted.Is it not equally probable that every decline in the combined factorypay-roll is met by an increase in the pay-roll of some other industrialfield? Further, are we sure that changes in the numbers on the pay-rolls are reasonably good indications of changes in the volume of employ-ment, even in the manufacturing field, when we remember that Mr.Brissenden's figures, recorded in the preceding chapter, indioate thatpart-time employment plays an important role?
'Perhaps estimates for years previous to 1920 might also be successfully madeupon the basis of Edmund E. Day's indexes of physical production.

80 BUSINESS CYCLES AND UNEMPLOYMENT
With so many queries unanswered, it is not surprising that, evenamong experts, there has been great divergence of opinion concerningthe volume of unemployment in any period of depression. Estimatesof the number idle in 1921 have varied by several millions. The needfor a quantitative measurement is illustrated well by Mr. Wolman'sdescription of the experience of the British Government in financingits unemployment insurance fund, and by the difficulty that Mr. Malleryfound in securing data suitable for measuring the wage diminutionsduring a depression so that he could compare this quantity with the sizeof the potential public works reserve fund.'
II. THE SCOPE AND METHOD OF THE PRESENT INVESTIGATION
The need of more complete knowledge along this line seemed sogreat that, in planning the present report, a nation-wide inquiry wasundertaken with the purpose of securing the requisite information.The leading results of this investigation appear in the following pages.The specific questions which this inquiry was designed to answer are asfollows:
1. Do the high wages characterizing boom times lead many womenand others not normally engaged in gainful occupations temporarilyto work for wages or salaries?
2. Are fluctuations in different industries complementary, so thatthe total amount of employment in all fields remains approximatelyconstant? For example, do agricultural laborers or the sons anddaughters of farmers or other small employers become employees infactories during boom times and return to their former callings when thedepression sets in?
3. Are the fluctuations in factory employment—the only field forwhich we have records—characteristic of the fluctuations in the entireindustrial field including agriculture, merchandising, finance, transpor-tation, and the hand trades?
4. Are changes in the number of persons on the pay-rolls good indica-tors of the variations occurring in the total volume of employment,or are such variations materially affected by the existence of part-timeand overtime employment?
5. Is the existence of much part time or overtime widespread oris it mainly confined to a few industries?
6 Are large and small scale enterprises affected by unemploymentto about the same relative extent?
Three questionnaires were devised in the hope of obtaining thematerial necessary to answer the above queries. The first schedulewas designed to secure directly from employees information showing thetime they lost through various causes; their hours of work, pay, and family
'Sec Chaps. XVIII and XIV.

EMPLOYMENT IN 1920-1922 81
ncome. The effort to secure an adequate number of voluntary enumera-who would canvass employees and obtain records of their employ-
rnent was not a success. Since the funds available did not permit ofbhe hiring of any considerable number of enumerators, this inquiry wasaot pushed and the results obtained have but slight value.
The second questionnaire was distributed through the courtesy ofbhe Federal Bureau of Markets and Crop Estimates to their TownshipDrop Reporters. It asked for the occupations followed during the lastbwo years by members of farmers' families and also for the number ofDmployees hiredby each farmer, the hours they worked, and the wages'they received. Some 8,500 schedules were returned, most of which wereround to contain usable information.
The third questionnaire asked employers in other industries to furnishLnformation similar to that requested of farmers. The United StatesCensus Bureau assisted materially in distributing these schedules.Numerous teachers of economics and a few other teachers and theirstudents, a considerable number of secretaries of Chambers of Commerce,
a large number of individual business men devoted much time, effort,expense to assisting in the collection of the data.
The Bureau of Railway Economics furnished practically completedata for the railways. The United States Chamber of Commercecircularized its members in behalf of the study. In addition to suchvoluntary efforts, paid enumerators obtained numerous records fromemployers in the cities of New York, Chicago, and St. Louis. In all,uearly 3,000 satisfactory records were obtained, covering all sections of theUnited States and most of the important fields of industry. The scheduleswere edited and verified by the National Bureau of Economic Research,
the Bureau of the Census assumed the burden of tabulating the data.Manifestly, a large proportion of all the records received, especially
•n the case of smaller concerns, rest upon estimates rather than uponLctual accounts. The estimates, however, relate to things concerningwhich the employer, as a rule, is far from ignorant; hence there is little
to suppose that accidental errors in the estimates have materially%ffected the accuracy of the averages. The belief that the estimates are;ubstantially accurate is supported by the fact that, in almost everyLndustry, the reported data show but a small scatter.
It is highly probable that the changes shown by the data are morebypical than are the absolute sizes of some of the quantities. In manyLnstances, for example, an employer cannot estimate very accurately thethsolute number of hours worked per week by his employees, but he isikely to know approximately how much the average working day hasncreased or diminished in a given period.
'For wage records see the detailed report entitled, "Employment, Hours, andEarnings in Prosperity and Depression."
6

82 BUSINESS CYCLES AND UNEMPLOYMENT
Another question of moment is whether enough reports have beendeliberately falsified to vitiate the averages. We have no guarantee ofcourse that some such cases have not occurred, but it is believed that thefact that the schedules were obtained under the auspices of the Bureauof the Census and that assurance was given to informants that all informa-tion would be considered confidential has minimized any tendency tofalsification which might otherwise have existed. The similarity of theitems in the reports received from different employers in the same busi-ness leads one to believe that the results are reasonably dependable.
It also is worthy of mention that schedules collected from similarestablishments by hired enumerators and those collected by mail leadto identical conclusions regarding tendencies within any given field ofemployment. The pay-roll data secured from factories show the samegeneral trend that appears in similar records published by governmentaldepartments, both state and federal. On the whole, then, the evidenceseems to be sufficient to warrant the belief that the results of this inquiryare for the most part reliable.
IlL RESULTS
Records were secured from employers who hire about one-tenth of allthe employees in the United States. However, the proportion differsradically in different industries, a fact that is illustrated by the entriesin Table XV. Under these circumstances, a total or average of all thesamples would be highly misleading. To secure significant results, ithas been necessary to reweight all of the items according to the number ofworkers employed in the industry in question. The process followed hasbeen first to estimate the ratio of the total number of employees in theUnited States falling in the given category on August 15, 1920 to thenumber who on the same date were working for the reporting employ-ers, and then to multiply all items of earnings or hours by these ratios.In this manner, a record is obtained which portrays, as accurately as thedata will permit, the results for the Continental United States. Owingto the paucity of existing information concerning the number of employeesworking for large and for small scale enterprises in such fields as the handtrades, public, domestic, and professional service, or commerce and trade,the weights used may sometimes be very faulty, but, fortunately, thenature of the data is such that it is almost certain that errors arisingfrom this source will not invalidate any of the major conclusions of thestudy.
Fortunately, answers have been secured for all six of the questionspreviously cited as the goal of this study.
Tables XVI and XVII show no indication that there has been anynoticeable migration from one industry to another of the sons anddaughters either of farmers or of other employers. All that is apparent is

XV
.—A
N E
STIM
AT
E O
F T
HE
PE
R C
EN
TS
OF
AL
L E
MPL
OY
EE
S IN
TH
E V
AR
IOU
S IN
DU
STR
IAL
FIE
LD
S W
Ho
WE
RE
WO
RK
ING
ON
AU
GU
ST 1
5, 1
920
FOR
TH
E E
MPL
OY
ER
S FR
OM
WH
OM
RE
POR
TS
WE
RE
RE
CE
IVE
D
Indu
stry
Size
of
ente
r-pr
ise
asm
easu
red
byth
e nu
mbe
rof
em
ploy
ees
Est
imat
edth
ousa
nds
IN
umbe
rof
empl
oyed
empl
oyee
sby
actu
ally
empl
oyer
sw
orki
ng in
res
pond
ing
to th
isen
tire
inqu
iry
Est
i—m
aced
per
cent
of a
llem
-pl
oyee
sw
orki
nglo
gfo
r re
port
-in
gem
ploy
ers
Indu
stry
Size
of
ente
r-pr
ise
asm
easu
red
byth
e nu
mbe
rof
em
ploy
ees
Est
imat
edth
ousa
nds
ofem
ploy
ees
actu
ally
wor
king
inen
tire
u. s
.
Num
ber
empl
oyed
byem
ploy
ers
resp
ondi
ngto
this
inqu
iry
Est
i—m
ated
per
cent
of a
llem
-pl
oyee
sw
orki
ngjo
gfo
r re
port
-in
gem
ploy
ers
AU
indu
stri
es
{
Agr
icul
ture
{
Ext
ract
ion
of m
iner
als.
{
Fac
tory
wor
k{ I
Bui
ldin
gan
d co
nstr
uetiO
fl
Oth
er b
and
trad
es
Any number
Les
stha
n2l
21
to 1
00O
ver100
Less
than
21
Any number
21 to 100
Over 100
Less than 21
Any number
21 to 100
Over 100
Any number
Less than 21
21
to 1
00O
ver100
Any number
Less
than
21
21 to
100
Ove
r100
Any
num
ber
Les
s th
an 2
121
to 100
Over 100
29,1
8010
.110
4,630
14,4
40
2,120
2,
130
50 60
140
920
1,360
1,950
8,06
0
570
530
500
553c
280
160
110
3,14
6,68
225
,113
36,521
3,08
5,04
8
14,171
14 705
272
262
26
56,771
320
56,425
581,879
2,672
16,902
562,
305
1,400
497
462
441
1,370
439
630
301
10.7
8402
480789
21.3
64
0.668
0. 639
0.209
0.52
4
0.0433
5.068
0.22
86
133
5.118
0.196
0.867
6.97
60.0875
0.
0872
0.0871
0.08
820.
249
0. 1
560.
393
0.273
'
{T
rans
port
atio
n
Com
mer
ceand trade.
{ JF
inan
ce
1 {P
ublic
and professional 8cr-
Dom
estic
and personal 5cr-
{
vice
Lessthan2l
Any number
21 to 100
Over 100
Less than 21
Any number
21 to 100
Over 100
Any number
Lessthan2l
21
to 1
00O
ver
100
Any number
Less than 21
21 to 100
Over
100
Les
sthan 21
Any
num
ber
21to 100
Over 100
400
3,
220
2,800
1,650
400
550
4038
150
100
150
3,009i
1.6
00 400
1,000
1,92
060
0300
549
2.301,636
3,361
2,297,726
5.558
137,202
11,256
120,388
29,758
483
2,061
27,2
142,45487
188
2,179
631
19,507
1,06
91
0.137
67. 299
0.153
82.062
0. 337
5.277
2.814
21.889
7•439
0.322
2.061
18.1
420.0818
0.
0054
40.
047
0.2179
0.03
280.691
0.17
85.
936
Est
imat
es o
f nu
mbe
r of
em
ploy
ees
and
thei
r ap
port
ionm
ent p
roba
bly
clos
e to
the
trut
thT
otal
num
ber
of e
mpl
oyee
s ap
prox
imat
ely
corr
ect,
but a
ppor
tionm
ent m
ay b
e w
idel
y in
err
or.
Est
imat
es v
ery
roug
h.
00

TA
BL
E X
VI.
—D
IsT
wlr
nnoN
BY
TN
DU
ST
RIE
SIN
192
0—19
22O
FPE
RSO
NS
WH
O I
N 1
922
Wrn
tiiM
EM
Brn
tS O
FT
UE
FA
MIL
IES
OF
RE
POR
TIN
G E
NT
RE
PRE
NE
UR
S (E
XC
LuD
ING
FA
RM
ER
S) A
ND
WH
O W
ER
E 1
6Y
EA
RS
OF
AG
E O
R O
VE
R I
N 1
9220
Sex
Indu
stry
1920
1921
1922
Firs
tSe
cond
Thi
rdFo
urth
Firs
tSe
cond
Thi
rdFo
urth
Firs
tqu
arte
rqu
arte
rqu
arte
rqu
arte
rqu
arte
rqu
arte
rqu
arte
rqu
arte
rqu
arte
r
All
indu
stri
es1,
415
1,41
51,
415
1,41
41,
414
1,41
41,
415
1,41
51,
415
Agr
icul
ture
163
175
219
168
165
177
220
172
169
Ext
ract
ion
of m
iner
als
46
44
46
55
5
Fact
ory
wor
k14
714
514
714
514
814
815
014
814
9.
Bui
ldin
g an
d co
nstr
uctio
n70
7374
7068
6972
6868
Mac
Oth
er h
and
trad
esT
rans
port
atio
n92 14
90 1592 16
89 1691 15
92 1693 17
90 1690 16
Com
mer
ce a
nd tr
ade
615
615
626
616
616
616
629
622
621
Fina
nce
1919
1918
2019
1920
18
Publ
ic a
nd p
rofe
ssio
nal s
ervi
ce22
2224
2322
2122
1717
.D
omes
tic a
nd p
erso
nal s
ervi
ceN
ot g
ainf
ully
occ
upie
dIn
dust
ry u
nkno
wn
8616
3 20
8714
8 20
91 82 21
89 157 19
87 159 19
8914
3 18
92 74 22
89 148
20
8815
2 22A
ll in
dust
ries
487
487
487
487
487
487
487
487
487
Agr
icul
ture
11
32
11
32
1
Fact
ory
wor
k17
1618
1616
1618
1616
Oth
erha
ndtr
ades
1212
1212
1212
1313
13
Fem
ale
Tra
nspo
rtat
ion
Com
mer
ce a
nd tr
ade
2 702 70
272
2 702
712 71
272
2 702 72
Fina
nce
Publ
ic a
nd p
rofe
ssio
nal s
ervi
ce...
3 3r3
373
365 39
3,39
339
536
341
3 40D
omes
tic a
nd p
erso
nal s
ervi
ce29
3134
3231
3335
3231
Not
gai
nful
ly o
ccup
ied
Indu
stry
unk
now
n29
0 2628
9 2628
3 2428
4 2528
8 2428
7 2328
221
285 23
286 23
a F
emal
esw
orki
ng o
n th
e ho
me
farm
are
as "
Not
Gai
nful
ly O
ccup
ied.
"

TA
BL
E X
VII
.—T
IIE
NU
MB
ER
or
ME
MB
ER
S O
F 8,
477
RE
PRE
SEN
TA
TW
Ea
FAR
ME
RS'
FA
MIL
IES
Wao
WE
RE
16
YE
AR
S O
F A
GE
OR
OV
ER
IN
192
2A
ND
TH
E I
ND
UST
RIE
S IN
WH
ICH
TH
EY
HA
D B
EE
N E
MPL
OY
ED
a In
form
atio
nob
tain
ed f
rom
the
Crop
Rep
orte
rs o
f th
e U
. S.Department
of A
gric
ultu
re.
appr
oxim
atel
y co
rrec
t pro
port
ions
.A
ll 8e
CtiO
flS
of th
e C
ontin
enta
l Uni
ted
Stat
es r
epre
sent
ed in
indu
stry
1920
.19
211922
Firs
tSe
cond
Thi
rdFo
urth
Firs
tSe
cond
Thi
rdFo
urth
Firs
tqu
arte
rqu
arte
rqu
arte
rqu
arte
rqu
arte
rqu
arte
rqu
arte
rqu
arte
rqu
arte
r
Alli
ndus
trie
s14
,643
14,6
4314
,643
14,6
4314
,642
14,6
4114
,639
14,6
3714
,637
Agriculture
11,671
12,312
12,993
11,810
11,717
12,324
12,909
11,786
11,739
Ext
ract
ion
ofminerals
30
24
28
37
38
32
44
46
51
Fact
ory
prod
uctio
n10
090
93
107
100
73
8394
88Construction
102
99
113
104
85
113
134
124
98
Ma e
Other hand trades
Transportation
Commerce and trade
Finance
161
197
273
64
125
174
220
58
134
192
232
60
152
198
277 69
163
201
295
67
131
182
249
63
125
191
265
66
138
197
311 75
165
198
32570
Public and professional service
Domestic and personal service
Notgainfullyoccupied
Industry
unkn
own
Allthdustries
406
22
1,484
133
6,614
278 16
1,126
121
6,614
221 29
423
125
6,612
380 23
1,371
115
6,612
405
24
1,423
124
6,611
287 22
1,057
108
6,611
225
31
444
122
6,611
423
26
1,290
127
6,609
420
26
1,336
121
6,60
9Agriculture
Extraction
of m
iner
als
Fact
ory
prod
uctio
n
26
15
29
15
43 12
29 15
28 15
32
16
48 13
32
19
34 18
F m
ale
C
Con
stru
ctio
nO
ther
han
d tr
ades
Tra
nspo
rtat
ion
Com
mer
ceand
trad
eFi
nanc
e
25 26 126 9
27 2612
8 8
27 3014
5 9
27 29 134 10
27 29 130 11
26 31 134 10
28 31 152 8
27 31 145 8
27 31 137 8
!
Publ
ic a
nd p
rofe
ssio
nal s
ervi
ceD
omes
tic a
nd p
erso
nal s
ervi
ceM
otga
inIu
llyoc
eupi
edIn
dust
ry u
nkno
wn
603 64
5,68
3 37
553 67
5,72
3 38
228 79
6,004 35
650
715,610 37
664 75
5,596
36
604 74
5,651 33
245 88
5,96
5 33
716 81
5;51
3 37
722
845,
508 40

86 BUSINESS CYCLES AND UNEMPLOYMENT
a growth in numbers in almost every industry, the growth doubtless beingdue to the fact that many of the younger boys and girls working in 1922finished school during the period under consideration. The recordsreceived furnish, then, no evidence whatever that any material part ofthe additional force of employees recruited in boom times by manufac-turers or other large scale employers is drawn from the households ofsmall employers, farmers, or others working on their own account.
Table XVIII measures the estimated changes in the total number olhours worked by different classes of farm employees in the differenisections of the United States. Though one is impressed by the verygreat seasonal fluctuations in agricultural employment, there is no evi-dence of any startling change brought about by the business cycle!There was apparently a slight tendency for farmers to hire feweiemployees during the depression. There is certainly no evidence thaithe farmers took on any considerable number of the workers whom thcfactories, mines, and railways laid off. Since the sample of farms securedis large enough to be representative this conclusion seems to rest onfirm foundation and strengthens the indications given by the figures per•taming to business men's families that the depression was accompanied b3a striking decline in the total volume of employment in the United States
Table XIX records the estimated numbers of employees who were orthe pay-rolls of the various industries in each quarter. The last columiof the table shows the per cent of change in this number taking placbetween the peak and trough of the cycle. Allowance has been madfor the seasonal variations in many industries.1 The figures show thatbusiness depression brought about a reduction in the number employed iievery industry except the hand trades and the trivial increase in that ornfield is scarcely sufficient to keep pace with the growth of population.reduction in all industries amounted to about 4,000,000 workers orone-seventh of all persons employed at the crest of the 1920 boomThere is, however, a striking difference between industries in the degreito which they were affected. Mines, steam railways, anddealing in metals, metallic, and miscellaneous products lost very larg4fractions of their employees, while the construction industry and factorie:in general, with the exception of paper and printing establishments, alshad a notable falling off in the numbers employed. On the other handthe records for agriculture, finance, public utilities,2 and wholesali
1 [n such industries, (namely agriculture, building and construction, other hantrades, public, professional and domestic service, transportation, wholesale trade, amestablishments manufacturing food, drink, tobacco, lumber, paper, and deriveproducts) the per cents stated represent the maximum declines between corresponding quarters of 1920 and 1921 or of 1920 and 1922. This same procedure ifollowed in other tables of this chapter.
2 See sub-title "Other Transportation" in all tables. This item include8 telephones and telegraphs.

TA
BL
E X
VII
L—
EM
PL0Y
EE
-uom
ts W
OR
KE
D P
ER
WE
EK
ON
AO
FR
EPR
ESE
NT
AT
IVE
FtutMs
OF
ThE
CO
NT
INE
NT
AL
UN
ITE
D
STATES
Sex
Em
ploy
ees
wor
king
by
Num
ber
offa
rms
enum
erat
ed
Sect
ion
of th
eU
nite
d St
ates
1920
1021
1922
Firs
tqu
arte
rSe
cond
quar
ter
Thi
rdqu
arte
rFo
urth
quar
ter
.
Firs
tqu
arte
rSe
cond
quar
ter
Thi
rdqu
arte
rFo
urth
quar
ter
Firs
tqu
arte
r
Male
p 1 1
Fem
ale
Month...
Day
J
Wee
k....
j
Day
6,348
988
2,557
2,136
667
5,978
905
2,417
2,000
656
5,687
833
2,258
1,960
636
5,629
835
2,218
1,940
636
EntireU.S
Northeast
North Central
South
West
Entire ILLS
Northeast
NorthCentral
South
West
EntireU.S
Northeast
North Central
South
West
Entire U.S
Northeast
North Central
South
West
222,582
51,700
59,142
88,075
23.665
128,176
22,890
15,126
76,237
13,923
26,836
6,700
7,051
11,450
1,635
31,528
4,864
3,527
21,803
1,334
306,022
64,126
96,542
109,101
36,253
189,078
38,211
34,216
91,205
25,446
32,804
7,818
9,235
13,417
2,334
43,365
7,071
5,426
28,643
2,225
336,664
74,929
107,793
109,336
44,606
303,803
65,945
79,051
103,163
55,644
37,100
10,505
11,245
12,358
2,992
56,815
14,294
7,199
29,573
5,749
260,342
60,485
75,642
96,640
27,675
189,105
38,564
35,108
88,922
26,511
28,756
7,716
7,503
12,003
1,534
41,663
7,642
4,135
25,999
3,887
218,639
52,467
56,244
86,713
23,215
121,269
23,412
15,720
68,407
13,730
25,996
6,427
6,162
11,874
1,533
25,261
4,433
3,421
16,021
1,386
301,533
66,901
91,360
106,869
36,403
195,994
39,870
37,142
92,827
26,155
32,100
7,889
8,849
13,211
2,151
42,409
7,018
4,793
27,953
2,645
329,119
76,449
100,717
106,824
45,129
300,839
66,606
75,095
103,
681
54,557
36,4
4410
,040
10,327
13,083
2,994
52,338
14,840
7,376
25,024
5,098
255,650
61,987
71,846
94,443
27,3
74185,794
39,469
32,613
86,680
27,032
28,131
7,734
6,77
912,012
1,606
36,659
6,936
4,095
22,694
2,934
220,421
53,663
55.851
87,252
23,655
129,931
23,316
17,309
75,342
13,964
28,337
6,705
6,741
13,141
1,750
27,134
3,610
3,406
18,628
1,490
C '-4 :2:
)-4
Co b3 -J

TA
BL
E X
IX.—
AN
EST
IMA
TE
FO
R T
HE
UN
ITE
D S
TA
TE
S O
F T
HE
TO
TA
LO
F E
MPL
OY
EE
S O
N T
HE
PA
Y-R
OL
LS
OF
AL
L E
NT
ER
PRIS
ES
OF
WH
AT
EV
ER
SIZ
E
cx 00
Indu
stry
Tho
usan
ds o
femployees
on th
e pa
y-ro
llsMatzfiurn
cyclical
decl
ine
Cpe
r ce
nt)
1920
1921
1922
Firs
tSe
cond
Thi
rdFo
urth
Firs
tSe
cond
Thi
rdFo
urth
Firs
tqu
arte
rqu
arte
rqu
arte
rqu
arte
rqu
arte
rqu
arte
rqu
arte
rqu
arte
rqu
arte
r
Allindustries
27,232
28,352
29,180
27,416
24,828
24,600
25,078
24,774
24,147
14
Agr
icul
ture
1,370
1,871
2,300
1,724
1,355
1,823
2,204
1,666
1,372
4
Extractionof minerals
1,047
1,072
1,120
1,077
1,011
960
944
862
819
27
Euildingandconstruction
1,240
1,492
1,600
1,307
1,104
1,211
1,415
1,404
1,320
19
Other hand trades
548
575
550
568
554
581
505
572
561
0.7d
Finance
390
399
400
306
398
384
380
373
374
7
Public and professional Bervce
3,075
3,022
3,000
3,047
3,120
2,973
2.940
3,161
3,269
2
Domestic and personal service
2,683
2,763
2,820
2,781
2,741
2,753
2,786
2,701
2,661
3
All transportation
3,169
3,243
3,420
3,352
2,847
2,739
2,865
2,922
2,674
16
Steam railways
2,032
2,044
2,200
2,101
1,724
1,599
1,710
1,741
1,586
22
Other transportation
1,136
1,199
1.220
1,251
1,123
1,140
1,155
1,181
1,088
6
Commerce and trade
2,502
2,580
2,600
2,656
2,507
2,527
2,520
2,582
2,477
3
Who
lesa
le28
830
330
028
627
428
428
427
326
56
Retail
2,274
2,277
2,300
2,370
2,233
2,242
2,236
2,309
2,212
3
All factories
11,149
11,334
11,370
10,507
9,189
8,648
8,460
8,532
8,621
26
Food, drink, andtobacco
1,048
1,015
1,120
1,075
881
858
959
952
861
16Lumber and its
prod
ucts
985
1,062
1,050
912
839
928
915
852
855
15
Metals and
met
alproducts°
5,104
5,213
5,200
4,743
3,90
13,
305
2,979
3,020
3,238
43
Paper and printing
639
636
640
666
619
602
599
623
620
6
Mineral productsb
878
881
910
892
793
748
750
763
760
18Textile andleatherproductse
2,495
2.525
2,450
2,220
2,155
2,206
2,257
2,322
2,287
15
a V
ehic
les,
railr
oad
care
, and
all
prod
ucts
not
els
ewhe
re r
ecor
ded
are
incl
uded
her
e.b
Incl
udes
chem
ical
, sto
ne, g
lass
, and
cla
y pr
oduc
ts.
Incl
udes
clo
thin
g of
all
kind
s.'In
crea
se—
min
imum
for
cor
resp
ondi
ng q
uart
ers.

EMPLOYMENT IN 1920-1922 89
dealers, show very moderate decreases, while public, professional, domes-tic, and personal service, and retail trade gave approximately the sameamount of employment throughout the period.
CHART 14.—DIFFERENCES IN THE TOTAL HOURS OF EMPLOYMENTGIVEN QUARTERLY AT THE PEAK AND AT THE TROUGH OF THE
BUSINESS CYCLE BY ENTERPRISES EMPLOYING FEWER THAN21 PERSONS EACH IN THE FIRST QUARTER OF 1920.
.
YEAR
AND
QUARTER
VI-2I-p..
o —N9
V.c E
0 ..N N99
—in.c '-ONN N99
'2 '2.—
.c .c
0 —N C'J99
Vcco oC) Ua ai0(00—N N92?
.c— +1L.
o o6 .2.('1 N99
.c .cL I..
o auu..6N N
.c—I'.
.— 3CI'rb.o —N N
FULL-TIMEEMPLOYEE
HOURSSCHEDULED
-cc) No Cm
CON.
(0 —N Cttq— —
N CY)no) NN 0çq tofiN Nmm tO tO—?
'eON03(0old(MILLIONS)
—
3,000—- -
cc - -r0 -z -WO
2,000—--
.
IL — —
Lu -1,000—
. — . S .1... I. i. Ii .1urn!. .
.
EMPLOYEEHOURS
WORKED(MILLIONS)
to NIt)CmSw
CO toCO In'i'——
C') C')N N — N.0 ('403
N. N0 tOfiçr)C') —N —nn 0 SC)
CO tON. ('flto N.NIL)Nt4
INDUSTRY
ALL
INDUSTRIES
AGRI-
.
CULTURE
EXTRACTION
OF FACTORIES
BUILDINGAND
CON STRUC-
TRAN5-
PORTATION
TRADE
AND
ALL
OTHER
MINERALS TION COMMERCE INDUSTRIES
Table XX furnishes the best available measure of the fluctuationsof the actual volume of employment, for it records the numbers ofemployee-hours worked rather than the numbers of persons on the pay--rolls. The falling off for all industries amounted to about one-sixth of thehours of work put in at the peak of activity in most lines of business.However, this decrease was far from uniform, the hand trades even show-

90 BUSINESS CYCLES AND UNEMPLOYMENT
ing a very small increase. Mining, construction work, steam railways,and factories were the 'industries which felt the cycle most severely.
CHART 15.—DIFFERENCES IN THE TOTAL HOURS OF EMPLOYMENTGIVEN QUARTERLY AT THE PEAK AND AT THE TROUGH OF THE
BUSINESS CYCLE BY ENTERPRiSES EMPLOYING FROM 21.TO100 PERSONS EACH IN THE FIRST QUARTER OF 1920.
YEAR
AND
QUARTER
g.t
Li.I,o N2 9
•uC
0 0a u(9 0
0 —N0)
U)L,,0CMN N00— —
Q 0L. I..
.—tt0— —
U V.
.c .cIT0N N— —
.c .c— —I.3 3o oLL
—CM Na 0)— —
•t,•— .—
0 —CM Nci 0)—
—U) U)1-
h-ItONN NS —
FULL•TIMEEMPLOYEE
HOURSSCHEDULED
(MILLIONS)
*10CO— .CO N
F-, 0)= COnO— —"' °
—
NN NC') N
0in— —
0 LOF-,N N
.j. —o it)
1500—
CI) -Et -
-1000—
--
IL -LU -
500—
.
is
-
I
—
I II
—
.
.—
-EMPLOYEE
HOURSWORKED(MILLION8)
'0 —N"'ScC4
Co —CO
Ne.
toq0)
—to04
fl COit) C')— —
Co C"in01 04
.ct toU) C')Co Co
INDUSTRYALL.
INDuSTRIES
AGRI-
CULTURE
EXTRACTION
OF
MIMERAI.8
FACTORIES
BUILDINGAND
CONSTRUC
TION
TRANc-
PORTATION
TRADE
AND
COMMERCE
ALL
OTHER
INDUSTRIES
The totals of time worked declined somewhat more than did thenumbers of workers on the respective pay-rolls. The reason for this ismainly that there was a tendency in some fields during the depression toretain the employees on the pay-rolls but to have them work part time.This fact is brought out in Charts 14, 15, 16 and Table XX. On these

EMPLOYMENT IN 1920-1922 91
charts the hollow bars represent the number of hours that would havebeen put in if all employees on the pay-rolls had worked full time. The
CHART 16.—DIFFERENCES IN THE TOTAL HOURS OF EMPLOYMENTGIVEN QUARTERLY AT THE PEAK AND AT THE TROUGH OF THE
BUSINESS CYCLE BY ENTERPRISES EMPLOYING MORE THAN100 PERSONS EACH IN THE FIRST QUARTER OF 1920.
YEAR
AND
QUARTER
'ti.t .t.C .c
I
—Cl Ci
'U V.b
.C .Ci-.
I I0—CM CM
V —0
.Cj— 'a.
I I0CM
— VU)
.cI '
'UtC C
oua' ci0 oI I0—
CM (9
.CI— u..
I I0CM ('1
—
'U 'U
ga) 4)to to
I IoCM CM
— —
-
.C,a. I—
• IN....01 ('1—
FULL TIMEEMPLOYEE
HOURSSCHEDULED
(MILUONS)
,t, r-.—C'( 0
'0
S
oo.i
ø ci-0 inw 'q'
o0eC')
p.cO N
—
Co 'eIn CMr-.
—
mq' C9q'
6000—
5000—
re')
4000—o__% -
zLU 0
R 3000—
-
2000—
1000—
Iii
,
. -
-
•iLn
.
.
.11EMPLOYEE
HOURSACTUALLYWORKED(MILLIONS)
— 0w N 0
.
C')—
P-fl)CM NC') C9
—aj—
Co toCo C'(— —
01 N—
a)
It)CM
INDUSTRYALL
INDUSTRIES
AGRI-
CULTURE
EXTRACTION
orMINERALS
FACTORIE8
BUILDING
AND
CONSTRUC-TI ON
TRANS-
PORTATION
C3MMERCE
AND
TRADE
ALL
OTHER
INDUSTRIES
solid black bars indicate the hours actually worked. The difference inthe lengths of the bars of each pair represents the change in employmenttaking place between the crest and the trough of the employment cycle inthe given industry. It is clear that when measured in absolute termsthe important declines in employment were those occurring in factories,

TA
BL
E X
X.—
AN
EST
WA
TE
TU
EU
NiT
ED
ST
AT
ES
OP
TU
E T
OT
AL
Hou
Rs
AC
nTA
LL
YA
LL
EM
PLO
YE
ES
IN E
NT
ER
PRIS
ES
OF
AL
L S
IZE
SW
OR
KE
D P
EE
QU
AR
TE
R B
YC
o to
--
Mill
ions
of h
ours
wor
ked
per
quar
ter
1920
1921
1922
Max
imum
cycl
ical
decl
ine
Firs
tSe
cond
Thi
rdFo
urth
Firs
tSe
cond
Thi
rdFo
urth
Firs
tqu
arte
rqu
arte
r —qu
arte
rqu
arte
rqu
arte
rqu
arte
rqu
arte
rqu
arte
rqu
arte
r(p
er c
ent)
Aili
ndus
trie
s17
,747
18,3
9519
,063
17,6
1115
,515
15,5
4815
,918
15,6
5515
,180
16
Agriculture
911
1,265
1,603
1,148
882
1,250
1,552
1,112
898
3
Ext
ract
ion
of m
iner
als
648
654
698
672
590
549
534
509
491
30
Bui
ldin
g an
d co
nstr
uctio
n70
285
191
475
161
969
080
579
675
119
Oth
er h
and
trad
es35
337
7357
370
355
379
367
370
361
0.SA
Fina
nce
231
234
238
234
235
225
224
221
221
7
Fubl
ican
dpro
fess
iona
lser
vice
1,96
11,
928
1,92
21,
905
1,95
21,
841
1,83
41,
939
2,03
25
Dom
estic
andp
erso
nals
ervi
ce1,
956
1,99
12,
037
2,01
91,
973
1,985
2,022
1,936
1,920
4
Ailtransportation
2,104
2,163
2,323
2,231
1,800
1,75
51,
824
1,86
61,
639
21Steamrailways
1,359
1,374
1,513
1,388
1,068
1,004
1,064
1,080
936
30
Other transportation
.745
789
810
842
731
750
759
785
703
7
Commerceandtrade
1,733
1,772
1,762
1,799
1,698
1,723
1,707
1,749
1,67
13
Wholesale
185
197
195
186
178
187
184
176
171
6
Ret
ail
1,54
81,
574
1,56
61,
612
1,51
91,
535
1,52
31,
573
1,50
03
Ailf
acto
nes
7,14
37,
154
7,20
46,
478
5,40
65,
148
5,04
55,
152
5,19
130
Food
, dri
nk a
ndtobacco
678
664
740
710
573
564
628
627
557
15Lumber and its
prod
ucts
648
704
699
591
530
608
594
551
555
18M
etal
sand
met
alpr
oduc
ts°
3,375
3,331
3,35
42,
953
2,24
41,
857
1,67
91,
736
1,95
450
Paper and printing
396
394
394
412
375
359
352
379
368
11
Min
eral
565
571
583
570
492
474
474
488
477
19
Textileandleatherproductsc
1,479
1,488
1,431
1,240
1,189
1,284
1,315
1,368
1,277
20
• V
ehic
les,
rai
lroa
d ca
rs, a
nd a
llproducts
not e
lsew
here
rec
orde
dare included here.
6In
clud
eschemical, stone, glass, and clay products.
Includes clothing of all
kind
s.4
Incr
ease
—m
inim
umfor corresponding quarters.

EMPLOYMENT IN
larger plants.
1920—1922
mining, in building and construction,
93
of someand in miscellaneous
industries.NUMBER OF EMPLOYEES ONWORKED, AND COMBINEDN THE CONTINENTAL
Part time appears to have been resorted to mainly by the railways,by the mining industry, and by certain classes of manufacturers.figures for agriculture are based upon only a few records and thereforecannot be considered dependable.part-time work is in general
It is clear that, during a depression,responsible for a far smaller proportion of
the decline in total employment than is the laying off of employees.That total payments in the form of wages and
even a greater degree than did the total hours worked is apparent from a
especiallymoment in
in the There were also shrinkages
CHART 17.—RELATIVE CHANGES IN THEPAY-ROLLS, TOTAL EMPLOYEE HOURS
SALARY AND WAGE PAYMENTS I
UNITED STATES.
120
50
09100
070I—
LI-
za
0wI2040110-3IC
I-IL0z80Iii0Lii13.
60
90
501920 1921 1922
The
salaries declined to

94 BUSINESS CYCLES AND UNEMPLOYMENT
comparison of the right hand columns of Tables XX and XXII. Chart17 brings out the interesting point that the records neither of the numbersof persons on the pay-rolls nor of the total wage and salary payments areaccurate criteria of changes in the volume of work done.CHART 18.—EMPLOYMENT AT THE TROUGH OF THE 1921 DEPRESSION
EXPRESSEDASA PERCENTAGE OFTHE MAXIMUM IN THE1920 BOOM,MEASURED IN TOTAL HOURS WORKED BY ALL EMPLOYEES.
INDUSTRY
EMPLOYEES
CONCERN
PER CENT OF MAXIMUMtO 20 30 40 80 60 70 80 90 100
I I I I I I —
ALL
IN DU STR ItS
020
21-100
OVER 100
AGRICULTURE
.
0-20
21.100
OVERIOD
EXTRACTION
orMINERALS
0-2021100
OVER 100
FACTORIES
0-20
21-100
OVER 100
BUILDINGAND
CONSTRUCTION
0-20
21-100
OVER 100 .
TRANSPORTATION
0-20
21-100
OVER 100
COMMERCE
AND
TRADE
0.2021-100
OVER 100
ALL 0-20
OTHER 21-100
INDUSTRIES OVERICO
I I I I I I I I —tO 20 30 40 50 60 70 80 90 1(0
PER CENT OF MAXIMUM
During the boom, salaries and wages rose faster than did totalemployee-hours, and in the following depression they fell further. Onthe other hand, the total number of hours worked during the period ofdecline in industrial activity diminished distinctly faster than did thenumber of employees on all pay-rolls. Evidently, then, adequatestatistics of employment must include a record of the total employee-hours worked as well as records of the numbers on the pay-rolls andtotals of wage and salary payments.

TA
BL
E X
XI.
—A
N E
STIM
AT
EFOR
TH
E C
ON
TIN
EN
TA
L U
NIT
ED
ST
AT
ES
OF
TH
E P
ER
CE
NT
OF
FUL
L T
IME
WO
RX
ED
BY
TH
E A
VE
RA
GE
EM
PLO
YE
E W
HIL
E O
N T
HE
PA
Y-R
OL
L I
N E
NT
ER
PRIS
ES
OF
AL
L S
IZE
S
.
.In
dust
ry
.
Per
cent
of
full
time
wor
ked
Dec
line
from
high
est
tolO
We8
t
1920
1921
1922
Firs
tSe
cond
Thi
rdFo
urth
Firs
tSe
cond
Thi
rdFo
urth
Firs
tqu
arte
rqu
arte
rqu
arte
rqu
arte
rqu
arte
rqu
arte
rqu
arte
rqu
arte
rqu
arte
rre
cord
ed
All
indu
stri
es98
.597.5
08.0
97.4
95.3
95.8
05.8
96.4
96.2
3.2
Agr
icul
ture
05.1
93.2
96.9
98.9
92.4
95.1
97.4
99.6
94.1
6.5
Ext
ract
ion
of m
iner
als
94.3
93.1
95.1
94.8
90.7
90.2
88.4
92.8
93.4
6.7
Building and
cons
truc
tion
94.1
94.6
94.6
04.9
92.9
94.3
94.4
94.5
102.1
2.0
Oth
er h
and
trad
es96
.998
.397
.197
.695
.897.7
97.2
97.0
96.2
2.5
Fina
nce
99.5
100.
110
0.1
99.3
99.4
98.9
99.7
99.4
99.5
1.2
Publ
ic a
nd p
rofe
ssio
nal s
ervi
ce10
0.6
100.
110
0.0
100.
310
1.4
100.
399
.999
.910
0.5
1.5
Dom
estic
and
per
sona
l ser
vice
98.2
97.8
97.9
98.5
97.8
98.0
97.9
97.0
97.9
1.5
A]l
tran
spor
tatio
n10
3.6
103.
810
5.7
103.
198
.699.7
99.0
99.0
95.9
9.8
Steam railways
106.8
107.4
109.9
105.6
09.0
100.4
99.5
99.1
94.2
15.7
Oth
er tr
ansp
orta
tion
98.2
98.1
98.7
99.3
97.9
98.9
98.5
98.8
98.1
1.4
Commerce and trade
97.9
98.1
98.1
98.7
98.1
98.1
97.7
98.7
98.2
1.0
Wholesale
98.9
99.0
99.0
100.3
99.9
99.4
98.6
99.0
98.8
1.7
Retail
97.8
97.9
98.0
98.5
97.9
97.9
97.6
98.7
98.1
0.9
All factories
98.1
96.3
96.2
94.4
91.6
92.3
92.2
93.3
93.3
6.5
Food, drink, andtobaoco
97.4
97.9
95.8
96.3
97.6
98.1
95.7
96.8
96.6
2.4
Lumber and its
prod
ucts
94.7
94.9
95.6
95.0
94.0
94.7
95.2
95.5
95.5
1.6
Metals and metal products.'
99.7
96.0
96.6
93.9
88.5
87.0
87.0
88.5
92.5
12.7
Paperandprinting
98.7
98.6
98.0
98.5
96.8
95.9
95.8
98.2
95.7
3.0
Mineral
98.4
99.0
98.5
97.4
94.1
96.0
95.6
96.4
95.2
4.9
Textile and leather
96.0
95.4
94.3
91.6
91.3
94.7
94.4
94.9
91.0
5.0
Veh
icle
s, r
ailr
oad
cars
, and
all
prod
ucts
not
els
ewhe
re r
ecor
ded
are
incl
uded
her
e.in
clud
es c
hem
ical
, sto
ne, g
lass
, and
cla
y pr
oduc
ts.
Incl
udes
clothing
of a
llkinds.
TA
BL
E X
XIL
—A
N E
STIM
AT
E P
OE
TU
E C
owT
lNE
wra
UN
rnD
ST
AT
ES
OF
TH
E T
OT
AL
QU
AB
TE
RL
Y W
AG
ES
AN
D S
AL
AR
IES
PAID
TO
AL
L E
MPL
OY
EE
S B
Y A
a E
NT
ER
PRIS
ES
OF
WH
AT
EV
ER
SIz
E
Mill
ions
of
dolla
rs p
aid
to e
mpl
oyee
sM
axim
umcy
clic
alIn
dust
ry19
2019
2119
22
Firs
tqu
arte
r
decl
ine
(per
cen
t)Fi
rst
quar
ter
Seco
ndqu
arte
rT
hird
Fou
rth
quar
ter
quar
ter
Firs
tqu
arte
rSe
cond
quar
ter
Thi
rdFo
urth
quar
ter
quar
ter
9,905
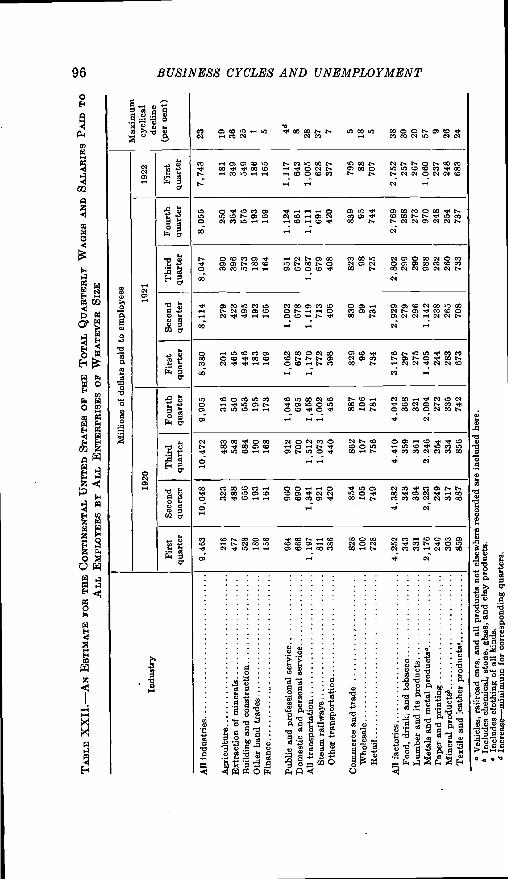
8,38
08,
114
8,047
316
540
553
195
173
8,055
201
465
446
183
169
7,743
AU
indu
stri
es
Agr
icul
ture
Ext
ract
ion
of m
iner
als
Bui
ldin
g an
dconstruction
Other
hand
trad
esFi
nanc
e
Publ
ic a
nd p
rofe
ssio
nal s
ervi
ceD
omes
tic a
nd p
erso
nal s
ervi
ce.
All
tran
spor
tatio
nSt
eam
rai
lway
sO
ther
tran
spor
tatio
n
Com
mer
ce a
nd tr
ade
Who
lesa
leR
etai
l
AU
fac
tori
esFo
od, d
rink
, and
toba
cco
Lum
ber
and
its p
rodu
cts
Met
als
and
met
al p
rodu
ctsa
Pape
r an
d pr
intin
gM
iner
al p
rodu
cts'
Tex
tile
and
leat
her
279
423
495
192
165
23
390
396
573
189
164
250
364
575
193
169
9,46
3
216
477
528
180
156
964
666
1,197
811
386
828
100
728
4,252
343
331
2,176
240
303
859
181
349
549
186
165
10,0
48 323
488
656
193
161
960
690
1,341
921
420
854
105
749
4,38
2343
364
2,223
249
317
887
1,04
669
51,458
1,002
456
19 36 251 5
10,4
72 483
548
684
190
168
912
700
1,51
21,
073
440
862
107
756
4,410
359
361
2,24
625
433
485
6
1,06
267
81,
170
772
398
1,00
267
81,119
713
406
951
672
1,087
679
408
1,12
466
1.1,
111
691
420
887
106
781
1,11
764
31,
005
628
377
829 96
734
44
S
28 377
830 99
731
823
98
725
83995
744
795 88
707
4,04
236
832
12,
004
272
335
742
5 18 5
o V
ehic
les,
railr
oad
cars
, and
all
prod
ucts
not
els
ewhe
re r
ecor
ded
are
bIn
clud
esch
emic
al, s
tone
, gla
ss, a
nd c
lay
prod
ucts
.C
Incl
udes
clot
hing
of
all k
inds
.4
Incr
ease
—m
inim
um f
or c
orre
spon
ding
qua
rter
s.
3,17
629
7275
1,40
524
428
367
3
2,92
927
9296
1,14
223
826
570
8
2,802
299
290
988
232
260
733
incl
uded
her
e.
2,76
928
827
3970
248
254
737
2,752
257
267
1,060
237
248
683
38 30 20 579
26 24

EMPLOYMENT IN 1920-1922 97
Perhaps the most surprising discovery made in the course of this.nvestigation is the fact brought out by Table XXIII and by Chart 18,that the reduction in employment during the depression of 1921 was aphenomenon affecting most severely the establishments of the largerüzes. While there are a few exceptions to this rule, it nevertheless holds
the great majority of industries. The reason for this state of affairs[s not made clear by the figures. It may be due to the more intimatepersonal relationships existing between small scale employers and their
it may arise from the fact that the small producer is in closerbouch with the ultimate consumer of his products and can, therefore,better gage the demand; it may be the result of differences in the natureDf the large and small establishments or it may arise from some unsus-pected cause.' The fact remains that the difference exists and is largemough to be important.rABLE XXIII.—A COMPARISON OF THE VOLUME OF EMPLOYMENT AT THE FEAX
AND IN THE TROUGH FOR LEADING INDUSTRIAL GROUPS
Industry
.
Employeesper
concern
Pull-time hours(Millions)
Hours actually worked(Millions)
Peak Trough Per cent.
declinePer centPeak Trough change
Allindustries
0— 20
21—100
Over 100
7,105
3,132
9,215
6,892
2,640
6,997
3.0015.7124.07
6,9562,9269,181
6,7422,5216,589
3.0813.8428.23
(kgriculture
j
0-. 20
21—100
Over 100
1,526
117
36
1,491
89
24
2.29
23.93
33.33
1,488
98
27
1,456
81
20
2.1517.35
25.93
(of mineral8
0—2021—100
Over 100
32
99
608
33
59
434
.3.1340.4028 62
23
92
593
23
54
414
0.00
41.31
30.18
?aotories(
0— 2021—100
Over 100
9221,3135,400
8441,0103,617
8 4623.0733.02
9011,1715,327
827946
3,273
8.2119.2138.56
(
0— 20
21—100Over 100
330
322
289
284
278
177
13.94
13 66
38.75
307
311
228
262
264
121
14.66
15.11
46.93
rransportation
0— 20
21—100
Over 100
321
156
1,758
312
140
1,324
2 80
10.26
2469
323
153
1,889
311
138
1,262
3.72
9.80
33.19
Jommerce and tradeI,,
0— 20
21—100
Over 100
1,189
270
355
1,169
255
324
1.68
5.56
8.73
1,180
258
352
1,165
243
317
5.81
9.94
til other industries
0— 20
21—100
Over 100
2,804
904
1,049
2,624
851
929
6.42
5 86
11.44
2,767
894
1,045
2,573
836
926
7.01
6.49
11.39
I am inclined to believe that one reason why small enterprises show a lower)ercentage of unemployment during depressions is that in such enterprises there is arompter liquidation of costs, perhaps even of wage rates.—Note by M. C. RoRn.
7
98 BUSINESS CYCLES AND UNEMPLOYMENT
IV. SUMMARY
The results of this investigation may be sununarized briefly as follows:1. The depression of 1921 caused a diminution of approximately one-
sixth in the total volume of employment in the United States.2. The reduction due to part-time work was confined mainly to a few
fields and was relatively of slight importance when considered for industryas a whole.
3. The shift of workers from one industrial field to another was smallin extent.
4. Workers in mining, transportation, and manufacturing were theprincipal sufferers from the decline in employment.
5. Small employers in general gave more steady employment thandid large employers in the same industries.
6. To get an accurate picture of changes in total employment, it isnot sufficient to collect data concerning numbers on the pay-rolls ortotal wages and salaries paid. The only data that give the precisemeasurement needed are those showing the numbers of employee-hoursworked.