changes in distribution and biological characteristics of
TRANSCRIPT

NAFO SCI Coun Studies, 9: 11-26
Changes in Distribution and Biological Characteristics of Illex illecebrosus on the Scotian Shelf, 1980-83
T. W. Rowell and J. H, Young Invertebrates and Marine Plants Division, Fisheries Research Branch
Halifax Fisheries Research Laboratory, Department of Fisheries and Oceans P. 0, Box 550, Halifax, Nova Scotia, Canada B3J 2S7
and
J. C. Poulard and J. p, Robin Institut Franyais de Recherche pour I'Exploitation de la Mer B. P. 4240, Saint Pierre, 97500 St. Pierre et Miquelon, France
Abstract
Data from bottom-trawl surveys of the Scotian Shelf in 1980-83 are used to describe seasonal and interannual changes in distribution, abundance, length composition and maturation of the short-finned squid (II/ex il/ecebrosus) and to relate squid density with bottom temperature. The pattern of mean bottom temperatures over the Shelf appeared to be quite regular, with warmer water (>60 C) generally prevailing in the western areas and cooler water to the east and northeast. Although there may be some relationship between squid distribution and bottom temperature, anomalies indicate that the relationship is influenced by other environmental or biological factors. Late-arriving secondary and tertiary cohorts were observed mainly on the western part of the Shelf in late summer and autumn, with fine-scale spatial and bathymetric differences in distribution relative to the larger squid. The interannual variation in sexual maturation during the seasonal occurrence of squid on the Shelf appears to be related to the variation in size composition of the population, particularly in late summer and autumn.
Introduction
Exploitation of short-finned squid (Illex illecebrosus) was an important component of the fishery in the Northwest Atlantic during the 1970's, with the total catch in all regions (NAFO Subareas 3-6) peaking at about 180,000 (metric) tons in 1979, of which 73,000 tons were caught on the Scotian Shelf, 89,000 tons in the Newfoundland area and the remainder off the northeastern United States. Catches on the Scotian Shelf declined rapidly thereafter to 35,000 tons in 1980, 15,000 tons in 1981, 1,500 tons in 1982 and 400 tons in 1983. Squid arrive on the continental shelf as juveniles in the spring, feed intensively during the summer, and disappear from the fishing grounds in late autumn (Fedulov and Amaratunga, MS 1981; Amaratunga and Roberge, MS 1981).
Canadian research vessels have conducted stratified-random groundfish surveys of the Scotian Shelf (Fig, 1) in the summer (July) since 1970 and in the autumn (October) since 1978. Data relevant to squid catches during these surveys in 1970-83were summarized by Rowell and Young (MS 1984), During 1980-83, additional surveys were carried out, usually in June and September, with emphasis on determining the distribution and abundance of squid shortly after their arrival on the Scotian Shelf and in the middle of the fishing season. Preliminary results of some of these surveys were reported by Amaratunga and Budden (MS 1981), Dupouy (MS 1981), Dupouy and Minet (MS
1982), Dupouy and Derible (MS 1983) and Poulard et al. (MS 1984). In this paper, the results of all surveys during four sampling periods (late spring, summer and autumn) in 1980-83 are used to describe the seasonal and interannual variations in distribution, abundance, size, and maturation of squid, and the relationship between squid density and bottom temperature.
Materials and Methods
The majority of the surveys in 1980-83 were conducted by Canadian research vessels, the exceptions being four late summer surveys by vessels from France and one by a vessel from the Union of the Soviet Socialists Republics (USSR) (Table 1). Although the surveys at different times were carried out by different vessels and gears, standard stratified-random procedures for conducting surveys on the Scotian Shelf were used (Halliday and Kohler, MS 1971; Doubleday, 1982). At each fishing station, the trawl with small-mesh liner, was towed for 30 min at a speed of 3.5 knots, Squid, which constituted variable proportions of the catches, were enumerated and weighed, dorsal mantle lengths (ML) were recorded to the nearest 5 mm by sex during the June and September surveys and to the nearest 1 cm (unsexed) during the July and October surveys. Samples were taken to determine the state of maturation by numerical scale, according to the descriptions of Amaratunga and Durward (1979) for males and Durward et a/. (1979) for females.

12
46°
45°
43°
Gulf of
Maine
67"
NEW BRUNSWICK
67"
Sci. Council Studies, No.9, 1985
63° 61° 59°
.......
Banquereau
50 fath ..... 100 fath ____ _
(1 fath 0 1.83 m)
Fig. 1. Map of the Scotian Shelf with place names mentioned in the text.
TABLE 1. General information on surveys which provided data on distribution. abundance and biology of short-finned squid on the Scotian Shelf. 1980-83.
Research Research Mesh size (mm) No. of Year Season vessel Survey dates trawl Codend Liner sets
1980 Late spring Brandal Jun 05-Jul 03 Western II A 90 19 104 Summer A. T. Cameron Jul 07-27 Yankee 36 114 10 145 Late summer Lady Hammond Aug 19-24 Western II A 90 19 41 Late summer La Perle Sep 04-24 Lofoten 50 121 Autumn Lady Hammond Oct 11-Nov 8 Western II A 90 19 140
1981 Late spring Lady Hammond Jun01-11 Western II A 90 19 66 Summer A. T. Cameron Jul 04-25 Yankee 36 114 10 150 Late summer Thalassa Aug 28-Sep 23 Lofoten 50 96 Autumn Lady Hammond Sep 28-0ct 22 Western II A 90 19 127
1982 Late spring Lady Hammond Jun 01-10 Western II A 90 19 91 Summer Lady Hammond Jul 10-30 Western II A 90 19 150 Late summer Cryos Aug 19-5ep 18 Lofoten 50 102 Autumn Lady Hammond Sep 28-0ct 24 Western II A 90 19 145
1983 Late spring Gizhiga Jun01-11 Soviet Hake 66 Summer A.w.H. Needler Jul 05-28 Western II A 90 19 145 Late summer A.w.H. Needler Sep 12-29 Western II A 19 19 82 Late summer Cryos Aug 31-0ct 02 Lofoten 50 135 Autumn A.w.H. Needler Oct 04-27 Western II A 90 19 159
57°
45°
43°
Although survey techniques were standard within each period, some differences between periods are noteworthy. The late spring survey in 1980 encompassed the entire Scotian Shelf, but it has since been conducted mainly along the edge of the Shelf from Browns Bank to Banquereau. The summer and autumn groundfish surveys regularly cover the Scotian Shelf
and Bay of Fundy. The late summer surveys were mainly concentrated in 18 strata located in deepwater areas on the central part and along the edge of the Shelf in depths from 50 to 200 fath (91-183 m). Although the duration of some surveys extended over parts of two months (Table 1), the months of June, July, September and October are commonly used in
ROWELL et a/.: II/ex illecebrosus on the Scotian Shelf, 1980-83 13
the text, tables and figures to represent the four seasonal periods (late spring, summer, late summer and autumn respectively).
Data for the four periods are used to iiiustrate the seasonal and interannual patterns of squid catches (kg/30 min tow) and length frequencies. Estimates of biomass were determined by the area-expansion method (Koeller, MS 1980; Rowell and Young, MS 1984) for a subset of data from 18 strata which were consistently surveyed in the July, September and October periods. Late summer surveys were conducted by two vessels in 1980 and 1983, but, in orderto avoid assumptions about comparability of vessels and trawling gear, only the data from the September surveys by the French research vessels were used for calculation of biomass estimates. Patterns of squid density (number per square nautical mile) and mean bottom temperature (average of observations in each stratum) were examined for the July and October periods, by considering the apparent squid preference for temperatures in excess of6° C (Poulard et a/., MS 1984) and using three categories «6° C, 6° to 8° C, and >8° C). Maturation patterns were analyzed from samples of catches in the June, July and September periods.
Geographic Distribution
Seasonal and annual variations in catch
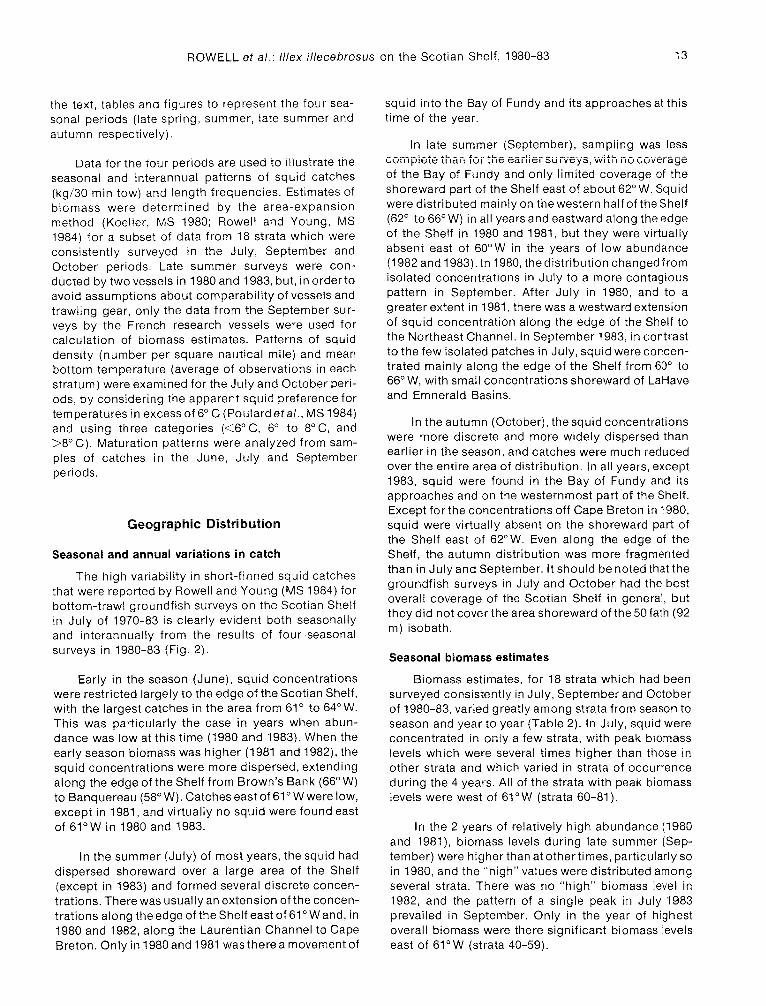
The high variability in short-finned squid catches that were reported by Rowell and Young (MS 1984) for bottom-trawl groundfish surveys on the Scotian Shelf in July of 1970-83 is clearly evident both seasonally and interannually from the results of four seasonal surveys in 1980-83 (Fig. 2).
Early in the season (June), squid concentrations were restricted largely to the edge of the Scotian Shelf, with the largest catches in the area from 61 ° to 64° W. This was particularly the case in years when abundance was low at this time (1980 and 1983). When the early season biomass was higher (1981 and 1982), the squid concentrations were more dispersed, extending along the edge of the Shelf from Brown's Bank (66° W) to Banquereau (58° W). Catches east of 61° W were low, except in 1981, and virtually no squid were found east of 61°W in 1980 and 1983.
In the summer (July) of most years, the squid had dispersed shoreward over a large area of the Shelf (except in 1983) and formed several discrete concentrations. There was usually an extension of the concentrations along the edge of the Shelf east of 61 ° Wand, in 1980 and 1982, along the Laurentian Channel to Cape Breton. Only in 1980 and 1981 was there a movement of
squid into the Bay of Fundy and its approaches at this time of the year.
In late summer (September), sampling was less ~ __ .... I_.L_ .&.L.. __ J:_~.L'- _ _ . __ 1: ___ .. _ .. _ .. _ .•. !LI- ____ .. ____ _
I,..,UIII~ltlt:: LlldlllUI lIlt:::tdlllt'1 ;::'UIVt'Y;::'IVVILlIIIUl,;UVtli:1~p:~
of the Bay of Fundy and only limited coverage of the shoreward part of the Shelf east of about 62° W. Squid were distributed mai nly on the western half of the Shelf (62° to 66°W) in all years and eastward along the edge of the Shelf in 1980 and 1981, but they were virtually absent east of 60° W in the years of low abundance (1982 and 1983). In 1980, the distribution changed from isolated concentrations in July to a more contagious pattern in September. After July in 1980, and to a greater extent in 1981, there was a westward extension of squid concentration along the edge of the Shelf to the Northeast Channel. In September 1983, in contrast to the few isolated patches in July, squid were concentrated mainly along the edge of the Shelf from 60° to 66° W, with small concentrations shoreward of LaHave and Emnerald Basins.
In the autumn (October), thesquid concentrations were more discrete and more widely dispersed than earlier in the season, and catches were much reduced over the entire area of distribution. In all years, except 1983, squid were found in the Bay of Fundy and its approaches and on the westernmost part of the Shelf. Except for the concentrations off Cape Breton in 1980, squid were virtually absent on the shoreward part of the Shelf east of 62° W. Even along the edge of the Shelf, the autumn distribution was more fragmented than in July and September. It should be noted that the groundfish surveys in July and October had the best overall coverage of the Scotian Shelf in general, but they did not cover the area shoreward of the 50 fath (92 m) isobath.
Seasonal biomass estimates
Biomass estimates, for 18 strata which had been surveyed consistently in July, September and October of 1980-83, varied greatly among strata from season to season and year to year (Table 2). In July, squid were concentrated in only a few strata, with peak biomass levels which were several times higher than those in other strata and which varied in strata of occurrence during the 4 years. All of the strata with peak biomass levels were west of 61°W (strata 60-81).
In the 2 years of relatively high abundance (1980 and 1981), biomass levels during late summer (September) were higher than at other ti mes, particularly so in 1980, and the "high" values were distributed among several strata. There was no "high" biomass level in 1982, and the pattern of a single peak in July 1983 prevailed in September. Only in the year of highest overall biomass were there significant biomass levels east of 61°W (strata 40-59).
14
68° 66° 64°
45°
" * * " + + + +t .. +'b ... +~
.,.:j>~ t+
+.¢
* 43°
47°
July
45°
43° + +
47"
September
45°
Sci. Council Studies, No.9, 1985
62°
++ •
58°
+ +
+ 0 kg
+ +
o 1-10 kg
o 11-50 kg
o 51-100 kg
0100+ kg
1 r
68°
1981
June
+ +
September
66° 64° 62° 58°
45°
43°
47"
45°
43'
47"
45°
43° 430
47°
45°
43°
68° 66° 64° 62° 58° 68° 66° 64° 62° 58°
Fig. 2. Distributions of short-finned squid catches (kg/tow) on the Scotian Shelf from surveys in June. July. September and October, 1980-81. (Areas of apparent squid concentrations are shaded.)

450
430
4r
450
68 0 660
1982
June
July
ROWELL et al.: lIIex illecebrosus on the Scotian Shelf, 1980-83
640 62 0 600
+ 0 kg o 1-10 kg
o 11-50 kg
o 51-100 kg
0100+ kg
680
1 r 1983
June
July
66 0
+ '!t
+ + + ++ ,<it+ 0
+ +
640 620 600
+ +
+ + ++ + -/
+ o
+ t + 4- + + + #
+ ++
September
+ +
+ + + + +
+ + +
++ ++
+ + :·~:.i:),:~·~
++ ~ + --' ++
+-F- + #l+
+~ +
\!ty:~ /l,. sv ~
+ !
+ + +
'"' c
+
+
'" ++
+
+ +
+t
+ +
'" + ++ + +
+ +
++
+ ++ +
: +
+ ... +
w w ~ ~ ~ ~ ~ ~ ~ ~
+ + +
450
430
4r
450
430
4r
47 0
45 0
430
15
Fig.2 (cont'd) Distributions of short-finned squid catches (kg/tow) on the Scotian Shelf from surveys in June, July. September and October. 1982-83. (Areas of apparent squid concentrations are shaded.)

16 Sci. Council Studies, No.9, 1985
TABLE 2. Estimates of short-finned squid biomass for 18 strata on the Scotian Shelf during three survey periods in 1980-83. (Bold type indicates dominant catches; + indicates catch <50 tons; - indicates no catch.)
Biomass estimates (000 tons) by stratum
ivionth Tt:al ,e C~ c< C0 57 50 51 "V vV v,
Jul 1980 + 0.5 0.1 1981 0.1 0.1 0.9 1.3 1982 + 0.1 1983 0.1 1.0
Sep 1980 0.1 0.1 + 1.5 3.5 6.8 33.0 1981 0.1 + 0.1 0.1 + 0.6 0.5
1982 + + + + 0.4 0.6 1983 + 0.1 + + 0.4
Oct 1980 + 0.1 + 2.7 1981 + + + 0.4 1982 0.3
1983 + 0.1
In October, biomass levels in all strata were low and the distribution among strata was wide but not as wide as in September. Again, the available concentrations of squid were in strata west of 61°W.
Squid density and bottom temperature
Density patterns, in terms of number of squid per square nautical mile by stratum, for the summer (July) and autumn (October) surveys in 1980-83 are illustrated in Fig. 3-6, along with bottom temperature patterns by stratum for the same periods. The mean bottom temperatures were grouped into three categories «6° C, 6° to 8° C, and >8° C) on the basis of evidence for preferred temperature regimes, as indicated in previous studies of squid on the Scotian Shelf (Dupouy, MS 1981; Dupouy and Minet, MS 1982; Dupouy and Derible, MS 1983; Poulard et al., MS 1984).
Distribution in 1980. In the summer (Fig. 3A), highest bottom temperatures were recorded in the Bay of Fundy, on virtually the entire width of the Shelf between 64° and 62° W, and along the edge of the Shelf between 66° and 58° W. Temperatures exceeded 6° C in most of the strata west of 62° W (except strata 73-76). No significant concentrations of squid (Fig. 3B) were found in strata where temperatures exceeded 8°C. The largest concentrations occurred on the western part of the Shelf (64° to 67° W) where temperatures ranged from 5.7° to 7.1°C.
0.1
0.9 0.4
0.1
In the autumn (Fig. 3C), highest bottom temperatures were observed on essentially the same central area of the Shelf near LaHave Basin (stratum 71) and Emerald Basin (stratum 61) as in July, and they had increased on the western part of the Shelf around Browns Bank (strata 80 and 81). No temperature data were available for the Bay of Fundy and approaches. Temperatures were also higher off Cape Breton (stratum 42), on Middle Bank (stratum 58) and on eastern
62 55 56 70 '7< 72 76 77 78 81 82
0.4 + 1.1 2.4 1.5 10.4 3.5 0.2 0.6 0.1 0.1 + 0.4
0.6 0.3 + 0.1 0.1 3.6 0.1 0.1 12.7 + 0.4 0.1
10.6 57.7 2.7 0.9 6.7 14.4 1.6 5.2 0.4 5.5 1.1 2.2 14.6 0.6 2.0 1.2 0.8 2.0 3.3 0.2 13.6 11.1 0.3 0.8 0.1 0.2 + 0.1 0.1 1.7 0.1 0.1 0.1 0.1 2.2 0.3 0.2 0.2 7.6 0.1 1.1 0.6 0.2 0.1
3.8 1.3 0.1 1.2 1.2 0.7 0.1 0.7 0.1 0.8 0.1 1.3 0.1 0.1 0.6 0.4 0.2 0.1 0.3 0.1 0.2 0.5 0.4 0.3 0.1 0.4 +
'0.1 0.4 + 0.1 0.1 + +
Banquereau (stratum 47). As in July, a large part of the eastern half of the Shelf had low temperatures «6°C). Squid density in October (Fig. 3D) was highest on the western side of the Bay of Fundy (stratum 93) and, surprisingly, in the cold water (about 2° C) northwest of Banquereau (strata 43-45). Densities in various strata on the central part of the Shelf, where temperatures exceeded 6° C, were relatively low but were higher than those in July. However, strata on the western part of the Shelf (64° to 6rW), which had high densities in July, had comparatively low densities of squid, despite the continued high temperatures (6.9° to 10.1°C).
Distribution in 1981. In the summer (Fig. 4A), the temperature distribution was somewhat similar to that of 1980, except for the restriction of the warmest water in the Bay of Fundy and approaches to strata (90 and 95) which border the Nova Scotia coast, and the eastward extension of warmer water over Sable Island Bank (stratum 55). Bottom water of intermediate temperatures (6° to 8° C) was also more widespread than in 1980, extending north of Sable Island and covering virtually all of the strata on the western part of the Shelf from 64° to 68°W (except strata 73-75). As in 1980, intermediate temperatures were present along the Laurentian Channel in stratum 46. Squid density (Fig. 4B) was highest in the 10° C water of the Bay of Fundy (stratum 95) and in strata 59 and 62 where mean temperatures were 5.4° and 8.8° C respectively. Significant but less dense concentrations occurred nearshore north of Emerald and La Have Basins (strata 60 and 70), where temperatures averaged 9.0° and 7.8° C respectively, and in the offshore areas (strata 65 and 66), where temperatures were 9.5° and 7.4° C respectively. Lower densities were encountered in virtually all of the remaining strata on the Shelf, including the colder areas north of Banquereau (e.g. 2.9° C in stratum 44) and the warmer areas of Emerald and LaHave Basins (strata 61 and 71).

ROWELL et al.: lIIex illecebrosus on the Scotian Shelf, 1980-83 17
In the autumn (Fig. 4C), the temperature distribution was similar to that in the summer, with some expansion of high and intermediate temperatures to the Banquereau area, particularly stratum 48, where the temperature increased significantiy to 8.7 0 C from 3.]0 C in July, and with higher temperature on Browns Bank and along the adjacent edge of the Shelf (strata 80 and 82). In the Bay of Fundy and approaches, hightemperature water was much more extensive than earlier in the year, covering the entire area. However, the water along the edge of the Shelf east of 61 ° W was somewhat cooler although still in the upper part (7° to 8° C) of the intermediate temperature range. Despite the similarity in temperature distribution over much of the Shelf in summer and autumn, there were significant changes in squid density (Fig. 40), in that the high density areas in the summer (strata 59, 62 and 95) had very low or no concentrations of squid in the autumn, despite the continued high bottom temperatures in strata 62 and 95 (6.3° and 12.1 ° C respectively) and the slight warming of the water in stratum 59 (from 5.4° to 5.6°C). The highest density in the autumn was found on Sable Island Bank (stratum 55) where bottom temperatures averaged 9·.6° C. Squid density was low in this area earlier in the summer, despite a high temperature of 8.2° C. Apart from strata 55 and 64, squid were either absent or present in very low abundance on the Shelf, including the Bay of Fundy, where they were abundant during the summer.
Distribution in 1982. In the summer (Fig. 5A), bottom temperatures (8.4° to 10.0° C) were highest in the Bay of Fundy and the nearshore areas of its approaches, in the area surrounding Browns Bank (strata 81 and 82), and in La Have Basin (stratum 71). Except for stratum 77 with colder water, average temperatures in all other large strata west of 62° W were between 6° and 8° C. Low temperatures «6° C) prevailed in all strata east of 62° W. Squid density (Fig. 5B) was highest in the area around Browns Bank (stratum 81) and in the Gulf of Maine (stratum 84), where mean temperatures were 10.0° and 7.6° C respectively. Squid were present in low abundance or were absent in all other strata on the Shelf and in the Bay of Fundy.
In the autumn (Fig. 5C), the highest temperatures were found in the Bay of Fundy and its approaches (8.3° to 11.7° C), in Emerald Basin (stratum 61) and on Sable Island Bank (stratum 55). Temperatures in all other strata west of 62° W, apart from the colder water in strata 60 and 73-76, were in the intermediate range. Colder water covered much of the Shelf east of 62°W and north of 44° N, except for an area near Cape Breton (stratum 42) and on Middle Bank (stratum 58). The density of squid (Fig. 50) was low in all areas where they were found and significant changes in distribution were noticeable. Relative to the summer pattern, there was a general southwestward movement of squid on the Shelf and an intrusion into the Bay of Fundy to
strata where they were not found in July. Conversely, virtually no squid were found in the areas of greatest density (strata 81 and 84) during the summer. There was evidently no consistent relationship between sqUid density and temperature, because some squid were found where temperatures were as low as 4.6° C (stratum 60) and as high as 11.7°C (stratum 92) and were absent where temperatures were 7.6° and 7.4° C (strata 81 and 84). In contrast to the autumns of 1980 and 1981, no squid were found in strata along the edge of the Shelf in 1982.
Distribution in 1983. In the summer (Fig. 6A), the areas of highest temperature were somewhat similar to those in 1982, the most significant difference being the extension of intermediate temperatures eastward along the edge of the Shelf (strata 53 and 54) to the Gully and to Sable Island Bank (stratum 55). The highest squid densities (Fig. 6B) were not found in the high temperature strata but in areas of intermediate temperature (6.6° to 6.8° C) south of Emerald Basin (stratum 65) and along the edge of the Shelf (stratum 54), as well as in the Gully (strata 52 and 57) where temperatures were low (4.0° to 4.8° C). Squid were present in low density around Browns Bank (strata 81 and 82) where temperatures were 6.9° and 8.7° C respectively, and in stratum 62 (8.2° C).
In the autumn (Fig. 6C), bottom temperatures were high in a large area from Browns Bank northward into the Bay of Fundy (8.3° to 11.2° C), along the edge of the Shelf to about 61 ° W (9.0° to 9.6° C), and south of Emerald Basin (8.5° C). Temperatures were intermediate in most of the remaining strata on the central part of the Shelf and were low in the northeastern strata. Squid density was generally low in the few strata where they were found (Fig. 60), the largest concentrations being along the edge of the Shelf and in strata 53, 54, 65 and 78. An isolated low density concentration also occurred north of LaHave Basin (stratum 71).
Distribution of small squid in late summer
Late-arriving secondary and tertiary cohorts of small squid have been regularly observed during late summer and autumn on Georges Bank (Lange and Sissenwine, MS 1981) and occasionally on the Scotian Shelf (Mesnil, 1977). The latter author also noted the dominance of a cohort of small squid (7-15 cm ML) in a combined length frequency from the northern part of Georges Bank and the Scotian Shelf in late NovemberDecember 1975, stating that they were mainly prevalent on the Scotian Shelf. During the seasonal surveys in 1980-83, distinct cohorts of small squid were most evident in the September and October surveys. The geographic distribution of squid less than 13 cm ML in September are shown in Fig. 7. It should again be noted that the September surveys did not cover the Bay of Fundy and its approaches or large areas of the Shelf east of 62°W.

63" 61" 59" 57" I I~ I
j t /J ::,:(~i:,:.: A. July
Bottom Temp.
J l o <6'C
o 6-S'C
lID >8'C 42°1- ~
47°1-
~~ n~ l r D. B. July :::: :~:': . -
46" r- ;.~ {i71A ~ V::::~i: iZJ ~ l r-
45° f- '-.:."r.~ I""":qr-.....-.L/q.:; //..< .. ;. ' .. :.:.:-.~: ... , .:':::.~ fi:·:·:;:;::~:,:J.".~:;:::::I ...,- \\\ -j I-
~r I S ~ F
67" 65" I )ff A
October ~~ _ .. _ .. _ .. _ ..
;;'" ')'JA.
',':"\A ~~"""""'-Q" //.:.::;.: .... ,;.::.:.".:,!,;,".:"
y
63" I
~
: ":.::?iT"
W 59" 57"
I~ I 1 47
" ://\:.:
46"
45"
44"
Bottom Temp.
o <6'C l o 6-fl'C
lID >8' C - 42°
17J(~ : .. : , . ." r" Vi i.~!i (tv AlMS;;:" l4b"
/ I~r ~"§ :a ii \\\
of Squid/no mile2
0500-5000
05001 .. 10000
1m >10000
-145 0
44"
,,~o ! I 610 <:"0 ~42°
Fig. 3. Distributions of mean bottom temperature (upper) and short-finned squid density (lower) by strata on the Scotian Shelf in July and October 1980.
OJ
(f) () :-
0 0 c ::l Q
(f) .-+ C a. (ii" '!' Z ~ _<0
-" <0 OJ (J1

63'
47'
A. July
46'
45'
B. July
43'
59' 57'
Bottom Temp.
o <6°C
(] 6~8°C
IlIlll >8°C
o 50(}-5000
D 5001~1 0000
!ill >10000
63'
D. October
59' 57'
Bottom --emp
o <6°C
(] 6~8'C
Ii!i!l >8'C
o 500~50CO D 5001--1(1000
IlIIiI >10000
45'
44"
46'
45'
44"
42'r- 'L I I I =j r- 'F I ~42' 670 65° 63° 61" 59° 57° 6r 65" 63" 61° 59" ~-~
Fig. 4. Distributions of mean bottom temperature (upper) and short-finned squid density (lower) by strata on the Scotian Shelf in July and October 1981.
JJ o :2: m r r ~ III
-q;-><
q;-() <!> c:r a en c: en o :J ..... :::r <1l (J) ()
g. !l> :::l (J) :::r ~ --' <.!) co o I
co c.v
co

59" 57" I JL 47"r-
A. July
NEW B 46'
Bottom Temp.
o <6'C
o 6-8'C
ili!l >8'C
B. July ~~ I;W~ II
46" r- \i .. i''J:!". ~ V;'.~i itv ~ if-
45" ~ ;~&t"sCO'\\P-~/s9 I A' ~L
mlle2
67" 65' 63" 61" 59" 57" I ~ I .,m(\
""" '~ 46
;; 48
~49
Bottom Temp.
o <!l°C
o 6-8'C
ili!l >3'C
D. October Ci~ !3··.~1 ~~
.- .. ~ .. ~ .. ~ ... ~" \i·)t5.. -=s C'.·)~/· !b) -0 ~
;~~·sco'\\P-i .. ~759 I ~~'
of Squicl/n. mile'
o 50(}-5'JOO
[l 5001-10000
[ill >100('0
J.7"
45'
44"
l" 42'
47"
-1 46'
t"
44"
43"
T "] C J J ) ! I =j42" 67" 65° 63° 61 0 59° 57"
Fig. 5. Distributions of mean bottom temperature (upper) and short-finned squid density (lower) by strata on the Scotian Shelf in July and October 1982.
I\) o
(fJ (") ~
0 0 C ::l ~
(fJ
C-o. CD (J) -z ~ 50 -'-<D ()O (J1

59' 57' 59' 57'
A c
46'
45'
44' 44'
I Bottom Temp. Bottom Temp.
43' o <6°C o <6°C -143'
o 6-SoC
mJ >S'C
o 6-8°C
iIl!i! >lloC
=j r "C -----L-:J 42°r Y Ii :,.::1'1. ~
".:;;/1.
47'
B. July B
44'
mlle2
43'
D. October I)
of Squid/no mile'
o 50G-5000
D 5001-10000
I!iII >10000
42'
47'
46'
45'
44'
43'
42'r Y I I I I j t r I I I ~42' aJO 65° 63° 610 59° 57° er 65° 63° 610 59° 57°
Fig. 6. Distributions of mean bottom temperature (upper) and short-finned squid density (lower) by strata on the Scotian Shelf in July and October 1983.
:D o ~ m r r ~ ~
iD >< -. 1if C) (J)
0-a (.0)
c: (.0)
o :J
:Y (J)
en C)
o !:!'. III :J
en ::J"
~
CD (Xl o I
(Xl W
I\:)
22 Sci. Council Studies, No.9, 1985
66' 58'
46'
() 26-50
Q 51-15
.76-100
A. September 1980 • >100
46'
44'
ct 26-50
~ 51-75
.76-100
B. September 1981 .>100
66' 62' 60'
D. September 1983
64' 62' 60'
58'
~ 1-25
() 26-50
~ 51-75
076-100
8>100
00
~ 1-25
()26-50
" 51-75
.76-100
8>1(l{)
58'
46'
42'
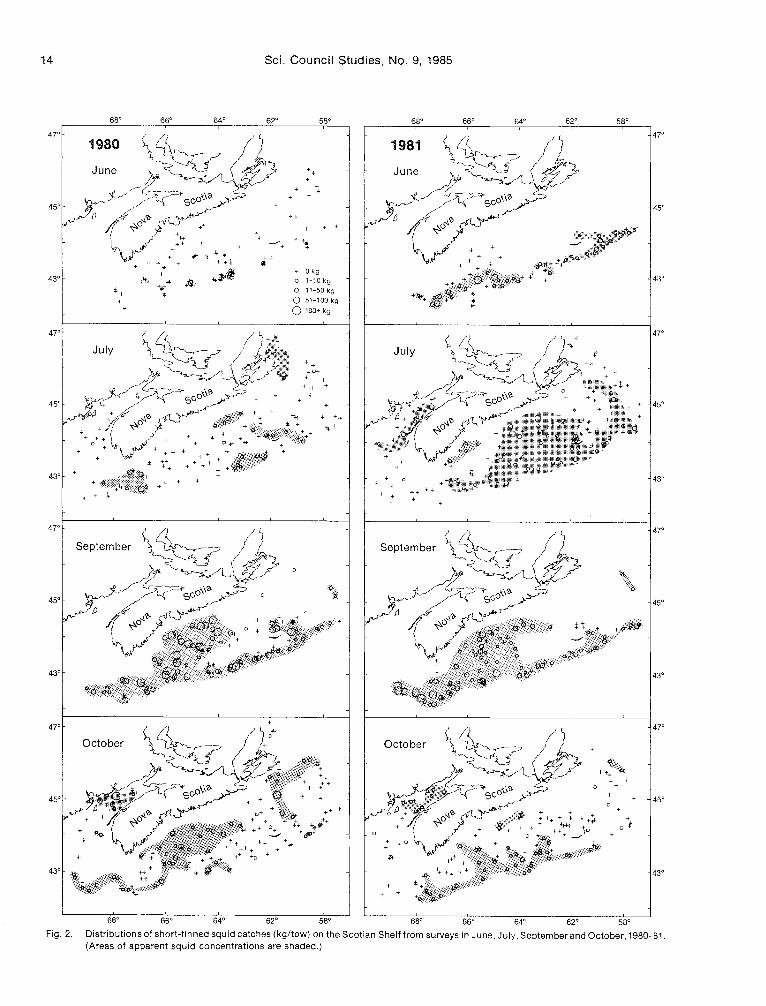
Fig. 7. Distributions (number/tow) of small short-finned squid «13 em ML) from the late summer surveys of the Scotian Shelf in 1980-83.
In 1980 (Fig. 7A), small squid were very scarce, with catches of a few specimens «25) at only a few stations, mainly along the edge of the Shelf from 58° to 65°W, and one catch (>50 specimens) near Emerald Bank. During this survey, larger squid were distributed more widely on the central part and along the edge of the Shelf from the Laurentian Channel to the Gulf of Maine (Fig. 2A).
In 1981 (Fig. 7B), small squid were encountered in small numbers at stations over a wide area on the western half and along the edge of the Shelf with three larger catches (>100 specimens) on the southern slope of Sable Island Bank. The distributional pattern was similar to that for the overall catches of squid (Fig. 2B). except that there were no small squid in several moderate to large catches along the edge of the Shelf south of Browns Bank (65° to 67°W).
In 1982, when individual catches of small squid were highest (Fig. 7C), they were present in small numbers at several stations on the central and western parts and along the edge of the Shelf from approximately 62 0 to 66°W, with two large catches south of LaHave Bank (64° 30'W) and one south of Emerald Bank (62°W). The distribution was quite similar to that for the overall catches of squid (Fig. 2C).
In 1983 (Fig. 70), a few small squid were encountered at many stations on the central part of the Shelf and at several stations along the edge of the Shelf from
62° to 66° C, with no catches exceeding 25 specimens. I n contrast, the largest overall concentrations of squids in September were along the edge of the Shelf (Fig. 20).
As a general pattern, the distribution of small squid was limited mainly to the central and western areas and the edge of the Shelf, with only occasional small catches east of approximately 600 W. In some years, the distribution of small squid differed more from the distribution of total squid catches than in others. For example, small squid were considerably more abundant and had a wider distribution during the late summer period in 1981 than in 1980 (Fig. 7A, B), whereas the largest catches of all squid were more numerous and more widely distributed during the same period in 1980 than in 1981 (Fig. 2A, B). It is also noteworthy that the largest catches of small squid occurred only along or near the edge of the Shelf, and there were not many large squid in these catches. With one exception, small squid were not found in tows where the total squid catch exceeded 75 kg, indicating possible differences between small and large squid in schooling behavior and/or habitat preference. Although the largest catches of small squid were on the outer part of the Shelf, small numbers occurred frequently at shallower depths and closer to the coast.
Small squid were found in catches from 75 to 350 m, which corresponded approximately to the depth range of squid catches in general, but, in all years,

ROWELL et al.: IIlex i/lecebrosus on the Scotian Shelf, 1980-83 23
250
300
350
E -400
0= 165 m
N = 96 [):: 191 m
N::: 29249
is,, 138 m N::: 654
[) = 196 m N =9829
.c Q. ~ 50 1982 1983
100 ===B 150 ~ 200
250
300
350
400 [):: 139 m
N :: 883
6:::; 192 m N ::: 4017
[) = 178 m
N = 131
is 198 m N :: 9066
40 30 20 10 0 10 20 30 50 40 30 20 10 0 10 20 30 40
Frequency (%)
Fig. 8. Bathymetric distribution of small short-finned squid «13 cm ML) (shaded) and all short-finned squid in catches from the late summer (September) surveys of the Scotian Shelf. 1980-83. (5 is mean depth; N is number of squid caught.)
more than 50% of the small squid were from depths less than 175 m (Fig. 8). The closer agreement between depth of capture of small squid and all squid in 1982 and 1983 than in the preceding years appears to support the conclusion, reached above, that the distributions of small and large squid were similar in those years.
Biological Characteristics
Length frequencies
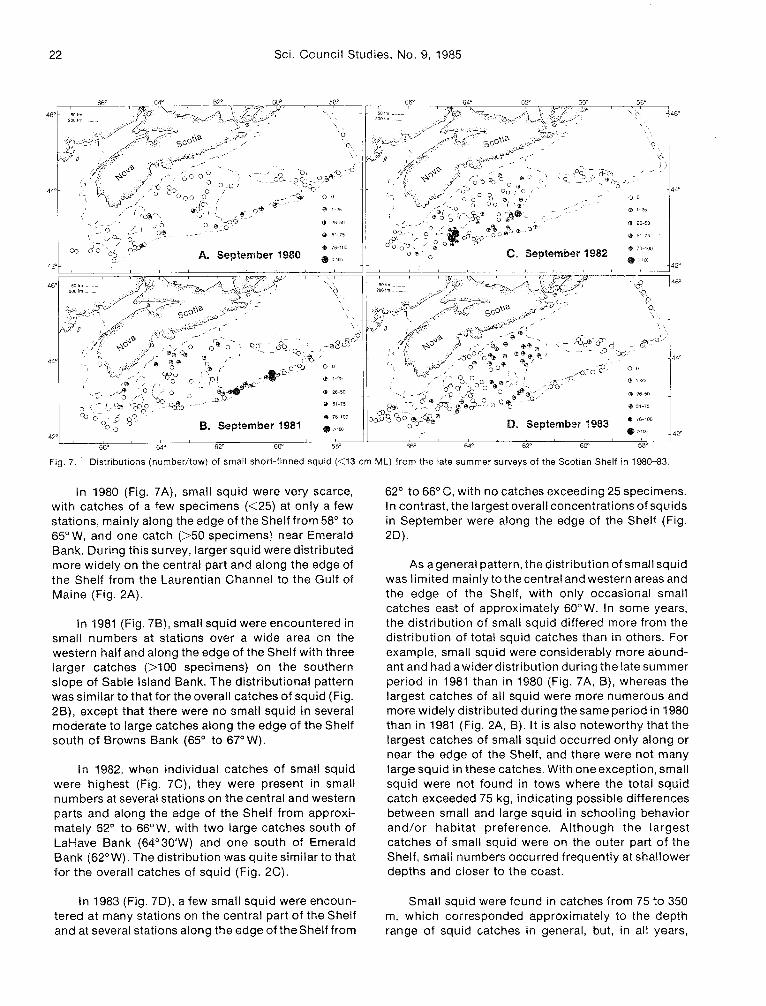
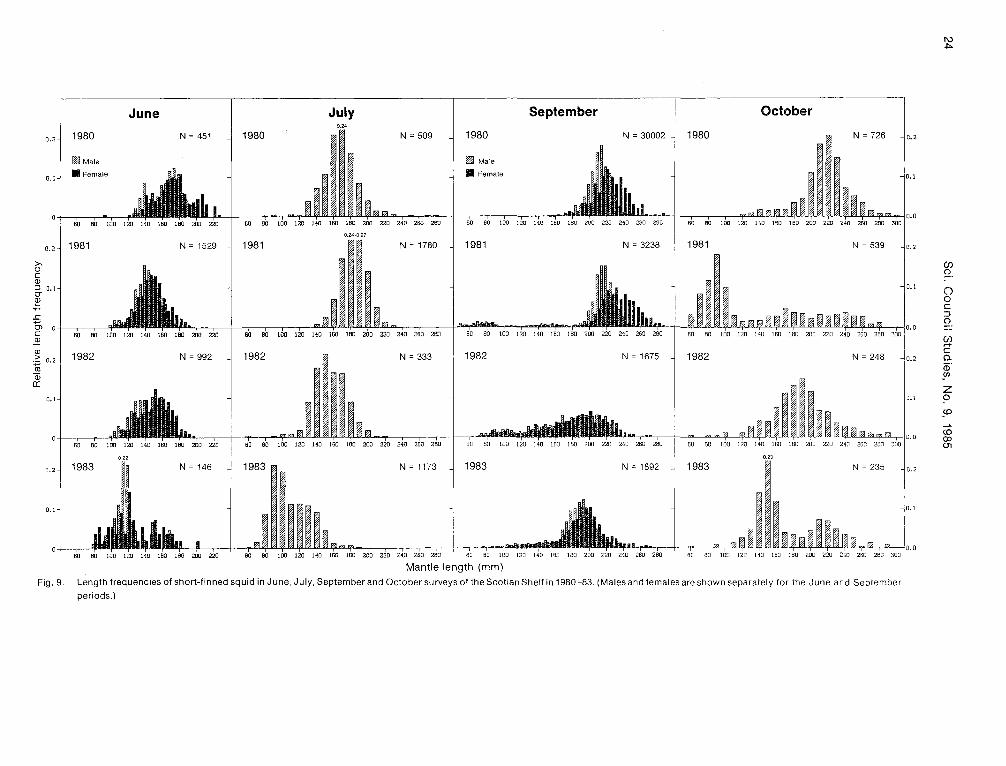
Although the research vessels and gears were different for some of the surveys, the data do not indicate that these differences had a significant impact on the sizes of squid that were caught (Fig. 9). Length frequencies of males and females are given separately for the late spring (June) and late summer (September) periods, because these su rveys were directed primari Iy towards research on squid, whereas the summer and autumn surveys were directed primarily towards research on groundfish. Also, only the data for the 18 consistently-surveyed strata were used.
In all years, there was a seasonal trend of increasing size, with modal sizes in the ranges of 11-17 cm ML in June and 19-23 cm ML in September, but the pattern is less clear in the autumn. This seems to be related in part to the increasing influence of large numbers of small squid on the overall length distributions in the autumn and in part to the combined impact of fishing and natural mortality and the emigration of larger squid from the Shelf. The largest squid were 20-22 cm ML in June and 28-30 cm ML in October. It has long been documented that, during the period when squid
are present on the continental shelf, the modal lengths of females are greater than those of males (Squires, 1957; 1967; Mercer and Paulmier, MS 1974). This is also evident in the present data for the Scotian Shelf. In 1980 and 1981, the disparity betv-Jssn modal lengths of males and females increased markedly between late spring and late summer but no such increase occurred in 1982 and 1983.
In 1980, squid were considerably larger in June and October than in any other year, and there was a regular progression in growth of the single cohort du ring the season, with insignificant numbers of small squid «13 cm ML). In 1981, the major cohort was clearly distinguishable from June to September, but two cohorts of small squid were noticeable in the latter period and these contributed to the trimodality of the length distribution in October. Another factor which could have enchanced the apparent dominance of the two groups of small squid at that time may have been the early emigration of large squid from the Shelf.
In 1982, growth of the major cohort from June to September was less than in the preceding years and the September length distribution was more complicated by the inclusion of two or more cohorts of small squid with overlapping ranges. It seems that many of the squid from the cohort with modal size around 20 cm ML in September were not present in October and that the length distribution (with mode at 19 cm ML) was composed mainly of squid that had been less than 18 cm ML in September. In 1983, the small size of the June sample makes it unrealistic to relate it with the later ones because these squid were, on the average, larger than those in the July sample. However, if the squid from the July and September samples belonged to the same cohort, growth during this period in 1983 was greater than in any of the preceding years. By October, the length distribution was clearly dominated by a cohort of small squid (14-16 cm ML) which were not present in significant numbers during the September survey. Again the dominance of this group may have been greatly enhanced by the decreased abundance of larger squid through emigration from the Shelf. Overall, the greater variability in the progression of cohorts from June to Septem ber after 1982 may have been due to the greatly reduced abundance of squid on the Shelf and the wider dispersal of those that were present.
Maturation
Data on maturity of short-finned squ id were available for the June, July and September periods, with the exception of July 1981 and June 1983 (Table 3). There was little or no apparent change in maturity from late spring to summer in 1980 and 1982, with both males and females largely in stages I and II. Over the same period in these years, there was little, if any, progression in mantle length (Fig. 9), probably due in part to
o.
0.1
1980
fi!ll Male
I! Female
June July 0.24
N = 451 1980 N = 509 1980
fi!ll Male
I! Female
September
N = 30002
October
1980 N = 726 0.2
0.2 N = 1780 1981 N = 539 -10.2
>() C Q)
::J O. 0"
~ .s:: 0, c Q)
Q)
.~ o. Cil a; 0:
o.
0.2
0.1
Mantle length (mm)
Fig. 9. Length frequencies of short-finned squid in June, July, September and October surveys of the Scotian Shelf in 1980 -83. (Males and females are shown separately for the June and September
periods.)
0.1
I\) -I>-
(f) (")
() 0 C ::J (")
~ c 0.. <D '!' Z ~ ~
to (» U1

ROWELL et al.: IIlex illecebrosus on the Scotian Shelf, 1980-83 25
TABLE 3. Proportions of male and female short-finned squid in various stages of maturation from sampling of catches during three seasonal surveys of the Scotian Shelf in 1980-83. (Maturity stages according to Amaratunga and Durward (1979) for males and Durward et al. (1979) for females.)
Male Female
No. of Maturity stage No. of Maturity stage
Month Year squid I II
Jun 1980 268 0.82 0.18
1981 830 0.70 0.30 1982 591 1.00 1983
Jul 1980 259 0.90 0.10 1981 1982 349 0.99 001 1983 57 0.75 0.23
Aug 1980 295 0.43 0.45 1981 1,401 0.45 0.33 1982 1,034 0.90 0.09 1983 769 0.85 0.14
the continuing immigration of smaller squid to the Shelf. By late summer (September) of 1980 and 1981, the progression of maturation was quite evident, with a marked increase in the proportions of males and females at stages II and III, and this coincided with a su bstantial increase in mantle lengths. I n September 1982, the maturity of both males and females was less advanced, with the frequencies being similar to those normally observed in late spring and summer. The 1982 pattern was likely to have been due to lower matu rities of the large number of small sq uid that were present in the late summer population (Fig. 9). In 1983, the maturation process was evidently delayed, particularly for males, which, in September, were mainly stage I, whereas females were largely stage II. These matu rities also reflect the smaller sizes of squid on the Shelf in September 1983, with modal lengths only slightly greater than those for samples in July 1980 and 1981. The higher proportions of squid in more advanced stages of maturity in September 1980'and 1981 are evidently related to the high abundance of large squid and the relative scarcity of small squid in the samples.
Conclusions
Distributions of mean bottom temperatures on the Scotian Shelf show a regular pattern, generally with warmer water (>6° C) on the southwestern half of the Shelf (west of approximately 62°W) and cooler water to the northeast. From spring to autumn there is usually an extension in coverage of the warm water on and along the edge of the Shelf.
Highest concentrations of squid were most consistently found on the western part of the Shelf around Browns Bank and in areas to the south of and bordering the east side of Emerald Basin with intermediate
III squid I II III IV
250 0.85 0.10 0.05 760 0.79 0.20 0.01 451 0.94 0.05 001
284 0.84 0.14 0.02
386 0.78 0.21 001 0.02 112 0.91 0.06 0.02 0.01
0.12 231 0.10 0.61 0.29 0.22 1,594 0.08 0.62 0.30 0.01 958 0.52 0.43 0.05 0.01 840 0.08 0.87 0.05
(6° to 8° C) and high (>8° C) bottom temperatures. In most years, squid occurred in higher density in one or two strata during a particular season than in all other strata.
Although squid seemed to prefer areas where bottom temperatures exceeded 6° C, high concentrations were often found in areas with much cooler water, indicating that temperature itself is not limiting.
In addition to the primary cohort of squid which appeared on the Shelf in late spring, secondary and tertiary cohorts of smaller squid were regularly observed on the western part of the Shelf in September and October. These small squid appeared to be relatively more abundant in years when the overall abundance of squid was low. Although these small squid generally had the same areal distribution as the larger squid, small-scale areal and bathymetric differences were evident.
Although there was a general increase in modal length of the primary cohort from July to September, between-year and within-year length frequencies varied considerably. Maturation of males and females also varied widely from year to year, particularly in late summer. This variation was evidently due to varying size distributions.
Acknowledgements
We thank the many scientific and technical personnel of Canadian and French research laboratories for collection of the data during the research vessel surveys and subsequent processing, and Christine Hunter for her considerable efforts in the computerprogramming that was necessary for analysis of the data.
26 Sci. Council Studies, No.9, 1985
References
AMARATUNGA. T. and F BUDDEN. MS 1981. Pre-season distribution and abundance of squid Illex illecebrosus on the Scotian Sheif i981. NAFO SeR Doc., i...Jo. 100, Serial No. N399. 10 P
AMARATUNGA. T. and R. D. DURWARD. 1979. Standardization of data collection for the short-finned squid, IIlex il/ecebrosus ICNAF Sel. Papers 5: 37-41.
AMARATUNGA, T, and M. ROBERGE. MS 1981. Summary of 1980 II/ex illecebrosus fishery in SA 4 in relation to 1977-1979 data NAFO SCR Doc., No 35, Serial No. N317, 12 p.
DOUBLEDAY, W. G. (Editor). 1982. Manual on groundfish surveys in the Northwest Atlantic. NAFO Sci. Coun. Studies, 2: 1-55
DUPOUY H. MS 1981. Biological characteristics and biomass estmate of the squid, IIlex il/ecebrosus, on Scotian Shelf (Div 4VWX) in late summer of 1980. NAFO SCR Doc .. No. 38, Serial No. N320, 13 p.
DUPOUY. H .. and D. DERIBLE. MS 1983. Biological characteristics and biomass estimate of the squid (llIex il/ecebrosus) on Scotian Shelf (Div. 4VWX) in late summer 1982. NAFO SCR Doc .. No. 39, Serial No. N693, 14 p.
DUPOUY, H., and J. P MINET MS 1982. Biological characteristics and biomass estimate of the squid (II/ex illecebrosus) on Scotian Shelf (Div. 4VWX) in late summer 1981. NAFO SCR Doc, No. 20, Serial No. N508, 12 P
DURWARD, R. D., T. AMARATUNGA, and R. K. O'DOR. 1979. Maturation index and fecundity for female squid, I/Iex il/ecebrosus (Lesueur, 1821). ICNAF Res. Bul/., 14: 67-72.
FEDULOV, P p, and TAMARA TUNGA. MS 1981. On dates of shortfinned squid, IIlex illecebrosus, immigration onto the Scotian Shelf. NAFO SCR Doc .. No. 32, Serial No. N311, 8 P
HALLIDAY, R. G., and A. C. KOHLER. MS 1971. Groundfish survey programs of the St. Andrews Biological Station, Fisheries Research Board of Canada: objectives and characteristics.ICNAF Res. Doc, No. 35, Serial No. 2520, 25 p.
KOELLER, P. A. MS 1980. Distribution, biomass and length frequencies of squl:d (Ii/ex il/eceb(osus) and silver hake (Mer/uce/us bilinearis) fisheries on the Scotian Shelf in 1979. NAFO SCR Doc., No. 17, Serial No. N049, 11 p.
LANGE, A. M. T., and M. P. SISSENWINE. MS 1981. Evidence of summer spawning of II/ex illecebrosus (LeSueur) off the northeastern United States. NAFO SCR Doc .. No. 33, Serial No. N315, 17 p.
MERCER, M. C., and G. PAULMIER. MS 1974. Distribution and biological characteristics of the short-finned squid (llIex illecebrosus) on the continental shelf of Subareas 3 and 4 in May-June 1973. ICNAF Res. Doc., No. 87, Serial No. 3323, 11 p.
MESNIL, B. 1977. Growth and life cycle of squid, Loligo pealei and IIlex il/ecebrosus, from the Northwest Atlantic. ICNAF Sel. Papers, 2: 55-69.
POULARD, J. C., T. W. ROWELL, and J. P. ROBIN. MS 1984. Biological characteristics and biomass estimates of squid (IIlex illecebrosus) on the Scotian Shelf (Div. 4VWX) in late summer, 1983. NAFO SCR Doc., No. 71, Serial No. N860, 14 p.
ROWELL, T. W., and J. H. YOUNG. MS 1984. Update of the distribution, biomass, and length frequencies of II/ex il/ecebrosus in Divisions 4VWX from Canadian research vessel surveys, 1970-1983. NAFO SCR Doc., No. 69, Serial No. N858, 12 p.
SQUIRES, H. J. 1957. Squid, Illex illecebrosus (LeSueur), in the Newfoundland fishing area. J. Fish. Res. Board Can., 14: 693-728.
1967. Growth and hypothetical age of the Newfoundland bait squid IIlex il/ecebrosus il/ecebrosus. J. Fish. Res. Board Can., 24: 1209-1217.