changes in coal industry structure and trading · [email protected] 1 changes in coal...
TRANSCRIPT
Changes in Coal Industry Structure and Trading
Global InsightDecember 2005
Guillaume PERRET

Changes in steam coal market structure
• Decrease in market power from traditional mining company
• Emergence of new countries and new suppliers as major exporters
• Physical steam coal becomes a commodity
• New physical traders enter the market
• Robust growth in coal derivatives volumes
• Barriers to entry reduce
• Increased complexity: freight, emissions, gas interaction

Emergence of new exporters
Steam Coal Exports by Major Exporters , 2000 – 2004 % change Country 2000 2001 2002 2003 2004 2000-04 Australia 80 87 98 104 108 35.0% Indonesia 58 67 75 93 103 77.6% China (net exp.) 41 70 62 61 68 65.9% South Africa 69 67 71 72 67 -2.9% Colombia 35 39 35 46 54 54.3% Russia 30 29 29 40 51 70.0% Total 313 359 370 416 451 44.1%
Source: EIA / Global Insight / Verein der Kohlenimporteure / industry sources / Prospex Research
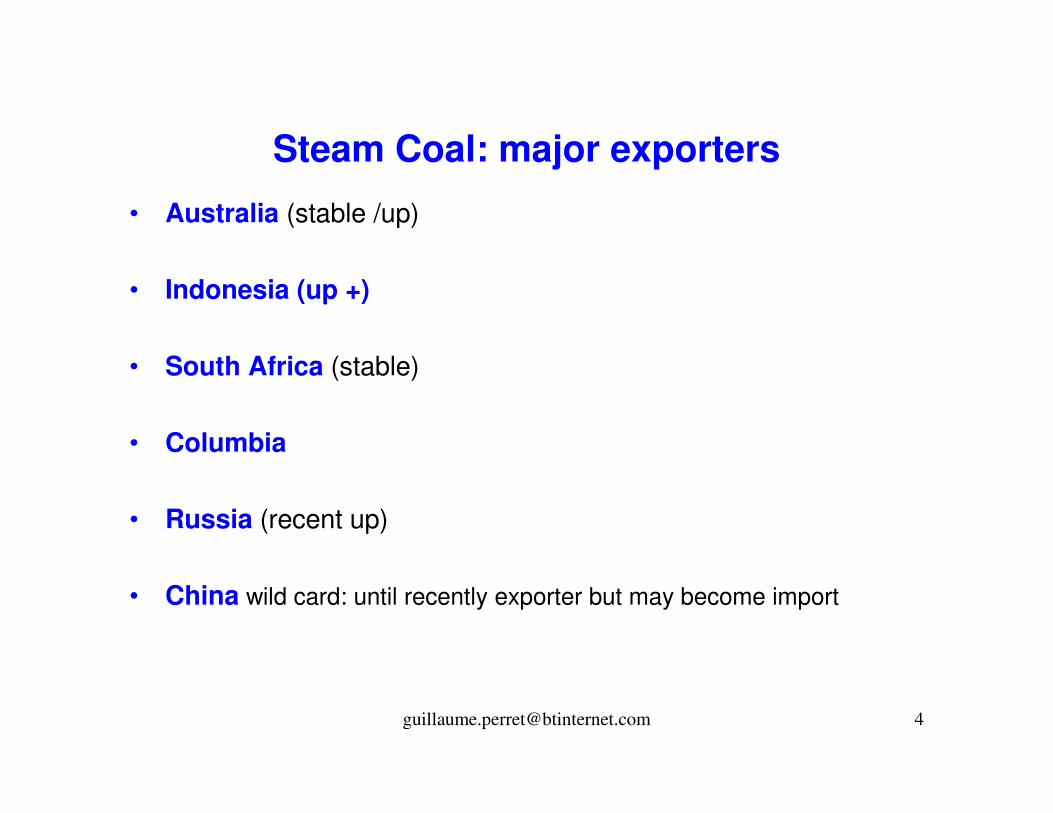
Steam Coal: major exporters
• Australia (stable /up)
• Indonesia (up +)
• South Africa (stable)
• Columbia
• Russia (recent up)
• China wild card: until recently exporter but may become import
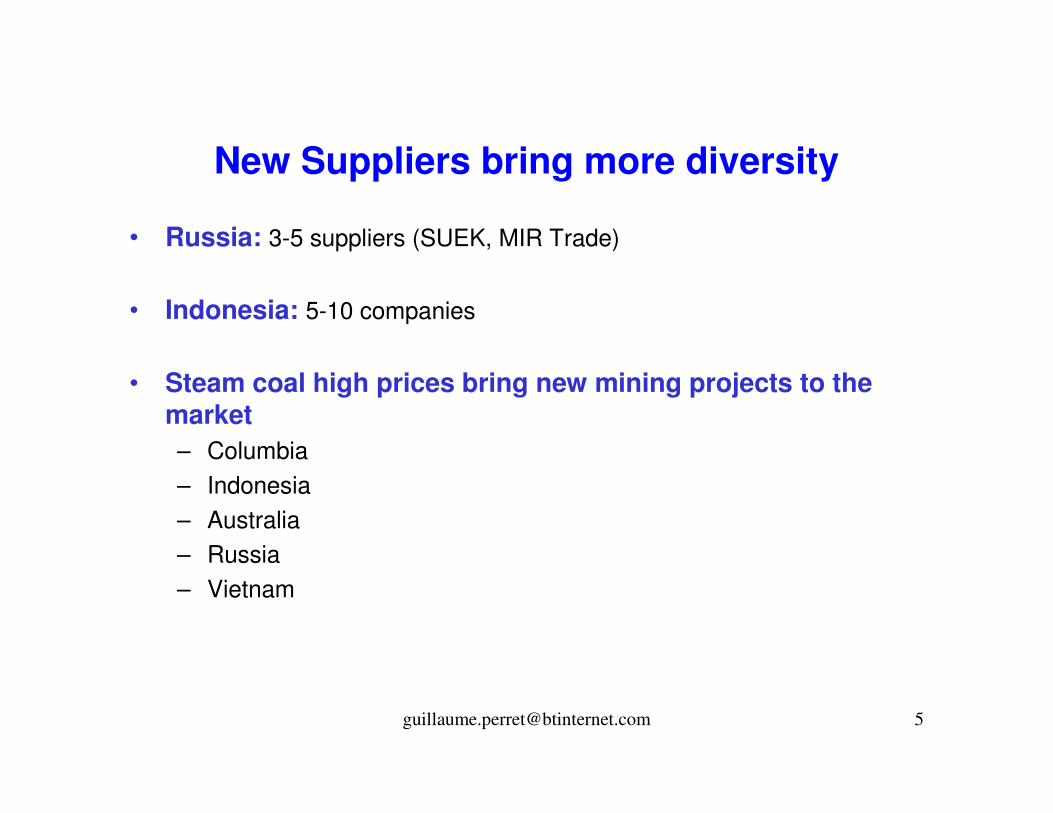
New Suppliers bring more diversity
• Russia: 3-5 suppliers (SUEK, MIR Trade)
• Indonesia: 5-10 companies
• Steam coal high prices bring new mining projects to the market – Columbia– Indonesia– Australia– Russia– Vietnam

Steam Coal flows become more complex
�� � � � � �� �
��
� � � � � �
� � �
� �
� � � � �
� � � � � �
� � � � � � �
� � �
� � � � � � � �
Exporting country Importing country
� � � � � � � � � �� �

Physical Coal as a Commodity
• Spot business – Before 2000: 80-90 % long term annual contracts – 2005: about 70 % spot business (either front or forward position)
• Different Ways of trading – Bilateral– Global Coal: only platform for physical trading– OTC brokers (growing)
• Why can utility take generic coal?– Flexible boilers – Logistic: imports large vessels and blending
• Who takes generic coal ? Germany, Scandinavia, The Netherlands
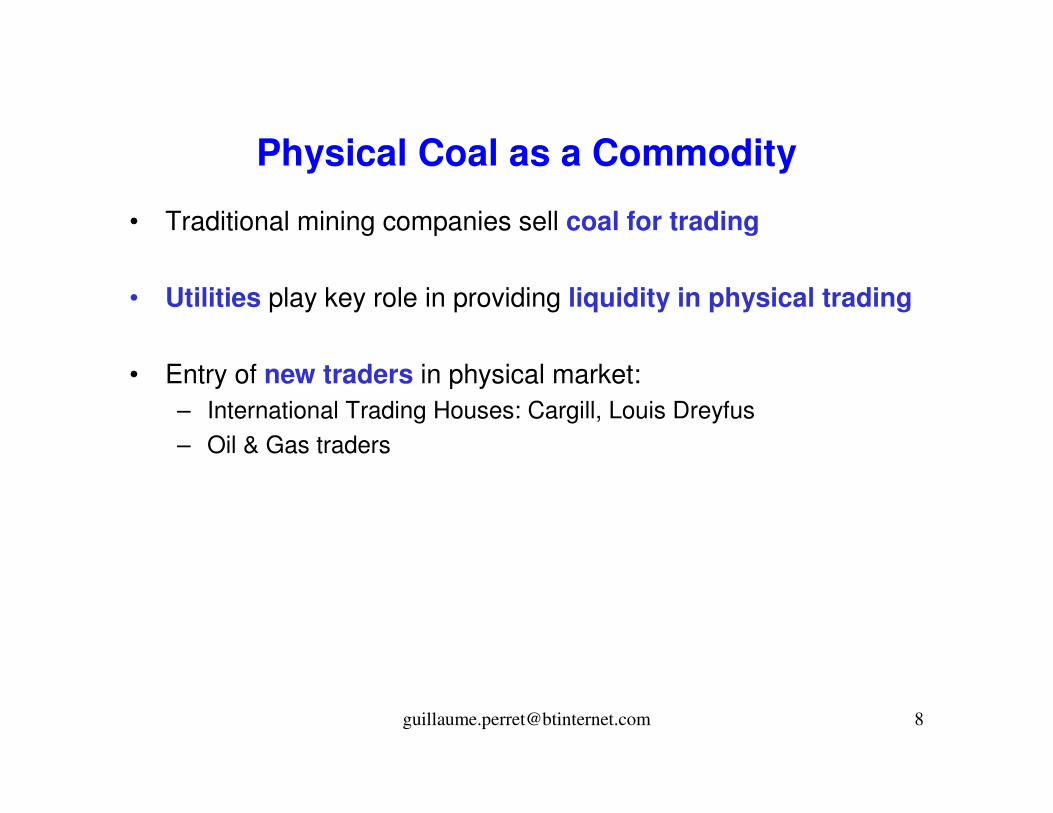
Physical Coal as a Commodity
• Traditional mining companies sell coal for trading
• Utilities play key role in providing liquidity in physical trading
• Entry of new traders in physical market:– International Trading Houses: Cargill, Louis Dreyfus– Oil & Gas traders
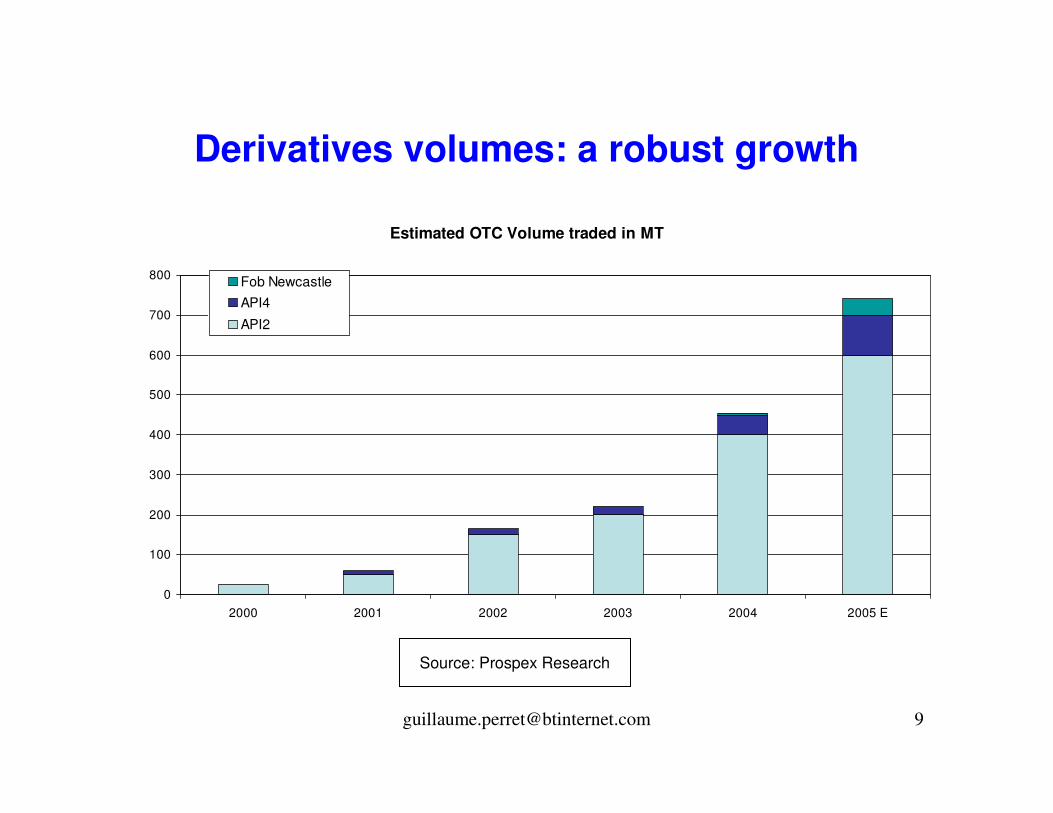
Derivatives volumes: a robust growth
Estimated OTC Volume traded in MT
0
100
200
300
400
500
600
700
800
2000 2001 2002 2003 2004 2005 E
Fob NewcastleAPI4
API2
Source: Prospex Research
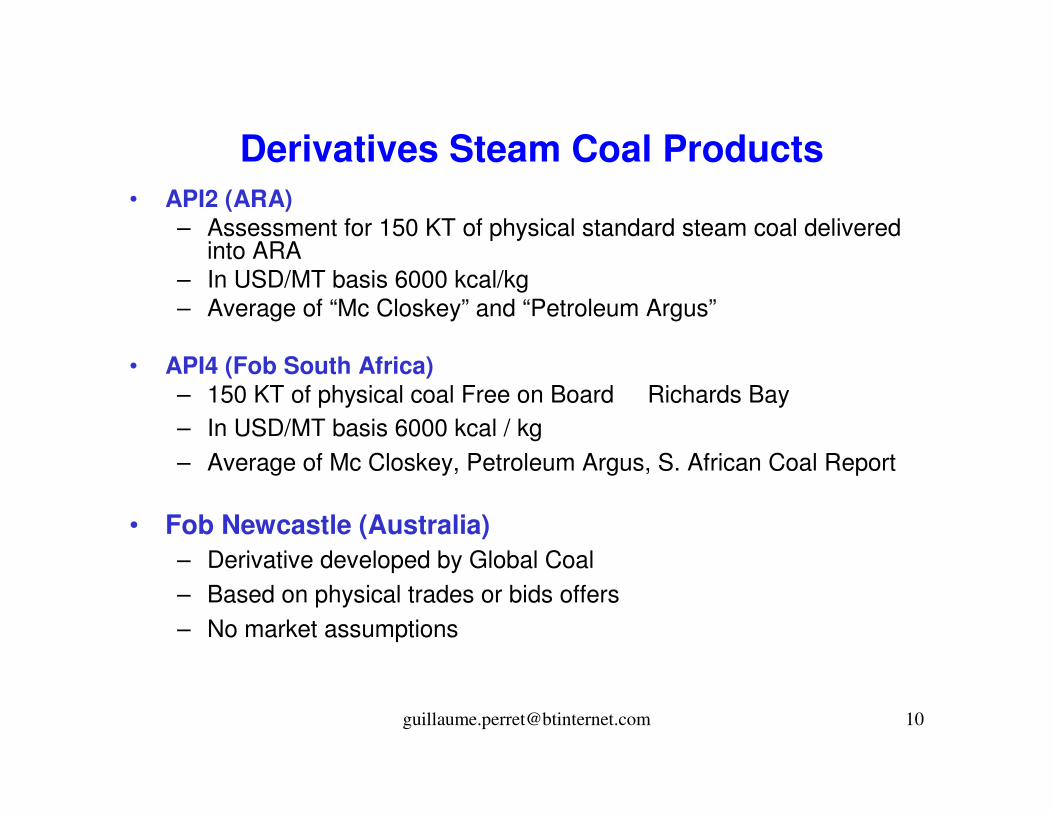
Derivatives Steam Coal Products• API2 (ARA)
– Assessment for 150 KT of physical standard steam coal delivered into ARA
– In USD/MT basis 6000 kcal/kg– Average of “Mc Closkey” and “Petroleum Argus”
• API4 (Fob South Africa) – 150 KT of physical coal Free on Board Richards Bay– In USD/MT basis 6000 kcal / kg– Average of Mc Closkey, Petroleum Argus, S. African Coal Report
• Fob Newcastle (Australia)– Derivative developed by Global Coal – Based on physical trades or bids offers– No market assumptions

Principals• Utilities: EDF, RWE, NuON, E.ON, Vattenfal, Energy E2
• Mining companies: Glencore, BHP Billiton, Rio Tinto
• Banks: Morgan Stanley, Barclays Capital, Deutsche Bank
• Asian players increasingly involved: – Australia (suppliers)– Japan (utilities) – China (suppliers) – Indonesia (suppliers)
• USA market still independent, NYMEX
Brokers
• Derivatives• GFI, ICAP, Amerex• TFS
• Physical• Global Coal (physical + financial)• Brokers (growing)
• Clearing• No clearing so far although talks• May develop in 2006 / 2007
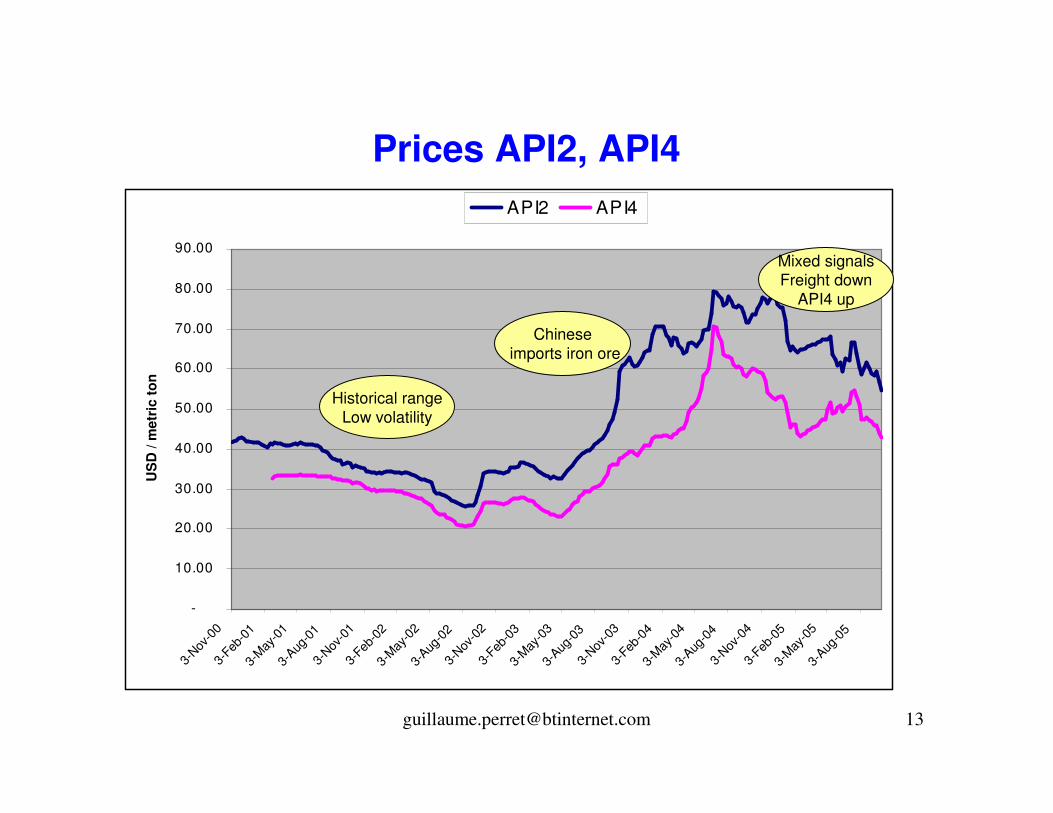
Prices API2, API4
-
10.00
20.00
30.00
40.00
50.00
60.00
70.00
80.00
90.00
3-Nov
-00
3-Feb
-01
3-May
-01
3-Aug
-01
3-Nov
-01
3-Feb
-02
3-May
-02
3-Aug
-02
3-Nov
-02
3-Feb
-03
3-May
-03
3-Aug
-03
3-Nov
-03
3-Feb
-04
3-May
-04
3-Aug
-04
3-Nov
-04
3-Feb
-05
3-May
-05
3-Aug
-05
US
D /
met
ric
ton
API2 API4
Historical rangeLow volatility
Chineseimports iron ore
Mixed signalsFreight down
API4 up


Freight prices: a brave new worldRichards Bay / Rotterdam Cape, 1989-2005
0
5
10
15
20
25
30
35Ja
n-89
Jan-
90
Jan-
91
Jan-
92
Jan-
93
Jan-
94
Jan-
95
Jan-
96
Jan-
97
Jan-
98
Jan-
99
Jan-
00
Jan-
01
Jan-
02
Jan-
03
Jan-
04
Jan-
05
US
$ / M
T
Source: Baltic Exchange
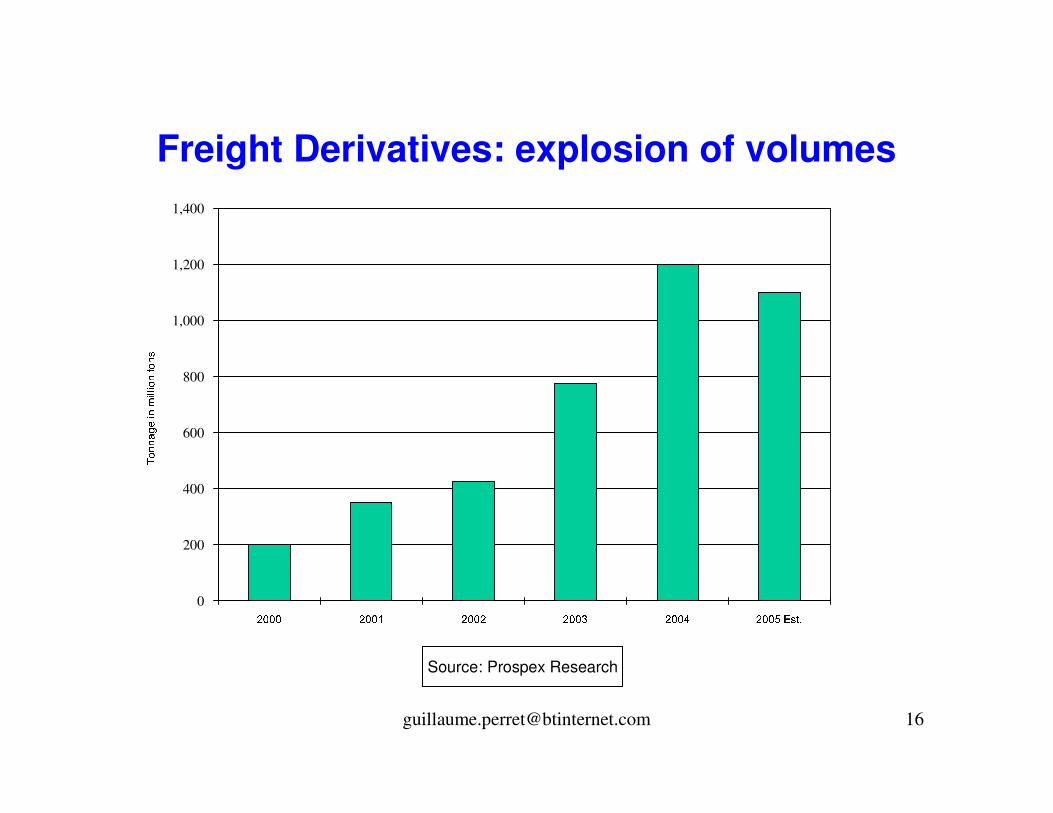
Freight Derivatives: explosion of volumes
0
200
400
600
800
1,000
1,200
1,400
�� � � �� � �� � � �� � ! �� � " �� � # $% &('
) *++
, -./
+0/11
/ *+2
*+3
Source: Prospex Research
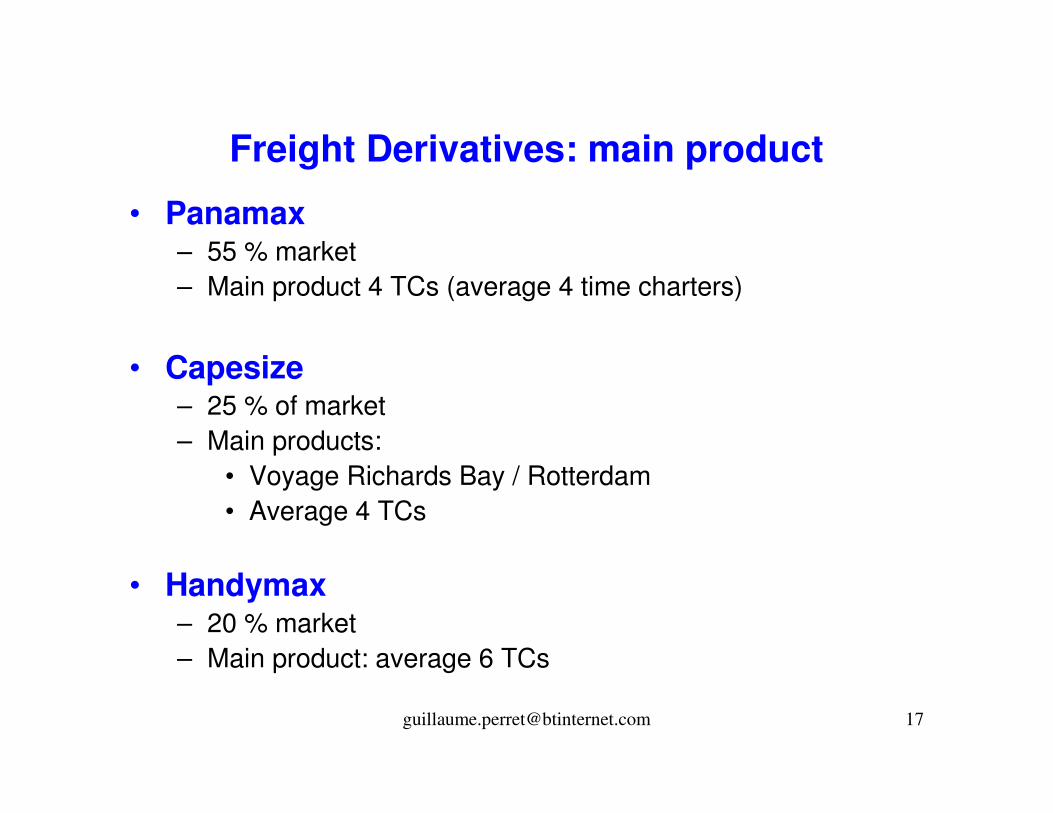
Freight Derivatives: main product
• Panamax– 55 % market– Main product 4 TCs (average 4 time charters)
• Capesize– 25 % of market– Main products:
• Voyage Richards Bay / Rotterdam • Average 4 TCs
• Handymax– 20 % market– Main product: average 6 TCs
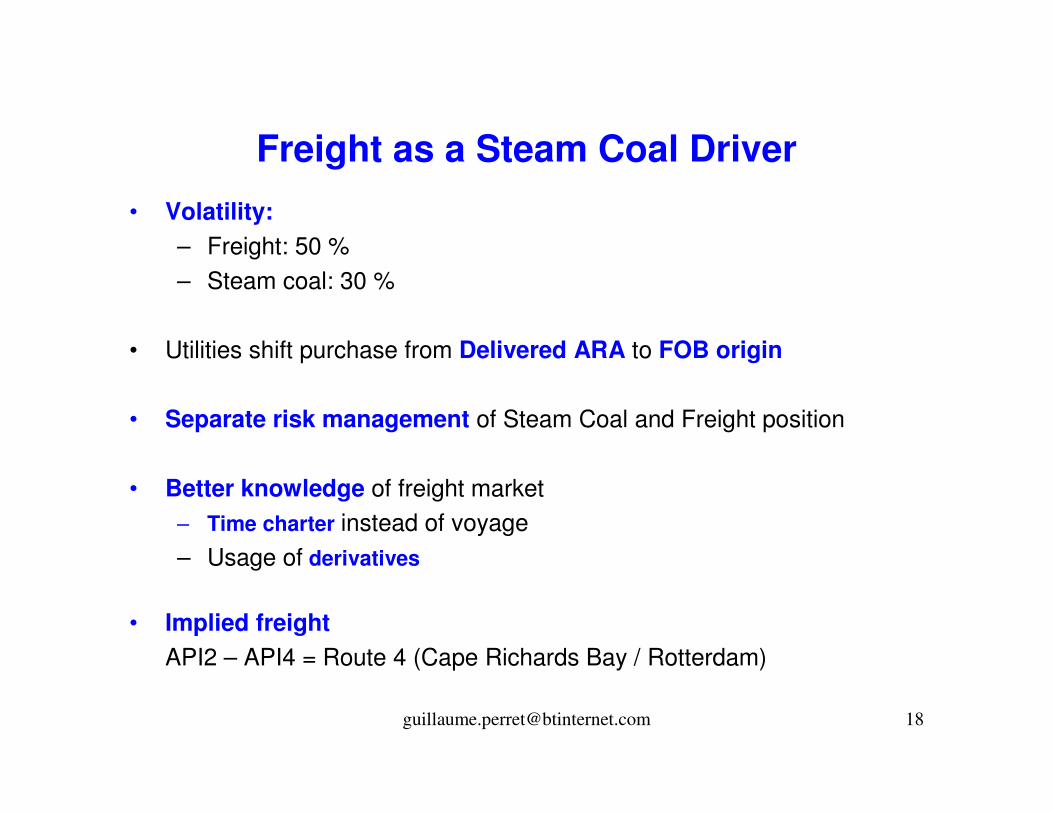
Freight as a Steam Coal Driver• Volatility:
– Freight: 50 % – Steam coal: 30 %
• Utilities shift purchase from Delivered ARA to FOB origin
• Separate risk management of Steam Coal and Freight position
• Better knowledge of freight market– Time charter instead of voyage– Usage of derivatives
• Implied freightAPI2 – API4 = Route 4 (Cape Richards Bay / Rotterdam)

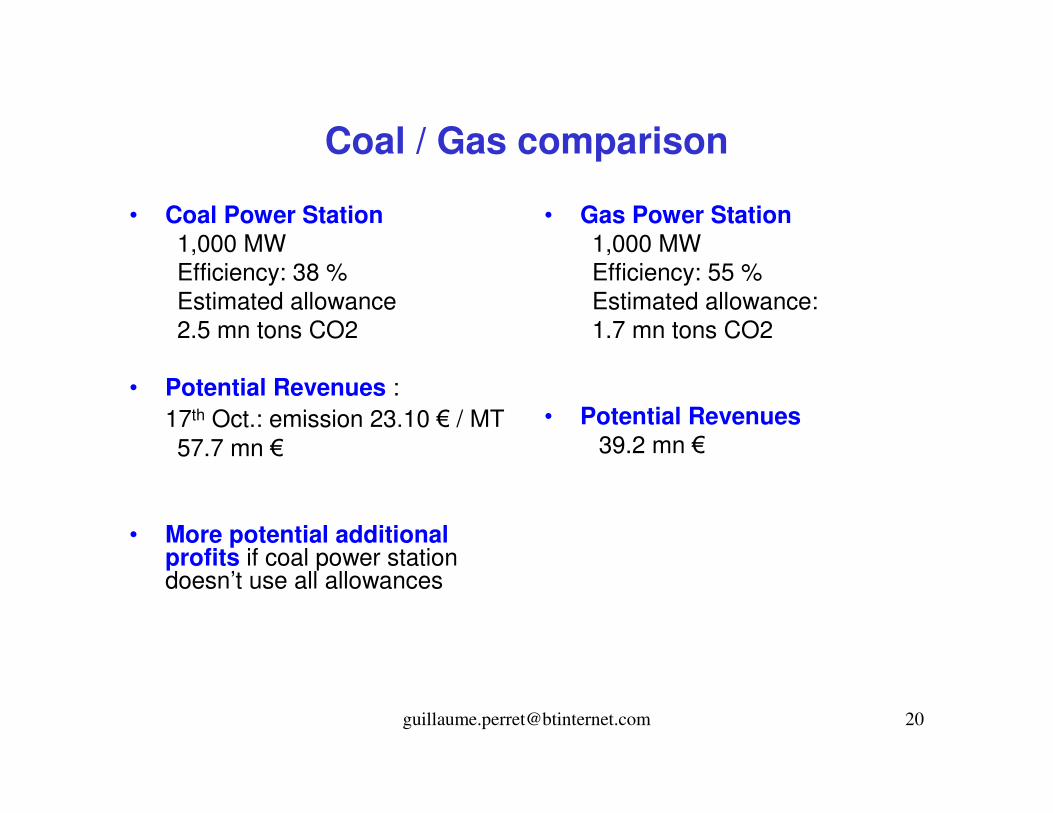
Coal / Gas comparison
• Coal Power Station1,000 MWEfficiency: 38 %Estimated allowance 2.5 mn tons CO2
• Potential Revenues :17th Oct.: emission 23.10 � / MT 57.7 mn �
• More potential additional profits if coal power station doesn’t use all allowances
• Gas Power Station1,000 MWEfficiency: 55 %Estimated allowance:1.7 mn tons CO2
• Potential Revenues39.2 mn �

Coal / Gas comparison
• CO2 release 0.34 ton / MWh Efficiency 38 %A.E: 0.895 ton CO2 / MWh
• Coal plant generates 2.5 times more CO2 per MWh produced
• Emission B.E: 23.1 � / ton CO2A.E: 20.67 � / MWh
• CO2 release0.1874 ton / MWh Efficiency 55 %A.E: 0.340 ton CO2 / MWh
• EmissionB.E: 23.10 � / ton CO2A.E: 7.87 � / MWh
• Emission price for gas is 35 to 40 % the one of coal

Coal / Gas comparison
0
5
10
15
20
25
30
35
40
1 3 5 7 9 11 13 15 17 19 21 23 25 27 29 31 33 35 37 39
Emission � / ton CO2
Add
ition
al C
ost
Coal Gas
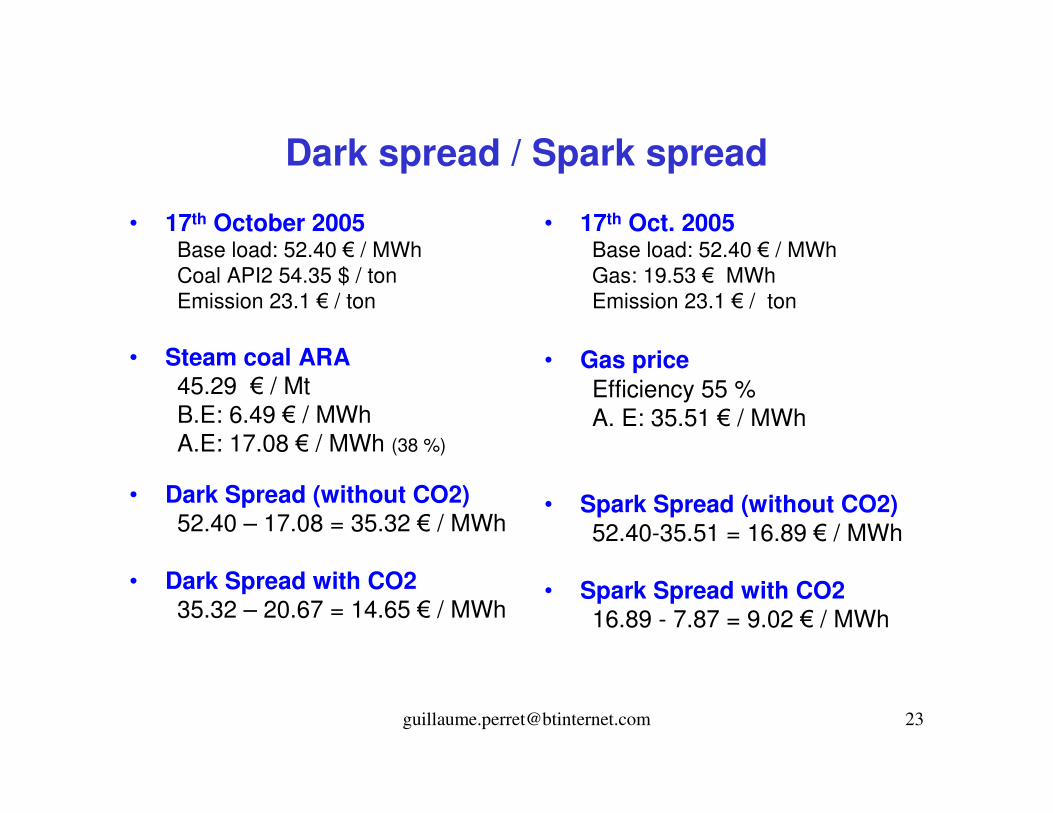
Dark spread / Spark spread
• 17th October 2005Base load: 52.40 � / MWhCoal API2 54.35 $ / tonEmission 23.1 � / ton
• Steam coal ARA 45.29 � / MtB.E: 6.49 � / MWhA.E: 17.08 � / MWh (38 %)
• Dark Spread (without CO2)52.40 – 17.08 = 35.32 � / MWh
• Dark Spread with CO235.32 – 20.67 = 14.65 � / MWh
• 17th Oct. 2005Base load: 52.40 � / MWhGas: 19.53 � MWhEmission 23.1 � / ton
• Gas priceEfficiency 55 %A. E: 35.51 � / MWh
• Spark Spread (without CO2)52.40-35.51 = 16.89 � / MWh
• Spark Spread with CO216.89 - 7.87 = 9.02 � / MWh
Coal / Gas comparison
• Cost of electricity production may rise due to additional allowance cost
• Utilities get important extra revenues if they don’t use all allowances
• Cost of allowance for gas after efficiency about 35 to 40 % of cost for coal
• End consumers pay additional costs ?!

Increased Interaction in Energy Mix • Increased correlation in energy mix
• If [Gas-Coal] up then demand coal up, allowance price up
• If nuclear and renewable output up, then coal demand down, allowance price down
• Electricity price up, then coal and allowance price up
• Emission become the centre point of the equilibrium ?