changes in brain biochemistry and feeding behavior in
TRANSCRIPT

Clemson UniversityTigerPrints
All Dissertations Dissertations
8-2008
Changes in Brain Biochemistry and FeedingBehavior in Hybrid Striped Bass Exposed toEnvironmental ContaminantsKristen GaworeckiClemson University, [email protected]
Follow this and additional works at: https://tigerprints.clemson.edu/all_dissertations
Part of the Animal Sciences Commons
This Dissertation is brought to you for free and open access by the Dissertations at TigerPrints. It has been accepted for inclusion in All Dissertations byan authorized administrator of TigerPrints. For more information, please contact [email protected].
Recommended CitationGaworecki, Kristen, "Changes in Brain Biochemistry and Feeding Behavior in Hybrid Striped Bass Exposed to EnvironmentalContaminants" (2008). All Dissertations. 281.https://tigerprints.clemson.edu/all_dissertations/281
CHANGES IN BRAIN BIOCHEMISTRY AND FEEDING BEHAVIOR IN HYBRID
STRIPED BASS EXPOSED TO ENVIRONMENTAL CONTAMINANTS
A Dissertation
Presented to
the Graduate School of
Clemson University
In Partial Fulfillment
of the Requirements for the Degree
Doctor of Philosophy
Environmental Toxicology
by
Kristen M. Gaworecki
August 2008
Accepted by:
Dr. Stephen J. Klaine, Committee Chair
Dr. Cindy M. Lee
Dr. Edward E. Little
Dr. Aaron P. Roberts
Dr. Thomas Schwdler
ii
ABSTRACT
Biochemical endpoints are useful when determining contaminant exposure in
aquatic organisms. However, behaviors can also be impaired by environmental
contaminants. Links between changes in brain biochemistry and behavior have been
made, and understanding these relationships could increase the utility of these endpoints
in ecological risk assessments. The overall goal of this research was to determine
relationships between an ecologically relevant fish behavior and brain biochemistry. To
accomplish this goal, I developed a behavioral bioassay that quantified the time it took
exposed hybrid striped bass (Morone saxatilis x M. chrysops) to capture unexposed prey,
fathead minnows (Pimephales promelas). Chemically targeted brain neurotransmitters
were also monitored, and the relationship with behavior was determined.
Six-day acute exposures to (1) a pesticide (diazinon) targeting
acetylcholinesterase (AChE) and (2) a pharmaceutical (fluoxetine) targeting serotonin
were conducted with a 6-day recovery periods. Brain biochemistry and behaviors were
plotted against each other. Our results indicated that there was a threshold response
between AChE activity and feeding behavior following diazinon exposure concentrations
of 19.1 ± 0.7, 64.0 ± 2.0, and 101.9 ± 1.4 µg/l. By day 6, AChE activity was significantly
inhibited in the low, medium, and high treatment groups by 66.3, 82.2, 86.4%,
respectively. However, there were no signs of behavioral impairment in the lowest
treatment group. During the 6-day recovery period, there were concentration- and
duration-dependent changes in feeding behavior and AChE activity, in which time to
capture prey decreased more rapidly than AChE activity increased. Following fluoxetine

iii
exposures (23.2 ± 6.6, 51.4 ± 10.9, and 100.9 ± 18.6 µg/l), a linear response between
decreased serotonin activity and increased feeding behavior was observed. However,
maximum serotonin depression in the low, medium, and high treatment groups occurred
on day 9 (day 3 of the recovery period) with concentrations at 23.7, 28.0, and 49.1% of
controls, respectively. Our results also indicated that during the recovery period, there
was a concentration- and duration-dependent increase in serotonin activity accompanied
by a decrease in time to capture prey.
A 27-day chronic exposure to fluoxetine was also conducted at lower exposure
concentrations (0.08 ± 0.02, 0.87 ± 0.12, 9.44 ± 0.82 µg/l) than the acute exposure. It
was concluded that although fluoxetine can cause impaired serotonin levels and feeding
behavior, this was not observed at more environmentally relevant concentrations over the
27 days.

iv
ACKNOWLEDGEMENTS
I would like to thank my advisor, Stephen Klaine, for pushing me to do my best
and never to give up. I would also like to thank my other committee members, Aaron P.
Roberts, Thomas Schwedler, Ed Little, and Cindy M. Lee for their contributions and
support in all aspects of my research throughout my work.
I would also like to thank everyone who has helped me achieve my goals,
especially Ron Gossett. Every time I ever need help in this project (which was quite
often) you were always right there to lend an hand and improve anything you could with
my test setups and everything over at Cherry Farm. All that for the price of a brownie! I
cannot thank you enough! I would also like to thank Kathy Bryant for always pointing
me in the right direction and helping me whenever I asked; Norman Ellis for all his help
with my analytical work; Tom Schwedler, Scott Davis, and Joe Tomasso for giving me
their expert advice on fish; and Billy Bridges for his help with my statistics. Many
thanks goes to all my labmates Anthony Sowers, Sarah White, Holly Zahner, Sarah
Robinson, Joe Bisesi, Amber Stojak, Amanda Steffens, Neil Capper, and Aaron
Edgington who all helped with my experiments. There is no way I would have been able
to conduct my tests without your help. The fish thank you too because otherwise they
would have starved!
Finally, I would like to thank my family for their support and encouragement
from day one. And most of all, I would like thank Jeff Beckhorn for being so patient,
understanding, thoughtful, and loving throughout our time here at Clemson. You helped
me through the toughest times here without ever asking for anything in return.

v
TABLE OF CONTENTS
Page
TITLE PAGE ................................................................................................................... i
ABSTRACT .................................................................................................................... ii
ACKNOWLEDGEMENTS ........................................................................................... iv
LIST OF TABLES ....................................................................................................... viii
LIST OF FIGURES ........................................................................................................ ix
PREFACE ....................................................................................................................... x
CHAPTER 1: LITERATURE REVIEW ........................................................................ 1
Connecting Brain Biochemistry and Behavior in Toxicology ................................... 1
Ecological Relevance of Behavior ............................................................................ 2
Ecological fitness ................................................................................................ 3
Population implications ...................................................................................... 4
Environmental Contaminants and the Nervous System............................................. 5
Pesticides................................................................................................................... 5
Classes.................................................................................................................. 6
Getting into the environment .............................................................................. 6
Pharmaceuticals ........................................................................................................ 8
Classes.................................................................................................................. 8
Getting into the environment ............................................................................... 8
Neurotransmitters of Interest ................................................................................... 10
Acetylcholine ..................................................................................................... 10
Serotonin ............................................................................................................ 11
Mechanisms ............................................................................................................. 13
Acetylcholinesterase inhibitors ......................................................................... 13
Selective serotonin reuptake inhibitors .............................................................. 16
Behavior Bioassays .................................................................................................. 19
References ............................................................................................................... 22
CHAPTER 2: BEHAVIORAL AND BIOCHEMICAL EFFECTS OF DIAZINON
IN HYBRID STRIPED BASS ....................................................................................... 29
Abstract .................................................................................................................... 29
Introduction .............................................................................................................. 30
vi
Table of Contents (Continued) Page
Methods and Materials ............................................................................................ 31
Test chemicals .................................................................................................... 31
Fish ..................................................................................................................... 31
Experiment design ............................................................................................. 32
Diazinon exposure ............................................................................................. 34
Diazinon analysis ............................................................................................... 36
Brain tissue preparation ..................................................................................... 36
Protein assay ...................................................................................................... 36
Acetylcholinesterase assay ................................................................................. 37
Data analysis ...................................................................................................... 37
Results ...................................................................................................................... 38
Diazinon concentrations..................................................................................... 38
Acetylcholinesterase .......................................................................................... 38
Behavior data: exposure/recovery effects .......................................................... 40
Discussion ................................................................................................................ 41
References ................................................................................................................ 47
CHAPTER 3: BEHAVIORAL AND BIOCHEMICAL RESPONSES OF HYBRID
STRIPED BASS DURING AND AFTER EXPOSURE TO FLUOXETINE ............... 55
Abstract .................................................................................................................... 55
Introduction .............................................................................................................. 56
Materials and Methods ............................................................................................. 58
Test chemicals .................................................................................................... 58
Fish ..................................................................................................................... 59
Experiment design ............................................................................................. 59
Fluoxetine exposure ........................................................................................... 61
Fluoxetine analysis............................................................................................. 62
Brain tissue preparation .................................................................................... 62
Protein assay ...................................................................................................... 63
Monoamine analysis .......................................................................................... 63
Data analysis ...................................................................................................... 64
Results ...................................................................................................................... 64
Fluoxetine concentrations .................................................................................. 64
5-HT levels......................................................................................................... 65
5-HIAA levels .................................................................................................... 65
5-HIAA:5-HT ratio ............................................................................................ 66
Behavior data: exposure/recovery effects .......................................................... 66
Discussion ................................................................................................................ 67
References ................................................................................................................ 73

vii
Table of Contents (Continued) Page
CHAPTER 4: LONG-TERM FLUOXETINE EXPOSURE: BEHAVIORAL
AND BIOCHEMICAL EFFECTS ................................................................................ 82
Abstract .................................................................................................................... 82
Introduction .............................................................................................................. 82
Materials and Methods ............................................................................................. 86
Test chemicals .................................................................................................... 86
Fish ..................................................................................................................... 86
Experiment design ............................................................................................. 86
Fluoxetine exposure ........................................................................................... 88
Fluoxetine analysis............................................................................................. 89
Brain tissue preparation ..................................................................................... 90
Protein assay ...................................................................................................... 90
Monoamine analysis .......................................................................................... 90
Data analysis ...................................................................................................... 91
Results ...................................................................................................................... 92
Fluoxetine concentrations .................................................................................. 92
5-HT levels......................................................................................................... 92
5-HIAA levels .................................................................................................... 93
5-HIAA:5-HT ratio ............................................................................................ 93
NE levels ............................................................................................................ 94
DA levels ........................................................................................................... 94
Behavior data ..................................................................................................... 94
Discussion ................................................................................................................ 95
References .............................................................................................................. 101
CONCLUSIONS.......................................................................................................... 110
APPENDIX .................................................................................................................. 113
viii
LIST OF TABLES
Table Page
3.1 Serotonin (5-HT) and 5-hydroxyindoleaceteic acid (5-HIAA) levels
(mean ± SE) in hybrid striped bass brains (pg/µg protein), and 5-
HIAA:5-HT ratios following a 6-day fluoxetine exposure followed
by a 6-day recovery period ................................................................................ 77
4.1 Serotonin (5-HT), 5- hydroxyindoleacetic acid (5-HIAA),
norepinephrine (NE), dopamine (DA) levels (mean SE) in hybrid
striped bass(pg/µg protein), and the 5-HIAA:5-HT ratio following a
27-day fluoxetine exposure .............................................................................. 108
A-1 Time (mean SE) it took hybrid striped bass to capture prey during
a 6-day diazinon exposure followed by a 6-day recovery period .................... 113
A-2 Time (mean SE) it took hybrid striped bass to capture prey during
a 6-day fluoxetine exposure followed by a 6-day recovery period .................. 114
A-3 Time (mean SE) it took hybrid striped bass to capture prey during
a 27-day fluoxetine exposure followed by a 6-day recovery period ................ 115

ix
LIST OF FIGURES
Figure Page
2.1 Brain acetylcholinesterase activity (AChE) (mean ± SE) in hybrid
striped bass during a 6-d waterborne exposure to diazinon, followed
by a 6-d recovery period .................................................................................... 51
2.2 Day 6 acetylcholinesterase (AChE) activity (mean ± SE) as a
function of measured diazinon concentration (mean ± SE) ............................... 52
2.3 Time (mean ± SE) it took hybrid striped bass to capture the first (A),
second (B) and third (C) prey fish during a 6-d diazinon exposure
followed by a 6-d recovery period ..................................................................... 53
2.4 Day 6 time to eat prey 1 and prey 2 (mean ± SE) as a function of brain
acetylcholinesterase activity (AChE) (mean ± SE) in hybrid striped bass ........ 54
3.1 Day 6 serotonin levels as a function fluoxetine concentration .......................... 79
3.2 Time (mean ± SE) it took hybrid striped bass to capture the first (A)
first, (B) second, and (C) third prey fish during as 6-day fluoxetine
exposure followed by a 6-day recovery period ................................................. 80
3.3 Day 6 time to eat prey 1 and prey 2 as a function of brain serotonin
levels in hybrid striped bass ............................................................................... 81
4.1 Serotonin (5-HT) and 5-hydroxyindoleacetic acid (5-HIAA) levels
(mean SE) in hybrid striped bass brains, and 5-HIAA:5-HT ratios
during a 27-day fluoxetine exposure ................................................................ 105
4.2 Norepinephrine (A.) and dopamine (B.) levels (mean SE) in hybrid
striped bass brains during a 27-day fluoxetine exposure ................................. 106
4.3 Time (mean SE) it took hybrid striped bass to capture prey 1, 2, and
3 during a 27-day fluoxetine exposure ............................................................. 107
x
PREFACE
Brain biochemistry can affect an organism‟s behavior, the interaction between
individuals, and ultimately the success of the entire population. Many environmental
contaminants affect the nervous system including brain chemistry. These contaminants
find their way into surface waters where they pose a risk to aquatic organisms, including
fish. However, few researchers have quantified the relationship between brain chemistry
and fish behavior. Such a relationship could be very useful in ecological risk assessment
including making biochemical markers more ecologically relevant. While many
researchers have quantified the response of biochemical or behavioral endpoints to
sublethal chemical stress, few have attempted to establish a relationship between the two.
This dissertation consists of a literature review and three journal articles. The
literature review discusses the connection between brain biochemistry and behavior,
environmental contaminants that can act on the nervous system, and behavioral bioassays
used to as tools for measuring effects of environmental stressors. The first journal article
(Chapter 2) describes effects of a 6-day diazinon exposure followed by a 6-day recovery
period on acetylcholinesterase activity and prey-capture in hybrid striped bass. The
second journal article (Chapter 3) describes the effects of 6-day fluoxetine exposure
followed by a 6-day recovery period on serotonin and prey capture in hybrid striped bass.
The final journal article (Chapter 4) evaluates the effects of a longer fluoxetine exposure
(27-day) on monoamine levels and prey capture in hybrid striped bass using lower
concentrations than in the 6-day exposure detailed in Chapter 3.
1
CHAPTER 1: LITERATURE REVIEW
Connecting Brain Biochemistry and Behavior in Toxicology
In the past few decades, there has been an increase in research characterizing
various biochemical endpoints. While these endpoints are easily correlated with
organism exposure, they are not used as often in risk assessments because their ecological
relevance is not as well defined. They have not yet been linked directly to impacts at the
organism level, let alone at the population and community levels [1]. Therefore,
correlating behavioral and physiological changes is an important research focus because
it could enhance the prediction of population-level responses from biomarker data.
Behaviors are the result of genetic, biochemical, and physiological processes [2]
that operate through the central nervous system (CNS) permitting an animal to exist in an
optimal environment [3]. Changes in behaviors critical to organism survival (habitat
selection, competition, predator avoidance, prey selection, and reproduction) can be
induced through direct effects to the nervous system or indirect physiological alterations
[2]. Therefore, it is important to know the relationship between biochemical and
behavioral endpoints before we can fully determine the ecological relevance of change in
either.
A major objective of the behavioral sciences is to characterize behaviors and
identify the circumstances that bring it about and the consequences that change it [4].
Behavior provides a unique perspective between organisms and their environment and
can be crucial for developing mechanistic causes of contaminant effects. In turn,

2
understanding the mechanisms responsible for these changes could serve as a valuable
guide to further interpret behaviors [4,5].
Since behavior is regarded as the net output of the sensory, motor, and cognitive
function in the nervous system, it can be a sensitive endpoint of chemical-induced
neurotoxicity [6]. There are numerous sites of action for toxicants to affect the nervous
system, so interference at any of these sites could block or alter the sequence of neural
responses and inhibit or alter behavior [2]. Neurotoxicity has been defined as „any
adverse effect on the structure or function of the central and/or peripheral nervous system
produced by chemical exposure‟, and exposure to neurotoxicants can result in sensory,
motor, and cognitive dysfunction [6]. Thus, behaviors could also be impaired as a result
of contaminant exposure and techniques have been derived from experimental neurology
to detect and characterize such changes. However the degree of change can be dependent
upon the chemical(s), concentration, and duration of exposure.
Ecological Relevance of Behavior
The effects of environmental contaminants can be studied at the biochemical and
cellular levels, organismal level, and population or community level [7]. Each level of
organization is important because they typically carry out different operations [4]. Many
times we look at biochemical biomarkers because they are useful as early warning signs
of chemical exposure [7], but it can also be assumed that changes at lower levels of
organization could escalate to community level effect if left unabated [7]. Therefore,
since behavior is an individual-level response having clear links to biochemistry and

3
population dynamics, changes in behavior could be an ecologically relevant endpoint for
monitoring environmental stress.
Ecological fitness
Ecological fitness can include an organism‟s ability to find food and shelter, avoid
predation, and reproduce. Ultimately, these behaviors are critical to the population.
Behavioral responses are important for survival and ecological fitness because they are
necessary for performing essential life functions like habitat selection, competition,
predator avoidance, prey selection, and reproduction [2]. Unfortunately, environmental
pollutants can pose serious risk to many aquatic organisms [5] altering normal behaviors,
which could impair survival of an organism or the population.
Traditionally, regulatory guidelines for aquatic pollutants in natural ecosystems
have been based on acute lethality tests like the 96-h LC50, but impacts on development,
growth, and reproduction are also frequently studied [5]. While the development of
water-quality criteria has often relied heavily on chemical concentrations causing
mortality and impaired growth in laboratory exposures, this may not be the best predictor
of impacts in the field when organisms are exposed to sublethal concentrations [3].
Acute tests useful for generating guidelines for preventing physiological death tend to
ignore ecological death that could occur at sublethal concentrations of toxicants [5].
Therefore, behavioral indicators of toxicity may be ideal for assessing sublethal impacts
of exposure [5] because many times, behavioral changes can occur before death with
sublethal concentrations. While they may seem to be unharmed, organisms may be
4
unable to function normally [5] so by testing ecologically relevant behaviors, we can get
a better idea about ecological fitness and effects at the population and community levels.
Population implications
Since environmental contaminants can elicit a wide variety of biochemical
responses and adverse effects in an organism‟s behavior, reproduction, and development,
it can be hypothesized that there may also be population level impacts in multiple species
or in ecosystems [8]. While chemicals affect individual organisms, the ultimate level of
concern may be the population or community level. Many times, the fate and effect of
environmental toxicants has been studied with the aim of understanding how the structure
and functioning of populations, communities and ecosystems are affected [9].
There are many factors to consider when assessing the impacts of an
environmental contaminant. Dose, body burden, duration, and timing of exposure at
critical life stages (age and development period) are all important considerations for
assessing the adverse effects [8,10]. Many times effects are delayed and are not fully or
obviously expressed until offspring reach maturity or middle age, even though critical
exposure may have occurred during early embryonic, fetal, or neonatal life [10]. In
addition, effects may be reversible or irreversible, immediate (acute) or latent (not
expressed for a period of time) [8]. Therefore, toxicological effects observed within
individual organisms do not necessarily all have the same potential to impact populations,
nor should it be expected that effects would elicit population responses at the same
exposure levels [8].

5
Environmental Contaminants and the Nervous System
There are a wide variety of contaminants released into the environment from
residential, commercial, and industrial sources that can be toxic to people, fish, wildlife,
and plants. Many of these contaminants may not be deadly at the levels found in the
environment, but can possibility interact with the nervous system and cause adverse
effects. Many toxic chemicals including metals, PCBs, PAHs, pesticides, and
pharmaceuticals can affect either the central or peripheral nervous system [11] and
cellular metabolism.
Pesticides
Classes
There are number of different types of pesticides that are available for use and
have been classified as algaecides, bactericides, fungicides, herbicides, insecticides, and
rodenticides, depending on the target pest. They are used for preventing, controlling, or
lessening the damage caused by pests, and have mainly been used to protect crops. In
this discussion, I will focus on insecticides, and more specifically, organophosphates and
carbamates.
There has been a major shift in insecticide use from organochlorine (OC)
compounds to organophosphorous (OP) and carbamate (CB) insecticides. The use of
OCs in the U.S. began in the 1940s until the 1970s when most uses were banned or
severely restricted when potential human health concerns and adverse ecological effects
became apparent. In addition, OC insecticides (especially DDT) were resistant to
degradation and have long environmental half-lives, causing harm long after their ban.

6
One reason OP and CB insecticides were favored for replacing OCs was that while they,
too, are highly toxic, they are considered to have relatively short half-lives (2-4 weeks)
and are readily metabolized and excreted [12, 13].
There are about 200 OPs and 50 CBs formulated into thousands of products
available around the world for use in wetlands, rangelands, cultivated crops, forests, and
rural and urban settings. However, 95% of OP products are used for agriculture and
mosquito control [13]. OP insecticides came into wide-scale use in the US in the late
1960s and 1970s. By the late 1980s, they made up more than one third of registered
pesticides [13] and accounted for approximately 65% of total insecticide use with seven
of the top 11 insecticides used (in terms of mass applied) being OPs [12]. OPs widely
used in the US included chloyprifos, malathion, methyl parathion, parathion, fenthion,
and diazinon. However, some of these chemicals have been reviewed by regulatory
agencies for environmental and public health concerns and are now classified as
restricted-use pesticides in the US. While some OPs that have had most uses withdrawn
or cancelled in the US, they may still be available in other countries despite their
environmental concerns [13]. In addition, only eight of the 50 CBs are used for insect
control on crops, forests, and rangelands and out of these eight, carbofuran, methomyl,
and carbaryl account for more than 90% of the use [13].
Sources of Exposure
Pesticides are purposely introduced into the environment for many purposes
including agriculture, forestry, transportation (weed control along roadsides and
railways), household, and various commercial and industrial uses [12]. While

7
nonagricultural uses can be substantial in some areas, the majority of pesticide use (70-
80%) has been for agricultural purposes [12]. Agricultural application practices include
aerial spraying, near-ground spraying from a tractor, soil incorporation, chemigation, and
direct application to plant foliage [12]. Except for mosquito control, nearly all OP and
CB application is on terrestrial landscapes [13]. There are, however, some pesticides that
have been applied directly to surface waters for controlling algae, macrophytes, insects,
and fish parasites, but these applications are usually carried out by federal, state, and
local government agencies, or through permits issued by these agencies [12].
In any case, it is believed that all pesticides may eventually enter an aquatic
system, affecting a much larger number of species than originally intended [13]. They
have been invariably detected in waters, soils, and vegetation outside the treated areas
[13] as a result of applicator error, drift, runoff, or drainage induced by rain or irrigation
[12]. Pesticides have been detected in every region of the United States where surface
waters have been analyzed [12] and are present throughout most of the year in streams
draining agricultural and urban watersheds; however, their occurrence does not
necessarily cause adverse effects due to low concentrations (ng/L) detected [14,15]. In
addition, OPs and CBs are comparably labile in the environment and do not
bioaccumulate or biomagnify to any important degree in aquatic or terrestrial food chains
[13].
Four main factors affect pesticide transport in runoff. First are rainfall intensity,
duration, amount, and timing with respect to pesticide application. Second are soil
texture, organic matter content, water content, and slope and topography of the field.
8
Third are physical and chemical properties of the pesticide including water solubility,
acid/base and ionic properties, sorption properties, and persistence. Finally are
agricultural management practices including pesticide formulation, application rate and
placement, erosion control practices, plant residue management, use of vegetative buffer
strips, and irrigation practices [12].
Pharmaceuticals
Classes
Each year the US Food and Drug Administration (FDA) approves several new
drugs that are classified under different categories including estrogens for contraceptives
and hormone replacement, analgesics (painkillers), non-steroidal anti-inflammatory
drugs, antibiotics, anti-cancer drugs, blood-pressure medications, and antidepressants.
Nicotine and caffeine are also considered to be drugs. In general, these medical
substances can be divided into two groups: (a) medical substances used by humans and
(b) veterinary medicines. While classes of human use drugs have been mentioned,
veterinary medicines for domestic animals, poultry and livestock, and fish farms can also
include antimicrobials/parasitics, hormones, non-steroidal anti-inflammatories,
antidepressants, CNS agents, gastrointestinal agents, and cardiovascular agents [16].
Sources of Exposure
Drugs are similar to pesticides with regard to their contribution to water pollution,
but unlike regulated pesticide disposal, drug disposal has not been regulated. Little is
known about the extent of environmental occurrence, transport or ultimate fate after their
intended use, yet just about every class of pharmaceutical has been identified in the
9
environment [17]. Sources of contamination include production facilities, hospitals,
private households, veterinaries, agricultural farms (livestock, poultry, and fish), and
wastewater treatment plants [18]. While the occurrence of pharmaceuticals and personal
care products (PPCPs) in the environment is not a new phenomenon, it has only become
more widely evident in the last decade as a result of continually improving chemical
analysis methodologies with lower limits of detection for a wide array of xenobiotics
[19].
PPCPs can be inadvertently released to the environment directly (disposal and
wastage from external application) or indirectly (excretion, washing, and swimming). But
municipal sewage (treated and untreated) is the major source for most drug classes and
quantities [19]. Wastewater treatment plants (WWTPs) can process and remove most
chemicals, but many pharmaceuticals are not fully removed [17, 20]. As a result, WWTP
effluent has been a significant contributing source of pharmaceuticals in receiving
streams. One reason is that drugs tend to be hydrophilic in order to pass through cell
membranes [16]. This would require different treatment technologies for removal from
wastewater than many other pollutants which tend to be somewhat hydrophobic. While
effective wastewater treatment methods are being researched, reverse osmosis and
granular activated carbon have been valuable in removing certain classes of
pharmaceuticals from water. Unfortunately, implementing these technologies can be
extremely expensive leaving drugs to flow continuously into waterways. But the fact that
pharmaceuticals can be continually introduced to the aquatic environment (even at low
concentrations) creates a sense of „persistence‟ of compounds that otherwise many not be
10
environmentally stabile creating a chronic exposure scenario [20-22]. It has also been
found that some drugs could be detected in fish tissue samples where the stream was
almost entirely comprised of effluent discharge [21].
Terrestrial runoff from confined animal feeding operations, excreta from
medicated pets and livestock, overflow or leakage from storage structures and wind-
borne drift of agriculturally applied antimicrobials to crops have been additional sources
of pharmaceutical contamination of terrestrial and aquatic environments [17, 19].
Medical substances used in fish farms have also been directly applied to receiving waters
since the most convenient method of treating fish with antibiotics and chemotherapeutics
is by the use of feed additives. Typically, large portions of medicated feed are not
consumed, resulting in potential sediment accumulation affecting other aquatic organisms
[16].
Neurotransmitters of Interest
The mammalian nervous system has over 30 substances classified as
neurotransmitters identified. Neurotransmitters are chemical messengers that relay,
amplify, and modulate signals between a neuron and another cell across a synapse [23].
This includes acetylcholine, amino acids (glycine and glutamate), and biogenic amines,
which are products of amino acid decarboxylation (dopamine, norepinephrine,
epinephrine, -aminobutyric acid, histamine, and serotonin).
Acetylcholine
The role of the neurotransmitter acetylcholine (ACh) in the firing of cholinergic
synapses between motor neurons and skeletal muscle cells is well known. Acetylcholine
11
is present in somatic and autonomic motor neurons in the spinal cord and brain stem, in
autonomic (parasympathetic) ganglia, and skeletal muscles [24]. It is a quaternary amine
synthesized by the binding of choline to acetyl-coenzyme A by the enzyme choline
acetyltransferase. Binding of ACh opens cation channels (mainly Na+) in skeletal muscle
cells, eliciting an action potential that spreads out in multiple directions to signal muscles
to contract. In cardiac muscle fibers however, ACh can decrease contraction, likely due
do differences in receptor structures [24].
One of the most commonly observed indicators of neural function is brain
acetylcholinesterase (AChE). Acetylcholinesterase is responsible for
degrading/hydrolyzing ACh to end cholinergic neural transmission and prevent ACh
accumulation in and around a synapse [5, 25]. Located on post-synaptic membranes,
AChE plays an important role in regulating nerve impulse transmission at cholinergic
synapses. Once ACh is broken down to acetate and choline by AChE, choline is taken
back up into the nerve terminal by high affinity transporter proteins [24]. This is one of
the most important factors in regulating the synthesis of ACh [24]. Since ACh molecules
involved in a nerve impulse must be degraded in the few milliseconds before the potential
arrival of the next nerve impulse [26], AChE plays a significant role in this process. A
single AChE molecule can break down 5,000 ACh molecules to choline and acetate
following their release into the synapse [24].
Serotonin
Serotonin is found thorough out the body in blood platelets, mast cells, and
chromaffin cells in the gut; but serotonergic neurons are found almost exclusively in a

12
group of nuclei near the midline of the brain stem reticular formation, called the raphe
nuclei [24]. Serotonin is a neurotransmitter involved in the transmission of nerve
impulses, synthesized from the amino acid, tryptophan. Tryptophan is converted to 5-
hydroxytryptophan (5-HTP) by the enzyme tryptophan-5-hydroxylase. Next, 5-HTP is
converted to serotonin (5-hydroxytryptamine, 5-HT) by 5-hydroxytryptophan
decarboxylase [24]. While the main metabolite of 5-HT is 5-hydroxyindoleacetic acid
(5-HIAA), via aldehyde dehydrogenase or monoamine oxidase, 5-HT can also be
converted to melatonin by 5-hydroxyindole-O-methyltransferase.
Like other neurotransmitters, 5-HT is released from the presynaptic cell and can
bind to receptor proteins on both the pre- and post-synaptic cell. It can change the
electrical state of the cell by exciting the cell, passing along the chemical message, or
inhibiting it. Neurotransmitter action can be stopped by diffusion out of the synaptic cleft
or through enzymatic degradation by monoamine oxidase (MAO) or catechol-O-
mehtyltransferase (COMT) [27]. Present in the synaptic cleft and presynaptic nerve,
MAO and COMT deactivate neurotransmitters making them unrecognizable by the
receptors [24]. But under normal circumstances, the principle mechanism of signal
inactivation is transporter-mediated uptake of monoamines from the synapse back into
the presynaptic cell where they are reprocessed [28].
Transporter proteins in the membrane of nerve terminals put an end to transmitter
action and control extracellular concentrations of monoamines. The task of transporters
is not to remove all traces of neurotransmitters from the extracellular fluid, but rather to
regulate a baseline concentration [24]. Since secretion and elimination of serotonin is
13
highly regulated, there are mechanisms in place for controlling moderate fluctuations via
negative feedback control [8]. Autoreceptors located on the pre-synaptic membrane can
modulate transmitter release as a kind of negative feed back control [24].
Since serotonergic neurons have axons that project to many different parts of the
brain, 5-HT affects several behaviors [29]. Serotonin is involved in the control of
appetite, sleep, learning and memory, temperature regulation, mood, behavior (aggression
and dominance), cardiovascular function, muscle contraction, endocrine regulation, and
depression. It has also been implicated in the central control of regulation of circadian
rhythm, cognitive ability, reproduction/sexual behavior, memory, and attention [29-32].
Mechanisms
Acetylcholinesterase Inhibitors
The principle toxicity of organochlorine and carbamate insecticides is based on
nervous system disruption by inhibition of cholinesterase activity in the CNS and at the
neuromuscular junctions [13]. For example, OPs interact with a hydroxyl group on
AChE, which is a functional part of the enzyme. Once phosphorylated, AChE has no
activity [23]. While the mode of action is similar for OP and CB pesticides, there are
many differences between these classes. One difference is the faster onset of acute
toxicity by CBs as a result of direct ChE inhibition, whereas most OPs must first undergo
an oxidative desulfuration step for maximum potency [13].
Secondly, unlike OPs, CBs are considered to bind reversibly allowing
cholinesterase to become reactivated. However, it is possible for AChE levels to recover
following OP exposure, but the inhibitory effects on AChE activity lasts longer than the

14
original exposure [33, 34]. A rapid recovery within a few hours may follow CB
exposure, but it may take 1-3 weeks for AChE recovery following a single OP exposure
[13]. However, the time it takes for AChE levels to fully recover is dependent on the rate
of new enzyme synthesis, species, type and concentration of OP, and overall degree of
AChE inhibition [35-37]. Therefore, cumulative depression of AChE may occur and
persist from repeated exposure to some OPs, but generally not with CBs.
When OPs bind to ChE, a relatively stable bond is formed preventing deactivation
of acetylcholine, and thus permitting a buildup of ACh and an overstimulation of the
cholinergic nervous system. If this disruption is prolonged, the system for relaying
impulses across the post-synaptic membrane becomes rundown, leading to synaptic
block. This causes muscle rigidity from continual stimulation and can lead to paralysis
and possibly death due to respiratory failure [23, 38, 39]. Following a sublethal
exposure, carbohydrate metabolism, reproduction, and behavior can also be impaired
[38].
OP and CB insecticides have a broad-spectrum toxicity and the relationship
between depressed AChE activity and behavior has been studied in many species ranging
from invertebrates to mammals [23]. There are considerable differences across species in
the degree of AChE inhibition that can be tolerated without physiological impairment,
which are attributed to variations in rates of uptake, detoxification, activation, and/or
excretion [25, 35, 38, 40]. The degree of AChE inhibition is also dependent upon which
insecticide the organism is exposed to [34, 38, 41, 42], exposure concentration [43] and

15
exposure duration [44]. Organism age can also be a factor affecting the degree of AChE
inhibition [45].
Overall, it appears that a 70-80% decrease in brain AChE activity can be tolerated
before death occurs in fish, so care should be taken when interpreting results of AChE
measurements in fish brains because this may not be the ultimate „cause of death‟ [25].
This interpretation must consider the fact that the test chemical often acts on a variety of
points in the endocrine and nervous systems simultaneously. Mortality may be due to
inhibition of other enzymes, especially those taking part in carbohydrate and protein
metabolisms, rather than just AChE inhibition [46]. Pesticides may also cause oxidative
stress in an organism, leading to the generation of reactive oxygen species at levels
surpassing antioxidant defenses. This could, in turn, result in harmful effects on DNA,
proteins, and lipids [46]. In addition, sublethal doses of diazinon has been shown to
negatively affect blood stream estradiol levels [47] and testis structure [48] of bluegill,
which could potentially impair reproductive success.
Brain neurotransmitter levels and enzyme activity correlate well with behavioral
states [5]. Many researchers have considered the relationship between brain AChE
activity and various behaviors including swimming [42, 38, 49-51] and foraging/feeding
[33, 52]. Sometimes there were linear relationships between changes in behavior and
AChE, but many times there were significant decreases in AChE activity before behavior
responses were noted [39]. Whether a linear relationship or a threshold response is noted,
changes in behavior could eventually alter an organism‟s ecological fitness leaving it

16
more susceptible to predation, less efficient at capturing prey, or unable to successfully
court or reproduce. These effects could ultimately affect the population.
Selective Serotonin Reuptake Inhibitors (SSRI)
As stated previously, serotonin is involved in controlling a number of behaviors.
It has been shown that decreased levels of synaptic serotonin (5-HT) and/or
norepinephrine (NE) can give rise to depression, obsessive thoughts, and a lack of
impulse control. Therefore, drugs like selective serotonin reuptake inhibitors (SSRIs),
selective norepinephrine reuptake inhibitors (SNRI), and selective serotonin and
norepinephrine reuptake inhibitors (SSNRI) were developed to lessen these ailments [28].
Reuptake inhibitors elicit their effect of increasing levels of specific monoamines at the
synapse by interacting with, and binding to, monoamine transporters in the CNS, without
being transported themselves [28]. By blocking transporters in inhibiting the recapture of
neurotransmitters from the synapse, extracellular 5-HT and/or NE concentrations can
become elevated [53].
SSRIs have a high affinity to 5-HT uptake sites, low affinity to NE uptake sites,
and even lower affinity for neurotransmitter receptors [53]. Inhibition of 5-HT reuptake
transporters promotes 5-HT neurotransmission, but autoreceptor activation could signal a
decrease in neurotransmission once high levels of 5-HT are recognized [54]. Therefore,
although transporters are blocked immediately following administration of reuptake-
inhibiting drugs, it is believed that the 2-3 week delay in noticeable therapeutic effects
(increased 5-HT levels) is attributed to autoreceptor activation [55]. Many studies have
shown that chronic SSRI treatment eventually leads to the functional desensitization of 5-

17
HT1A autoreceptors on serotoninergic cells, allowing serotonergic neurotransmission to
occur in the presence of the drug and high extracellular 5-HT [55, 56]. Thus, therapeutic
effects were felt when extracellular 5-HT levels increased.
The use of SSRIs has been rapidly increasing and they have become a focus for
environmental researchers following their detection in the environment [57]. Brooks et
al. [58] evaluated the acute effects of fluoxetine on algae (Pseudokirchneriella
subcapitata), Ceriodaphnia dubia, Daphnia magna, Pimephales promelas, Hyalella
azteca and Chironomus tentans, while Henry and Black [59] looked at the effects on
western mosquitofish (Gambusia affinis). All organisms were adversely affected by the
fluoxetine exposure in the laboratory, however, the concentrations were at least an order
of magnitude greater than those reported in municipal effluent. Other effects noted in the
laboratory included developmental abnormalities in Japanese medaka (Oryzias latipes)
with minimal effects on number of eggs produced, fertilized, or hatched when exposed to
fluoxetine [60]; and increased spawning in zebra mussels (Dreissena polymorpha) [61],
increased parturition in fingernail clams [62], and reduced mean number of neonates
produced in Ceriodaphnia dubia [63] when exposed to various SSRIs.
Exposure duration could play just as much a role in the effects of fluoxetine
exposure as the exposure concentration, especially considering the role of autoreceptors
in regulating neurotransmission. It is possible that initially, SSRI exposure could lead to
decreased 5-HT levels from activation of autoreceptors; but prolonged exposures could
cause autoreceptor desensitization allowing for 5-HT levels to increase. Therefore,
measuring 5-HT levels along with other endpoints may be important since both increases
18
and decreases in these levels have been noted depending on the species and duration [54].
For example, it was found that a 7-day fluoxetine exposure reduced Pimephales promelas
feeding rates in a dose dependent manner, but a 21-day fluoxetine exposure increased
Daphnia magna grazing rates, though not significantly [64]. These results could reveal
an effect of exposure duration and/or species variability, but the authors did not measure
serotonin levels, nor did they monitor feeding/grazing over the course of exposure.
Therefore, aside from behavioral observations, no real conclusion can be drawn on
biochemical changes as a result of the exposure or the duration.
Many behavioral studies evaluating the effects of SSRIs on aquatic organisms
have not compared 5-HT levels with observed behavioral changes. It has been usually
assumed that serotonin levels increased regardless of what is know about the delayed
therapeutic effect of SSRIs. However, this may not always be a correct assumption. For
example, a behavioral study with Betta splendens showed decreased territorial aggression
following acute treatment with 5-HT [65]. This suggested that increased 5-HT levels
lead to decreased aggression. Therefore, since the goal of SSRIs is to increase 5-HT
levels, it may be assumed that fluoxetine exposure would also decrease aggression.
However, when Betta splendens were exposed chronically to fluoxetine, they neither
exhibited significantly decreased aggression nor increased serotonin levels [65]. Instead,
Clotfelter et al. [65] found that the exposure reduced serotonin and 5-HIAA levels, which
is actually consistent with long-term exposures for a number of rodent studies. This
again supports the importance of exposure duration when interpreting the effects of
reuptake-inhibiting drugs.
19
Behavioral bioassays
Behavioral toxicity occurs when a contaminant or other stressor induces changes
that exceed the normal range of variability [2]. Sometimes, this can be observed at levels
much lower than the LC50. A single behavioral parameter can be more comprehensive
than a physiological or biochemical parameter, but behavioral bioassays have still not
reached the stage where they are fully accepted as part of formal testing procedures [23].
The extent to which behavioral studies could be used in risk assessment depends on the
validity and understanding of the biochemical effect of the chemical [6]. Still, behavioral
tests have been frequently used to identify and characterize chemical-induced alterations
in endocrine and nervous system functions, and better predict exposure concentrations
that impact ecological fitness - not just survival. There are a number of behavioral assays
developed to assess sublethal effects of environmental stressors in fish including
reproduction, avoidance, schooling, aggression, swimming, predator avoidance, and
feeding. However, it should be mentioned that generalizations regarding any behavioral
response to aquatic contaminants are difficult to make due to the variety of species and
experimental designs used for each test [2].
The most described predictor of population level effects is to measure
reproductive success [5]. Since reproduction is extremely important for population
success, it is likely the most relevant for predicting ecological consequences of
contamination [2]. Reproduction results from a variety of behaviors including migration
to reproductive habitats, establishment of territories, reception and response to courtship,
spawning, nest preparation and defense, and parental care [2]. Tests can be performed

20
for analyzing these behaviors/interactions along with other reproductive measurements
like time-to-maturation, population sex ratios, expression of secondary sexual
characteristics, clutch size, and percent hatch/survival. Impairment of any of these
behaviors could reduce reproductive success and ultimately harm the population.
Many contaminants can also induce avoidance responses. This behavioral
response has been observed for over 80 years [23]. Avoidance of unfavorable habitats
can be induced by a contaminant, but the opposite could also occur. If a chemical attracts
an organism, it could leave it vulnerable to injury or death [2]. This response can be
measured by assessing habitat selection of treated and untreated organisms. Treated
organisms could be more inclined or less inclined to avoid unfavorable conditions, or less
responsive to present danger (i.e. predators, extreme temperatures) [2]. However, pre-
exposure to a contaminant could skew responses, leading to an acclimation or
desensitization to the chemical(s). This could lessen the behavioral response and
underestimate the concentration that would elicit such a response [23].
Social interactions among fish such as schooling and aggression can also be
impaired by environmental contaminants. Schooling is highly evolved among fishes for
increasing habitat surveillance and providing protection from predators [2]. Many
contaminants impair the schooling behavior of fish so some methods for measuring
schooling behavior include measuring distance between individuals, orientation within a
school, and latency with which the school forms or tighten [2]. Methods for measuring
aggression include monitoring changes in posture or coloration, and movement toward or
contact between conspecifics [2]. Competition among individuals, species, or age classes

21
can occur when resources needs overlap, making aggression necessary for survival.
Therefore, the more aggressive organism will be further ecologically fit with the
capability to win food, shelter, or a mate [2].
Swimming behavior is another fundamental behavior that can be disturbed by
environmental contaminants. This behavior is extremely important because it is
fundamental to feeding, competition, predator avoidance, and reproduction [2].
Swimming includes frequency and duration of movements, speed and distance traveled,
frequency and angle of turns, position in the water column, form and pattern of
swimming, orientation to water flow, and the capacity to swim against a current [2].
Since many of these variables are interrelated, they can be measured simultaneously.
Swimming behaviors, like other behaviors, vary across species and life stage, so test
methods must be tailored accordingly [2].
An altered ability to detect or respond to predators can increase an organism‟s
vulnerability to predation. Therefore, predator avoidance is another useful behavioral
measurement of environmental stress and can be measured by subjecting equal numbers
of exposed and unexposed prey to a predator under ideal conditions and observing which
prey population is more susceptible to predation. While this can be useful for
determining effective concentrations, the link between contaminant exposure and
predator avoidance is not as straightforward. Sometimes exposed prey may become
inactive or have reduced mobility making them less obvious to a predator, thereby
making the unexposed prey more obvious [2].
22
Feeding behaviors are important for development, fitness, and long-term viability
of an organism [2]. There are multiple aspects of feeding that can be impaired by
environmental stressors and contaminants leading to reduced growth and survival. These
include abilities for foraging, detecting, pursuing, capturing, and consuming food.
Methods for measuring these behaviors include orientation to food, movement toward
and striking activities, prey selectivity, feeding efficiency (number of prey attacked and
captured), prey-handling time, strike and capture frequency (including spits and misses),
and reaction distance [2]. Although there are numerous methods for measuring changes
in feeding in several species, many of these behaviors are interconnected, so measuring
multiple aspects of feeding is possible within a single test design [2].
The goal of this dissertation was to better characterize the relationship between
brain chemistry and behavior in hybrid striped bass. This goal was achieved through the
following objectives:
1. Characterize the changes in predatory behavior as a function of reduced brain
acetylcholinesterase caused by diazinon exposure.
2. Characterize the changes in predatory behavior as a function of reduced brain
serotonin caused by short-term exposure to fluoxetine.
3. Characterize the changes in predatory behavior and brain serotonin associated
with long-term exposure to fluoxetine.
References
1. Chapman PM. 2002. Integrating toxicology and ecology: putting the “eco” into
ecotoxicology. Mar. Pollut. Bull. 44:7-15.
23
2. Little EE. 2002. Behavioral measures of environmental stressors in fish. In:
Adams SM (Ed.). Biological Indicators of Aquatic Ecosystem Stress. American
Fisheries Society, Bethesda, MD. pp. 431-472.
3. Little EE, Fairchild JF, DeLonay AJ. 1993. Behavioral methods for assessing
impacts of contaminants on early life stage fishes. Am. Fish. Soc. Symposium
14:67-76.
4. Bechtel W. 2005. The challenge of characterizing operations in the mechanisms
underlying behavior. J. Exp. Anal. Behav. 84:313-325.
5. Scott GR, Sloman KA. 2004. The effects of environmental pollutants on complex
fish behavior: integrating behavouiral and physiological indicators of toxicity.
Aquat. Toxicol. 68:369-392.
6. Tilson HA. Neurobehavioral methods used in neurotoxicological research.
Toxicol. Lett. 68: 231-240.
7. Weis JS, Smith G, Zhou T, Santiago-Bass C, Weiss P. 2001. Effects of
contaminants on behavior: biochemical mechanisms and ecological consequences.
BioScience 51:209-217.
8. Crisp TM, Clegg ED, Cooper RL, Wood WP, Anderson DG, Baetcke KP,
Hoffmann JL, Morrow MS, Rodier DJ, Schaeffer JE, Touart LW, Zeeman MG,
Patel YM. 1998. Environmental endocrine disruption: an effects assessment and
analysis. Environ. Health Persp. 106:11-56.
9. Maltby L. 1999. Studying stress: the importance of organism-level responses.
Ecol. Appl. 9:431-440.
10. Colborn T, vom Saal FS, Soto AM. 1993. Developmental effects of endocrine-
disrupting chemicals in wildlife and humans. Environ. Health Persp. 101:378-
384.
11. Crosby DG. 1998. Environmental Toxicology and Chemistry. Oxford University
Press, New York, NY.
12. Larson SJ, Capel PD, Majewski MS. (Eds.). 1997. Pesticides in Surface Waters.
Ann Arbor Press, Chelsea, MI.
13. Hoffman DJ, Rattner BA, Burton GA, Cairns J. (Eds.). 2003. Handbook of
Ecotoxicology. 2nd
Edition. Lewis Publishers; CRC Press, Boca Raton, FL.

24
14. Kimbrough RA, Litke DW. 1996. Pesticides in streams draining agricultural and
urban areas in Colorado. Environ. Sci. Technol. 30:908-916.
15. Gilliom RJ, Hamilton PA. 2006. Pesticides in the nation‟s streams and ground
water, 1992-2001- a summary. USGS Fact Sheet 2006-3028.
16. Halling-Sorensen B, Nors Nielsen S, Lanzky PF, Ingerslev F, Holten Lutzhoft
HC, Jorgensen SE. 1998. Occurrence, fate, and effects of pharmaceutical
substances in the environment – a review. Chemosphere 36:357-393.
17. Koplan DW, Furlong ET, Meyer MT, Thurman EM, Zaugg SD, Barber LB,
Buxton HT. 2002. Pharmaceuticals, hormones, and other organic watewater
contaminants in US streams, 1999-2000: a national reconnaissance. Environ. Sci.
and Technol. 36:1202-1211.
18. Christensen FM. 1998. Pharmaceuticals in the environment – a human risk?
Regul. Toxicol. Pharm. 28:212-221.
19. Daughton CG. 2001. Pharmaceuticals and personal care products in the
environment: overreaching issues and overview. In: Daughton CG, Jones-Lepp
TL. (Eds.). Pharmaceuticals and Personal Care Products in the Environment.
American Chemical Society, Washington, DC. pp. 2-38.
20. Furlong ET. 2006. A Happy Medium? Antidepressants in Aquatic Systems.
Annual Meeting of Society of Environmental Toxicology and Chemistry,
Montreal, QB.
21. Brooks BW, Chambliss K, Stanley JK, Ramirez A. 2005. Determination of
selected antidepressants in fish from an effluent-dominated stream. Environ.
Toxicol. Chem. 24:464-469.
22. Dove A. 2006. Drugs down the drain. Nat. Med. 12:376-377.
23. Walker CH, Hopkin SP, Sibly RM, Peakall DB. (Eds.). 1996. Principles of
Ecotoxicology. 2nd
Edition. Taylor and Francis Group, London, UK.
24. Brodal P. 2004. Functional properties of neurons. In: The Central Nervous
System. 3rd
Edition. Oxford University Press, Oxford, UK.
25. Little EE. 1987. Behavior and nervous system function. In: Heath AG (Ed.).
Water Pollution and Fish Physiology. CRC Press, Boca Raton, FL. pp 181-200.
26. Voet D, Voet JG. (Eds.). 2004. Biochemistry. 3rd
Edition. John Wiley & Sons,
Hoboken, NJ.

25
27. De la Torre JC. 1972. Metabolism of monoamines. In: Dynamics of Brain
Monoamines. Plenum Press, New York, NY.
28. Rothman RB, Baumann MH. 2003. Monoamine transporters and psychostimulant
drugs. Eur. J. Pharmacol. 479: 23-40.
29. Øverli Ø, Winberg S, Damsgård B, Jobling M. 1998. Food intake and
spontaneous swimming activity in Arctic char (Salvenlinus alpinus): role of brain
serotonergic activity and social interactions. Can. J. Zool. 76:1366-1370.
30. Lin X, Volkoff H, Narnaware Y, Bernier NJ, Peyon P, Peter RE. 2000. Brain
regulation of feeding behavior and food intake in fish. Comp. Biochem. Phys. A
126:415-434.
31. Sari, Y. 2004. Serotonin1B receptors: from protein to physiological function and
behavior. Neurosci. Biobehav. R. 28:565-582.
32. Sloman KA, Lepage O, Rogers JT, Wood CM, Winberg S. 2005. Socially-
mediated differences in brain monoamines in rainbow trout: effects of trace metal
contaminants. Aquat. Toxicol. 71:237-247.
33. Morgan MJ, Kiceniuk JW. 1990. Effect of fenitrothion on the foraging behavior
of juvenile Atlantic salmon. Environ. Toxicol. Chem. 9:489-495.
34. Ferrari A, Venturino A, Pechne de D‟Angelo AM. 2004. Time course of brain
cholinesterase inhibition and recovery following acute and subacute
azinphosmethyl, parathion, and carbaryl exposure in the goldfish (Carassius
auratus). Ecotox. Environ. Safe. 57:420-425.
35. Weiss CM. 1972. Physiological effect of organic phosphorus insecticides on
several species of fish. Trans. Am. Fish. Soc. 90:143-152.
36. Pan G, Dutta HM. 1998. The inhibition of brain acetylcholinesterase activity of
juvenile largemouth bass Micropterus salmoides by sublethal concentrations of
diazinon. Environ. Res. A. 79:133-137.
37. Sancho E, Ferrando MD, Anereu E. 1997. Response and recovery of brain
acetylcholinesterase activity in the European eel, Anguilla anguilla, exposed to
fenitrothion. Ecotox. Environ. Safe. 38:295-209.
38. Beauvais SL.,Jones SB, Brewer SK, Little EE. 2000. Physiological measures of
neurotoxicity of diazinon and malathion to larval rainbow trout (Oncorhynchus
mykiss) and their correlation with behavioral measures. Environ. Toxicol. Chem.
19:1875-1880.
26
39. Fulton MH, Key PB. 2001. Acetylcholinesterase inhibition in estuarine fish and
invertebrates as an indicator of organophosphorus insecticide exposure and
effects. Environ. Toxicol. Chem. 20:37-45.
40. Keizer J, D‟Agostion G, Nagel R, Volpe T, Gnemi P, Vittozzi L. 1995.
Enzymological differences of AChE and diazinon hepatic metabolism: correlation
of in vitro data with the selective toxicity of diazinon to fish species. Sci. Total
Environ. 171:213-220.
41. Coppage DL. 1972. Organophosphate pesticides: specific level of brain AChE
inhibition related to death in sheepshead minnows. Trans. Amer. Fish. Soc. 3:534-
536.
42. Dembélé K, Haubruge E, Gaspar C. 2000. Concentration effects of selected
insecticides on brain acetylcholinesterase in the common carp (Cyprinus carpio
L.). Ecotox. Environ. Safe. 45:49-54.
43. Dutta HM, Munshi SD, Dutta GR, Singh NK, Adhikari S, Richmonds CR. 1995.
Age related differences in the inhibition of brain acetylcholinesterase activity of
Heteropneustes fossilis (Bloch) by malathion. Comp. Biochem. Physiol. A
111A:331-334.
44. Naddy RB, Klaine SJ. 2001. Effect of pulse frequency and interval on the toxicity
of chlorpyrifos to Daphnia magna. Chemosphere 45:497-506.
45. Moser VC. 2000. Dose-response and time-course of neurobehavioral changes
following oral chloryprifos in rats of different ages. Neurotoxicol. Teratol.
22:713-723.
46. Üner N, Oruç EO, Sevgiler Y, Sahin N, Durmaz H, Usta D. 2006. Effects of
diazinon on acetylcholinesterase activity and lipid peroxidation in the brain of
Oreochromis niloticus. Environ. Toxicol. Pharm. 21:241-245.
47. Maxwell LB, Dutta HM. 2005. Diazinon-induced endocrine disruption in bluegill
sunfish, Lepomis macrochirus. Ecotox. Environ. Safe. 60:21-27.
48. Dutta HM, Meijer HJM. 2003. Sublethal effects of diazinon on the structure of the
testis of bluegill, Lepomis macrochirus: a microscopic analysis. Environ. Pollut.
125:355-360.
49. Cripe GM, Goodman LR, Hansen DJ. 1984. Effect of chronic exposure to EPN
and guthion on the critical swimming speed and brain acetylcholinesterase
activity of Cyprinodon variegatus. Aquat. Toxicol. 5:255-266.

27
50. Kwak IS, Chon TS, Kang HM, Chung NI, Kim JS, Koh SC, Lee SK, Kim YS.
2002. Pattern recognition of the movement tracks of medaka (Oryzias latipes) in
response to sub-lethal treatments of an insecticide using artificial neural networks.
Environ. Pollut. 120:671-681.
51. Sandahl JF, Baldwin DH, Jenkins JJ, Scholz NL. 2005. Comparative thresholds
for acetylcholinesterase inhibition and behavioral impairment in coho salmon
exposed to chlorpyrifos. Environ. Toxicol. Chem. 24:136-145.
52. Pavlov DD, Chuiko GM, Gerassimov YV, Tonkopiy VD. 1992. Feeding behavior
and brain acetylcholinesterase activity in bream (Abarmis brama L.) as affected
by DDVP, an organophosphorus insecticide. Comp Biochem Physiol C 103:563-
568.
53. Hiemke C, Härtter S. 2000. Pharmacokinetics of selective serotonin reuptake
inhibitors. Pharmaco. Therapeut. 85:11-28.
54. Frankfurt M, McKittrick CR, Luine VN. 1994. Short-term fluoxetine treatment
alters monoamine levels and turnover in discrete brain nuclei. Brain Res.
650:127-132.
55. Le Poul E, Boni C, Hanoun N, Laporte A, Laaris N, Chauveau J, Hamon M,
Lanfumey L. 2000. Differential adaptation of brain 5-HT1A and 5-HT1B receptors
and 5-HT transporter in rats treated chronically with fluoxetine.
Neuropharmacology 39:110-122.
56. Dawson LA, Nguyen HQ, Smith DI, Schechter LE. 2000. Effects of chronic
fluoxetine treatment in the presence and absence of (±) pindolol: a microdialysis
study. Brit. J. Pharmacol. 130:797-804.
57. Vasskog T, Berger U, Samuelsen PJ, Kallenborn R, Jensen E. 2006. Selective
serotonin reuptake inhibitors in sewage influents and effluents form Tromsø,
Norway. J. Chromatogr. A 1115:187-195.
58. Brooks BW, Turner PIK, Stanley JK, Weston JJ, Glidewell EA, Foran CM,
Slattery M, La Point TW. Huggett DB. 2003. Waterborne and sediment toxicity of
fluoxetine to select organisms. Chemosphere 52:135-142.
59. Henry TB, Black MC. 2008. Acute and chronic toxicity of fluoxetine (selective
serotonin reuptake inhibitor) in western mosquitofish. Arch. Environ. Contam.
Toxicol. 54:325-330.
28
60. Foran CM, Weston J, Slattery M, Brooks BW, Huggett DB. 2004. Reproductive
assessment in Japanese medaka (Oryzias latipes) following a four-week
fluoxetine (SSRI) exposure. Arch. Environ. Contam. Toxicol. 46:511-517.
61. Fong PP. 1998. Zebra mussel spawning is induced in low concentrations of
putative serotonin reuptake inhibitors. Biol. Bull. 194:143-149.
62. Fong PP, Huminski PT, D‟Urso LM. 1998. Induction and potentiation of
parturition in fingernail clams (Sphaerium striatinum) by selective serotonin re-
uptake inhibitors (SSRIs). J. Exp. Zool. 280:260-264.
63. Henry TB, Black MC. 2004. Acute and chronic toxicity of five selective serotonin
reptake inhibitors in Ceriodaphnia dubia. Environ. Toxicol. Chem. 23:2229-2233.
64. Stanley JK, Ramirez AJ, Chambliss CK, Brooks BW. 2007. Enantiospecific
sublethal effects of the antidepressant fluoxetine to a model aquatic vertebrate and
invertebrate. Chemosphere 69:9-16.
65. Clotfelter ED, O‟Hare EP, McNitt MM, Carpenter RE, Summers CH. 2007.
Serotonin decreases aggression via 5-HT1A receptors in the fighting fish Betta
splendens. Pharmacol Biochem. Behav. 87:222-231.
29
CHAPTER 2: BEHAVIORAL AND BIOCHEMICAL EFFECTS OF DIAZINON
IN HYBRID STRIPED BASS
Abstract
The effects of environmental stimuli on biochemical processes may influence
behavior. Environmental contaminants that alter behavior can have major impacts on
populations as well as community structures by changing species‟ interactions. One
important behavior is the ability to capture prey. We hypothesized that sublethal
exposure to diazinon, an organophosphate pesticide, may lead to feeding behavior
abnormalities in hybrid striped bass (Morone saxatilis x M. chrysops) through inhibition
of brain acetylcholinesterase (AChE) activity. This can potentially reduce organism
survival by affecting its ability to find and capture food. To test this hypothesis, bass
were exposed to diazinon for six d, followed by a six-d recovery period in clean water.
Brain AChE activity and the ability of bass to capture prey fathead minnows were
measured every third day. Exposed fish exhibited a concentration- and duration-
dependent decrease in ability to capture prey. While bass in all diazinon treatment
groups had significantly inhibited brain AChE activity, only the medium and high
treatment groups showed a dose- and time-dependent increase in time to capture prey.
Acetylcholinesterase activity also decreased in an exposure duration- and concentration-
dependent manner. The AChE levels in exposed fish did not recover to control levels
during the 6-d recovery period. These results suggest that sublethal exposure to AChE-
inhibiting substances may decrease the ecological fitness of hybrid striped bass by
reducing their ability to capture prey.
30
Introduction
Pesticides are commonly found in the aquatic environment at concentrations that
may impact aquatic life, especially in areas where watersheds are dominated by
agriculture, urban, or mixed land uses ([1]; http://pubs.usgs.gov/fs/2006/3028).
Organophosphate pesticides (OPs) can enter aquatic systems through multiple routes
including accidental spillage, discharge of untreated effluents, spray drift, and surface
runoff [2]. Once OPs make their way into aquatic systems, they can create potentially
toxic environments for non-target species. The mode of action for OPs is to inhibit the
enzyme acetylcholinesterase (AChE). Acetylcholinesterase is responsible for removing
the neurotransmitter acetylcholine from the synaptic cleft, thus inhibiting AChE can
create an accumulation of endogenous acetylcholine in nerve tissues and effector organs
[3], resulting in a continuous firing of nerve impulses. This disruption of normal nervous
system function can lead to convulsions, paralysis, and eventually death [4]. Inhibition of
AChE activity has been used as a biomarker of exposure for OP toxicity in terrestrial and
aquatic organisms [2].
Diazinon is an OP that has been extensively used to control a wide variety of
insects for domestic and agricultural purposes [5];
http://fl.water.usgs.gov/Gafl/Abstracts/ofr93478/ofr93478.html). While there has been a
significant decrease in environmental diazinon concentrations due to a phase-out for
nonagricultural uses beginning in 2002 [1], diazinon has been frequently detected as high
as 1.4 µg/L [6] in aquatic environments. The presence of pesticides like diazinon could
impair the ecological fitness of an organism by altering behaviors such as searching for
31
and capturing food, avoiding predators, and reproducing. Decreased fitness at the
individual level could ultimately impact the population. Because such behaviors are
underlined by mechanisms at the biochemical level [7], assessing behavioral changes in
organisms exposed to contaminants may allow researchers to better interpret biochemical
changes as well as understand potential consequences at the population or community
level.
The purpose of the present study was to characterize the relationship between
brain AChE and feeding behavior in hybrid striped bass (Morone saxatilis x M. chrysops)
exposed to diazinon for 6 d followed by a 6-d recovery period. Results of this study
demonstrate a relationship between changes in brain biochemistry and an ecologically
relevant behavior. Understanding such a relationship is important because it allows us to
better predict population level effects from a biochemical response.
Methods and Materials
Test chemicals
Diazinon, acetylcholine iodide (ATCI), 5,5'-disthiobis(2-nitrobenzoic acid)
(DTNB), and 0.1M phosphate buffered saline (PBS) were purchased through Sigma
Aldrich (St. Louis, MO, USA). Reagent grade NaHCO3 was purchased from Fisher
Scientific (Fairlawn, NJ, USA).
Fish
Hybrid striped bass were chosen as the predator species because they grow
rapidly, are resilient to handling stress, are amenable to laboratory culture, and are often
stocked as sport fish and for use in aquaculture ([8], [9];
32
http://www.lsuagcenter.com/en/communications/publications/newsletters/lagniappe/).
Bass were obtained from Southland Fisheries (Hopkins, SC, USA). Fish were housed in
450 L circular flow-through holding tanks at Clemson University‟s Institute of
Environmental Toxicology and fed a pellet food (Zeigler Brothers, Gardners, PA, USA)
daily. Larval fathead minnows (Pimephales promelas) were obtained from a culture
maintained at Clemson University‟s Institute of Environmental Toxicology and reared
until they were the appropriate size (~4 cm) to be used in the tests.
Experimental design
Hybrid striped bass were exposed to diazinon for 6 d under static conditions
followed by a 6-d recovery period, for a total of 12 d. Diazinon concentrations were
tested at levels greater than those found in the environment in order to more clearly
quantify potential impacts of diazinon on our chosen endpoints. Four tests were
conducted for periods of 3 d, 6 d, 9 d, or 12 d. The four treatment groups had five
replicate bass per test, for a total of 20 bass per test. Bass were fed live prey on days 0, 3,
6, 9, and 12, and feeding behavior was quantified. Fish brains were extracted for
acetylcholinesterase activity at the end of each test (see below). Hence, four tests were
conducted for 3, 6, 9, or 12 d in which bass were fed every third day and brains were
harvested at the end of each test.
Hybrid striped bass (mean ± standard deviation [SD]; weight 166.0 + 37.3 g;
length 21.4 + 2.3 cm) were randomly placed (one bass per tank) into twenty-four 80-L
aquaria (30.5 cm x 30.5 cm x 90 cm) operated under flow through conditions (0.23 liters
per min). Bass that did not eat all four minnow prior to exposure initiation were
33
eliminated from the test to reduce any confounding factors. Therefore, we stocked four
extra tanks to be sure that there we would have 20 useable bass for a complete test. Bass
removed from the test were returned to the holding tank for potential use in subsequent
tests.
Bass were allowed to acclimate for 7 d prior to test initiation. A nearby lake,
Lake Hartwell (SC, USA), was the source of test waters (mean ± SD; pH 6.36 + 0.12,
hardness 24 mg/L as CaCO3, alkalinity 10 mg/L as CaCO3). Water temperature was
controlled using a mixing valve (M & M Control Services, Grayslake, IL, USA) that
regulated a mixture of ambient and chilled water (ambient water circulated through an in-
line chiller) or heated water (ambient water circulated through an in-line heater)
depending on the ambient conditions (summer or winter months, respectively) to
facilitate achieving a desired temperature of approximately 25C (mean ± SD; 25.1 ±
1.1C). Water was then pumped through a multi-resin filtration system (Water and Power
Technologies Columbia, SC, USA) to remove suspended solids and any other possible
contaminants prior to entering experimental tanks. During exposure periods when waters
were static, water temperatures were controlled by ambient air temperature. Diazinon
exposure lasted a maximum of 6 d under static conditions, followed by a maximum of 6 d
for recovery (flow was turned back on at a rate of 0.23 liter per min), for a total of 12 d.
Bass were fed four fathead minnows every third day during the acclimation
period. This feeding regime ensured the bass were hungry and were accustomed to
eating live minnows. Bass were fed on days 1, 4, and 7 of the acclimation period so that

34
the last day of acclimating coincided with day 0 of the diazinon exposure. Feeding
behavior (time to capture prey) of bass was quantified every third day during the test.
Prior to each feeding, air stones were removed from each tank, and water flow
was also turned off during the recovery period. Following this, researchers waited at
least 2 min before adding prey for acclimation just in case bass were startled when air
stones were removed. Four fathead minnows were dropped into an exposure tank and the
time to eat each prey was recorded. Minnows used in the tests were visually estimated to
be approximately 4 cm. Minnows of similar size were preselected prior to feeding to
ensure that no extremely large or small minnows were used to skew appetite satiation.
Minnows were then randomly selected and fed to bass without regard to treatment. Bass
were observed until all minnows were consumed or for a maximum of 25 min. Any
uneaten minnows after 25 min were removed from the tank, and air stones replaced.
During the recovery period, water flows were also turned back on following each
feeding. For statistical purposes, uneaten minnows were assigned a value of 1500 s (25
min).
Diazinon exposure
At test initiation, water flow was turned off and an appropriate quantity of
diazinon stock dissolved in acetone was added to each aquarium to achieve nominal
treatment concentrations of 50, 150, and 200 µg/L. While reported median effective
concentration (EC50) and median lethal concentration (LC50) values for fish range from
248 µg/L for bluegill (Lepomis macrochirus) to 6,970 µg/L for fathead minnows
(Pimephales promelas) [10], preliminary studies performed in our laboratory found that

35
nominal concentrations of 300 µg/L resulted in significant deaths in hybrid striped bass
following a 6-d exposure to diazinon. Limited mortality in the highest treatment (200
µg/L) slightly decreased the number of replicates for that treatment.
One concentrated stock of diazinon was prepared for all tanks in order to reduce
tank-to-tank variability within treatments. Final acetone volumes in each tank, which
increased with increasing treatment level, did not exceed 280 µl in 80 L of water. This is
less than 0.0004% of the test water. The Acetone Material Safety Data Sheet (Fisher
Diagnostic, Middleton, PA. www.cleanersolutions.org/msds/Acetone%20MSDS.htm)
indicated the acetone LC50 for fish was greater than 5,000 mg/L. Concentrations of
acetone in our individual tanks of the present study did not exceed 2.8 mg/L. Previous
research in our laboratory with a number of aquatic organisms has indicated that this
concentration does not cause effects (S.J. Klaine, personal communication). Test waters
were allowed to equilibrate for 1 to 2 h prior to taking 50 ml water samples for diazinon
analysis. These water samples were filtered through 6 ml C18 solid phase extraction
columns (HyperSep C18, Thermo Electon, Bellefonte, PA, USA) that were
preconditioned with 6 ml acetone, 6 ml methanol, and 6 ml deionized water. Extraction
columns were dried for at least 30 min at room temperature on a vacuum manifold (JT
Baker, Philipsburg, NJ, USA) before eluting diazinon with ethyl acetate. Control and
low diazinon treatment samples were extracted in 10 ml ethyl acetate while the medium
and high concentration samples were extracted in 25 ml. Samples were stored at -20C
until analyzed by gas chromatography.

36
Diazinon half-life was previously determined to be approximately 48 h under test
conditions. Therefore, waters were spiked at half the original diazinon concentration on
days 2 and 4 of the exposure period. Water samples for diazinon analysis were taken on
day 0, day 2 before spiking, day 2 after spiking, day 4 before spiking, day 4 after spiking,
and day 6 to monitor fluctuating diazinon concentrations.
Diazinon analysis
Extracts (1µl) were analyzed via Hewlett-Packard 5890 gas chromatograph
(Agilent Technologies, Santa Clara, CA, USA) with a flame photometric detector
operated in „P‟ mode for 10.5 min each on a 5 meter HP-1 (100% dimethylpolysilozane
coating) column (Agilent Technologies). Injection temp was 225C and the detector
temperature was 200C. Oven was initially set at 60C, held for 0.5 min, then increased
20C/min to 180C and held for 4 min.
Brain tissue preparation
Following timed feedings, bass were euthanized in buffered MS-222 (Tricaine
methanesulfonate; Western Chemical Ferndale, WA, USA) and brains were quickly
removed and put on dry ice prior to storage at -70C. Brains were thawed, homogenized
in 0.5 ml 0.1M PBS buffer, and diluted to 3 ml. Homogenates were centrifuged at 5,000
rpm and 4C for 20 min to remove cellular debris. Supernatant was stored at -70C until
used for bioassays.
Protein assay
Protein concentrations were determined using a BCA (bicinchoninic acid) Protein
Assay Kit (Pierce, Rockford, IL, USA). Brain homogenates were diluted 1:2 to 1:5 in

37
0.1M PBS prior to running the assay. Acetylcholinesterase activity was normalized using
protein concentrations.
Acetylcholinesterase assay
Acetylcholinesterase analysis was modified from Ellman et al. [11].
Acetylcholine iodide was prepared at 21.68 mg/ml in 0.1M PBS. Ellman‟s reagent was
prepared at 3.96 mg/ml DTNB and 1.50 mg/ml NaHCO3. The working buffer contained
0.65% acetylcholine iodide (ACTI), 3.25% Ellman‟s reagent, and 96.10% 0.1M PBS.
Four µl brain homogenate was added in duplicate in a 96-well plate to which 246 µl
working reagent was added to all wells for a total of 250 µl per well. Absorbance at 412
nm was read in 5 min intervals over 30 min on a SpectraMax® 190 plate reader
(Molecular Devices, Sunnyvale, CA, USA) using SoftMaxPro software (Molecular
Devices).
Data analysis
We used Statistical Analysis Software® 9.1 (SAS, Cary, NC, USA) to analyze
time to capture prey using a two-factor analysis of variance (ANOVA) model with the
independent variables treatment and day. Multiple pair-wise comparisons among and
within treatment, day, and treatment-by-day terms were performed using the LSMEANS
(least square means) option within PROC GLIMMIX (General Linear Model for Mixture
Distributions), an analyses matrix that uses joint modeling for multivariate data.
Acetylcholinesterase data were evaluated using two-factor ANOVA models with
independent variables of treatment and day. We used PROC GLIMMIX with
LSMEANS statement to determine statistical differences among and within treatment,

38
day, and treatment-by-day interactions, rather than using PROC GLM (ANOVA
analyses) with multiple MEANS and LSMEANS statements to determine significant
differences among and within the independent variables. An = 0.05 was used as the
level of significance for both time to capture prey and AChE levels with both PROC
GLM and PROC GLIMMIX analyses.
Results
Diazinon concentrations
Measured diazinon concentrations were approximately 40 to 50% of the
anticipated nominal concentrations likely due to hydrolysis, photolysis, and some
sorption to the aquaria and debris in aquaria. Extraction efficiencies were 90 to 100%
(data not shown). Measured concentrations (mean ± standard error [SE]) throughout the
exposure period for the low (50 µg/L), medium (150 µg/L), and high (200 µg/L)
treatments were 19.1 ± 0.7, 64.0 ± 2.0, and 101.9 ± 1.4 µg/L, respectively. These values
represent the mean of all replicates of the four tests following each spiking. Measured
diazinon concentrations were used in all data analyses.
Acetylcholinesterase
Results from the present study showed a dose-response relationship between
AChE inhibition and diazinon exposure concentration. Brain AChE activities in all
treatments were significantly different from each other at all time points after day 0 with
the exception of day 12 (Figure 2.1). Acetylcholinesterase activity continued to decrease
significantly between days 3 and 6 for the low and medium treatment groups, but not the
high treatment. Hybrid striped bass in the present study demonstrated 86.4% AChE

39
inhibition (6.1 ± 0.6 pmol/mg protein/min) after just 3 d of exposure to the highest
diazinon concentration (mean ± SE; 101.9 ± 1.4 µg/L) as compared to controls on that
day (44.7 ± 4.1 pmol/mg protein/min), and these levels remained fairly constant through
day 6 (5.6 ± 0.5 pmol/mg protein/min). Acetylcholinesterase activity in bass in the low
treatment (mean ± SE; 19.1 ± 0.7 µg/L) was decreased by 51.1% (21.9 ± 1.2 pmol/mg
protein/min) and 66.3% (13.8 ± 1.6 pmol/mg protein/min) on days 3 and 6, respectively,
while AChE activity in bass in the medium treatment (64.0 ± 2.0 µg/L) decreased by
75.5% (11.0 ± 0.9 pmol/mg protein/min) and 82.2% (7.3 ± 0.3 pmol/mg protein/min) on
days 3 and 6, respectively.
Acetylcholinesterase activity began to increase during the recovery period in
diazinon treated bass. While AChE activity increased significantly by day 12 (day 6 of
recovery) as compared to day 6, enzyme activities did not return to pre-exposure levels.
By the third day of the recovery period (day 9), only AChE activity in bass in the medium
treatment was significantly increased as compared to the end of the exposure on day 6.
Acetylcholinesterase levels in the medium treatment increased by 8.3% between days 6
and 9 to 10.1 ± 0.7 pmol/mg protein/min. Brain AChE activities in low and high
treatments on day 9 were only increased by 2.5% (14.1 ± 0.7 pmol/mg protein/min) and
3.3% (6.6 ± 0.5 pmol/mg protein/min), respectively. By the sixth day of recovery (day
12) however, all treatment groups showed significantly greater AChE activity as
compared to day 6. The low, medium, and high treatment groups increased by 20.3%
(22.9 ± 1.2 pmol/mg protein/min), 13.4% (13.3 ± 1.9 pmol/mg protein/min), and 11.1%
(10.5 ± 1.3 pmol/mg protein/min) as compared to day 6, respectively.

40
To determine the 6-d EC50 for AChE inhibition, diazinon concentrations were
linearized using a log plot and 50% effect concentrations were calculated using the linear
equation. The estimated 6-d EC50 was 15.2 ± 1.1 µg/L (Figure 2.2).
Behavior Data: Exposure/Recovery Effects
On day 0, behavior data was recorded prior to initial diazinon exposure. There
were no significant differences among treatment groups. At no time point during the test
was feeding behavior in the low treatment significantly different from the controls
(Figure 2.3) even though they exhibited significantly reduced AChE levels at all time
points after day 0. In the medium treatment, time to capture the first prey took
significantly longer than controls on day 6 of the exposure period, and throughout the
recovery period (days 9 and 12) (Figure 2.3a). Time to capture the second prey fish was
only significantly longer than controls on day 6, (Figure 2.3b), indicating that behavioral
effects of diazinon were diminishing as recovery time increased. However all time points
for bass in the medium treatment for capturing the third prey fish were still significantly
different from controls throughout the recovery period (Figure 2.3c). Bass in the high
treatment group took significantly longer to eat all prey fish versus the controls at all time
points after day 0.
As recovery time increased, time to capture prey decreased significantly for bass
in the medium treatment, but not the high treatment. Time to capture prey 1 and 2 in the
medium treatment significantly decreased between the end of the exposure on day 6 and
the third day of recovery on day 9. While time to capture prey continued to decrease
between days 9 and 12, this was not significant. During the recovery period (days 9 and
41
12), time to capture prey 3 for bass in the medium treatment was not significantly
different from day 6. While times to capture prey 1, 2, and 3 decreased for bass in the
high treatment during the recovery period (days 9 and 12), they were not statistically
different from day 6. See Appendix Table A-1 for mean ± SE values for time to capture
prey for each treatment and day.
Discussion
Organophosphate pesticides have been widely used since the 1930s due in part to
their rapid degradation in the environment [2]. As a result of their nonpersistence, it can
be difficult to extrapolate an environmental concentration to behavioral or biochemical
effects on aquatic organisms outside a laboratory scenario. The specificity of OPs for
AChE makes AChE activity a widely used biomarker of exposure to such compounds. It
is important, however, that we try to establish links between biomarkers and higher levels
of biological organization, notably ecologically relevant endpoints [12].
Changes in brain biochemistry can alter important behaviors for survival and
fitness. While biochemical changes resulting from contaminant exposure are often cited
as potentially detrimental, the implications of these changes on populations are
speculative at best. Organisms can compensate for sublethal stressors by altering energy
uptake (feeding activity) and expenditure, which could lead to changes at lower
biological levels and ultimately affect populations [12]. Therefore, an organism‟s feeding
behaviors may provide a better indication of ecological fitness and the impacts of OP
exposure on population dynamics [12] than biomarkers alone. Reduced feeding behavior
can be separated into a number of different feeding processes including motivation,

42
orientation to prey, strikes, and miscues [13]. Prey capture, our chosen behavioral
endpoint, is ecologically relevant because it can be related directly to growth and survival
[7].
Many researchers who have examined the effects of neurotransmitter inhibitors on
aquatic organisms focus on the biochemical responses and neglect to measure behavioral
responses in a quantitative manner. Fulton and Chambers [14] evaluated behavior
qualitatively in mosquitofish (Gambusia affinis) reporting normal behavior three weeks
after exposure to an AChE inhibitor. They also found that tadpoles (Rana sp.) showed no
clinical signs associated with neurotoxicity. Keizer et al. [15] observed symptoms of
swollen gills and coordination problems in zebrafish (Brachydanio rerio) and guppies
(Poecilia reticulata) exposed to diazinon, noting that they drifted on their backs at the
water surface just before death. Unlike zebrafish, however, the guppies showed these
symptoms temporarily and then recovered. A review by Fulton and Key [4] compiled
laboratory studies in fish and invertebrates in which AChE inhibition and in some cases,
AChE recovery, was used as a biomarker. However, these experiments only assessed
biochemical changes; hence, they could not relate compromised AChE inhibition to
compromised ecological fitness. These studies underscore the use of AChE activity as a
biomarker of exposure, but provide little insight into its utility to be used for the
characterization of effects.
Although their behavior was significantly impacted, hybrid striped bass tolerated
over 80% AChE inhibition following a 6-d diazinon exposure. Other researchers have
reported similar results of AChE inhibition. Coppage [16] reported brain AChE

43
inhibition by OPs greater than 80% in all fish that survived median lethal exposures, and
Ferrari et al. [17] reported AChE inhibition values between 77 and 95% following a 96-h
exposure to multiple OPs. In addition, bluegill (Lepomis macrocharis) had 95% AChE
inhibition within 6 h of diazinon exposure, while fathead minnow, goldfish (Carassius
auratus), and golden shiner (Notemigonus crysoleucas) showed 70, 43, and 40% AChE
inhibition, respectively, within 18 h of exposure [18]. Goodman et al. [19] also reported
a 71% AChE inhibition in sheepshead minnow (Cyprinodon variegates) following a 24-h
exposure to diazinon.
Contaminants like diazinon can impair feeding behavior by affecting motivation
to feed, search effectiveness, or ability to capture prey. Hybrid striped bass tolerated
more than 66% AChE inhibition before a significant effect on feeding behavior was
observed, as suggested by the lack of observable, or statistical, behavioral impairments in
the low treatment group on day 6 (Figure 2.4). We quantified an increased time to capture
prey and a decreased AChE activity as a result of increased exposure concentrations and
durations. Plotting our two endpoints at the end of the exposure against each other, we
noted a threshold response between biochemistry and behavior at the concentrations
tested (Figure 4).
In the present study, we saw a dose-response relationship between AChE
inhibition and diazinon exposure concentration. The estimated 6-d EC50 of diazinon on
AChE activity (mean ± SE) was 15.2 ± 1.1 µg/L. This value was lower than the
estimated 6-d EC50 value for feeding behavior (mean ± SE) 50.1 ± 4.0 µg/L (data not
shown). Other investigators have reported acute 96-h LC50 values for diazinon for

44
various aquatic species including crayfish (Gammarus fasciatus) 0.2 µg/L [20], Hyallela
azteca 4.0 µg/L [21], rainbow trout (Oncorhynchus mykiss) 90 µg/L, and bluegill
(Lepomis macrocharis) 170 µg/L [20]. The differences noted in EC50 values between
AChE inhibition and behavioral impairments in the present study has also been noted
when considering AChE activity and swimming stamina in sheepshead minnows [22],
red drum (Sciaenops ocellatus) [23], mummichog (Fundulus heteroclitus) [23] and
salmonids [24]. On the other hand, linear correlations between changes in swimming
speed and AChE activity were noted in rainbow trout [25, 26], and Coho salmon
(Oncorhynchus kisutch) [27, 28].
As with the present study, other researchers have found that several factors are
responsible for the effects of OPs on AChE inhibition and recovery in aquatic organisms
including the type of OP, exposure duration and concentration, the degree of AChE
depression, and species exposed [17, 25, 29, 30]. During the recovery period when bass
were in clean water, there were decreases in time to capture prey as compared to day 6
for both the medium and high treatments, however only increased times to capture the
first and second prey for bass in the medium treatment were significant (Figure 2.3).
When comparing time to capture prey during the recovery period to controls on their
respective day, only times to capture prey 2 on days 9 and 12 for the medium treatment
were comparable to controls. Although bass improved their prey-capturing ability, AChE
levels were still significantly inhibited (Figure 2.1). Similarly, Morgan et al. [29] looked
at recovery times for Atlantic salmon (Salmo salar) exposed to sublethal concentrations
of fenitrothion and found AChE was still depressed by 34% one week following a 7-d

45
exposure to 213 µg/L, noting that recovery of enzyme activity was related to the degree
of initial inhibition. Exposure of goldfish (Carassius auratus) to OPs (parathion and
carbaryl) also showed little increases in cholinesterase activity during a 96-h recovery
period in clean water. The tests further revealed that goldfish required at least 35 d of
depuration to substantially recover cholinesterase activity following the exposure [17].
Also, AChE activity in eels (Anguilla anguilla) exposed to fenitrothion for 96-h was still
significantly inhibited 12 d post-exposure as compared to controls [30].
Fenitrothion is an OP that has been shown to decrease another aspect of feeding:
foraging behavior [31]. Researchers found that attack sequences, frequency of ingestion,
and reaction distance of juvenile Atlantic salmon were all decreased as compared to
controls. The pesticide-exposed salmon waited until their prey moved closer before
striking and were more likely to end the sequence before capturing the prey [31].
Latency to first strike and total food strikes during a fixed time interval were also noted in
Coho salmon [28]. Although not quantified, similar behavioral abnormalities were
observed in the present study as well. Many bass in the medium and high treatments
would strike at their prey unsuccessfully due either to not striking quick enough or not
being close enough to the prey. After a few failed attempts, bass would no longer strike.
Other times, bass would follow a minnow around the tank without attempting to strike, or
swim toward the minnow only to turn around, as if to give up before striking in order to
conserve energy. Bass in the highest treatment were virtually uninterested in the
minnows and were inactive for the most part, even if minnows were within reach with
minimal energy expenditure required.

46
Prey handling time also increased with increasing diazinon concentration causing
bass to spend more time and energy consuming the food, thus eating less in a given
period of time. Since prey handling depends on coordination of different muscle
activities that are under the control of the central nervous system, impairment of nerve
transmission may result in a loss of this coordination [32]. While bass in the medium
treatment were not as active as the control or low treatments, they were still more active
than the high treatments. However, they were noted as having an increased handling time
as a result of spitting out some captured prey. Bass in the low treatment exhibited no
signs of behavioral impairment despite having significantly reduced AChE activities at
all time points measured and would wait anxiously to be fed throughout the duration of
the experiments.
Seemingly small impacts on various behaviors can impact both populations and
community structures. A decreased efficiency in foraging and prey capture may lead to
decreased growth and survival, as well as decreased energy available for reproduction. In
order to be ecologically fit, fish must maintain essential behaviors. Dose-response
relationships may exist for an endpoint at a given level of organization, but the ecological
relevance at higher levels of organization is often unclear or unknown. This uncertainty
is perhaps most obvious, and most difficult to address when attempting to establish links
between levels of biological organization [33].
Impaired feeding behaviors as a result of OP exposure could significantly
decrease the probability of responding to, or capturing prey items. This could result in a
decreased growth if the exposure and/or effects were long lasting [31]. However, if
47
behavioral changes were quickly reversed, there may not be significant impacts on higher
levels of organization. As with other sublethal toxic effects, it can be difficult to attribute
ecological relevance to sublethal AChE inhibition [27]. The relationship between AChE
inhibition and outward signs of intoxiciation can be complex, especially when accounting
for species and individual variability [17]. Results of the present study demonstrate that
significant AChE inhibition can occur before behavioral changes are observed, and this
inhibition can last much longer than the exposure duration. We also noted that the effect
of diazinon on feeding behavior was recovering to control levels quicker than AChE
activity.
Biomarker assays like AChE activity provide clear indications of contaminant
exposure, yet by itself, does not give a clear indication of how these contaminants affect
the ecological fitness of an individual. By evaluating an ecologically relevant behavioral
endpoint along with AChE activity, it may be possible to better relate this biomarker of
organophosphate exposure to ecological fitness. Establishing this relationship would
help relate sublethal biochemical changes to population-level effects [26], making AChE
activity a more useful endpoint for use in risk assessments.
References
1. Gilliom, RJ, Hamilton PA. 2006. Pesticides in the nations streams and groundwater,
1992-2001- a summary. USGS Fact Sheet 2006-3028. U.S. Geological Survey,
Tallahassee, FL.
2. Guilhermino L, Lopes MC, Carvalho AP, Soares AMVM. 1996. Inhibition of
acetylcholinesterase activity as effect criterion in acute tests with juvenile Daphnia
magna. Chemosphere 32:727-738.

48
3. Pan G, Dutta HM. 1998. The inhibition of brain acetylcholinesterase of juvenile
largemouth bass Micropterus salmoides by sublethal concentrations of diazinon.
Environ Res Sect A 79:133-137.
4. Fulton MH, Key PB. 2001. Acetylcholinesterase inhibition in estuarine fish and
invertebrates as an indicator of organophosphorus insecticide exposure and effects.
Annual Review. Environ Toxicol Chem 20:37-45.
5. Berndt MP, Hatzell HH. 2001. Does diazinon pose a threat to a neighborhood stream
in Tallahassee, Florida? USGS Fact Sheet FS-143-00. U.S. Geological Survey,
Sacramento, CA.
6. Hoffman RS, Capel PD, Larson SJ. 2000. Comparison of pesticides in eight U.S.
urban streams. Environ Toxicol Chem 19:2249-2258.
7. Weis JS, Smith G, Zhou T, Santiago-Bass C, Weis P. 2001. Effects of contaminants on
behavior: Biochemical mechanisms and ecological consequences. BioScience 51:209-
217.
8. Weirich, CR, Tomasso, JR, Smith TIJ. 1992. Confinement and transport-induced
stress in white bass (Morone chrysops) x striped bass (M. saxatilis) hybrids: Effect of
calcium and salinity. J World Aquacult Soc 23:49-57.
9. Gothreaux C. 2007. Family profile: Moronidae – The temperate basses. Lagniappe
Fisheries Newsletter 31:3-5.
10. Giddings JM, Biever RC, Annunziato MF, Hosmer AJ. 1996. Effects of diazinon on
large outdoor pond microcosms. Environ Toxicol Chem 15:618-629.
11. Ellman GL, Courtney KD, Andres V Jr, Featherstone RM. 1961. A new and rapid
colorimetric determination of acetylcholinesterase activity. Biochem Pharmacol 7:88-
95.
12. Duquesne S. 2006. Effects of an organophosphate on Daphnia magna at
suborganismal and organismal levels: Implications for population dynamics.
Ecotoxicol Environ Saf 65:145-150.
13. Little EE, Archeski RD, Flervo B, Kozlovskaya V. 1990. Behavioral indicators of
sublethal toxicity in rainbow trout. Arch Environ Contam Toxicol 19:380-385.
14. Fulton MH, Chambers JE. 1985. Inhibition of neurotoxic esterase and
acetylcholinesterase by organophosphorus compounds in selected ectothermic
vertebrates. Pestic Biochem Physiol 23:282-288.
49
15. Keizer J, D‟Agostion G, Vittozzi L. 1991. The importance of biotransformation in the
toxicity of xenobiotics to fish. I. Toxicity and bioaccumulation of diazinon in guppy
(Poecilia reticulata) and zebra fish (Brachydanio rerio). Aquat Toxicol 21:239-254.
16. Coppage DL. 1972. Organophosphate pesticides: Specific level of brain AChE
inhibition related to death in sheepshead minnows. Trans Am Fish Soc 101:534-536.
17. Ferrari A, Venturion A, Pechen de D‟Angelo AM. 2004. Time course of brain
cholinesterase inhibition and recovery following acute and subacute azinphosmethyl,
parathion and carbaryl exposure in the goldfish (Carassius auratus). Eccotoxicol
Environ Saf 57:420-425.
18. Weiss CM. 1961. Physiological effect of organic phosphorus insecticides on several
species of fish. Trans Am Fish Soc 90:143-152.
19. Goodman LR, Hansen DJ, Coppage DL, Moore JC, Matthews E. 1979. Diazinon
chronic toxicity to, and brain acetylcholinesterase inhibition in, the sheepshead
minnow, Cyprinodon variegatus. Trans Am Fish Soc 108:479-488.
20. Mayer FL, Ellersieck MR. 1986. Manual of acute toxicity: Interpretation and database
for 410 chemicals and 66 species of freshwater animals. Resource Publication 160.
U.S. Department of the Interior, Fish and Wildlife Service, Washington, DC.
21. Collyard SA, Ankley GT, Hoke RA, Goldenstein T. 1994. Influence of age on the
relative sensitivity of Hyalella azteca to diazinon, alkylphenol ethoxylates, copper,
cadmium, and zinc. Arch Environ Contam Toxicol 26:110-113.
22. Cripe GM, Goodman, Hansen DJ. 1984. Effect of chronic exposure to EPN and to
guthion on the critical swimming speed and brain acetylcholinesterase inhibition of
Cyprinodon variegates. Aquat Toxicol 5:255-266.
23. Van Dolah RF, Maier PP, Fulton MH, Scott GI. 1997. Comparison of azinphosmethyl
toxicity to juvenile red drum (Sciaenops ocellatus) and the mummichog (Fundulus
heteroclitus). Environ Toxicol Chem 16:1488-1493.
24. Post G, Leasure R. 1974. Sublethal effect of malathion to three salmonid species.
Bull Environ Contam Toxicol 12:312-319.
25. Beauvais SL, Jones SB, Parris JT, Brewer SK, Little EE. 2001. Cholinergic and
behavioral neurotoxicity of carbaryl and cadmium to larval rainbow trout
(Oncorhynchus mykiss). Ecotoxicol Environ Saf 49:84-90.
50
26. Beauvais SL, Jones SB, Brewer SK, Little EE. 2000. Physiological measures of
neurotoxicity of diazinon and malathion to larval rainbow trout (Oncorhynchus
mykiss) and their correlation with behavioral measures. Environ Toxicol Chem
19:1875-1880.
27. Tierney K, Casselman M, Takeda S, Farrell T, Kennedy C. 2007. The relationship
between cholinesterase inhibition and two types of swimming performance in
chlorpyrifos-exposed coho salmon (Oncorhynchus kisutch). Environ Toxicol Chem
26:998-1004.
28. Sandahl JF, Baldwin DH, Jenkins JJ, Scholtz NL. 2005. Comparative thresholds for
acetylcholinesterase inhibition and behavioral impairment in coho salmon exposed to
chlorpyrifos. Environ Toxicol Chem 24:136-145.
29. Morgan MJ, Fancey LL, Kiceniuk JW. 1990. Response and recovery of brain AChE
activity in atlantic salmon exposed to fenitrothion. Can J Fish Aquat Sci 47:1652-
1654.
30. Sancho E, Ferrando MD, Andreu E. 1997. Response and recovery of brain
acetylcholinesterase activity in the European eel, Anguilla anguilla, exposed to
fenitrothion. Ecotoxicol Environ Saf 38:205-209.
31. Morgan MJ, Kiceniuk JW. 1990. Effect of fenitrothion on the foraging behavior of
juvenile Atlantic salmon. Environ Toxicol Chem 9:489-495.
32. Pavlov DD, Chuiko GM, Gerassimov YV, Tonkopiy VD. 1992. Feeding behavior and
brain acetylcholinesterase activity in bream (Abarmis brama L.) as affected by
DDVP, an organophosphorus insecticide. Comp Biochem Physiol C 103:563-568.
33. Sibley PK, Chappel MJ, George TK, Solomon KR, Liber K. 2000. Integrating effects
of stressors across levels of biological organization: Examples using
organophosphorous insecticide mixtures in field-level exposures. J Aquat Ecosyst
Stress Recovery 7:117-130.

51
Figure 2.1. Brain acetylcholinesterase activity (AChE) (mean ± SE) in hybrid striped
bass during a 6-day waterborne exposure to diazinon, followed by a 6-day recovery
period. Means with the same letter are not statistically different from each other. Vertical
line at day 6 separates exposure and recovery time points.

52
Figure 2.2. Day 6 acetylcholinestrease (AChE) activity (mean ± SE) as a function of
measured diazinon concentration (mean ± SE). The estimated 6-day EC50 was 15.2 ±
1.1 µg/L. Error bars indicate 95% confidence intervals.

53
Figure 2.3. Time (mean ± SE) it took hybrid striped bass to capture the first (A),
second (B) and third (C) prey fish during a 6-day diazinon exposure followed by a 6-
day recovery period. Means with the same letter are not statistically different from
each other. Vertical line at day 6 separates exposure and recovery time points.

54
Figure 2.4. Day 6 time to eat prey 1 and prey 2 (mean ± SE) as a function of brain
acetylcholinestrease activity (AChE) (mean ± SE) in hybrid striped bass.

55
CHAPTER 3: BEHAVIORAL AND BIOCHEMICAL RESPONSES OF HYBRID
STRIPED BASS DURING AND AFTER FLUOXETINE EXPOSURE
Abstract
Environmental contaminants, including pharmaceuticals, can alter behavior and
possibly impact population and community structures. One important behavior that could
be impacted is the ability to capture prey. We hypothesized that sublethal fluoxetine
exposure may lead to feeding behavior abnormalities in hybrid striped bass (Morone
saxatilis x M. chrysops). Fluoxetine is an antidepressant that acts as a selective serotonin
reuptake inhibitor (SSRI). A change in serotonin levels affects multiple behaviors
including feeding, which is an important aspect in ecological fitness. This research
characterized the impact of sublethal fluoxetine exposures on the ability of hybrid striped
bass to capture fathead minnows (Pimephales promelas). Bass were exposed to
fluoxetine (0.0 µg/l, 23.2 + 6.6 µg/l, 51.4 + 10.9 µg/l and 100.9 + 18.6 µg/l,) for six days,
followed by a six-day recovery period in clean water. Brain serotonin activity and the
ability of bass to capture prey were measured every third day. Exposed fish exhibited a
concentration- and duration- dependent decrease in ability to capture prey. Increased
time to capture prey also correlated with decreases in brain serotonin activity. Serotonin
activity also decreased in an exposure time- and concentration-dependent manner,
maximally inhibited 23.7%, 28.0%, and 49.1% of control in the low, medium, and high
treatments, respectively. Serotonin levels in exposed fish did not recover to control
levels during the six-day recovery period. These results suggest that sublethal exposure

56
to fluoxetine decreases the ability of hybrid striped bass to capture prey and that serotonin
can be used as a biomarker of exposure and effect.
Introduction
Many pollutants adversely affect normal endocrine functions, and unfortunately,
these chemicals are ubiquitous in the environment [1]. The central nervous system is a
target of endocrine-disruptors, so social behaviors under hormonal control such as
aggression, dominance, motivation, and activity are often directly impacted by exposure
to these contaminants [1]. Behavior is a major link between the organism and its
environment [2]. It is both a result and determinant of molecular, physiological, and
ecological aspects of toxicology; therefore, it provides insight into various levels of
biological organization [3]. Behavioral responses also reflect an organism‟s ecological
fitness and its abilities to avoid predators, select prey items, and reproduce [2].
Alterations in any of these behaviors, coupled with changes in physiology may alter
population stability [3].
Fluoxetine (Prozac™) is an antidepressant that acts as a selective serotonin
reuptake inhibitor (SSRI). Serotonin functions as a neurotransmitter to regulate a wide
range of behaviors including feeding activity, aggressive interactions, sexual behavior,
and establishment of social hierarchies [4, 5]. SSRIs, like fluoxetine, act by inhibiting the
reuptake of serotonin from the synaptic cleft, and increasing extracellular serotonin
levels. They have been effective in improving mood levels and decreasing appetite and
aggression. Therefore, SSRIs are commonly prescribed for depression, compulsive
behaviors, and personality disorders [6].

57
Fluoxetine, like most drugs, was developed with the intent of altering
biochemistry and having specific pharmacological and physiological functions. Many
drugs are polar, nonvolatile, and nonbiodegradable [7, 8] so they tend to escape
sedimentation and biological treatment in wastewater treatment plants [5, 7]. They are
persistent in order to reach the target site before becoming inactive, but this also increases
the possibility of bioaccumulation in aquatic or terrestrial organisms [8]. The high
frequency of use and continual output of drugs from wastewater treatment plants and
other sources simulates episodic or continuous exposures, rather than acute exposures.
Consequently, low levels of fluoxetine (and other pharmaceuticals and personal-care
products) have been found in treated sewage effluent, sediment, surface waters, and city
water supplies [9]. Although present in the environment at concentration in the ng/l
range[10], numerous aquatic species including fish have been found to contain detectable
amounts of fluoxetine [11].
Fluoxetine exposure has also been shown to affect various aspects of behavior in
aquatic organisms. Studies have shown that exposure to antidepressants can trigger
premature spawning in fingernail clams (Sphaerium striatinum) [12], and zebra mussels
(Dreissena polymorpha) [13], decreased fecundity in Cerodaphnia dubia [14], decreased
growth in algae (Pseudokirchneriella subcapitata) [14] and decreased growth and feeding
rates in fathead minnows (Pimephales promelas) [15].
Assessing the human risk of pharmaceuticals in waters is a high priority;
however, the impacts of these drugs on aquatic organisms and communities are also
important [7, 9]. A better understanding of toxicological effects of contaminants can be

58
achieved by integrating behavioral indicators of toxicology with those of other levels [3].
The gol of this study was to (1) determine the effects of waterborne fluoxetine on the
feeding behavior of hybrid striped bass (Morone saxatilis x M. chrysops); and (2)
correlate these changes with changes in brain serotonin levels at various time points of
exposure and recovery. Fish are an excellent model for studying effects of environmental
pollutants because many ecologically relevant fish behaviors are easily observed and
quantified in controlled settings [3]. Feeding behavior was chosen because our previous
research demonstrated that changes in this behavior were quantitatively related to
neurotoxin exposure and neurotransmitter concentrations [16]. Bass were monitored
during a six-day exposure period followed by an additional six days in clean water to
observe any latent effects of exposure that may not otherwise be identified at the end of
the exposure period. This also allowed us to look at the sensitivity of both biochemical
and behavioral endpoints and how these endpoints changed during recovery. Fluoxetine
concentrations were tested at levels greater that those found in the environment in order
to more clearly quantify potential impacts of fluoxetine on fish brain monoamines and
feeding behavior.
Materials and Methods
Test chemicals
Fluoxetine hydrochloride, was generously donated by Fermion (Finland).
Perchloric acid, aqueous (0.1 N), was purchased from VWR (USA). Methanol, acetone,
triethylamine, acetolnitrile, glacial acetic acid, monochloro-acetic acid, and
tetrahydrofuran were purchased from Fisher Scientific (USA). Sodium hydroxide,

59
sodium octyl sulfate, ethylenediaminetetraacetic acid (EDTA) disodium salt, 5-
hydroxyindole-3-acetic acid (5-HIAA), and serotonin creatinine sulfate monohydrate (5-
HT) were purchased from Sigma-Aldrich (USA).
Fish
Hybrid striped bass (Morone saxatilis x M. chrysops) were obtained from
Southland Fisheries near Columbia, SC. Fish were housed in 450 L circular flow-
through holding tanks at Clemson University‟s Institute of Environmental Toxicology
and fed a pellet food (Zeigler Brothers, Gardners, PA) daily. Larval fathead minnows
(Pimephales promelas) were obtained from a culture maintained at Clemson University
Institute of Environmental Toxicology and reared until they were the appropriate size (~4
cm) to be used in the tests.
Experimental design
Hybrid striped bass were exposed to fluoxetine for 6 days under static conditions,
followed by a 6-day recovery period (water flow was turned back on at a rate of 0.23
liters per minute), for a total of 12 days. Fish were fed on days 0, 3, 6, 9, and 12 and
feeding behavior was quantified. Fish brains were extracted for monoamine analysis at
the end of each test (see below). Hence, four tests conducted for 3, 6, 9, or 12 days in
which bass were fed every third day and brains were harvested at the end of each test.
Hybrid striped bass (average weight: 163.4 + 27.4 g; average length: 21.5 + 1.2
cm) were randomly placed individually into twenty-four 80-L aquaria operated under
flow-through conditions (0.23 liters per minute). Bass were allowed to acclimate for
seven days prior to test initiation. A nearby lake, Lake Hartwell (SC, USA), was the
60
source of test waters (pH = 6.28 + 0.17, Hardness 24 mg/L as CaCO3, Alkalinity 10 mg/L
as CaCO3). Water was pumped through a multi-resin filtration system (Water and Power
Technologies, Columbia, SC) to remove suspended solids prior to entering experimental
tanks. Water temperature was controlled using a mixing valve (M & M Control Services,
Grayslake, IL) that regulated a mixture of ambient and chilled water (ambient water
circulated through an in-line chiller) or heated water (ambient water circulated through an
in-line heater) depending on the ambient conditions (summer or winter months,
respectively) to facilitate achieving a desired temperature of about 25C (23.8 +1.07 C).
Bass were fed four fathead minnows every third day during the acclimation
period. This feeding regime ensured the bass were hungry and were accustomed to
eating live minnows. Bass were fed on days 1, 4, and 7 of the acclimation period so that
the last day of acclimating coincided with day 0 of the fluoxetine exposure. Feeding
behavior (time to capture prey) of hybrid striped bass was quantified every third day
during the test as well.
Prior to feeding, air stones were removed from each tank at each time point, and
water flow was turned off during the recovery period. Four fathead minnows were
dropped into an exposure tank and the time to eat each prey was recorded. Minnows used
in the tests were visually estimated to be 4 cm. Minnows of similar size were pre-
selected prior to feeding to ensure that no extremely large or small minnows were used to
skew appetite satiation. Minnows were then randomly selected and fed to bass without
regard to treatment. Bass that did not eat all four minnows prior to exposure initiation
were eliminated from the test to reduce any confounding factors. Bass were observed
61
until all minnows were consumed or for a maximum of 25 minutes. Any uneaten
minnows after 25 minutes were removed from the tank. For statistical purposes, uneaten
minnow was assigned a value of 1500 seconds (25 minutes).
Fluoxetine exposure
Treatments of four nominal fluoxetine concentrations (0, 35, 75, 150 µg/l) were
conducted with five replicate tanks per treatment. At test initiation, water flow was
turned off and an appropriate quantity of fluoxetine stock dissolved in methanol was
added to each aquarium. One concentrated stock solution of fluoxetine was prepared for
all tanks in order to reduce tank-to-tank variability within treatments. Final methanol
volume did not exceed 1,000 µl in 80 L of water. The toxicity of methanol to fish has
been shown to be greater than 15, 000 mg/l [17], and the ASTM standard guide for
conducting early life-stage toxicity tests with fishes (ASTM E1241-92) allows methanol
as a carrier solvent at concentrations not to exceed 0.1 mg/l. In our experimental setup,
methanol concentrations did not exceed 0.01 mg/l.
Test waters were allowed to equilibrate for 1-2 hours prior to taking 250 ml water
samples for fluoxetine analysis. These water samples were acidified to pH ~2.5 before
being filtered through 6 ml C18 solid phase extraction columns (PrepSep™, Fisher
Scientific, USA) that were preconditioned with 6 ml acetone, 6 ml methanol, and 6 ml
deionized water. Extraction columns were dried for at least 30 minutes at room
temperature on a vacuum manifold (JT Baker, Philipsburg, NJ) before eluting fluoxetine
with methanol/1% acetic acid. Control, low, and medium fluoxetine treatment samples
were diluted to 5 ml in methanol/1% acetic acid, while the high concentration samples

62
were diluted to 10 ml. Samples were stored at -20C until analyzed by HPLC-
fluorescence.
Fluoxetine half-life was previously determined to be approximately 72 hours
under test conditions. Therefore, waters were spiked with half original fluoxetine
concentration on day 3 of exposure period. Water samples for fluoxetine analysis were
taken on day 0, day 3 after spiking waters, and day 6 at the end of the exposure.
Fluoxetine analysis
Aqueous fluoxetine concentrations were determined on a Waters 1525 Breeze
HPLC pump with a Waters 717 Plus autosampler and Waters 2475 multi-wavelength
fluorescence detector (Waters, Milford, MA). Mobile phase was composed of 350 ml
acetonitrile, 650 ml water, and 4 ml triethylamine. Mobile phase was adjusted to pH 4
with glacial acetic acid. Flow rate was set at 1 ml/min for a 40 µl injection, and the
Alltech Prevail C18 column (150 mm, 4.66 I.D.) was set at 30C. Fluorescence detector
was set at 230 nm Ex/ 310 nm Em. Run time per sample was approximately 18 minutes.
Brain tissue preparation
Bass were euthanized in buffered MS-222 and brains were quickly removed and
put on dry ice prior for storage at -80C until processed. Brains were thawed,
homogenized for 20 seconds by ultrasonic disruption in 1.0 ml 0.1N perchloric acid
containing 0.2 pg/µl DHBA as the internal standard. Homogenates were then centrifuged
at 21,000 rpm and 4C for 20 minutes to remove cellular debris. Supernatant was stored
at -80C until used for bioassays.

63
Protein assay
Protein concentrations were determined using a BCA™ Protein Assay Kit (Pierce,
Rockford, IL, USA). Brain homogenates were diluted 1:4 in 0.1N perchloric acid prior to
running the assay. Brain monoamine levels were normalized using protein
concentrations.
Monoamine analysis
Brain samples were analyzed via HPLC with an electrochemical detector with
methods modified from Lin and Pivorun [22]. The chromatographic system consisted of
a Bioanalytical System LC-4C amperometric detector, PM-80 pump, and a C18 reverse-
phase column (ODS-2 Hypersil 250 mm x 4.6 mm). Aliquots of 30 µl were injected into
the sample loop (20 µl) of a rotary injection valve. Flow rate was 1.0 ml/min, with the
electrode potential maintained at +0.8 volts versus Ag/AgCl. Mixed monoamine
standards was prepared with NE, DA, 5-HIAA, and 5-HT ranging from 150 pg/µg to 10
pg/µg in 0.1N perchloric acid. Each standard also contained 50 pg/µl DHBA as the
internal standard. Each sample run took 35 minutes.
The mobile phase consisted of 14.2 g monochloroacetic acid, 4.7 g sodium
hydroxide, 10.0 mg disodium EDTA, 150 mg sodium octyl sulfate dissolved in 967 mL
Milli-Q water with 15 ml of methanol and 18 ml of tetrahydrofuran. The mobile phase
was filtered through a 0.45 µm white nylon Millipore filter before adding methanol and
tetrahydrofuran. The mobile phase was degassed via sonication prior to use.
64
Data analysis
Data for time to capture prey was analyzed using Statistical Analysis Software 9.1
(SAS; Cary, NC, USA) with two-factor ANOVA (analysis of variance) models utilizing
treatment and day as the independent variables. Since the time to capture prey data were
non-normally distributed with non-homogeneous variances, PROC GLIMMIX (General
Linear Model for Mixture Distributions), an analyses matrix that accounts for non-
normality and non-homogeneous variances, was used to perform multiple pair-wise
comparisons. The LSMEANS statement in PROC GLIMMIX was used to differentiate
statistical differences across and within treatment, day, and treatment-by-day interactions.
Monoamine analyses were also performed using two-factor ANOVA models
utilizing treatment and day as the independent variables. Although monoamine data were
normally distributed with homogeneous variance, PROC GLIMMIX with LSMEANS
statement was executed to differentiate statistical differences among and within the
independent variables (treatment, day, and the treatment-by-day interaction terms) rather
than separate LSMEANS statements within PROC GLM (ANOVA analyses) by day or
treatment. An = 0.05 was used with both time to capture prey and monoamine analyses
when examining statistical significance of factors using PROC ANOVA and PROC
GLIMMIX.
Results
Fluoxetine concentrations
Measured fluoxetine concentrations were approximately 67% of the nominal
concentrations most likely due to photolysis, and some sorption to debris in aquaria.

65
Extraction efficiencies were 90-100% (data not shown). Measured concentrations (mean
± standard deviation) throughout the exposure period for the low (35 µg/l), medium (75
µg/l) and high (150 µg/l) treatments were 23.2 ± 6.6, 51.4 ± 10.9, and 100.9 ± 18.6 µg/l,
respectively.
5-HT levels
Brain serotonin levels in low, medium, and high fluoxetine treatments decreased
as exposure time increased (Table 1), with maximum depression occurring on day 9 (3
days post exposure). Serotonin levels were depressed 23.7, 28.0, and 49.1% by day 9 in
the low, medium, and high treatments, respectively. The low fluoxetine treatment was
not significantly different from controls until 3 and 6 days post exposure on days 9 and
12, respectively. Bass in the medium and high treatment groups exhibited significantly
depressed serotonin levels at all time points past day 0. Serotonin levels in all treatments
began to increase during the recovery period between days 9 and 12. Serotonin in the
high treatment decreased significantly between days 6 and 9 with a corresponding
increase during the recovery period between days 9 and 12. None of the fluoxetine
treated bass recovered completely to control serotonin levels.
To determine the 6-d EC50 for serotonin depression, serotonin levels and
fluoxetine concentrations were plotted and 50% effect concentrations were calculated
using the polynomial equation. The estimated 6-d EC50 was 24.0 µg/L (Figure 3.1).
5-HIAA Levels
5-HIAA levels were significantly depressed as a result of fluoxetine exposure in
all treatment groups (Table 1). On days 3 and 9 (3 days post exposure), all fluoxetine
66
treatments were significantly different from controls, but not from each other. On day 6,
all treatments were significantly different from controls, and the high treatment group
was significantly lower than low and medium treatments. On day 12 however (6 days
post exposure), while all treatments were significantly different from controls, 5-HIAA
levels in the high treatment increased dramatically so that they were significantly greater
than low and medium treatment groups.
5-HIAA:5-HT ratio
Both serotonin and 5-hydroxyindoleacetic acid were depressed as a result of
fluoxetine exposure. Further, the ratio of 5-HIAA:5-HT was significantly lower in all
treatment groups as compared to controls on day 3 (Table 1). On day 6, low and high
treatment groups were significantly different from controls, yet they were not
significantly different from the medium treatment. On day 9, only the high treatment
group was significantly different than controls, due to both continual declines in 5-HT
and spikes in 5-HIAA levels. The low fluoxetine group was the only treatment
significantly lower than controls at the end of the test on day 12.
Behavior Data: Exposure/Recovery Effects
On day 0, behavior data was recorded prior to initial fluoxetine exposure.
There were no significant differences among treatment groups. In the low treatment
group, there was a concentration- and duration-dependent effect of fluoxetine on time to
capture prey (Figure 3.2). Time to eat increased significantly between capturing the first
and second prey fish in the low treatment. By day 12, the sixth day of recovery, time to
capture prey decreased to levels comparable to control levels. In the medium treatment,
67
time to capture prey was significantly different from controls at all time points, with the
exception of time to capture prey one on day 12 (Figure 3.2a). Time to capture prey
decreased as recovery time increased. In the high treatment, time to capture prey
increased through day 12 for the first prey fish, and through day 9 for the second and
third prey fish (Figures 3.2b and 3.2c). See Appendix Table A-2 for mean ± SE values
for time to capture prey for each treatment and day.
Discussion
SSRIs inhibit 5-HT transporters within minutes, yet it is only after a few weeks of
treatment that they exert their full antidepressant effect [19-21]. Therefore, it is the
adaptive changes of the 5-HT-containing neurons and receptors that underlie their
therapeutic effect, not just the inhibition of 5-HT transporters [19]. Serotonin-containing
neurons are endowed with somatodendritic 5-HT1A autoreceptors that exert a negative
feedback influence on their firing activity [19]. During prolonged SSRI treatment the 5-
HT1A autoreceptors may become desensitized, thus explaining the recovery of normal
firing activity of 5-HT-containing neurons [19, 22]. Chronic treatment with SSRIs cause
antidepressant effects (a rise in 5-HT concentrations in the terminal region), but acute
treatment may not [23]. For example, a two-day treatment with SSRIs decreased the
firing activity of 5-HT-containing neurons, but a two-week treatment resulted in neurons
progressively regaining their normal firing activity [19].
The results from our study may suggest that 5-HT1A autoreceptors were activated,
resulting in a decreased release of serotonin in hybrid striped bass following a 6-day
fluoxetine exposure. Serotonin levels in fluoxetine treated bass were decreasing with

68
increasing exposure duration to fluoxetine (Table 1). It could be hypothesized that if bass
in our study were exposed for longer durations, serotonin levels as well as time to capture
prey would recover to control levels as a result of the delayed enhancement of 5-HT-
mediated transmission following prolonged fluoxetine treatments. This underscores the
need for chronic studies since freshwater organisms are likely to be exposed to low levels
of fluoxetine over long periods of time.
Following the release of serotonin into the synapse, it continues to stimulate pre-
and post-synaptic receptors until it is either taken back up by the presynaptic neuron for
reuse, or it is metabolized to 5-hydroxyindoleacetic acid (5-HIAA) by monoamine
oxidase [24] in the presynaptic neuron or synaptic cleft. Serotonin turnover is often
reported as the ratio of 5-HIAA:5-HT. While it is possible that treatment with SSRIs can
increase the ratio due to the decrease in the reuptake of serotonin, and thus metabolism by
monoamine oxidases, it has also been shown that stress could increase the 5-HIAA:5-HT
ratio, due to increased 5-HIAA levels [25]. However, in the present study, both 5-HIAA
and 5-HT levels were reduced in the whole brains of hybrid striped bass exposed to
fluoxetine. Betta splendens also exhibited declines in 5-HT in the forebrain and 5-HIAA
in the forebrain and hindbrain following 14 daily i.p. injections of fluoxetine (4.3 mmol),
resulting in a significant reduction in serotonergic activity (5-HIAA:5-HT) in the
hindbrain [26]. Yet there were no changes in their aggression. In the present study, 5-HT
levels decreased in a dose-dependent manner (Figure 3.1) and 5-HIAA levels decreased
with no clear dose-dependent relationship in hybrid striped bass. As a result, we saw a
decrease in the 5-HIAA:5-HT ratio during fluoxetine exposures.
69
Although serotonin levels continued to decrease three days into the recovery
period (day 9), 5-HIAA levels in all treatments increased between days 6 and 9 (Table 1),
with 5-HIAA levels increasing significantly in the high treatment. This resulted in a
spike in the 5-HIAA : 5-HT ratio in bass in the high treatment, rather than a gradual
increase in the ratio (Table 1). By day 12, the sixth day of recovery, 5-HIAA levels in
the high treatment increased to levels that were significantly greater than the low and
medium treatment groups. However recovery of 5-HIAA to control levels had not
occurred by day 12 in any treatment.
It has also been shown that food deprivation may increase brain 5-HIAA levels in
mammals due to an increased synthesis and metabolism of serotonin [27]. It may be
possible that high exposures to fluoxetine, which is effective in decreasing appetite, may
have contributed to the sharp increase in 5-HIAA levels seen in bass in the high treatment
group between days 6 and 9. In the present study, bass in the high fluoxetine treatment
took significantly longer to eat the first and second prey fish as compared to the other
treatment groups. They did not eat as many, if any, minnows as compared to the other
treatment groups during the exposure and recovery periods. The decreased time to eat
exhibited by fish in the low and medium treatments was not seen in the high treatment
during the recovery period. (Figures 3.2a and 3.2b). This reduction in food consumption
is consistent with reports of suppressed appetite with SSRI treatment [28, 29]. However,
fluoxetine elicits this anorexic effect as a result of increased levels of extracellular 5-HT
[24, 29, 30], not a decrease in 5-HT levels as seen in our study. We saw a strong
negative relationship between serotonin levels and time to capture prey (Figure 3.3).

70
One explanation for the reduced serotonin levels into the recovery period could be
that a reduced energy intake (i.e. reduced feeding) can also significantly reduce 5-HT
concentrations in the brain [24]. Bass in all treatments had lower serotonin levels into the
recovery period, but bass in the high treatment showed significantly lower serotonin on
day 9 (day 3 of recovery) than the other treatments. This could be the result of the bass
not eating nearly as many minnow, thus further reducing energy intake.
Another suggestion for the continued decrease in serotonin levels three days into
the recovery period (day 9) could be latent effects of fluoxetine. The half-live of
fluoxetine has been reported as one to four days in mammals and we should be able to
apply this concept to fish [31] since fish have been shown to have high levels of sequence
identity for serotonin transporter protein and 5-HT1A receptors genes when compared to
humans, rodent, and bovine [32, 33].
Supporting the results of the present study, juvenile Pimephales promelas (1-250
µg/l) feeding rates were reduced in a dose dependent manner following a 7-day
waterborne fluoxetine exposure. On the other hand, grazing rates of Daphnia magna
increased with fluoxetine concentrations following a 21-day chronic toxicity test (10-
1000 µg/l), though not significantly [15]. This may be the result of desensitized 5-HT1A
autoreceptors following an extended exposure duration as discussed earlier.
Unfortunately, they did not measure brain serotonin levels to correlate these changes in
behavior with biochemical changes. Due to the critical role of serotonin, and the
potential for SSRIs to alter an organism‟s ecological fitness, linking measured

71
biochemical levels with behavioral changes is important when assessing the impacts of
pharmaceuticals on aquatic organisms.
In vertebrates, chronically increased serotonin levels can decrease aggression,
resulting in subordinate males having higher serotonergic activity [26, 34]. Clements
and Schreck [35] noted a decrease in locomotor activity in Chinook salmon
(Oncorhynchus tshawytscha) following daily 2.5 mg/kg i.p. fluoxetine injections for 10
days as compared to the saline control. Male bluehead wrasse (Thalassoma bifasciatum)
injected with fluoxetine daily for 14 days (6 µg/g/day) also exhibited significantly
decreased aggression [36]. Even though changes in serotonin levels were not measured,
Semsar et al. [36] implied that serotonin levels increased in a dose-dependent manner due
to the mode of action of fluoxetine and the behaviors observed. However, results from
our study contradict this belief since we saw decreased feeding rates accompanied by
decreased whole-brain serotonin levels.
In the present study, bass exposed to high fluoxetine concentrations were
observed maintaining their position at the top of the water surface rather than the bottom
of the tank like control bass, sometimes with their dorsal fin out of the water. They were
also noted to maintain a vertical position in the aquaria; these behaviors persisted
throughout both the exposure and recovery periods. Mosquitofish (Gambusia affinis)
exposed to fluoxetine have also shown abnormal behavior compared to unexposed fish
including changing position in the water column so that they were closely associated with
the water surface and tended to lay on their sides with little or no swimming movements
[37]. Although concentrations used in the present study are above those found in the

72
environment (typically less than 0.1 µg/l [10]), effects of this nature could have
detrimental effects on an organism in the presence of predators.
Behavioral data are useful as predictive indices of population and community-
level effects because disruption of essential functions such as predator-prey relationships
can become ecologically apparent through population changes when enough individuals
are affected [2]. Feeding behavior is crucial for the development, fitness, and long-term
viabiliy of an organism and is clearly relevant to the assessment of environmental
stressors such as sublethal contaminant exposure [2]. Serotonin has been shown to have
a crucial role in many aspects of behavior and biochemical processes. Laboratory studies
have shown contradictory results in different species [38]. However, although species
sensitivity may be a major contributing factor, concentration, duration, and route of
exposure may be just as important. In the present study, there was a dose-dependent
response between serotonin levels and fluoxetine concentrations (Figure 3.1) as well as a
strong linear relationship between serotonin levels and feeding behavior in bass (Figure
3.3). This linear response was contrary to the non-linear relationship between feeding
behavior and brain acetylcholinestrease (AChE) activity in hybrid striped bass exposed to
diazinon [16]. AChE activity could be inhibited at concentrations significantly lower
than those needed to change behavior. This suggests that there may be excess AChE
activity and that bass feeding behavior is not affected until enzyme activity is inhibited by
greater than 60%. Results of the present research demonstrate that behavior changes as
soon as serotonin levels decrease. These results underscore the use of serotonin as a

73
biomarker of fluoxetine exposure as well as a biomarker of effect that signals
compromised ecological fitness.
References
1. Zala SM, Penn DJ. 2004. Abnormal behaviours induced by chemical pollution: a
review of the evidence and new challenges. Anim. Behav. 68, 649-664.
2. Little EE. 2002. Behavioral measures of environmental stressors in fish. In:
Adams, S.M. (Ed.). Biological Indicators of Aquatic Ecosystem Stress. American
Fisheries Society. Bethesda, Md., pp. 431-472.
3. Scott GR, Sloman KA. 2004. The effects of environmental pollutants on complex
fish behaviour: integrating behavioural and physiological indicators of toxicity.
Aquat. Toxicol. 68:369-392.
4. Barton BA, Morgan JD, Vijayan MM. 2002. Physiological and condition-related
indicators of environmental stress in fish. In: Adams, S.M. (Ed.). Biological
Indicators of Aquatic Ecosystem Stress. American Fisheries Society. Bethesda,
Md., pp. 111-148.
5. Fent K, Weston AA, Caminada D. 2006. Ecotoxicology of human
pharmaceuticals. Aquat. Toxicol. 76:122-159.
6. Brooks BW, Foran CM, Richards SM, Weston J, Turner PK, Stanley JK,
Solomon KR, Slattery M, LaPoint TW. 2003. Aquatic ecotoxicology of
fluoxetine. Toxicol. Lett. 142:169-183.
7. Bendz D, Paxéus NA, Ginn TR, Loge FJ. 2005. Occurrence and fate of
pharmaceutically active compounds in the environment, a case study: Höje River
in Sweeden. J. Hazard. Mater. 122(3):1995-204.
8. Halling-Sørensen, B, Nors Nielsen S, Lanzky PF, Ingerslev F, Holten Lützhøft
HC, Jørgensen SE. 1998. Occurrence, fate, and effects of pharmaceutical
substances in the environment – a review. Chemosphere 36(2):357-393.
9. Dove A. 2006. Drugs down the drain. Nat. Med. 12:376-377.
10. Koplin DQ, Furlong ET, Meyer MT, Thurman EM, Zaugg SD, Barber LB,
Buxton HT. 2002. Pharmaceuticals, hormones, and other organic wastewater
contaminants in U.S. streams, 199-2000: a national reconnaissance. Environ. Sci.
Technol. 36:1202-1211.

74
11. Brooks BW, Chambliss CK, Stanley JK, Ramirez A, Banks KE, Johnson RD,
Lewis RJ. 2005. Determination of select antidepressants in fish from an effluent-
dominated stream. Environ. Toxicol. Chem. 24(2):464-469.
12. Fong PP, Huminski PT, D‟Urso LM. 1998. Induction and potentiation of
parturition in fingernail clams (Sphaerium striatinum) by selective serotonin re-
uptake inhibitors (SSRIs). J. Exp. Zool. 280:260-264.
13. Fong PP. 1998. Zebra mussel spawning is induced in low concentrations of
putative serotonin reuptake inhibitors. Biol. Bull. 194:143-149.
14. Brooks BW, Turner PK, Stanley JK, Weston JJ, Glidewell EA, Foran CM,
Slattery M, LaPoint TW, Huggett DB. 2003. Waterborne and sediment toxicity of
fluoxetine to select organisms. Chemosphere 52:135-142.
15. Stanley JK, Ramirex AJ, Chambliss CK, Brooks BW. 2007. Enantiospecific
sublethal effects of the antidepressant fluoxetine to a model aquatic vertebrate and
invertebrate. Chemosphere 69:9-16.
16. Gaworecki KM, Roberts AP, Ellis N, Sowers AD, Klaine SJ. 2008. Biochemical
and behavioral effects of diazinon exposure in hybrid striped bass. (Envrion.
Toxicol. Chem. in press)
17. Kaviraj A, Bhunia, F, Saha NC. 2004. Toxicity of methanol to fish, crustacean,
oligochaete worm, and aquatic ecosystem. Int. J. Toxicol. 23:55-63.
18. Lin L-H, Pivorun E.B. 1990. Hypothalamic monoamines and their metabolites in
the deermouse, Peromyscus maniculatus, during daily torpor. J. Neural. Transm.
79:11-18.
19. Blier P, de Montigny D. 1994. Current advances and trends in the treatment of
depression. Trends in Pharmacol. Sci. 15:220-226.
20. Dawson LA, Nguyen HQ, Smith DI, Schechter LE. 2000. Effects of fluoxetine
treatment in the presence and absence of ()pindolol: a microdialysis study. Br. J.
Pharmacol. 130:797-804.
21. Le Poul E, Boni C, Hanoun N, Laporte A, Laaris N, Chauveau J, Hamon M,
Lanfumey L. 2000. Differential adaptation of brain 5-HT1A and 5-HT1B receptors
and 5-HT transporter in rats treated chronically with fluoxetine.
Neuropharmacology 39:110-122.
75
22. Le Poul E, Laaris N, Doucet E, Laporte AM, Hamon M, Lanfumey L. 1995. Early
desensitization of somato-dendritic 5-HT1A autoreceptors in rats treated with
fluoxetine or paroxetine. Naunyn-Schmiedeberg's Arch. Pharmacol. 352:141-148.
23. Invernizzi R, Bramante M, Samanin R. 1994. Chronic treatment with citalopram
facilitates the effect of a challenge dose on cortical serotonin output: role of
presynaptic 5-HT1A receptors. Eur. J. Pharmacol. 260:243-246.
24. Halford JCG, Harrold JA, Lawton CL, Blundell JE. 2005. Serotonin (5-HT)
drugs: effects on appetite expression and use for the treatment of obesity. Curr.
Drug Targets 6:201-213.
25. Winberg S, Nilsson GE, Olsen KH. 1992. The effects of stress and starvation on
brain serotonin utilization and starvation on brain serotonin utilization in arctic
charr (Salvelinus alpinus). J. Exp. Biol. 165:229-239.
26. Clotfelter ED, O‟Hare EP, McNitt MM, Carpenter RE, Summers CH. 2007.
Serotonin decreases aggression via 5-HT1A receptors in the fighting fish Betta
splendens. Pharmacol. Biochem. Behav. 87:222-231.
27. Feunmayor LD, Garcia S. 1984. The effect of fasting on 5-hyddroxytryptamine
metabolism in brain regions of the albino rat. Br. J. Pharmac. 83:357-362.
28. Blundell JE, Lawton CL, Halford JCG. 1995. Serotonin, eating behavior, and fat
intake. Obesity Res. 3(Suppl.4): 471s-476s.
29. Li DL, Simmons RMA, Iyengar S. 1998. 5HT1A receptor antagonists enhance the
functional activity of fluoxetine in a mouse model of feeding. Brain Res. 781:121-
128.
30. Carlini VP, Gaydou RC, Schioth HB, de Barioglio SR. 2007. Selective serotonin
reuptake inhibitor (fluoxetine) decreases the effect of ghrelin on memory retention
and food intake. Regul. Peptides 140:65-73.
31. Nakamura Y, Yamaoto H, Sekizawa J, Kondo T, Hirai N, Tatarazako N. 2008.
The effects of pH on fluoxetine in Japanese medaka (Oryzias latipes): acute
toxicity in fish larvae and bioaccumulation in juvenile fish. Chemosphere 70(5)
:865-873.
32. Airhart MJ, Lee DH, Wilson TD, Miller BE, Miller MN, Skalko RG. 2007.
Movement disorders and neurochemical changes in zebrafish larvae after bath
exposure to fluoxetine (PROZAC™). Neurotoxicol. Teratol. 29:652-664.

76
33. Yamaguchi F, Brenner S. 1997. Molecular cloning of 5-hydroxytryptamine (5-
HT) type 1 receptor genes from the Japanese puffer fish, Fugu rubripes. Gene
191:219-223.
34. Perreault HAN, Semsar K., Godwin J. 2003. Fluoxetine treatment decreases
territorial aggression in a coral reef fish. Physiol. Behav. 79:719-724.
35. Clements S, Schreck CB. 2007. Chronic administration of fluoxetine alters
locomotor behavior, but does not potentiate the locomotor stimulating effects of
CRH in juvenile Chinook salmon (Oncorhynchus tshawytscha). Comp. Biochem.
Physiol. A 147:43-49.
36. Semsar K, Perreault HAN, Godwin J. 2004. Fluoxetine-treated male wrasses
exhibit low AVT expression. Brain Res. 1029:141-147.
37. Henry TB, Black MC. 2008. Acute and chronic toxicity of fluoxetine (selective
serotonin reuptake inhibitor) in western mosquitofish. Arch. Environ. Contam.
Toxicol. 54:325-330
38. Foran CM, Weston J, Slattery M, Brooks BW, Huggett DB. 2004. Reproductive
assessment of Japanese medaka (Oryzias latipes) following a four-week
fluoxetine (SSRI) exposure. Arch. Environ. Contam. Toxicol. 46:511-517.

77
Monoam
ine
Tre
atm
ent
Day
0D
ay 3
Day
6D
ay 9
Day
12
Contr
ol
30.6
2 ±
1.4
6a
30.6
6 ±
2.3
1a
30.0
4 ±
0.5
1ab
c30.2
1 ±
1.3
4ab
29.7
7 ±
1.2
9ab
c
Low
30.6
2 ±
1.4
6a
26.5
0 ±
2.4
2c
25.9
8 ±
1.0
4cd
e23.0
5 ±
1.1
7ef
g24.9
7 ±
2.1
3ef
g
Med
ium
30.6
2 ±
1.4
6a
25.6
7 ±
1.2
4d
22.9
7 ±
1.6
4g
21.7
4 ±
1.6
6g
23.2
9 ±
0.9
6ef
g
Hig
h30.6
2 ±
1.4
6a
21.9
6 ±
0.8
0f
21.7
1 ±
1.1
3g
15.3
7 ±
0.8
6h
22.8
4 ±
1.1
8ef
g
Contr
ol
14.0
6 ±
0.9
5cd
16.7
2 ±
1.6
7ab
14.7
0 ±
1.0
5bc
16.0
9 ±
1.4
5ab
18.1
3 ±
0.4
8a
Low
14.0
6 ±
0.9
5bc
9.9
1 ±
1.0
7ef
gh8.4
2 ±
0.5
5fg
h10.1
5 ±
0.5
2ef
gh11.1
1 ±
0.5
4def
g
Med
ium
14.0
6 ±
0.9
5bc
8.9
7 ±
0.7
1gh
9.0
0 ±
0.5
5gh
11.3
5 ±
1.1
2def
11.8
4 ±
0.9
7de
Hig
h14.0
6 ±
0.9
5bc
8.4
1 ±
0.3
9hi
6.3
5 ±
0.6
3i
12.0
7 ±
1.1
4cd
e14.4
9 ±
0.9
1bc
Contr
ol
0.4
6 ±
0.0
4cd
e0.5
5 ±
0.0
5ab
c0.4
9 ±
0.0
4ac
e0.5
3 ±
0.0
3ab
c0.6
1 ±
0.0
2ab
Low
0.4
6 ±
0.0
4ac
de
0.3
8 ±
0.0
5def
0.3
2 ±
0.0
2df
0.4
5 ±
0.0
4cd
e0.4
5 ±
0.0
2cd
e
Med
ium
0.4
6 ±
0.0
4ac
de
0.3
5 ±
0.0
3def
0.4
2 ±
0.0
3cd
ef0.5
3 ±
0.0
5ab
c0.5
2 ±
0.0
5ac
Hig
h0.4
6 ±
0.0
4ac
de
0.3
9 ±
0.0
2def
0.2
9 ±
0.0
2f
0.8
1 ±
0.1
2g
0.6
5 ±
0.0
7b
Bra
in M
onoam
ine
(pg/
µg
pro
tein
)
5-H
T
5-H
IAA
5-H
IAA
:5-H
T

78
Table 3.1: Serotonin (5-HT) and 5-hydroxyindoleaceteic acid (5-HIAA) levels (mean ±
SE) in hybrid striped bass brains (pg/µg protein), and 5-HIAA:5-HT ratios following a 6-
day fluoxetine exposure followed by a 6-day recovery period. a through i denotes
significant differences among treatment and day for each. (On previous page)

79
Figure 3.1. Day 6 serotonin (5-HT) levels as a function fluoxetine concentration. The
estimated 6-day EC50 was 24.0 µg/l.

80
Figure 3.2. Time (mean ± SE) it took hybrid striped bass to capture the first (A) first, (B)
second, and (C) third prey fish during as 6-day fluoxetine exposure followed by a 6-day
recovery period. The vertical line at day 6 signifies the end of the exposure period and
beginning of the recovery period. Means with the same letter are not significantly
different from each other.
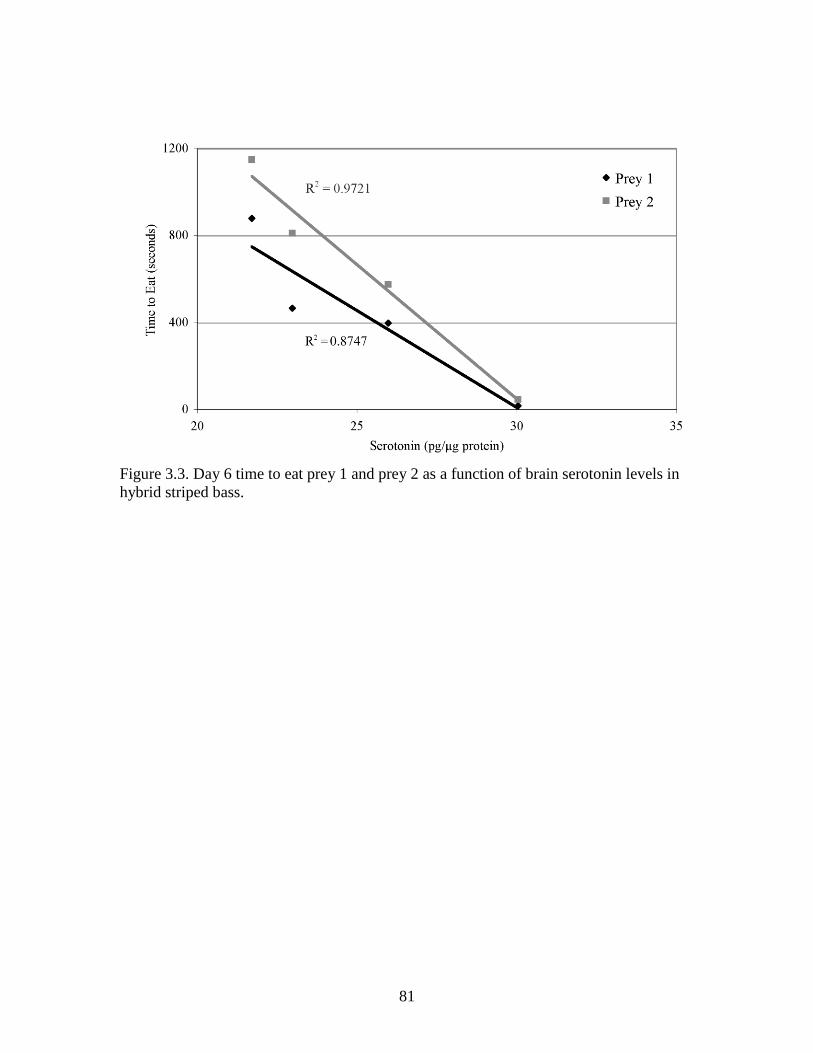
81
Figure 3.3. Day 6 time to eat prey 1 and prey 2 as a function of brain serotonin levels in
hybrid striped bass.

82
CHAPTER 4: LONG-TERM FLUOXETINE EXPOSURE: BEHAVIORAL AND
BIOCHEMICAL EFFECTS
Abstract
Research conducted has shown that pharmaceuticals present in aquatic
environments can alter behavior in aquatic organisms. Previous work in our lab has
shown that short-term exposure to fluoxetine, a selective serotonin reuptake inhibitor,
alters serotonin levels and feeding behavior in hybrid striped bass (Morone saxatilis x M.
chrysops). The current study characterized effects of long-term fluoxetine exposure on
hybrid striped bass. Bass were exposed to fluoxetine (0, 0.1, 1.0, and 10 µg/L) for 27
days. Time to capture prey, Pimephales promelas, was measured every third day and
brain serotonin levels were measured on days 0, 6, 12, 21, and 27. 5-Hydroxyindoleacetic
acid (5-HIAA), norepinehrine, and dopamine levels were also monitored at these times.
There were no clear concentration- or exposure duration-dependent changes in feeding
behavior, norepinephrine levels, or dopamine levels. While there was no clear dose-
response in serotonin levels, there was a significant decrease in 5-HIAA levels in bass in
the 10 µg/L fluoxetine treatment as compared to controls. These results suggest that
environmentally relevant fluoxetine concentrations do not significantly affect serotonin
levels or feeding behavior in hybrid striped bass.
Introduction
A diverse number of pharmaceuticals are produced and used in large quantities
around the world both for human and animal consumption (Bound and Voluvoulis,
2004). They are absorbed by an organism after intake and are subject to metabolic
83
reactions, but metabolism and elimination rates largely depend on the individual, the
drug, and the dose. Sometimes, large proportions (up to 90%) of these drugs can leave
the body unmetabolized and make their way into wastewater treatment plants (WWTPs)
[1, 2]. Many of these drugs are polar, escape sedimentation, and resist biological
treatment in WWTPs [3]. Recent studies have found that the incomplete removal of
these compounds during the treatment process results in the discharge of these drugs into
the aquatic environment [3, 4].
The US Food and Drug Administration (FDA) has been regulating
pharmaceuticals in the environment in the USA since 1977 through the environmental
review process for New Drug Applications that are submitted. When a new drug is
proposed for market, FDA requires risk assessments to estimate concentrations that could
be found in the environment as a result of excretion. If this concentration is less than 1
µg/l, the drug is assumed to pose acceptable risk [5, 6]. As a result, the FDA has never
turned down a proposed new drug based on estimated environmental concentrations, but
no actual testing is conducted after a drug is marketed to see if the estimation was correct
[6]. Nevertheless, some small streams are dominated by WWTP effluent and have been
found to contain pharmaceutical concentrations exceeding 1 µg/l [7]. Unfortunately, US
Environmental Protection Agency water quality criteria do not exist for steroid or non-
steroid pharmaceuticals [5].
One class of pharmaceuticals found in the environment is selective serotonin
reuptake inhibitors (SSRIs). SSRIs are one of the most prescribed pharmaceuticals in the
US (rxlist.com, 2008). The first SSRI, fluoxetine (Prozac™), gained national attention in
84
1990 when it was referred to, in Newsweek, as „a breakthrough drug in the treatment of
depression: a once-a-day medication with acceptable side effects and relatively safe
cardiac effects‟ [8]. Fluoxetine is also prescribed commonly to treat obsessive-
compulsive and eating disorders [8]. As an SSRI, fluoxetine blocks serotonin reuptake
transporters that return released serotonin back to the presynaptic terminal, in order to
elevate serotonin levels and increase serotonin neurotransmission [9, 10].
Serotonin is likely one of the most potent and ubiquitous neuromodulators in
plants, invertebrates, and vertebrates [11] playing a role in many essential aspects of life
including eating, sleeping, sexual behavior, and mood [8]. Since serotonin regulates so
many critical functions, it is possible that exposure to SSRIs could disrupt a number of
behavioral functions in non-target species, including appetite [12]. Fluoxetine has been
shown to suppress appetite in laboratory animals, and reduce meal size without affecting
eating frequency [8].
While only 10% of excreted fluoxetine is as the unmetabolized parent compound
[13], the main metabolite, norfluoxetine, has a similar mode of action as the parent
compound. While environmental concentrations of norfluoxetine have not been reported,
fluoxetine has been reported in surface waters at concentrations as high as 0.012 µg/l [14]
and in wastewater effluent from 99 µg/l [14] to 0.540 µg/l [15]. As a result, there are
concerns over the potential sublethal effects of fluoxetine on aquatic organisms [12].
While concentrations of pharmaceuticals have typically been found at the ng/l level, their
presence is still a concern since they are biologically active [1]. Physiological and
behavioral responses are among the issues raised and although the concentrations

85
detected in effluent of WWTPs are probably too low to affect humans, impacts on aquatic
organisms are likely [10]. Pharmaceuticals may be able to biodegrade fairly quickly, but
they are continually released into the environment simulating more chronic exposures
than acute exposures. Yet, little is known about the long-term low-dose chronic effects
of exposure on aquatic organisms.
Fluoxetine has been shown to adversely affect numerous aquatic organisms;
however, this occurs at levels at least an order of magnitude higher than reported in the
environment [5, 16-18]. Most results reported are that of acute toxicity tests, and many
pharmaceuticals are not acutely toxic to aquatic organisms at low concentrations; but they
could have significant cumulative effects [3]. Current toxicity-screening data for drugs
are usually obtained from standard bioassays that do not target the mode of action of the
compound [1], so the danger of some of these drugs could be, and have been,
underestimated [19].
Previous research in our lab, demonstrated a linear response between serotonin
levels and feeding behavior in hybrid striped bass following a 6-day fluoxetine exposure
[20]. However, fluoxetine concentrations used were not environmentally relevant. The
purpose of this study was to examine the biochemical and behavioral effects of fluoxetine
on the feeding behavior of hybrid striped bass at lower exposure concentrations over a
27-day period.

86
Materials and Methods
Test chemicals
Fluoxetine hydrochloride, was generously donated by Fermion (Finland). 0.1N
perchloric acid (aq), was purchased from VWR (USA). Methanol, acetone,
triethylamine, acetolnitrile, glacial acetic acid, monochloro-acetic acid, and
tetrahydrofuran were purchased from Fisher Scientific (USA). Sodium hydroxide,
sodium octyl sulfate, ethylenediaminetetraacetic acid (EDTA) disodium salt, 3,4-
dihydroxybenzylamine hydrobromine (DHBA), 5-hydroxyindole-3-acetic acid (5-HIAA),
serotonin creatinine sulfate monohydrate (5-HT), norepinephrine hydrochloride (NE),
and dopamine hydrochloride (DA) were purchased from Sigma-Aldrich (USA).
Fish
Hybrid striped bass were obtained from Southland Fisheries near Columbia, SC.
Fish were housed in 450 L circular flow-through holding tanks at Clemson University‟s
Institute of Environmental Toxicology and fed a pellet food (Zeigler Brothers, Gardners,
PA) daily. Larval fathead minnows (Pimephales promelas) were obtained from a culture
maintained at Clemson University Institute of Environmental Toxicology and reared until
they were the appropriate size (4 to 5 cm) to be used in the tests.
Experimental design
Hybrid striped bass were exposed to fluoxetine for 27 days under static
conditions, with a 50% water change every sixth day. Bass were fed every third day on
days 0, 3, 6, 9, 12, 15, 18, 21, 24, and 27 and feeding behavior was quantified at these
times. Four tests were conducted for 6, 12, 21, or 27 days, where bass were fed every

87
third day and brains harvested on days 0, 6, 12, 21, or 27, respectively, for quantification
of brain monoamine levels.
Hybrid striped bass (16 - 18 months old; average weight 239.8 ± 46.2 g; average
length: 24.1 ± 1.4 cm) were randomly placed individually (one bass per tank) into
twenty-four 80-L aquaria operated under flow-through conditions (0.23 liters per minute).
Bass were allowed to acclimate in aquaria for five days prior to test initiation. A nearby
lake, Lake Hartwell (SC, USA), was the source of test waters (pH = 6.5 ± 0.8, Hardness
24 mg/L as CaCO3, Alkalinity 10 mg/L as CaCO3). Water was pumped through a multi-
resin filtration system (Water and Power Technologies, Columbia, SC) to remove
suspended solids prior to entering experimental tanks. Water temperature was controlled
using a mixing valve (M & M Control Services, Grayslake, IL) that regulated a mixture
of ambient and chilled water (ambient water circulated through an in-line chiller) or
heated water (ambient water circulated through an in-line heater) depending on the
ambient conditions (summer or winter months, respectively) to facilitate achieving a
desired temperature of about 25C. During the exposure period while waters were static,
water temperatures equilibrated to room temperatures (22.1 ± 1.3 C).
Bass were fed four fathead minnows every third day during the acclimation
period. This feeding regime ensured the bass were hungry and were accustomed to
eating live minnows. Bass were fed on days 2 and 5 of the acclimation period in the
aquaria so that the last day of acclimating coincided with day 0 of the fluoxetine
exposure. Feeding behavior (time to capture prey) of hybrid striped bass was then
quantified every third day during each test.

88
Prior to a feeding time point, air stones were removed from each tank. Four
fathead minnows were dropped into an experimental tank and the time to eat each prey
was recorded. Minnows of similar size (approximately 4 to 5 cm) were pre-selected prior
to feeding to ensure that no extremely large or small minnows were used to skew appetite
satiation. Minnows were then randomly selected and fed to bass without regard to
treatment. Bass that did not eat all four minnows prior to exposure initiation were
eliminated from the test to reduce any confounding factors. Bass were observed until all
minnow‟s were consumed or for a maximum of 25 minutes. Any uneaten minnows after
25 minutes were removed from the tank prior to replacing air stones. For statistical
purposes, an uneaten minnow was assigned a value of 1500 seconds (25 minutes).
Fluoxetine exposure
Treatments of four nominal fluoxetine concentrations (0, 0.1, 1, 10 µg/l) were
conducted with five replicate tanks per treatment. At test initiation, water flows were
turned off and an appropriate quantity of fluoxetine stock was added to each aquarium.
Every three days, fluoxetine powder was weighed out and dissolved in 5 ml of methanol.
This was used to spike three 2-liter stock solutions at various concentrations, one for each
treatment level. Methanol volumes ranged from 17.0 to 71.9 µl in the Low stock
solutions up to 1, 400 to 3,300 µl in the High stock solutions. Volumes of 100-250 ml
from each stock were added to each individual tank to achieve the desired fluoxetine
concentration. Final methanol volumes did not exceed 412.5 µl in 80 L of water in test
aquaria. The toxicity of methanol to fish has been shown to be greater than 15,000 mg/l
[21], and the ASTM standard guide for conducting early life-stage toxicity tests with

89
fishes (ASTM E1241-92) allows methanol as a carrier solvent at concentrations less than
0.1 mg/l. In our experimental setup, methanol concentrations were much lower than this
limit.
Fluoxetine half-life was previously determined to be approximately 72 hours
under test conditions. Therefore, waters were spiked every third day with either half
original fluoxetine concentration (days 3, 9, 15, and 21) or two-thirds the original
fluoxetine concentration (days 6, 12, 18, and 21) when there was also a 50% water
change. Since exposure concentrations were so low, it was not feasible to analytically
measure individual tank concentrations. Therefore, the stock solutions were used for
fluoxetine analyses. For the low, medium, and high stock solutions, 700, 200, and 25 ml,
respectively, were acidified to pH ~ 2.5 before being filtered through 6 ml C18 solid phase
extraction columns (PrepSep™, Fisher Scientific, USA) that were preconditioned with 6
ml acetone, 6 ml methanol, and 6 ml deionized water. Extraction columns were dried for
at least 30 minutes at room temperature on a vacuum manifold (JT Baker, Philipsburg,
NJ) before eluting fluoxetine with10 ml methanol / 1% acetic acid. Samples were stored
at -20C until analyzed by HPLC-fluorescence.
Fluoxetine Analysis
Aqueous fluoxetine concentrations were determined on Waters 1525 Breeze
HPLC pump with a Waters 717 Plus autosampler and Waters 2475 multi-wavelength
fluorescence detector (Waters, Milford, MA). Mobile phase was composed of 350 ml
acetonitrile, 650 ml water, and 4 ml triethylamine. Mobile phase was adjusted to pH 4
with glacial acetic acid. Flow rate was set at 1 ml/min for a 40 µl injection, and the
90
Alltech Prevail C18 column (150 mm, 4.66 I.D.) was set at 30C. Fluorescence detector
was set at 230 nm Ex/ 310 nm Em. Run time per sample was approximately 18 minutes.
Brain tissue preparation
Bass were euthanized in buffered MS-222 and brains were quickly removed and
put on dry ice prior for storage at -80C until processed. Brains were thawed, weighted,
and diluted in 1.0 ml 0.1N perchloric acid containing 50 pg/µl DHBA, the internal
standard. Samples were then homogenized for 20 seconds by ultrasonic disruption and
centrifuged at 21,000 rpm and 4C for 20 minutes to remove cellular debris. Supernatant
was aliquoted and stored at -80C until used for analyses.
Protein Assay
Protein concentrations were determined using a BCA™ Protein Assay Kit (Pierce,
Rockford, IL, USA). Brain homogenates were diluted 1:4 in 0.1N perchloric acid prior to
running the assay. Brain monoamine levels were normalized using protein
concentrations.
Monoamine Analysis
Brain samples were analyzed via HPLC with an electrochemical detector with
methods modified from Lin and Pivorun [22]. The chromatographic system consisted of
a Bioanalytical System LC-4C amperometric detector, PM-80 pump, and a C18 reverse-
phase column (ODS-2 Hypersil 250 mm x 4.6 mm). Aliquots of 30 µl were injected into
the sample loop (20 µl) of a rotary injection valve. Flow rate was 1.0 ml/min, with the
electrode potential maintained at +0.8 volts versus Ag/AgCl. Mixed monoamine
standards was prepared with NE, DA, 5-HIAA, and 5-HT ranging from 150 pg/µg to 10

91
pg/µg in 0.1N perchloric acid. Each standard also contained 50 pg/µl DHBA as the
internal standard. Each sample run took 35 minutes.
The mobile phase consisted of 14.2 g monochloroacetic acid, 4.7 g sodium
hydroxide, 10.0 mg disodium EDTA, 150 mg sodium octyl sulfate dissolved in 967 mL
Milli-Q water with 15 ml of methanol and 18 ml of tetrahydrofuran. The mobile phase
was filtered through a 0.45 µm white nylon Millipore filter before adding methanol and
tetrahydrofuran. The mobile phase was degassed via sonication prior to use.
Data analysis
Data for time to capture prey was analyzed using Statistical Analysis Software 9.1
(SAS; Cary, NC, USA) with two-factor ANOVA (analysis of variance) models utilizing
treatment and day as the independent variables. Since the time to capture prey data were
non-normally distributed with non-homogeneous variances, PROC GLIMMIX (General
Linear Model for Mixture Distributions), an analyses matrix that accounts for non-
normality and non-homogeneous variances, was used to perform multiple pair-wise
comparisons. The LSMEANS statement in PROC GLIMMIX was used to differentiate
statistical differences across and within treatment, day, and treatment-by-day interactions.
Monoamine concentrations were analyzed using two-factor ANOVA models
utilizing treatment and day as the independent variables. Although monoamine data were
normally distributed with homogeneous variance, PROC GLIMMIX with LSMEANS
statement was executed to differentiate statistical differences among and within the
independent variables (treatment, day, and the treatment-by-day interaction terms) rather
than separate LSMEANS statements within PROC GLM (ANOVA analyses) by day or

92
treatment. An = 0.05 was used with both time to capture prey and monoamine analyses
when examining statistical significance of factors using PROC ANOVA and PROC
GLIMMIX.
Results
Fluoxetine concentrations
Measured fluoxetine stock concentrations (mean ± standard deviation) throughout
the exposure period for the low (0.1 µg/l), medium (1 µg/l) and high (10 µg/l) treatments
were 0.08 ± 0.02, 0.87 ± 0.12, and 9.44 ± 0.82 µg/l, respectively.
5-HT levels
There was no clear dose-response relationship for serotonin levels on any day. As
compared to controls on day 27, serotonin levels were significantly greater in bass in the
high treatment (Table 1, Figure 1a). At no other time point did fluoxetine-treated bass
have significantly different serotonin levels as compared to the controls. When analyzing
serotonin levels within each treatment across days, there were no significant increases or
decreases in serotonin levels, with the exception of the medium treatment group between
days 6 and 27 where serotonin levels were significantly greater on day 6 than day 27
(Table 1). In addition, serotonin levels were significantly lower in the control and low
treatments on day 27 as compared to all other time points for these treatments (Table 1).
In trying to explain this decrease in serotonin levels, brain monoamines in the medium
treatment were also lower on day 27, although not significant, suggesting a possible issue
with sample storage from that experiment, rather than a consequence of fluoxetine
exposure. Therefore, it is not possible to conclude that the significant difference in

93
serotonin levels between the controls and high treatment on day 27 is a result of
fluoxetine exposure.
5-HIAA levels
There were significant decreases in 5-HIAA levels between days 0 and 6 for bass
in the control, low, and high treatments, but not the medium treatment (Table 1). There
were also significant decreases in 5-HIAA levels on day 27 as compared to day 0 for all
treatment groups, including the controls (Table 1). This may be the result of an error in
sample storage rather than an observed effect of fluoxetine exposure since there were
significant changes in the controls as well. On days 6, 12, and 21, 5-HIAA levels were
significantly reduced in the high treatment as compared to the controls on the same day
(Table 1, Figure 1b). There was a decreasing trend in 5-HIAA levels between days 6 and
12 in the low and medium treatments, but they were not significant (Table 1). By day
27, there was no significant difference in 5-HIAA activities between any treatment
groups.
5-HIAA:5-HT ratio
On day 0, the 5-HIAA:5-HT ratio was significantly greater than all other time
points, except for controls on day 27 (Table 1, Figure 1c). This is most likely due to the
significantly greater 5-HIAA levels on day 0. Otherwise, the only significant difference
as compared to control was seen in the high treatment on days 6 and 12 (Table 1, Figure
1c). However, there were no significant changes in 5-HIAA:5-HT ratio in the high
treatment as the exposure duration continued between days 6 and 27.

94
NE levels
There was no significant difference in NE levels as compared to controls on any
day, with the exception of day 27 in which NE levels in the high treatment were
significantly greater than control and low treatments (Table 1, Figure 2a). This was most
likely due to the significantly lower NE levels in the control and low treatments as
compared to any other day, and not the result of fluoxetine exposure. NE levels in bass
in the medium treatment were significantly lower on day 27 as compared to days 0 and 6;
however, NE levels were not as low as the control or low treatments, nor were they
significantly different (Table 1).
DA levels
There were no significant differences in DA levels as compared to controls on any
day (Table 1, Figure 2b). However, as mentioned for the other monoamines investigated,
there were significant declines in DA levels on day 27 in the control and low treatment
groups as compared to any other day (Table 1).
Behavior data
In general, time to capture prey was not significantly impaired at the fluoxetine
concentrations chosen for this test (Figure 3). There were, however, a few significant
increases in time to capture prey in the high treatment as compared to controls. Time to
eat prey 1 was significantly longer on days 6, 15, and 24; time to eat prey 2 was
significantly longer on days 6 and 15; time to eat prey 3 was significantly longer on days
6, 12, and 15. These significant differences are most likely the result of a few outlier
bass, by which their increased time to eat greatly skewed the means. When looking at the

95
effect of exposure-duration on each treatment, there were no significant differences
across days, including in the high treatment. Overall, the feeding behavior of bass was
not affected at the concentrations tested. See Appendix Table A-3 for mean ± SE values
for time to capture prey for each treatment and day.
Discussion
Selective serotonin reuptake inhibitors have become very popular due to their
effectiveness in treating depression, obsessive-compulsive disorders, and eating
disorders. In 2008, there were seven identified antidepressants among the top 200 most
prescribed drugs in the US that regulate the reuptake of serotonin on the presynaptic
terminal (rxlist.com, 2008). This includes both SSRIs and selective serotonin and
norepinephrine reuptake inhibitors (SSNRIs). Although detected environmental
concentrations of individual SSRIs are low, the aquatic exposure might be a function of
their combined concentrations, taking into consideration that SSRIs likely have the same
mode of action [17]. Thus, total environmental concentrations may be approaching
values that are shown to impact non-target species [23]. It has already been shown that
some SSRIs can accumulate in fish in effluent-dominate streams, including fluoxetine
[24].
In the laboratory, fluoxetine been shown to cause a number of behavioral effects
in aquatic organisms including induced spawning in mussels [16], reduced reproduction
in C. dubia [9], and reduced feeding behavior in hybrid striped bass [20]. However, all
these results were determined using fluoxetine concentrations that were greater than what
is found in the environment. When looking at the effects at lower, more environmentally

96
relevant concentrations, the effects were not as profound. In the present study, we saw no
significant effects of fluoxetine on feeding behavior in bass exposed to 0.1 1.0, or 10.0
µg/l over the 27-day exposure. There were a few time points in which feeding behavior
in the highest treatment was significantly different from controls, but it cannot be
concluded if this was a result of fluoxetine exposure, or just individual variability.
Overall, there was no clear dose-dependent response in feeding behavior across treatment
for any time point.
It has been generally concluded that environmentally relevant concentrations of
fluoxetine is not likely to cause acute toxicity to aquatic organisms. However, as a result
of the continuous human use of fluoxetine and the incomplete removal of SSRIs and
other pharmaceuticals from WWTPs, there will likely be a continuous release of low
concentrations into the environment [17]. Therefore, chronic toxicity tests to determine
long-term effects should be routine when evaluating these chemicals. Henry and Black
[18] found that chronic exposure of western mosquitofish (Gambusia affinis) to low
concentrations of fluoxetine did not affect survival, sex ratio, or development. While
there was evidence of decreased expression of sexual characteristics indicating
developmental delays from chronic fluoxetine exposure of 71 µg/l, this effect was not
seen at lower tested concentrations [18]. Other long-term tests conducted using low
fluoxetine concentrations (0.1 to 5.0 µg/l) showed no effect on growth or condition
factors, or a number of measured adult reproductive parameters in Japanese medaka
(Oryzias latipes) [25]. In addition, long-term fluoxetine treatment (14 daily i.p. injections

97
at 4.3 mmol) of male Betta spendens did not significantly decrease their territorial
aggression [26].
The results of the present study further support the notion that there are minimal
effects of long-term fluoxetine exposure on behavior. There were no clear behavioral
effects on feeding as a result of exposure duration in bass exposed to fluoxetine (0.1 to
10.0 µg/l) for 27 days. In the high treatment there were some observed behavioral effects
of fluoxetine in which some bass were slightly diagonal in the water column, but this did
not impair their ability to capture prey once minnows were dropped into the aquarium.
Bass in all treatments, including the high treatment, were observed to be anxiously
waiting to be fed. Contrary to our observations, Henry and Black[18] noted that there
was a slight increase in lethargy when mosquitofish were chronically exposed to
fluoxetine (0.5 to 5.0 µg/l), indicating slight behavioral changes [18]. However, this
could be attributed to differences in species sensitivity.
Serotonin is involved in a number of physiological processes, including control of
meal size or satiation, and fluoxetine has been shown to have properties of satiety
enhancing agents, advancing the behavioral satiety sequence in rats [8]. Thus fluoxetine
exposure has the potential to alter serotonin levels and hunger in aquatic species as well,
ultimately resulting in consequences on organism and population [17]. Unfortunately,
attempts to provide a unified function for serotonin are elusive since the literature on this
one chemical system is filled with apparent contradictions [11] with species to species
variability including teleosts [27].

98
While fluoxetine was developed with the intent to increase serotonin levels at the
synapse, there is a delayed onset of this therapeutic effect for 2-4 weeks [28, 29]. As a
compensatory mechanism following the blockage of reuptake pumps, inhibitory 5-HT
autoreceptors are activated leading to decreased serotonin neuronal activity and
neurotransmitter release, thus preventing an increase in serotonin concentrations [30]. It
has been shown that desensitization of 5-HT1A and 5-HT1B autoreceptors that control
serotonin release occurs after long-term treatment with SSRIs [28-30], thus eventually
allowing the release of serotonin while in the presence of SSRIs. This process leads to
the delayed therapeutic effect.
Many aquatic toxicity tests involving fluoxetine are preformed without verifying
changes in serotonin levels in the organism, assuming that serotonin levels would
increase in the presence of fluoxetine. One rat study involving fluoxetine noted elevated
serotonin levels within 30 minutes of exposure and persisted for four hours [31], but they
did not continue monitoring serotonin levels past this point. Since fluoxetine binds
immediately to the transporters [32], it may be possible that this initial increase in
serotonin levels occurred before autoreceptors were desensitized. When we looked at
serotonin levels three and six days following the initial fluoxetine exposure in bass, we
found that bass exhibited a decrease in serotonin levels [20]. We attributed this to
activated 5-HT autoreceptors that decreased the release of serotonin into the synapse. We
hypothesized that if we carried out the exposure over a longer period of time, we would
possibly see serotonin levels return to control levels and maybe surpass control serotonin
99
levels. However, at the fluoxetine concentrations used in the present study, we did not
observe this effect.
While there was a decrease in serotonin levels on day 12 of the fluoxetine
exposure, it was neither dose-dependent nor significant. In addition, we did see
significantly elevated serotonin levels in the high treatment group as compared to
controls on day 27 and it may be an effect of the long-term fluoxetine exposure, but it is
also possible that this is the result of unusually low monoamine levels in the control and
low treatment groups on that day. There were no significant changes in serotonin levels
in the high treatment at any time points tested (days 0, 6, 12, 21, and 27), so the latter
may be true. Differences in basal monoamine levels observed among experiments were
likely a result of the fact that each experiment was conducted at different times and
sample preparations were not conducted all at the same time. Additional research would
need to be performed to further speculate the effects of fluoxetine exposure on hybrid
striped bass.
Since 5-HIAA is the metabolite of serotonin, there would also be a decrease in 5-
HIAA levels noted in the presence of fluoxetine since there is less serotonin at the
synapse until the autoreceptors are desensitized. In the present study, there was
significantly less 5-HIAA in bass in the high treatment as compared to controls on days 6,
12, and 21. This would be consistent with a decreased firing of 5-HT neurons due to the
activation of autoreceptors in the presence of fluoxetine, but there was not a decrease in
serotonin levels to fully support this conclusion.
100
Other studies in mice have shown a reduction in the 5-HIAA:5-HT ratio after
acute, subacute, and chronic treatments [33]. They noted a persistence of decreased
serotonin turnover (5-HIAA:5-HT) during the fluoxetine administration. In the present
study, there were significant decreases in serotonin turnover noted as compared to
controls, but only differences on days 6 and 21 in the high treatment. It is also important
to mention here that there was no significant change in serotonin turnover in the high
treatment between days 6 and 27. The serotonin turnover rate (5-HIAA:5-HT ratio) was
significantly higher on day 0 as compared to any other day, but this is most likely the
result of the high basal levels of 5-HIAA on that day.
Although it is supposed to be selective for serotonin, fluoxetine exposure has been
shown to increase extracellular norepinephrine and dopamine in rats [31]. In the present
study, there were no significant differences in norepinephrine or dopamine levels in bass
treated with fluoxetine as compared to the controls, with the exception on day 27. Bass
in the high treatment exhibited significantly greater norepinephrine levels as compared to
the control and low treatments and significantly greater dopamine levels than the low
treatment, but not controls, on that day. Again, we cannot confirm whether these findings
were a result of the fluoxetine exposure, or a result the significant decrease monoamine
levels in the control and low treatments on that day as compared to all other time points.
While it is important to determine the effects of fluoxetine on aquatic organisms
at environmentally relevant concentrations, it is also important to know what effects
could occur at higher exposure concentrations. Individual pharmaceuticals occurring at
low levels in the environment may exhibit synergistic and cumulative effects [3]. Using

101
only standardized tests, the effects of pharmaceuticals in the environment could be
underestimated. Since the FDA is not entirely concerned with drugs present in the
environment below 1 µg/l, additive effects of drugs with similar modes of action, and
interactions of drugs with different modes of actions are not considered [5]. If tests were
tailored toward the mode of action of a compound, the effects level could be significantly
lowered [19].
While regulations for drugs in the environment are only beginning to be
considered, they are no different from other chemicals. They still have the potential to
cause adverse effects to aquatic organisms and communities, especially since many are
known to make their way through WWTPs. Although research results have shown that
there appears to be minimal behavioral and/or biochemical effects to individual SSRI
exposure scenarios, this should not be interpreted to suggest there are no effects of
exposure. It is likely that continual pharmaceutical exposure to aquatic organisms could
result in effects that go unnoticed until they become irreversible. The effects could
accumulate slowly, and as a result changes may be attributed to natural, ecological
succession [34] rather than the problem at hand. It is important to run chronic exposure
tests, recognizing that most pharmaceutical active ingredients are not acutely toxic, but
may have long-term effects on organisms. It is also important to continue expanding this
research using mixtures of pharmaceuticals, especially those that have the same mode of
action. We know that individual pharmaceuticals have shown effects at concentrations
greater than found in the environment; next we need to explore the effects of low-level

102
mixtures of SSRIs with the same speculated mode of action to more accurately rule out or
define adverse effects of exposure to aquatic organisms.
References
1. Bound JP, Voulvoulis, N. 2004. Pharmaceuticals in the aquatic environment – a
comparison of risk strategies. Chemosphere 56:1143-1155.
2. Carballa M, Omil F, Lema JM, Llompart M, García-Jares C, Rodríguez I, Gómez
M, Ternes T. 2004. Behavior of pharmaceuticals, cosmetics and hormones in a
sewage treatment plant. Water Res. 38:2918-2926.
3. Bendz D, Paxéus NA, Ginn TR, Loge FJ. 2005. Occurrence and fate of
pharmaceutically active compounds in the environment, a case study: Höje River
in Sweden. J. Hazard. Mater. 122:195-204.
4. Ternes TA. Occurrence of drugs in German sewage treatment plants and rivers.
Water Res. 32:3245-3260.
5. Brooks BW, Turner PK, Stanley JK, Weston JJ, Glidewell EA, Foran CM,
Slattery M, La Point TW, Huggett DB. 2003. Waterborne and sediment toxicity of
fluoxetine to select organisms. Chemosphere 52:135-142.
6. Raloff J. 1998. Drugged Waters. Sci. News. 153:187-189.
7. Cleuvers M. 2003. Aquatic ecotoxicity of pharmaceuticals including the
assessment of combined effects. Toxicol. Lett. 142:185-194.
8. Wong DT, Bymaster FP, Engleman EA. 1995. Prozac™ (Fluoxetine, Lilly
110140), the first selective serotonin uptake inhibitor and an antidepressant drug:
twenty years since its first publication. Life Sci. 57:411-441.
9. Henry TB, Kwon JW, Armbrust KL, Black MC. 2004. Acute and chronic toxicity
of five selective serotonin reuptake inhibitors in Ceriodaphnia dubia. Environ.
Toxicol. Chem. 23:2229-2233.
10. Fong PP. 2001. Antidepressants in aquatic organisms: a wide range of effects. In:
Daughton CG, Jones-Lepp TL. (Eds.). Pharmaceuticals and Personal Care
Products In the Environment. American Chemical Society, Washington, D.C.
pp.264-281.
11. Azmitia, EC. 1999. Serotonin neurons, neuroplasticity, and homeostasis of neural
tissue. Neurophyschopharmacology 21 Supp. (33S-45S)

103
12. Brooks BW, Foran CM, Richards SM, Weston J, Turner PK, Stanley JK,
Solomon KR, Slattery M, La Point TW. 2003a. Aquatic ecotoxicology of
fluoxetine. Toxicol. Lett. 142:169-183.
13. Hiemke C, Härtter S. 2000. Pharmacokinetics of selective serotonin reuptake
inhibitors. Pharmacol. Therapeut. 85:11-28.
14. Koplin DW, Furlong ET, Meyer MT, Thurman EM, Zaugg SD, Barber LB,
Buxton HT. 2002. Pharmaceuticals, hormones, and other organic wastewater
contaminants in US streams, 1999-2000: a national reconnaissance. Environ. Sci.
Technol. 36:1202-1211.
15. Weston JJ, Huggett DB, Rimoldi J, Foran CM, Stattery M. 2001. Determination
of fluoxetine (Prozac™) and norfluoxetine in the aquatic environment. Annual
Meeting of the Society of Environmental Toxicology and Chemistry, Baltimore,
MD.
16. Fong, PP, Huminski PT, D‟Urso. 1998. Induction and potentiation of parturition
in fingernail clams (Sphaerium striatinum) by selective serotonin re-uptake
inhibitors (SSRIs). J. Exp. Zool. 280:260-264.
17. Henry TB, Black MC. 2007. Mixture and single-substance acute toxicity of
selective serotonin reuptake inhibitors in Cerodaphnia dubia. Environ. Toxicol.
Chem. 26:1751-1755.
18. Henry TB, Black MC. 2008. Acute and chronic toxicity of fluoxetine (selective
serotonin reuptake inhibitor) in western mosquitofish. Arch. Environ. Contam.
Toxicol. 54:325-330.
19. Henschel KP, Wenzel A, Diedrich M, Fliedner A. 1997. Environmental hazard
assessment of pharmaceuticals. Regul. Toxicol. Pharm. 25:220-225.
20. Gaworecki KM, Klaine SJ. 2008. Behavioral and biochemical responses of hybrid
striped bass during and after fluoxetine exposure. Aquat. Toxicol. in press.
21. Kaviraj, A., Bhunia, F., Saha, N.C., 2004. Toxicity of methanol to fish,
crustacean, oligochaete worm, and aquatic ecosystem. Int. J. Toxicol. 23, 55-63.
22. Lin L-H, Pivorun EB. 1990. Hypothalamic monoamines and their metabolites in
the deermouse, Peromyscus manicultatus, during daily torpor. J. Neural Transm.
[Gen. Sec.] 79:11-18.

104
23. Vasskog T, Berger U, Samuelsen, PJ, Kallenborn R, Jensen E. 2006. Selective
serotonin reuptake inhibitors in sewage influents and effluents from Tromsø,
Norway. J. Chromatogr. A 1115:187-195.
24. Brooks BW, Chambliss CK, Stanley JK, Ramirez A, Banks KE., Johnson RD,
Lewis RJ. 2005. Determination of select antidepressants in fish from and effluent-
dominated stream. Environ. Toxicol. Chem. 24:464-469
25. Foran CM, Weston J, Slattery M, Brooks BW, Huggett DB. 2004. Reproductive
assessment of Japanese medaka (Oryzias latipes) following a four-week
fluoxetine (SSRI) exposure. Arch. Environ. Contam. Toxicol. 46:511-517.
26. Clotfelter ED, O‟Hare EP, McNitt MM, Carpenter RE, Summers CH. 2007.
Serotonin decreases aggression via 5-HT1A receptors in the fighting fish Betta
splendens. Pharmacol. Biochem. Behav. 87:222-231.
27. Airhart MJ, Lee DH, Wilson TD, Miller BE, Miller MN, Skalko RG. 2007
Movement disorder and neurochemical changes in zebrafish larvae after bath
exposure to fluoxetine (Prozac™). Neurotoxiol. Teratol. 29: 652-664.
28. Dawson LA, Nguyen HQ, Smith DI, Schechter LE. 2000. Effects of chronic
fluoxetine treatment in the presence and absence of (±)pindolol: a microdialysis
study. Brit. J.Pharmacol. 130:797-804.
29. Newman, ME, Shalom G, Ran A, Gur E, Van de Kar LD. 2004. Chronic
fluoxetine-induced desensitizationof 5-HT1A and 5-HT1B autoreceptors: regional
differences and effects of WAY-100635. Eur. J. Pharmacol. 486:25-30.
30. Invernizzi R, Bramante M, Samanin R. 1994. Chronic treatment with citalopram
facilitiate the effect of a challenge dose on cortical serotonin output: role of
presynaptic 5-HT1A receptors. Eur. J. Pharmacol. 260:243-246.
31. Bymaster FP, Zhang W, Carter PA, Shaw J, Chernet E, Phebus L, Wong DT,
Perry KW. 2002. Fluoxetine, but not other selective serotonin uptake inhibitors,
increases norepinephrine and dopamine extracellular levels in prefrontal cortex.
Psychopharmacology 160:353-361.
32. Le Poul E, Boni C., Hanoun N, Laporte AM, Laaris N, Chauveau J, Hamon M,
Lanfumey L. 2000. Differential adaptation of brain 5-HT1A and 5-HT1B
receptors and 5-HT transporter in rats treated chronically with fluoxetine.
Neuropharmacology 39:110-122.

105
33. Hall JM, Anderson GM, Cohen DJ. 1995. Acute and chronic effects of fluoxetine
and haloperidol on mouse brain serotonin and norepinephrine turnover. Life Sci.
57:791-801.
34. Daughton CG, Ternes TA. 1999. Pharmaceuticals and personal care products in
the environment: agents of subtle change. Environ. Health Persp. 107:907-938.

106
Figure 4.1. Serotonin (5-HT) and 5-hydroxyindoleacetic acid (5-HIAA) levels (mean
SE) in hybrid striped bass brains, and 5-HIAA:5-HT ratios during a 27-day fluoxetine
exposure. * denotes significant differences (=0.05) from the control on the respective
day.

107
Figure 4.2. Norepinephrine (A.) and dopamine (B.) levels (mean SE) in hybrid striped
bass brains during a 27-day fluoxetine exposure. * denotes significant differences
(=0.05) from the control on the respective day.
0
5
10
15
20
0 6 12 21 27Day
Dopam
ine
(pg/µ
g p
rote
in)
B.
0
20
40
60
80
0 6 12 21 27
Nore
pin
ephri
ne
(pg/µ
g p
rote
in) control low medium high
*
A.
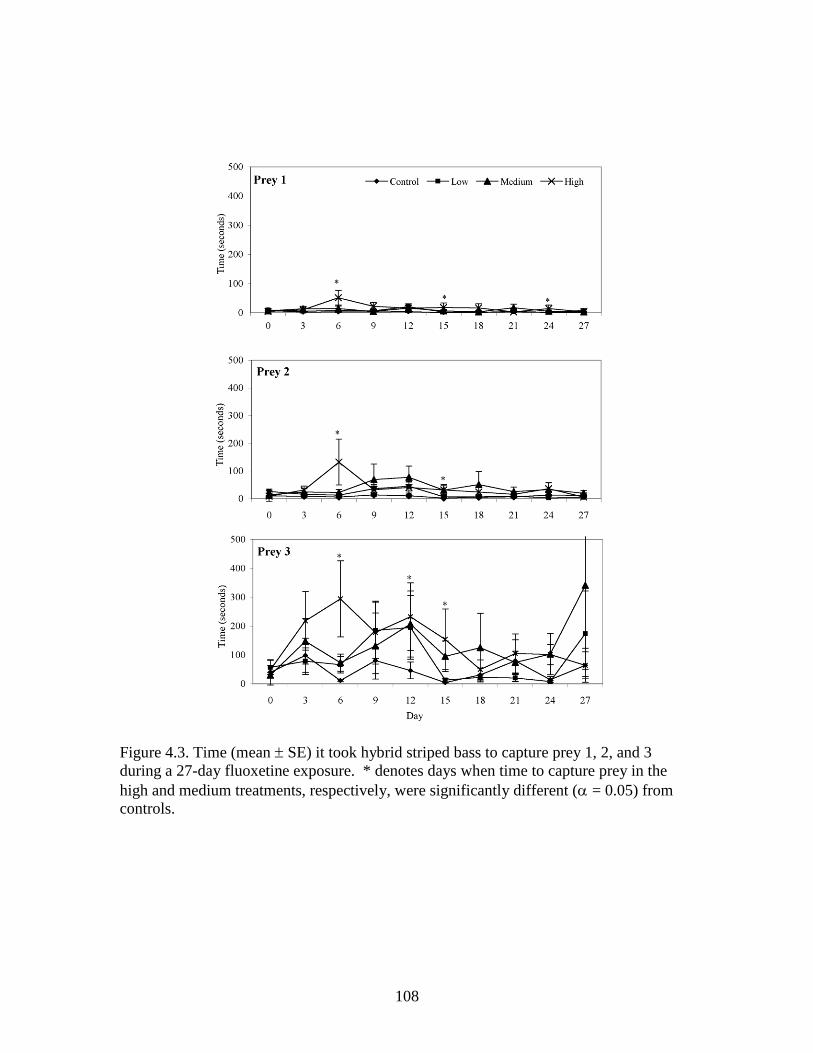
108
Figure 4.3. Time (mean SE) it took hybrid striped bass to capture prey 1, 2, and 3
during a 27-day fluoxetine exposure. * denotes days when time to capture prey in the
high and medium treatments, respectively, were significantly different ( = 0.05) from
controls.

109
Monoam
ine
Tre
atm
ent
Da
y 0
Da
y 6
Da
y 1
2D
ay 2
1D
ay 2
7
5-H
TC
ontr
ol
29.0
± 2
.7
abcd
28.3
± 1
.0
abcd
28.9
± 2
.5
ab
cd
29.8
± 0
.8
ab
c 1
9.9
± 2
.9
e
Low
29.0
± 2
.7
abcd
27.8
± 1
.6
ab
cd
24.2
± 2
.5
bcd
e 3
0.7
± 1
.9
ab
19.3
± 3
.1
e
Mediu
m 2
9.0
± 2
.7
abcd
33.7
± 1
.1
a 2
7.2
± 1
.9
ab
cd
27.5
± 3
.9
ab
cd
23.2
± 0
.7
cde
Hig
h 2
9.0
± 2
.7
abcd
29.3
± 0
.8
ab
cd
22.4
± 3
.3
de
25.1
± 4
.4
bcd
e 2
7.1
± 1
.9
ab
cd
5-H
IA
AC
ontr
ol
10.1
± 1
.3
a
7.5
± 0
.5
bcd
8
.4 ±
0.9
a
bc
8
.4 ±
0.2
a
bc
5
.8 ±
1.1
d
ef
Low
10.1
± 1
.3
a
7.5
± 0
.4
bcd
6
.8 ±
0.5
b
cdef
7
.4 ±
0.4
b
cde
5
.1 ±
1.0
f
Mediu
m 1
0.1
± 1
.3
a
8.6
± 0
.8
ab
6
.2 ±
0.8
cde
f
6.4
± 1
.0
bcd
ef
5
.5 ±
0.2
d
ef
Hig
h 1
0.1
± 1
.3
a
4.7
± 0
.3
f
5.3
± 0
.8
ef
5
.0 ±
0.8
f
5
.6 ±
0.4
d
ef
5-H
IA
A:5-H
TC
ontr
ol
0.3
5 ±
0.0
3 a
0.2
7 ±
0.0
1 b
c 0
.29 ±
0.0
2 b
0.2
8 ±
0.0
1 b
c 0
.27 ±
0.0
1 a
b
Low
0.3
5 ±
0.0
3 a
0.2
7 ±
0.0
1 b
c 0
.29 ±
0.0
2 b
c 0
.24 ±
0.0
1 b
cd
0.2
6 ±
0.0
2 b
cd
Mediu
m 0
.35 ±
0.0
3 a
0.2
5 ±
0.0
2 b
cd
0.2
3 ±
0.0
3 c
de
0.2
3 ±
0.0
1 b
cde
0.2
4 ±
0.0
1 b
cde
Hig
h 0
.35 ±
0.0
3 a
0.1
6 ±
0.0
1 e
0.2
4 ±
0.0
1 b
cde
0.1
8 ±
0.0
1 d
e 0
.21 ±
0.0
1 b
cde
NE
Co
ntr
ol
64.1
± 3
.2
ab
57.9
± 1
.6
ab
c 6
4.1
± 4
.7
ab
61.7
± 3
.1
ab
c 3
8.0
± 5
.2
d
Low
64.1
± 3
.2
ab
54.5
± 2
.4
bc
58.6
± 5
.9
ab
c 5
9.8
± 3
.8
ab
c 3
6.7
± 4
.2
d
Mediu
m 6
4.1
± 3
.2
ab
68.4
± 2
.8
a 6
3.5
± 3
.5
ab
54.2
± 8
.7
bc
48.3
± 1
.1
cd
Hig
h 6
4.1
± 3
.2
ab
66.2
± 2
.2
ab
54.3
± 8
.7
bc
57.1
± 8
.3
ab
c 5
5.5
± 2
.4
ab
c
DA
Co
ntr
ol
14.1
± 0
.8
a 1
2.5
± 0
.2
ab
13.6
± 0
.7
ab
13.7
± 0
.7
ab
9
.0 ±
1.0
cd
Low
14.1
± 0
.8
a 1
3.2
± 1
.0
ab
12.8
± 1
.4
ab
13.0
± 0
.9
ab
8.7
± 1
.1
d
Mediu
m 1
4.1
± 0
.8
a 1
5.1
± 0
.4
a 1
3.2
± 0
.8
ab
13.2
± 1
.7
ab
11.0
± 0
.6
bcd
Hig
h 1
4.1
± 0
.8
a 1
4.8
± 0
.6
a 1
2.0
± 2
.0
ab
c 1
3.4
± 2
.0
ab
12.0
± 0
.6
ab
c
Bra
in M
ono
am
ine (
pg
/µg p
rote
in)

110
Table 4.1. Serotonin (5-HT), 5- hydroxyindoleacetic acid (5-HIAA), norepinephrine
(NE), dopamine (DA) levels (mean SE) in hybrid striped bass (pg/µg protein), and the
5-HIAA:5-HT ratio following a 27-day fluoxetine exposure. a through f denotes
significant differences among treatment and day for each monoamine or ratio. (On
previous page)

111
CONCLUSIONS
Behavior
(1) There were duration-dependent increases in time-to-capture prey in hybrid striped
bass acutely exposed to diazinon or fluoxetine for 6 days.
(2) There were duration-dependent decreases in time-to-capture prey in hybrid striped
bass through 6-day recovery periods following acute diazinon or fluoxetine
exposures.
(3) There were no concentration- or duration-dependent responses in time-to-capture
prey in hybrid striped bass exposed to fluoxetine for 27 days.
Biochemistry
(4) There were concentration- and duration-dependent decreases in brain
acetylcholinesterase (AChE) and serotonin levels in hybrid striped bass acutely
exposed to diazinon and fluoxetine, respectively, for 6 days
(5) There were concentration- and duration-dependent increases in brain
acetylcholinesterase and serotonin levels in hybrid striped bass through 6-day
recovery periods from diazinon or fluoxetine exposures, respectively. However,
increases were not always significant nor did they all reach control levels at the
end of the recovery period.
(6) There were no concentration- or duration-dependent changes in serotonin,
norepinephrine, or dopamine levels in hybrid striped bass exposed to fluoxetine
for 27-d. 5-HIAA levels were only significantly lower than controls in the highest
fluoxetine treatment (10 µg/L).
112
Relating feeding behavior and brain biochemistry
(7) Feeding behavior recovered more quickly than brain AChE or serotonin activities;
6-day recovery periods were not sufficient for full recovery of either
neurotransmitter.
(8) There was a threshold response between brain AChE activity and time-to-capture
prey for hybrid striped bass acutely exposed to diazinon.
(9) There was a linear relationship between brain serotonin levels and time-to-capture
prey for hybrid striped bass acutely exposed to fluoxetine.
The research in this dissertation demonstrated that relationships between
biochemical and behavioral endpoints could be determined. We found that prey capture
is an ecologically relevant behavior that can be related to brain neurotransmitter activity.
Recognizing that behavioral changes are likely a product of altered biochemistry and
understanding this connection may allow more meaningful interpretations of biochemical
biomarkers. While there has been an increase in research characterizing various
biomarkers, they are not routinely used in risk assessments because their ecological
relevance is not as well defined. So once a relationship has been defined, it may possible
to use biomarkers as a tool for validating risk. In addition, knowing such a relationship
may also aid in predicting more accurately population level impacts from a biochemical
endpoint following contaminant exposure.
This bioassay shows potential for evaluating effects of short- and long-term
sublethal contaminant exposures on feeding behavior, as well as the ability to monitor

113
recovery of an organism following exposure. While we know that toxic effects may last
longer than the original exposure, we do not usually monitor the recovery of an organism.
But this bioasay can successfully reveal prolonged effects and/or improvements in
feeding behavior and brain biochemistry, and the sensitivity of each. Overall, the
behavioral assay designed for this dissertation can increase our understanding of how
changes in brain biochemistry may impact the feeding behavior of hybrid striped bass,
and can be further used to understand effects of sublethal exposures to neurotoxins on
feeding behavior. This assay may provide a practical link between changes at the
biochemical and population level.
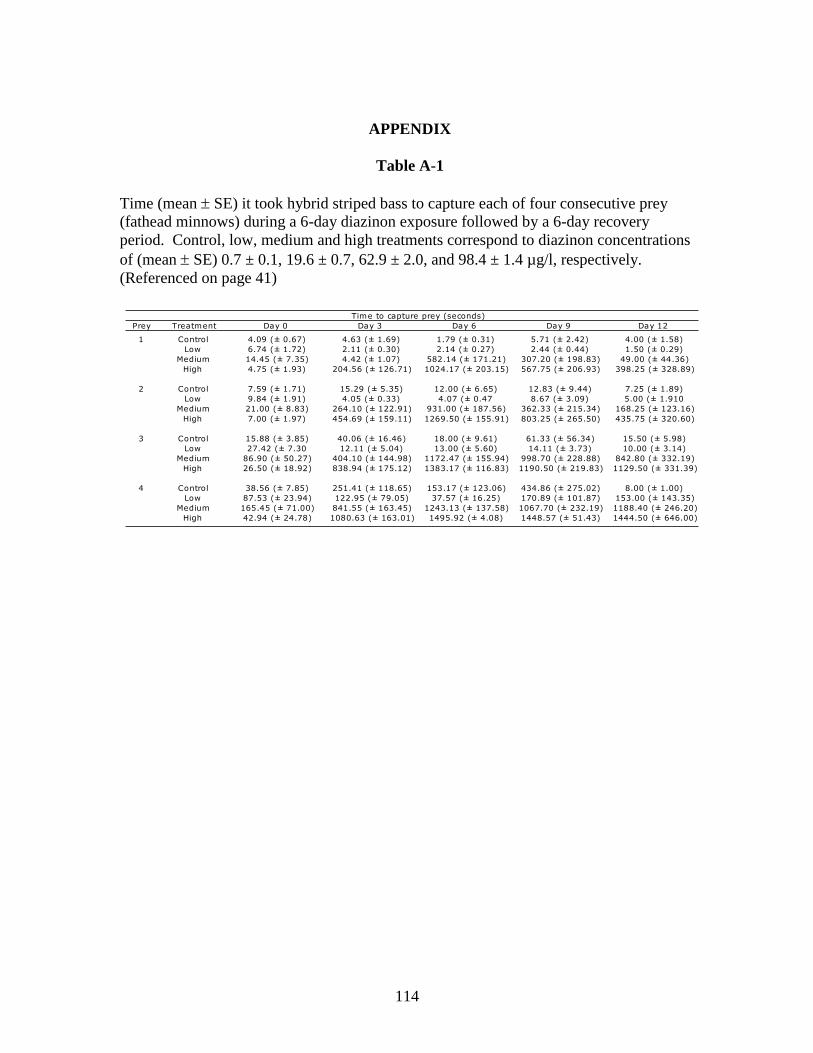
114
APPENDIX
Table A-1
Time (mean SE) it took hybrid striped bass to capture each of four consecutive prey
(fathead minnows) during a 6-day diazinon exposure followed by a 6-day recovery
period. Control, low, medium and high treatments correspond to diazinon concentrations
of (mean SE) 0.7 ± 0.1, 19.6 ± 0.7, 62.9 ± 2.0, and 98.4 ± 1.4 µg/l, respectively.
(Referenced on page 41)
Prey Treatment Day 0 Day 3 Day 6 Day 9 Day 12
1 Control 4.09 (± 0.67) 4.63 (± 1.69) 1.79 (± 0.31) 5.71 (± 2.42) 4.00 (± 1.58)
Low 6.74 (± 1.72) 2.11 (± 0.30) 2.14 (± 0.27) 2.44 (± 0.44) 1.50 (± 0.29)
Medium 14.45 (± 7.35) 4.42 (± 1.07) 582.14 (± 171.21) 307.20 (± 198.83) 49.00 (± 44.36)
High 4.75 (± 1.93) 204.56 (± 126.71) 1024.17 (± 203.15) 567.75 (± 206.93) 398.25 (± 328.89)
2 Control 7.59 (± 1.71) 15.29 (± 5.35) 12.00 (± 6.65) 12.83 (± 9.44) 7.25 (± 1.89)
Low 9.84 (± 1.91) 4.05 (± 0.33) 4.07 (± 0.47 8.67 (± 3.09) 5.00 (± 1.910
Medium 21.00 (± 8.83) 264.10 (± 122.91) 931.00 (± 187.56) 362.33 (± 215.34) 168.25 (± 123.16)
High 7.00 (± 1.97) 454.69 (± 159.11) 1269.50 (± 155.91) 803.25 (± 265.50) 435.75 (± 320.60)
3 Control 15.88 (± 3.85) 40.06 (± 16.46) 18.00 (± 9.61) 61.33 (± 56.34) 15.50 (± 5.98)
Low 27.42 (± 7.30 12.11 (± 5.04) 13.00 (± 5.60) 14.11 (± 3.73) 10.00 (± 3.14)
Medium 86.90 (± 50.27) 404.10 (± 144.98) 1172.47 (± 155.94) 998.70 (± 228.88) 842.80 (± 332.19)
High 26.50 (± 18.92) 838.94 (± 175.12) 1383.17 (± 116.83) 1190.50 (± 219.83) 1129.50 (± 331.39)
4 Control 38.56 (± 7.85) 251.41 (± 118.65) 153.17 (± 123.06) 434.86 (± 275.02) 8.00 (± 1.00)
Low 87.53 (± 23.94) 122.95 (± 79.05) 37.57 (± 16.25) 170.89 (± 101.87) 153.00 (± 143.35)
Medium 165.45 (± 71.00) 841.55 (± 163.45) 1243.13 (± 137.58) 1067.70 (± 232.19) 1188.40 (± 246.20)
High 42.94 (± 24.78) 1080.63 (± 163.01) 1495.92 (± 4.08) 1448.57 (± 51.43) 1444.50 (± 646.00)
Time to capture prey (seconds)

115
Table A-2
Time (mean SE) it took hybrid striped bass to capture each of four consecutive prey
(fathead minnows) during a 6-day fluoxetine exposure followed by a 6-day recovery
period. Low, medium and high treatments correspond to diazinon concentrations of
(mean SE) 23.2 ± 6.6, 51.4 ± 10.9, and 100.9 ± 18.6 µg/l, respectively.
(Referenced on page 67)
Prey Treatment Day 0 Day 3 Day 6 Day 9 Day 12
1 Control 7.98 (± 3.45) 13.00 (± 7.14) 16.29 (± 8.56) 3.00 (± 0.95) 2.80 (± 1.11)
Low 11.27 (± 2.88) 50.79 (± 19.28) 397.00 (± 146.62) 63.58 (± 17.97) 31.60 (± 18.59)
Medium 1.57 (± 4.22) 329.67 (± 128.1) 465.56 (± 158.31) 432.18 (± 207.1) 176.80 (± 151.12)
High 18.59 (± 8.37) 808.55 (± 152.63) 878.06 (± 163.62) 1129.00 (± 190.16) 1212.00 (± 288.00)
2 Control 26.09 (± 8.79) 23.29 (± 9.2) 44.64 (± 17.58) 6.60 (± 1.85) 6.80 (± 1.83)
Low 37.45 (± 10.36) 414.00 (± 138.97) 575.25 (± 166.22) 732.27 (± 210.11) 328.60 (± 293.66)
Medium 28.19 (± 9.81) 568.95 (± 150.49) 810.19 (± 179.77) 835.75 (± 252.93) 719.40 (± 310.87)
High 37.00 (± 12.48) 1005.59 (± 139.4) 1147.94 (± 145.04) 1279.30 (± 141.39) 1216.00 (± 284.00)
3 Control 159.61 (± 122.84) 215.76 (± 117.6) 293.36 (±136.85) 25.70 (± 10.87) 180.00 (± 163.54)
Low 129.86 (± 29.48) 772.00 (± 148.15) 1256.92 (± 131.49) 1125 (± 186.76) 537.40 (± 310.99)
Medium 96.19 (± 31.55) 844.33 (± 156.6) 1250.00 (± 134.83) 1196.18 (± 174.39) 909.00 (± 361.93)
High 146.36 (± 41.5) 1299.55 (± 93.94) 1353.07 (± 87.51) 1500.00 (± 0.00) 1255.20 (± 244.80)
4 Control 593.04 (± 128.13) 589.18 (± 152.29) 780.93 (± 186.80) 520.00 (± 216.34) 651.60 (± 347.00)
Low 604.81 (± 126.88) 1249.95 (± 116.03) 1378.25 (± 102.29) 1144.36 (± 186.01) 1392.60 (± 107.40)
Medium 502.10 (± 126.96) 1239.00 (± 111.92) 1361.13 (± 97.41) 1257.36 (± 163.00) 1059.20 (± 285.60)
High 671.91 (± 133.37) 1419.64 (± 55.47) 1435.63 (± 64.38) 1500.00 (± 0.00) 1500.00 (± 0.00)
Time to capture prey (seconds)

116
Table A-3
Time (mean SE) it took hybrid striped bass to capture each of four consecutive prey
(fathead minnows) during a 27-day fluoxetine exposure. Low, medium and high
treatments correspond to diazinon concentrations of (mean SE) 0.08 ± 0.02, 0.87 ±
0.12, and 9.44 ± 0.82 µg/l, respectively. (On next page)
(Referenced on page 95)

117
Pre
yTre
atm
ent
Day 0
Day 3
Day 6
Day 9
Day 1
2D
ay 1
5D
ay 1
8D
ay 2
1D
ay 2
4D
ay 2
7
1C
ontr
ol
7.8
0 (
± 3
.04)
2.1
3 (
± 0
.31)
2.6
8 (
± 1
.06)
3.1
8 (
± 1
.08)
3.8
9 (
± 2
.65)
1.0
0 (
± 0
.00)
1.2
5 (
± 0
.25)
4.1
3 (
± 2
.33)
1.6
4 (
± 0
.66)
7.6
0 (
± 6
.60)
Low
9.3
3 (
± 2
.84)
5.2
5 (
± 2
.24)
7.9
5 (
± 4
.92)
6.6
3 (
± 2
.64)
20.4
0 (
± 1
0.0
0)
2.2
5 (
± 0
.59)
1.5
5(±
0.2
8)
2.8
0 (
± 1
.69)
1.2
0 (
± 0
.20)
1.4
0 (
± 0
.40)
Mediu
m6.2
0 (
± 1
.83)
13.4
0 (
± 8
.89)
14.3
7 (
± 8
.22)
4.4
6 (
± 1
.23)
15.3
8 (
± 9
.43)
6.3
3 (
± 4
.25)
2.7
2 (
± 0
.66)
17.0
0 (
± 1
2.4
8)
5.0
5 (
± 4
.00)
3.2
0 (
± 1
.74)
Hig
h4.2
5 (
± 1
.12)
10.0
0 (
± 7
.18)
51.3
2 (
± 2
5.3
0)
22.1
7 (
± 1
2.7
6)
15.6
9 (
± 9
.85)
18.0
0 (
± 1
5.2
4)
16.7
2 (
± 1
4.1
8)
2.5
0 (
± 1
.02)
14.2
0 (
± 1
1.9
6)
3.0
0 (
± 2
.00)
2C
ontr
ol
9.7
5 (
± 2
0.5
1)
9.2
6 (
± 5
.53)
6.0
5 (
± 2
.50)
13.5
0 (
± 4
.61)
10.2
1 (
± 4
.35)
2.4
3 (
± 0
.48)
5.3
8 (
± 2
.04)
7.0
0 (
± 4
.05)
12.9
0 (
± 1
0.5
4)
12.0
0 (
± 9
.26)
Low
26.2
5 (
± 8
.11)
15.7
4 (
± 7
.12)
12.8
9 (
± 5
.82)
36.4
0 (
± 1
5.7
3)
45.0
0 (
± 1
7.2
5)
6.4
0 (
± 3
.03)
6.9
0 (
± 3
.43)
9.1
0 (
± 4
.74)
2.8
0 (
± 0
.20)
4.6
0 (
± 1
.25)
Mediu
m14.1
0 (
± 4
.97)
24.1
0 (
± 1
1.8
522.2
6 (
± 1
1.0
8)
69.0
0 (
± 5
6.5
9)
77.5
4 (
± 4
0.0
7)
31.1
1 (
± 1
5.6
1)
50.8
1 (
± 4
7.0
4)
25.3
3 (
± 1
6.6
2)
33.1
0 (
± 2
4.2
0)
19.8
0 (
± 1
0.3
6)
Hig
h8.9
5 (
± 1
.97)
31.3
0 (
± 1
4.7
6)
132.4
4 (
± 8
3.0
1)
32.4
2 (
± 1
3.3
5)
40.2
3 (
± 2
0.0
8)
31.6
0 (
± 2
0.2
5)
24.1
1 (
± 1
9.7
5)
15.8
0 (
± 9
.36)
36.4
0 (
± 2
1.5
2)
6.2
5 (
± 3
.28)
3C
ontr
ol
39.4
5 (
± 4
3.7
2)
98.5
8 (
± 5
8.8
5)
11.2
1 (
± 3
.82)
80.3
6 (
± 4
5.3
7)
46.2
9 (
± 2
9.0
3)
4.0
0 (
± 0
.49)
31.0
0 (
± 2
3.6
0)
79.8
8 (
± 7
2.9
1)
14.6
0 (
± 1
0.6
1)
64.0
0 (
± 4
6.5
0)
Low
56.6
0 (
± 2
4.4
3)
78.5
0 (
± 4
6.0
5)
66.1
6 (
± 2
8.6
5)
185.1
3 (
± 9
7.3
3)
195.2
7 (
± 1
10.3
2)
12.7
0 (
± 6
.22)
22.0
0 (
± 8
.81)
20.2
0 (
± 1
2.1
4)
7.8
0 (
± 2
.67)
173.2
5 (
± 1
48.4
1)
Mediu
m30.2
0 (
± 8
.91)
147.5
5 (
± 7
9.2
7)
73.1
7 (
± 2
9.8
9)
130.8
5 (
± 1
14.2
2)
207.3
8 (
± 1
14.3
0)
95.1
1 (
± 5
2.8
4)
125.1
3 (
± 1
18.4
3)
74.1
1 (
± 3
8.9
4)
103.2
0 (
± 7
1.4
4)
341.0
0 (
± 2
90.3
9)
Hig
h48.1
5 (
± 1
4.8
8)
217.8
5 (
± 1
01.6
0)
294.2
2 (
± 1
31.9
6)
177.4
2 (
± 1
09.2
2)
232.2
3 (
± 1
17.4
0)
154.0
0 (
± 1
04.9
5)
49.5
6 (
± 3
2.9
4)
105.0
0 (
± 6
7.7
8)
101.6
0 (
± 3
5.3
0)
64.2
5 (
± 5
8.9
3)
4C
ontr
ol
97.0
5 (
± 6
2.9
1)
147.2
1 (
± 1
02.4
6)
136.5
3 (
± 8
0.3
7)
439.7
1 (
± 1
77.5
1)
340.3
6 (
± 1
74.4
3)
8.2
9 (
± 2
.71)
66.8
8 (
± 3
7.2
8)
257.1
3 (
± 1
81.6
0)
34.2
0 (
± 2
4.5
1)
545.0
0 (
± 3
32.0
5)
Low
197.2
5 (
± 8
7.8
3)
255.9
0 (
± 9
9.2
4)
397.7
4 (
± 1
39.3
4)
369.6
0 (
± 1
30.1
1)
415.4
7 (
± 1
53.1
1)
82.1
0 (
± 6
4.6
5)
252.0
0 (
± 1
57.4
2)
200.3
0 (
± 1
49.2
4)
30.4
0 (
± 1
1.7
3)
734.0
0 (
± 2
99.3
7)
Mediu
m260.0
5 (
± 9
2.3
6)
484.0
5 (
± 1
26.7
9)
343.1
6 (
± 1
25.2
2)
249.6
2 (
± 1
54.0
2)
451.4
6 (
± 1
78.0
8)
279.3
3 (
± 1
51.7
3)
201.8
8 (
± 1
85.6
4)
230.3
3 (
± 1
36.3
0)
196.2
0 (
± 1
09.0
8)
447.6
0 (
± 2
70.3
5)
Hig
h211.0
0 (
± 7
9.0
4)
621.5
0 (
± 1
51.2
5)
457.1
1 (
± 1
44.0
9)
500.9
2 (
± 1
54.8
3)
472.2
3 (
± 1
49.2
4)
387.8
0 (
± 1
88.0
0)
243.0
0 (
± 1
60.5
4)
420.3
0 (
± 2
00.1
7)
194.8
0 (
± 8
0.5
5)
228.0
0 (
± 2
12.0
4)
Tim
e t
o c
aptu
re p
rey (
seconds)