change for african firms case of kenyan smes · change for african firms_case of kenyan smes...
TRANSCRIPT

CHANGE FOR AFRICAN
FIRMS_CASE OF KENYAN SMEs
Presentation delivered at the SAFIC WORKSHOP ON SUCCESSFUL AFRICAN FIRMS AND INSTITUTION
CHANGE on 7th December 2017
at the Nairobi Safari Club. NAIROBI KENYA
Ministry of Industry, Trade and Cooperatives State Dept of Investment and Industry
Promoting and Facilitating Industrialization
Amb. Dr. J. K. Kiplagat PhD. OGW. Director, Industrial Information, Research & Policy
Ministry of Industry Trade and Cooperatives [email protected]
Presentation Outline INTRODUCTION: Vision 2030, Africa’s industrial standing.
SMALL AND MICRO ENTERPRISES Constraints, Challenges and Opportunities for change. SMEs: POLICY INTERVENTIONS Access to finance and Market, Institutional support
CONCLUSION Graduation Strategy

Knowledge Vs Effort!
ITEMIZED BILL Tapping with a hammer...... .......... ..................Kshs. 20.00 Knowing where to tap......... .. ......... ...... Kshs. 99,980.00 TOTAL………………………………… …... Kshs.100,000.00
Effort is important, but knowing where to make that effort makes all the difference!

Industrial Sector & Vision 2030 Transform Kenya into a newly industrializing, globally
competitive middle-income country providing a high quality of life to all its citizens by the year 2030
Policy developed in the context of Vision 2030, review of past policies, problems & challenges of industrialization, and experiences from successful economies.

Total GDP, USD Billions
211192
175159
144131
119109
99908274676156514642
29
+10% p.a.
2030 28 27 23 26 24 22 21 20 19 18 17 25 16 15 14 2013
5
We need to grow GDP by $4-6 billion per year for the next 13 years to hit vision 2030
$42
$211

So that Every Kenyan City – Year 2030

Africa’s Vicious Circle
Low per Capita Income
Poor infrastructure
and support for investment
Less Funding for
Development Programs
Reduced interest for Local and FDI in manufacturing
etc
Unemployment High Demand
for Social Support
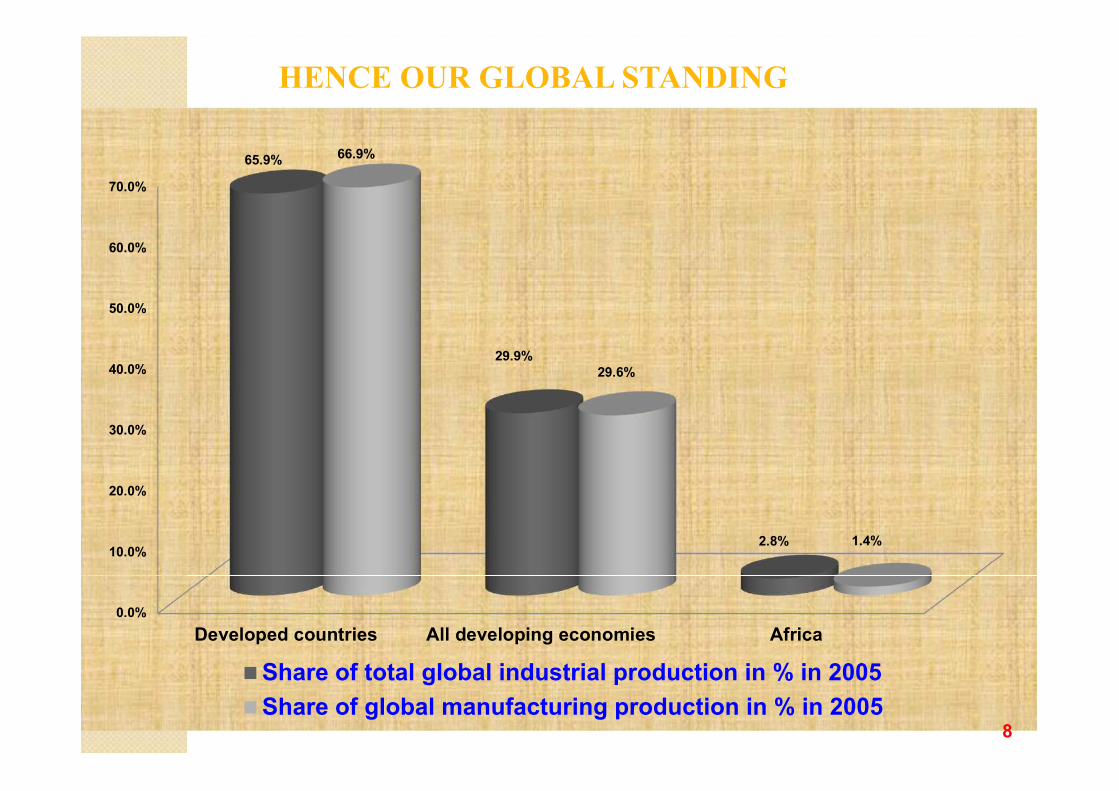
HENCE OUR GLOBAL STANDING
0.0%
10.0%
20.0%
30.0%
40.0%
50.0%
60.0%
70.0%
Developed countries All developing economies Africa
65.9%
29.9%
2.8%
66.9%
29.6%
1.4%
Share of total global industrial production in % in 2005Share of global manufacturing production in % in 2005
8

Manufacturing contribution to GDP % of GDP % of exports
36
28
32
15
17
11
Thailand
Malaysia
South Korea
Morocco
Egypt
Kenya
81
74
92
68
50
11
9
FIGURES DONT LIE!!!
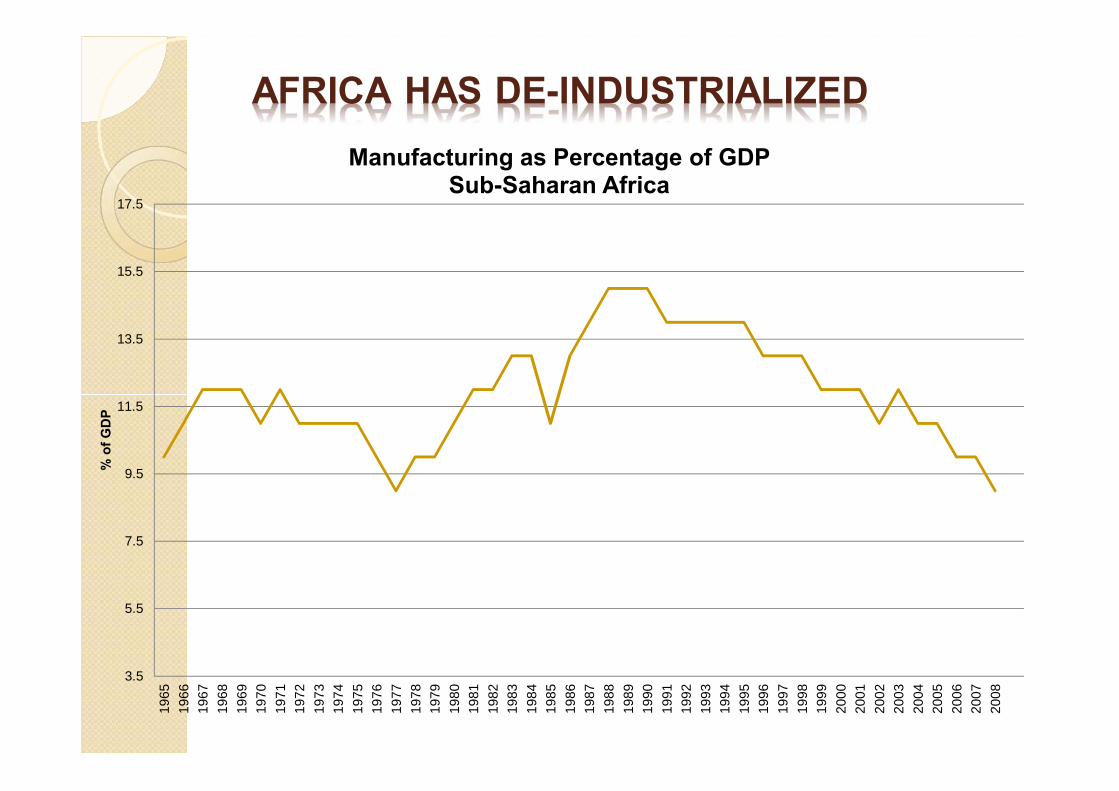
AFRICA HAS DE-INDUSTRIALIZED
3.5
5.5
7.5
9.5
11.5
13.5
15.5
17.5
1965
1966
1967
1968
1969
1970
1971
1972
1973
1974
1975
1976
1977
1978
1979
1980
1981
1982
1983
1984
1985
1986
1987
1988
1989
1990
1991
1992
1993
1994
1995
1996
1997
1998
1999
2000
2001
2002
2003
2004
2005
2006
2007
2008
% o
f GD
P
Manufacturing as Percentage of GDP Sub-Saharan Africa

11
NEW FRONTIER!!!

12
The Golden Lokichar Basin
From Grass to Glory � Kenya is headed to become the first oil
exporter in East Africa, moving in less than six years from being a have-not nation to the regional oil exporter. � After Tullow Oil Plc (TLW) discovered oil in
the Golden Lokichar Basin and Kenya is set to start shipments in 2018, overtaking neighboring Uganda, where Tullow found crude more than nine years ago. � Kenya's deposits may top 10 billion barrels,
more than three times the U.K.'s remaining reserves.
13

14
Before the Oil and Gas!
After the Oil and Gas! Petronas twinTowers
MALAYSIA

Definition of SMEs � MSEs in manufacturing, trading and services
activities � MSEs Act, 2012 oMicro Enterprise: o Jobs < 10 people; o Turnover ≤ KSh 500,000; o Plant/Machinery ≤ Ksh 10,000,000 (Manufacturing):
oSmall Enterprise: o Jobs 10 – 50 people; o Turnover KSh 500,000 - KSh 5,000,000; o Plant/Machinery Ksh 10,000,000-50,000,000(Manufacturing)
o Medium Enterprise: o Jobs 50 – 100 people??
15

SMEs (Informal Sector)- “Old Image”
16

SMES (Informal Sector)- “Old Image”
17

Share of Employment by Activity 1999: 2.4 mil people engaged in informal sector, of which 66% Rural based
2012: 10.5 mil people engaged, of which 66% Rural based.
18
Manufacturing 13%
Trade 64%
Services 15%
Others 8%
Manufacturing
19% Constructio
n 3%
Wholesale & Retail Trade,
Hotels & Restaurants
61%
Transport & Communica
tions 3%
Community, Social & Personal Services
10% Others 4%
Growth rate of 20% p.a.

SME Binding Constraints
19
1) Inadequate access to financial services 2) Limited access to infrastructure and
worksites 3) Poor markets access 4) Inadequate skills and low technologies
employed 5) Low entrepreneurial and business skills 6) Limited linkages with medium and large
enterprises

SME Challenges
� A majority of SMEs across different industries are not able to identify their competitive strengths within the value chains � Some SMEs lack the time (e.g. owner/manager) and
skills to understand the evolving global context and devise appropriate strategies. This, in turn, translates into an insufficient ability to define the adequate business models to gain competitiveness � Many SMEs are mainly concerned with the
inadequate financial resources
20

Role of SMEs in other economies Kenya(Informal sector): Contributes 20% of GDP China:
Contributes 60% of GDP, 50% of tax revenues, 68% of exports and 75% of new jobs, 99% of China's registered enterprises
India: Contributes 40% of GDP, 45% of industrial output, 40% cent
of exports employed 60 million people, creates 1.3 million jobs annually, produce over 8,000 marketable products
Malaysia: Contributes 40% of GDP Singapore:
Contributes 50% of GDP, 70% of employment
21

Opportunities for Kenya SMEs � The policy framework of SMEs in Kenya contained
in: ◦ Kenya Vision 20130 – Economic Pillar -need to boost STI
by increasing investment in Research and Development ◦ Sessional paper No. 9 of 2012 on The National
Industrialization Policy Framework for Kenya 2012-2030 – 21 subsectors identified
◦ Sessional Paper No 2 of 2005: Development of Micro and Small Enterprises for Wealth and Employment Creation for Poverty Reduction - legal and regulatory environment (MSE Act 2012), institutional frameworks to facilitate markets and marketing, business linkages, tax regime, skills and technology and financial services
◦ KITP 2015- assigns SMEs central role 22

Opportunities contd � New niches for the supply of products and services
have emerged where SMEs can quickly position themselves, exploiting their flexibility and ability to move fast. These include participation in innovations and product development (leveraging ICT), subcontracts, franchises, leases, etc)
� Innovating and keeping up with new technologies -
must be seen by SMEs as a requirement for their successful participation in the global supply value chains
23

New Image – Technology, Skills
24

New Image!! – Technology, Skills
25
Policy Interventions- 1.Access to Finance
Financial sector in Kenya well developed and SMEs can strategically position themselves to mitigate their low access to finance
� Development Finance Institutions (DFIs-ICDC etc) � GOK Funds (WEF and YEDF) � Savings and Credit Cooperative Organisations
(SACCOs) � Micro Finance Institutions (MFIs) � Commercial banks � Venture Funds � Capital Markets
26

2. Institutional support
27
Public Support Institutions include: •KIRDI – commercialization of research •KEBS – product quality standards •KIPI – protection of intellectual property rights •KIE – business development services & finance •IDB - business development services & finance •ICDC - business development services & finance •KENINVEST – Attracting investments •EPC – promoting exports •EPZA - Attracting export-oriented investments •NITA – facilitating industrial training •NACOSTI – facilitating STI •PCK – facilitating productivity improvement •MSEA – promoting micro and small enterprises

3. Market access
28
Buy Kenya Build Kenya Policy and Strategy- public procurement, private sector linkages, consumer perception change!
The SMEs enjoy policy backing that allocates 30% of all government procurement to the youth & women
Regional Economic Integration (EAC, COMESA), Bilateral and Multilateral Arrangements (AGOA, EPAs, WTO)

4. SUB-CONTRACTING ARRANGEMENTS � What is Industrial Subcontracting?
◦ Industrial subcontracting and outsourcing are modern and efficient ways to organise industrial production, through cooperation between complementary production units: � a main contractor and various suppliers and subcontractors.
� What are the principal forms of subcontracting? ◦ Subcontracting of industrial production is based, among others, on two important criteria: � production capacity; � When the available production capacity with a main contractor is not sufficient.
� technical specialisation of the enterprise; � When the main contractor wishes to obtain the services of subcontractors who have
specialised equipment or machinery and skilled labour to undertake complex and precision jobs.
� Who are the main contractors? ◦ Generally, large industries engaged in industrial manufacturing, which require a large amount of
parts and components for final assembly. Example is the motor vehicle assembly!
� Who are the subcontractors? ◦ Generally, the small and medium enterprises/industries having specialised in certain
processes and operations, are capable of supplying quality goods as per specifications of the main contractor and at the same time offer advantageous economic terms.
29

SUB-CONTRACTING Best practices from other countries.
Korea: To promote sub-contracting relation the Government of Korea enacted a "SME Subcontracting System Promotion Act" to promote subcontracting. It:- ◦ requires large scale business to make subcontract plans with the appropriate SMEs
◦ prevents differed payments by a large scale business beyond legal limitations
◦ sets up the subcontracting Promotion Council.
� Generous financial and fiscal support like tax waivers, is provided by the Government to subcontracting SMEs.
Taiwan: Taiwan has industrialized in a short time by making a policy of industrial development through promoting specialization and efficiency. � Centre–Satellite factory promotion program aims to organize and integrate smaller
enterprises around a principal one: inter-linkage. � The government promotes backward linkages by foreign investors.
Japan: In Japan, sub-contracting has been pursued as a constant policy experience for a long period of time. POWERING THE AUTO INDUSTRY!!! � Sub-contracting covers a wide range of Japan’s industrial activities but is essentially cantered on
the machinery, textile, and metal industries. Trends in sub-contracting dependency ratio (proportion of sub-contracting transaction to the total sales value of manufactured products) is above 80%
30

Institutional Change: “The Big Four” 20% of GDP from the manufacturing sector
1 million affordable new houses for Kenyan families
Transforming societies
Transforming the nation
Transforming lives 100%
Universal Health Coverage (UHC)
Competitive cost of power
Security Technology innovation
Targeted infrastructure investments
Governance
Youth in jobs through vocational training and education
INTERNAL TARGETS
Food and Nutrition Security
100%

Critical drivers
20% GDP Contribution
by Manufacturing
Employment Creation
Enhanced Investments
Structural Transformation through Value Addition
20% Contribution to GDP by Manufacturing
Leather and Leather Products
Agro-Processing
Textiles and Apparels
Construction Materials
Fish Processing
Oil and Gas
Small and Medium Enterprises (SME) Development
Market Access
Industrial Zones and Parks
Information – Technology Related Sectors
1
2
3
4
7
5
6
8
9
10
Ease of Doing Business 11

Textiles & Apparel
Leather and Leather Products
Agro-Processing
Fish Processing
Construction Materials
Delivering together as a team Treasury Infrastructure Energy Agriculture Environment
1
2
3
4
5 § Budget § Incentives
§ Budget § PPP model
revamped § Incentives
§ Budget § PPP Model –
Agropolis § Incentives
§ Budget § PPP Model –
revamped § Incentives
§ Budget § PPP Model
revamped § Incentives
§ Access Roads to factory clusters
§ Fish Berth developed.
§ Lamu SEZ infrastructure developed
§ Offsite Infrastructure – Agro-polis
§ Off-site infrastructure to Textiles Hub Athiriver & Naivasha
§ Electricity Provided
§ Electricity provided to ponds
§ Electricity and Geothermal power provided to Park
§ N/A
§ Marine, Fresh Water & Aquaculture policies revamped
§ Agro-produce cold chain and production
§ Animal husbandry for Hides and Skins
§ Roll out of BT cotton
§ Electricity provided to Agropolis & SME Industrial Parks
§ Offsite Infrastructure at leather park (s)
§ Electricity and Geothermal power provided to Park
Lands
§ Acquire land § Approvals for EIA & SEIA
§ Approvals for EIA & SEIA
§ Acquire land
§ Approvals for EIA & SEIA
§ Acquire land
§ Approvals for EIA & SEIA
§ Acquire land
§ Approvals for EIA & SEIA
§ Acquire land

34

ORGANIC GROWERS/PACKERS MALINDI, KENYA
35

36

High per Capita Income
Low Demand for Social Support
More Funding for
Development Programs
Good infrastructure and support
for investment
Increased interest for Local and
FDI
Employment Food & Energy
Security Disease Free
AFRICA’S’S SUCCESS STORY