change and disadvantage in regional victoria ... - planning
TRANSCRIPT
2011
Change and disadvantage in
regional Victoria: an overviewMay 2011

Change and disadvantage in regional Victoria: an overview 2
Prepared by:
Jeanette Pope, Policy and Strategy, Department of Planning and Community Development (DPCD).
(03) 92083849 or [email protected]
May 2011
Acknowledgement of data source
DPCD gratefully acknowledges the Department of Health and its two data collation products
from which most of the data for this report has been drawn:
› 2009 Local Government Area Statistical Profi les (DHS 2009)
› Town and Community Profi les 2008 (DHS 2009)
LGA profi les now available online: www.health.vic.gov.au/modelling/planning.htm
A note of the limitations of data to describe disadvantage
There is a signifi cant paucity of data to describe disadvantage, particularly at the small area
level, in Australia. Measuring disadvantage in individuals requires measuring the wide range of
factors that contribute to standard of living (Figure 2). Most surveys do not collect this detail.
Only a few composite measures exist that combine a range of variables, notably, the Australian
Bureau of Statistics’ (ABS) fi ve Socio-economic Indices for Areas (SEIFA) (that combine
information about income, education, occupation, wealth and living conditions) (ABS 2006).
In addition, some disadvantaged population groups are very small, or are hard to identify, and
are not routinely detected in population surveys (for example, Indigenous Victorians, refugees
and people with a disability). These issues mean there are signifi cant data gaps in this report.
Acronyms
ABS Australian Bureau of Statistics
AEDI Australian Early Development Index
DPCD Department of Planning and Community Development
LGA Local Government Area
SEIFA Socio-economic Indices for Areas
IRSD Index of Relative Socio-economic Disadvantage
Copyright & Disclaimer
The materials presented in this report are for information purposes only. The information is provided
solely on the basis that readers will be responsible for making their own assessments of the matters
discussed and are advised to verify all relevant representations, statements and information and obtain
independent advice before acting on any information contained in or in connection with this report.
While every effort has been made to ensure that the information is accurate the Department of Planning
and Community Development will not accept any liability for any loss or damage which may be incurred
by any person acting in reliance upon the information.

Change and disadvantage in regional Victoria: an overview 3
Contents
Introduction and summary . . . . . . . . . . . . . . . . . . . . . . . . . . . . . . . . . . . . . . . . . . . . . . . . . . . . . . . . 4
What is disadvantage? . . . . . . . . . . . . . . . . . . . . . . . . . . . . . . . . . . . . . . . . . . . . . . . . . . . . . . . . . . . 7
How is change impacting on disadvantage? . . . . . . . . . . . . . . . . . . . . . . . . . . . . . . . . . . . . . . . . . . . 9
Conclusion and what can be done . . . . . . . . . . . . . . . . . . . . . . . . . . . . . . . . . . . . . . . . . . . . . . . . . 14
Appendix A: The full list of relatively disadvantaged towns in regional Victoria . . . . . . . . . . . . . . . . . 15
Appendix B: Select risk factors for disadvantage by LGA . . . . . . . . . . . . . . . . . . . . . . . . . . . . . . . . 24
References . . . . . . . . . . . . . . . . . . . . . . . . . . . . . . . . . . . . . . . . . . . . . . . . . . . . . . . . . . . . . . . . . . . 27

Change and disadvantage in regional Victoria: an overview 4
The following is an overview of fi ve reports
describing disadvantage in Victoria’s regions of
Barwon South West, Grampians, Loddon Mallee,
Hume and Gippsland (Figure 1). It compiles data
from across the reports to describe disadvantage
across regional Victoria as a whole. The fi ve
separate region reports are available on the
DPCD website (www.dpcd.vic.gov.au>
Publications & Research>Urban and Regional
Research>Regional Victoria).
The fi ve region reports provide maps of
disadvantaged suburbs and towns (by
Local Government Area (LGA)). The maps
are based on the Australian Bureau of
Statistics Index of Relative Socio-economic
Disadvantage (IRSD) 2006 (ABS 2010). This
index combines census variables relating to
income, education, occupation, wealth and
living conditions and ranks localities on a
continuum of advantage to disadvantage.
Accompanying each map is a table that
describes the population make up of the most
disadvantaged suburbs and towns. These
tables show disadvantage affects different
types of people in different localities. Some
are predominantly aging populations, some
working populations and some concentrations of
welfare recipients. Some areas have a signifi cant
multicultural mix, while others do not. These
differences mean different strategies may need to
be adopted across the localities.
A full list of the towns that are relatively
disadvantaged in regional Victoria can be seen
at Appendix A but a summary of the most
disadvantaged 100 localities is provided at Table
1. The cut off at 100 is arbitrary. The index is a
relative index and it is not clear what differences
in the scores mean in terms of the absolute
magnitude of disadvantage. Of note is the large
number of suburbs in regional centres on the list.
Introduction and summary
Figure 1. The Victorian government regions
Gippsland
HumeGrampians
Barwon South-West
LoddonMallee

Change and disadvantage in regional Victoria: an overview 5
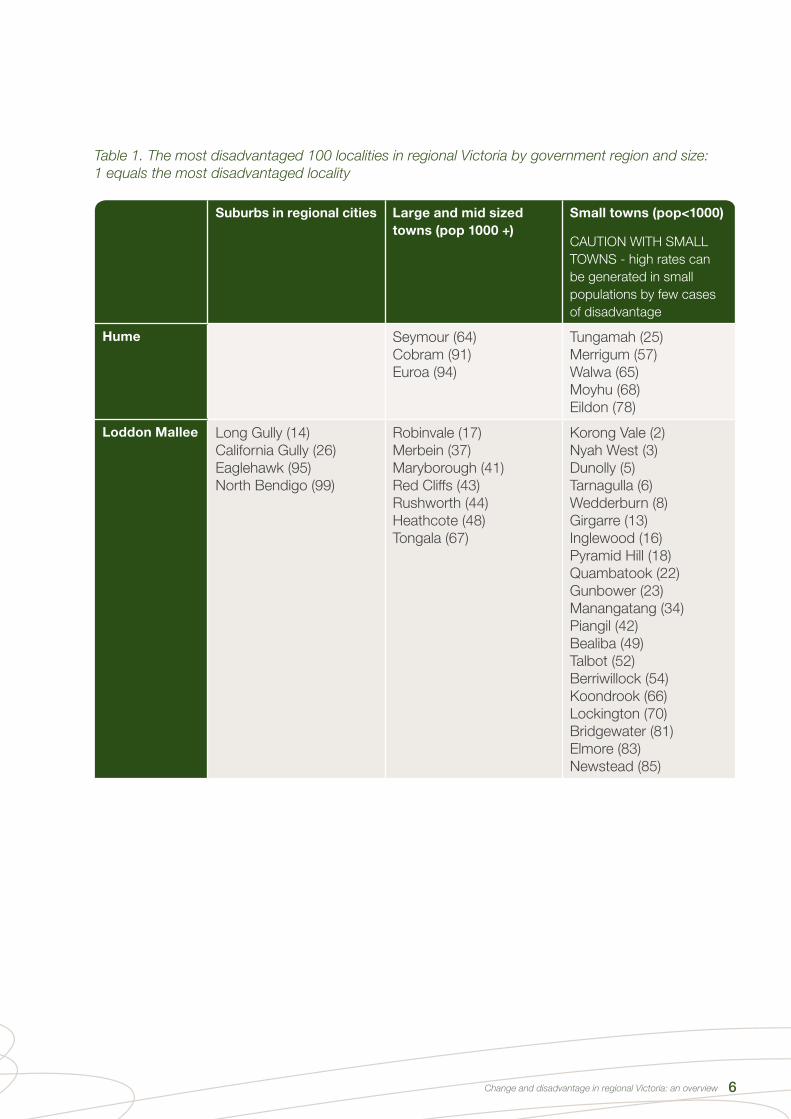
Table 1. The most disadvantaged 100 localities in regional Victoria by government region and size:
1 equals the most disadvantaged locality
Suburbs in regional cities Large and mid sized
towns (pop 1000 +)
Small towns (pop<1000)
CAUTION WITH SMALL
TOWNS - high rates can
be generated in small
populations by few cases
of disadvantage
Barwon South
West
Norlane (1)
Whittington (7)
Thomson (11)
Corio (30)
Bell Park (51)
Breakwater (63)
North Geelong (77)
Newcomb (79)
Heywood (28)
Casterton (58)
Winchelsea (86)
Lismore (9)
Glenthompson (19)
Merino (29)
Dartmoor (55)
Penshurst (69)
Coleraine (71)
Derrinallum (100)
Gippsland Morwell (21)
Orbost (24)
Moe-Yallourn (46)
Heyfi eld (47)
Yarram (80)
Wonthaggi (84)
Yallourn North (93)
Lake Tyers (10)
Cann River (15)
Loch Sport (20)
Toora (36)
Port Albert (56)
Buchan (59)
Coronet Bay (61)
Dalyston (62)
Grantville (88)
Corinella (89)
Rawson (92)
Venus Bay (96)
Bruthen (97)
Longwarry (98)
Grampians Wendouree (39)
Sebastopol (45)
Redan (72)
Beaufort (40)
Warracknabeal (50)
Clunes (53)
Stawell (73)
Dimboola (75)
St Arnaud (82)
Ararat (87)
Apsley (4)
Jeparit (12)
Beulah (27)
Woomelang (31)
Avoca (32)
Willaura (33)
Goroke (35)
Minyip (38)
Edenhope (60)
Smythesdale (74)
Rainbow (76)
Murtoa (90)
Change and disadvantage in regional Victoria: an overview 6
Suburbs in regional cities Large and mid sized
towns (pop 1000 +)
Small towns (pop<1000)
CAUTION WITH SMALL
TOWNS - high rates can
be generated in small
populations by few cases
of disadvantage
Hume Seymour (64)
Cobram (91)
Euroa (94)
Tungamah (25)
Merrigum (57)
Walwa (65)
Moyhu (68)
Eildon (78)
Loddon Mallee Long Gully (14)
California Gully (26)
Eaglehawk (95)
North Bendigo (99)
Robinvale (17)
Merbein (37)
Maryborough (41)
Red Cliffs (43)
Rushworth (44)
Heathcote (48)
Tongala (67)
Korong Vale (2)
Nyah West (3)
Dunolly (5)
Tarnagulla (6)
Wedderburn (8)
Girgarre (13)
Inglewood (16)
Pyramid Hill (18)
Quambatook (22)
Gunbower (23)
Manangatang (34)
Piangil (42)
Bealiba (49)
Talbot (52)
Berriwillock (54)
Koondrook (66)
Lockington (70)
Bridgewater (81)
Elmore (83)
Newstead (85)
Table 1. The most disadvantaged 100 localities in regional Victoria by government region and size:
1 equals the most disadvantaged locality

Change and disadvantage in regional Victoria: an overview 7
Disadvantage occurs when an individual, family
or community is deprived of resources or
opportunities – enjoyed by other Victorians –
that underpin social and economic wellbeing.
Disadvantaged people and communities
lack either material resources (income,
housing, services, transport), skills/knowledge
resources (education, health) or “social capital”
resources (social participation, inclusion, strong
governance) (Figure 2). For approximately 10%
of the Australian population deprivation in these
areas signifi cantly impacts on their wellbeing
and they are described as living in poverty. An
additional 10% are thought to be “at risk” of
poverty (Australian Government 2009).
Disadvantage has been shown to be
geographically concentrated (PHIDU 2010 –
Atlases of census data since 1999; ABS 2010)
and some population groups are consistently
overrepresented in data about disadvantage. In
Australia these groups are:
› aged persons;
› public housing renters;
› Aborigines and Torres Strait Islanders;
› one parent families;
› people with non-English speaking
backgrounds;
› the unemployed;
› private renters; and
› people with a disability (Australian Government
2009; Saunders & Wong 2009).
What is disadvantage?
Skills & knowledge
(Human Capital)
Connectedness
Social participation
Positive socialisation:
inclusive, tolerant, safe
Involvement in
decision-making
Income, jobs
Secure housing
Services available
Infrastructure
Transport
Education
Training
Workforce participation
Good Health
Local leadership
Relationships (Social Capital)
Material Resources
(Economic Capital)
Resilient families
Resilient communities
Figure 2. The resources that contribute to an individual, family or community’s
social and economic wellbeing

Change and disadvantage in regional Victoria: an overview 8
Regional Victoria has a larger proportion than
metropolitan Melbourne of most of these
population groups: aged persons, public housing
tenants, private renters, Aborigines and Torres
Strait Islanders, unemployed and people with a
disability (Table 2). Some groups, however, make
up a much smaller proportion including people
with non-English speaking backgrounds and new
settler arrivals (Table 2).
For these latter groups the overall magnitude
of disadvantage may be small (in terms of
numbers), but they may be marginalised, and not
well catered for in communities because of a lack
of critical mass.
Table 2. Select population groups (over represented in disadvantage statistics) in metropolitan
Melbourne and regional Victoria
Metropolitan
Melbourne
Regional
Victoria
Aged persons 12.7% 16.0%
Public housing stock 4.0% 4.2%
Aborigines and Torres Strait Islanders 0.43% 1.27%
One parent families 15.4% 15.4%
People with non-English speaking backgrounds 27.9% 4.8%
New settler arrivals per 100 000 population 148.1 696.1
Unemployment rate (March 2009) 5.1% 5.3%
Private renters 16.8% 21.8%
People with a disability (core activity need for assistance) 4.3% 5.0%

Change and disadvantage in regional Victoria: an overview 9
Regional Victoria is changing – both
economically and demographically. The fi ve
region reports describe three major changes
that impact on disadvantage.
1. The fi rst change is economic restructure
that is resulting in decreased economic
opportunities for some residents.
The economy has been substantially
restructuring in regional Victoria. The primary
industry of agriculture is transforming from one
dominated by many small family run farms to one
characterised by larger corporate ones run with
new production methods to increase productivity
(Barr 2009). Towns that were once reliant
on agricultural support are changing. Some
have become more reliant on manufacturing,
tourism and service provision (DIIRD 2010).
Manufacturing in some places is also in decline.
An illustration of the magnitude of the change
across regional Victoria can be seen in the
industries in which people were employed from
1986 to 2006 (Figure 3). Across regional Victoria
a signifi cantly smaller proportion of people now
work in Agriculture, Forestry and Fishing and
Manufacturing, with a larger proportion employed
in construction and service industries (Retail Trade, Accommodation and Food Services,
Health Care and Social Assistance) (Figure 3).
Some residents are not well prepared for the
change in the economy. One in fi ve workers in
regional Victoria are unskilled or semi skilled
(Table 2, Appendix B). Research has shown
that skilled workers have portable skills and can
deal well with change, while others (for example,
from manufacturing) have limited specifi c skills
and fi nd it diffi cult to fi nd employment in other
industries (SGS Economic and Planning 2010).
In addition, regional Victoria has less diversity
of employment options (Figure 4), and fewer
opportunities to retrain, which makes unskilled
workers vulnerable when industries restructure.
The issue of a mismatch between unskilled
workers and increasingly skilled work could
perpetuate in regional Victoria given it has a
signifi cant proportion of children entering school
developmentally vulnerable (12%), more young
people not staying at school through years 10 to
12 (23%), and more young people aged 15 to 19
who are not engaged in school, work or further
education/training (19%) (Table 3 and Appendix
B for a full set of LGA data). For all these risk
factors rates are higher in regional Victoria than in
metropolitan Melbourne (Table 3).
16
14
12
10
8
6
4
2
0
Accom & Food Services
Ag, Forestry and Fishing
Manufacturing Construction Healthcare & Social Assistance
Education & Training
Retail Trade Public Admin & Safety
1986 1996 2006
%
How is change impacting on disadvantage?
Figure 3: Proportion of employed persons, by selected industry, regional Victoria, 1986-2006 (DPCD 2010b)

Change and disadvantage in regional Victoria: an overview 10
Table 3. Select risk factors for disadvantage in metropolitan Melbourne and regional Victoria
Regional
Victoria
Metropolitan
Melbourne
Unskilled or semi skilled workers 19.3% 14.6%
Children developmentally vulnerable in their fi rst
year of school
12% 10%
Young people not staying at school through years 10 to 12 23% 15%
Young people aged 15 to 19 who are not engaged in
school, work or further education/training
19.0% 16.7%
Figure 4. Economic diversity*, Statistical Local Areas, 2001 (DSE 2005)
Diversity Index
95.5 to 96.0
95.0 to 95.4
90.0 to 94.9
65.0 to 89.9
* Index score of 100 = complete diversifi cation with employment spread evenly across all industry types.
Index score of 0 = employment concentrated in a single area.

Change and disadvantage in regional Victoria: an overview 11
2. The second change is shifting population
compositions that result in the need for
services and business to restructure.
The economic changes described in point
1, particularly in agriculture, are causing the
purpose of many regional towns to change.
As a result, many places also have changing
population compositions. Some localities are
experiencing decline and aging as they are no
longer needed as service support towns for
small farms (the red dots in Figure 5). Others
are growing as they become the new large
service towns or as they become attractive to
“amenity migrants” – weekenders, commuters,
“downshifters” or affl uent retirees (the blue dots
in Figure 5).
The need for a change in services and
businesses affects both towns in growth and
decline. Towns that are growing may experience
pressure on their existing services or have a
need for new or different services. Towns in
decline may have diffi culty keeping their services
and facilities viable (schools, health services,
sporting clubs, etc).
This may mean residents have to travel for
services and this may become an increasing
problem as they age or if they have transport
limitations. The issue of service access is of
particular importance to disadvantaged people
who are more likely to have a greater range of
service needs due to worse physical and mental
health, lower assets and incomes, etc.
In all towns there will be a need to attract staff
to run services. Some areas in regional Victoria
have trouble attracting skilled workers because
of lower incomes, lack of premium housing or
low perceived amenity in particular areas (DIIRD
2010). This problem is likely to be exacerbated
by the out migration of young people, who can
replace retiring workers, and work in areas of
increasing demand as the population ages (such
as health care). In some areas however, the loss
of young people may be compensated for by the
in-migration of amenity migrants.
Figure 5. Population change in Victorian Towns 1981-2006 (DPCD 2008a)
No. of persons
5000
2500
500
-500
-2500
Change and disadvantage in regional Victoria: an overview 12
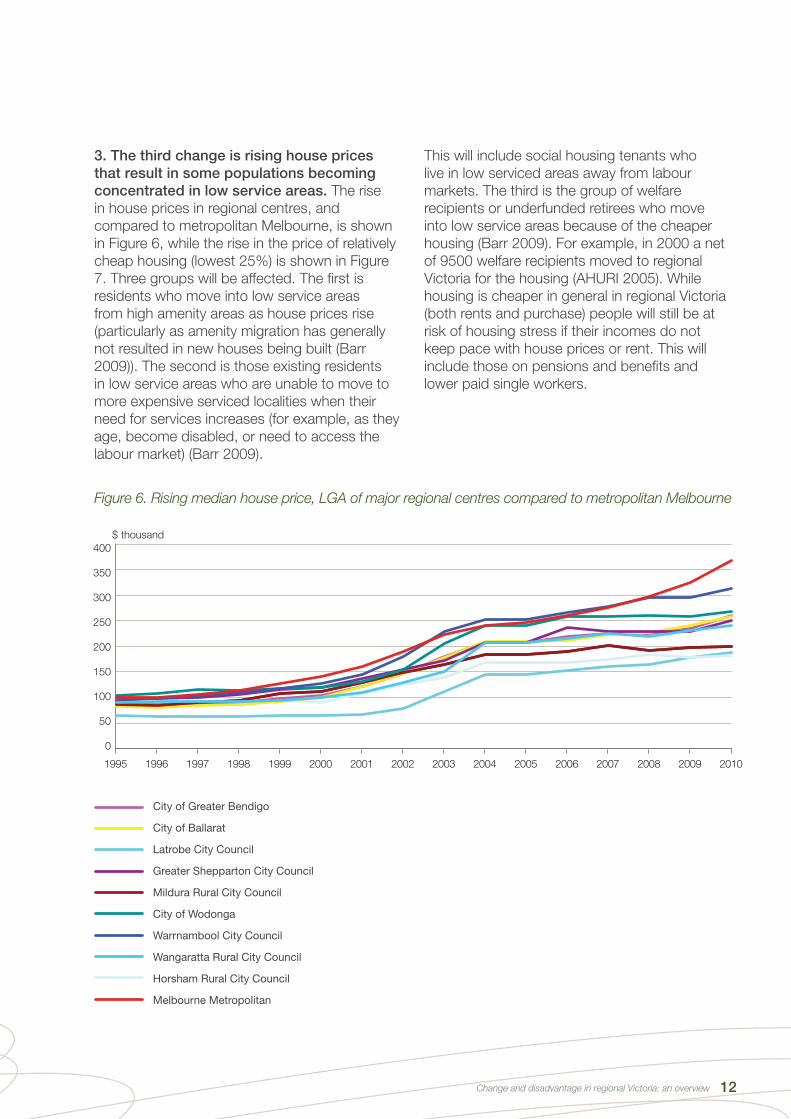
3. The third change is rising house prices
that result in some populations becoming
concentrated in low service areas. The rise
in house prices in regional centres, and
compared to metropolitan Melbourne, is shown
in Figure 6, while the rise in the price of relatively
cheap housing (lowest 25%) is shown in Figure
7. Three groups will be affected. The fi rst is
residents who move into low service areas
from high amenity areas as house prices rise
(particularly as amenity migration has generally
not resulted in new houses being built (Barr
2009)). The second is those existing residents
in low service areas who are unable to move to
more expensive serviced localities when their
need for services increases (for example, as they
age, become disabled, or need to access the
labour market) (Barr 2009).
This will include social housing tenants who
live in low serviced areas away from labour
markets. The third is the group of welfare
recipients or underfunded retirees who move
into low service areas because of the cheaper
housing (Barr 2009). For example, in 2000 a net
of 9500 welfare recipients moved to regional
Victoria for the housing (AHURI 2005). While
housing is cheaper in general in regional Victoria
(both rents and purchase) people will still be at
risk of housing stress if their incomes do not
keep pace with house prices or rent. This will
include those on pensions and benefi ts and
lower paid single workers.
Figure 6. Rising median house price, LGA of major regional centres compared to metropolitan Melbourne
City of Greater Bendigo
City of Ballarat
Latrobe City Council
Greater Shepparton City Council
Mildura Rural City Council
City of Wodonga
Warrnambool City Council
Wangaratta Rural City Council
Horsham Rural City Council
Melbourne Metropolitan
400
350
300
250
200
150
100
50
0
1995 1996 1997 1998 1999 2000 2001 2002 2003 2004 2005 2006 2007 2008 2009 2010
$ thousand

Change and disadvantage in regional Victoria: an overview 13
Figure 7. Rising cost of relatively cheap housing (i.e. the 25th percentile house price) LGA of major
regional centres compared to metropolitan Melbourne
400
350
300
250
200
150
100
50
0
1995 1996 1997 1998 1999 2000 2001 2002 2003 2004 2005 2006 2007 2008 2009 2010
$ thousand
City of Greater Geelong
City of Greater Bendigo
City of Ballarat
Latrobe City Council
Greater Shepparton City Council
Mildura Rural City Council
City of Wodonga
Warrnambool City Council
Wangaratta Rural City Council
Horsham Rural City Council
Melbourne Metropolitan

Change and disadvantage in regional Victoria: an overview 14
The fi ve region reports show signifi cant economic
and demographic changes are occurring across
regional Victoria that are resulting in:
› a decrease in economic opportunities for
residents in some areas, particularly for
unskilled workers;
› a need for services and business to restructure
because of the change in the population
compositions of towns; or
› the concentration of disadvantage in certain
areas because of rising housing costs in some
areas with others failing to keep pace.
These three changes impact on the distribution
of disadvantage.
The reports also show that disadvantage is
clustered in different localities and that each
has a different mix of people. In some areas
disadvantage is characterised by an aging
population, in others by a working population that
is precariously employed, in others by a diverse
group of welfare recipients.
These fi ndings highlight the importance of
collaborative planning for examining solutions
matched to disadvantaged locality’s economy,
assets, demographics, needs and interests.
The complex and multidimensional nature of
disadvantage means that the efforts of a range of
agencies will be needed to reduce it or lessen its
impacts. No single agency holds all the levers to
the factors outlined in the beginning of this report
as making a difference to social and economic
wellbeing (Figure 2). The roles played by different
agencies include:
› the Commonwealth government in employment
policy, income support, the tax transfer system
(including pensions and benefi ts, etc), housing,
health and other social programs;
› the State government in providing or
subsidising essential services (health, education
and training, etc), planning policy, housing,
support for economic development, reducing
barriers to opportunity and supporting
disadvantaged groups and places;
› local governments in the economic
development of local areas, providing services
(early years, aged care, youth services) and in
community development; and
› non-government organisations in providing
services and advocating on behalf of
disadvantaged groups.
Because of its complexity, reducing disadvantage
will require collaboration. It will require
partnerships of agencies bringing a range
of resources to bear on the issue. In the fi rst
instance, it will require processes that bring
together empirical, expert, strategic and local
knowledge to identify strategic priorities and
locally appropriate solutions. It will also involve
building the capacities of both communities and
agencies to mount effective responses.
It is likely that disadvantage in regional Victoria
has further changed over the period since the
2006 census. The ABS will be re-running the
census in 2011 and the disadvantage reports
will be able to be updated when new Index of
Relative Socio-economic Disadvantage data
when it is released.
Conclusion and what can be done

Change and disadvantage in regional Victoria: an overview 15
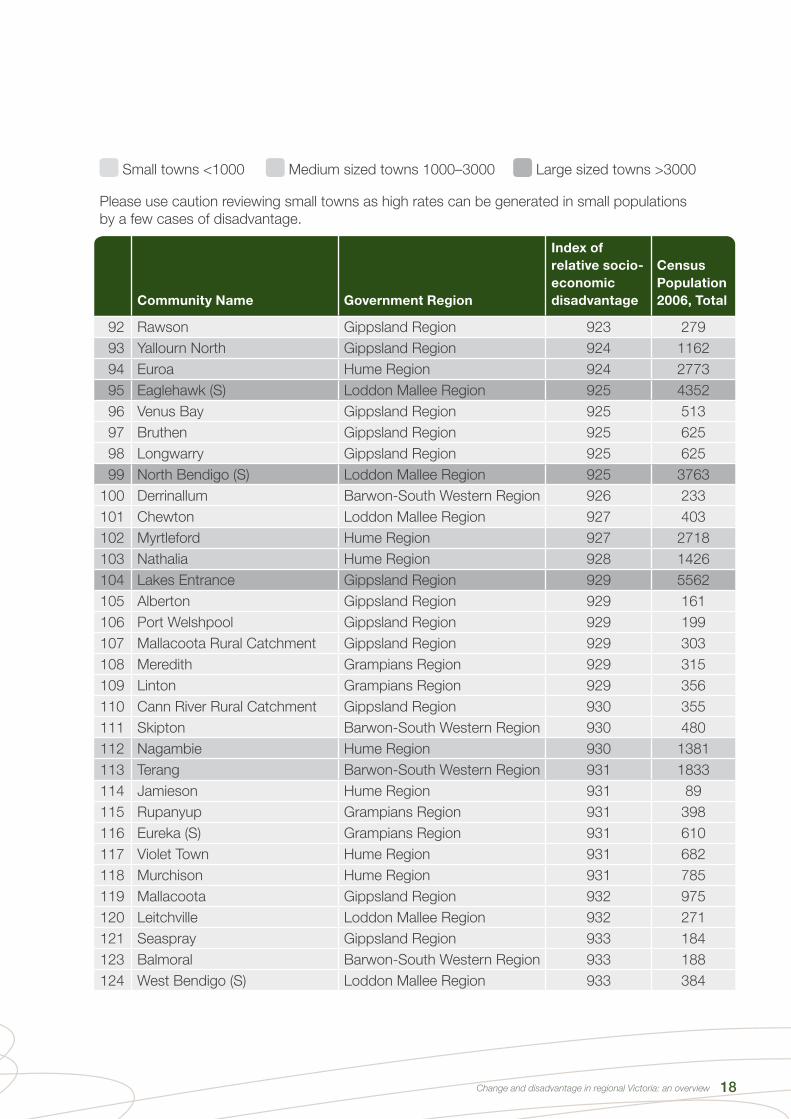
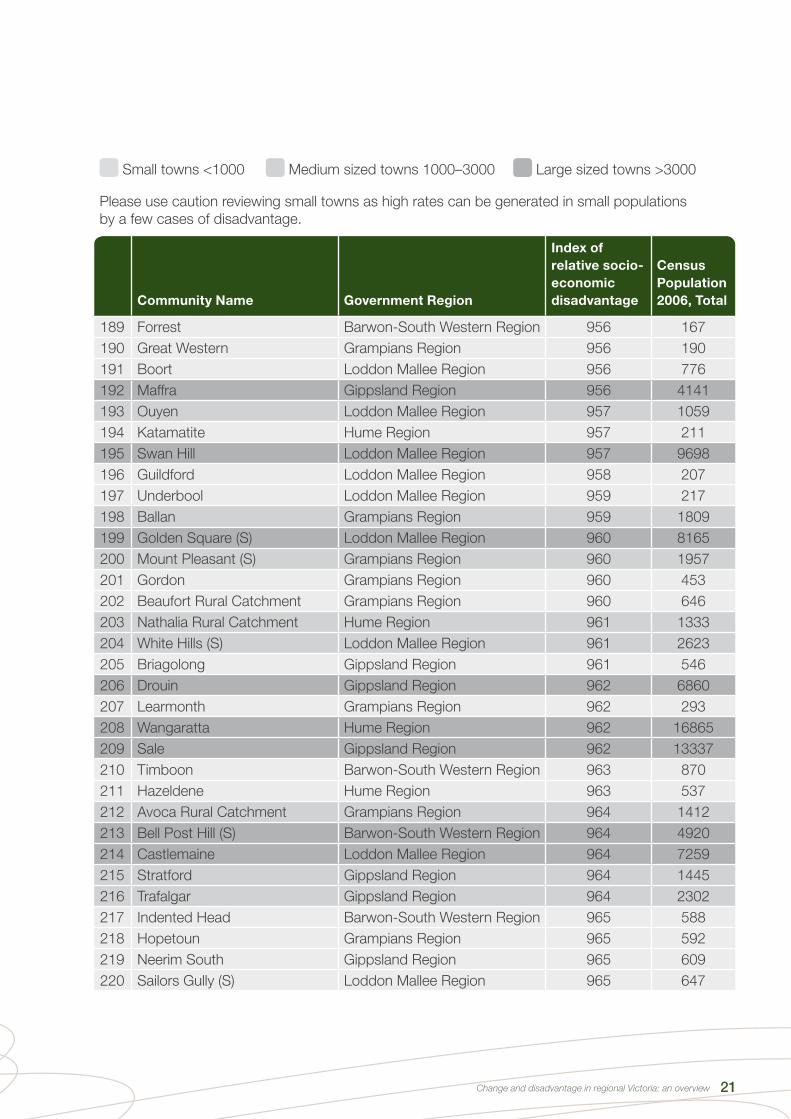
Appendix A: The full list of relatively disadvantaged towns in regional Victoria
Towns that score under the Regional Victorian average (986) on the Index of Relative Socio-Economic
Disadvantage. The list shows localities that are relatively disadvantaged in regional Victoria.
Small towns <1000 Medium sized towns 1000–3000 Large sized towns >3000
Please use caution reviewing small towns as high rates can be generated in small populations
by a few cases of disadvantage.
Community Name Government Region
Index of
relative socio-
economic
disadvantage
Census
Population
2006, Total
1 Norlane (S) Barwon-South Western Region 759 7947
2 Korong Vale Loddon Mallee Region 788 168
3 Nyah West Loddon Mallee Region 804 553
4 Apsley Grampians Region 816 166
5 Dunolly Loddon Mallee Region 817 607
6 Tarnagulla Loddon Mallee Region 825 155
7 Whittington (S) Barwon-South Western Region 827 4227
8 Wedderburn Loddon Mallee Region 831 697
9 Lismore Barwon-South Western Region 831 286
10Lake Tyers Beach Rural
CatchmentGippsland Region 841 439
11 Thomson (S) Barwon-South Western Region 842 1605
12 Jeparit Grampians Region 842 375
13 Girgarre Loddon Mallee Region 851 186
14 Long Gully (S) Loddon Mallee Region 852 3287
15 Cann River Gippsland Region 853 224
16 Inglewood Loddon Mallee Region 853 685
17 Robinvale Loddon Mallee Region 858 2211
18 Pyramid Hill Loddon Mallee Region 862 463
19 Glenthompson Barwon-South Western Region 863 143
20 Loch Sport Gippsland Region 863 772
21 Morwell Gippsland Region 866 13393
22 Quambatook Loddon Mallee Region 867 253
23 Gunbower Loddon Mallee Region 867 266
24 Orbost Gippsland Region 868 2096
25 Tungamah Hume Region 869 354
26 California Gully (S) Loddon Mallee Region 870 3842
27 Beulah Grampians Region 871 218

Change and disadvantage in regional Victoria: an overview 16
Small towns <1000 Medium sized towns 1000–3000 Large sized towns >3000
Please use caution reviewing small towns as high rates can be generated in small populations
by a few cases of disadvantage.
Community Name Government Region
Index of
relative socio-
economic
disadvantage
Census
Population
2006, Total
28 Heywood Barwon-South Western Region 873 1288
29 Merino Barwon-South Western Region 875 205
30 Corio (S) Barwon-South Western Region 876 15114
31 Woomelang Grampians Region 879 193
32 Avoca Grampians Region 881 948
33 Willaura Grampians Region 881 286
34 Manangatang Loddon Mallee Region 882 264
35 Goroke Grampians Region 885 250
36 Toora Gippsland Region 885 481
37 Merbein Loddon Mallee Region 888 1976
38 Minyip Grampians Region 889 461
39 Wendouree (S) Grampians Region 891 10747
40 Beaufort Grampians Region 892 1073
41 Maryborough Loddon Mallee Region 892 7687
42 Piangil Loddon Mallee Region 893 164
43 Red Cliffs Loddon Mallee Region 893 2742
44 Rushworth Loddon Mallee Region 894 1038
45 Sebastopol (S) Grampians Region 895 8046
46 Moe-Yallourn Gippsland Region 895 15580
47 Heyfi eld Gippsland Region 896 1461
48 Heathcote Loddon Mallee Region 897 1568
49 Bealiba Loddon Mallee Region 898 116
50 Warracknabeal Grampians Region 899 2497
51 Bell Park (S) Barwon-South Western Region 899 4651
52 Talbot Loddon Mallee Region 900 294
53 Clunes Grampians Region 902 1025
54 Berriwillock Loddon Mallee Region 902 122
55 Dartmoor Barwon-South Western Region 902 216
56 Port Albert Gippsland Region 902 248
57 Merrigum Hume Region 902 451
58 Casterton Barwon-South Western Region 903 1658
59 Buchan Gippsland Region 904 112

Change and disadvantage in regional Victoria: an overview 17
Small towns <1000 Medium sized towns 1000–3000 Large sized towns >3000
Please use caution reviewing small towns as high rates can be generated in small populations
by a few cases of disadvantage.
Community Name Government Region
Index of
relative socio-
economic
disadvantage
Census
Population
2006, Total
60 Edenhope Grampians Region 904 784
61 Coronet Bay Gippsland Region 905 643
62 Dalyston Gippsland Region 907 278
63 Breakwater (S) Barwon-South Western Region 907 1051
64 Seymour Hume Region 907 6064
65 Walwa Hume Region 909 88
66 Koondrook Loddon Mallee Region 909 802
67 Tongala Loddon Mallee Region 910 1257
68 Moyhu Hume Region 910 213
69 Penshurst Barwon-South Western Region 910 461
70 Lockington Loddon Mallee Region 911 420
71 Coleraine Barwon-South Western Region 911 992
72 Redan (S) Grampians Region 911 2958
73 Stawell Grampians Region 912 5884
74 Smythesdale Grampians Region 913 281
75 Dimboola Grampians Region 913 1490
76 Rainbow Grampians Region 914 497
77 North Geelong (S) Barwon-South Western Region 914 2670
78 Eildon Hume Region 915 743
79 Newcomb (S) Barwon-South Western Region 915 4346
80 Yarram Gippsland Region 916 1718
81 Bridgewater Loddon Mallee Region 917 394
82 St Arnaud Grampians Region 918 2271
83 Elmore Loddon Mallee Region 919 693
84 Wonthaggi Gippsland Region 920 6528
85 Newstead Loddon Mallee Region 920 487
86 Winchelsea Barwon-South Western Region 921 1334
87 Ararat Grampians Region 921 7162
88 Grantville Gippsland Region 922 457
89 Corinella Gippsland Region 922 507
90 Murtoa Grampians Region 922 796
91 Cobram Hume Region 923 5065
Change and disadvantage in regional Victoria: an overview 18
Small towns <1000 Medium sized towns 1000–3000 Large sized towns >3000
Please use caution reviewing small towns as high rates can be generated in small populations
by a few cases of disadvantage.
Community Name Government Region
Index of
relative socio-
economic
disadvantage
Census
Population
2006, Total
92 Rawson Gippsland Region 923 279
93 Yallourn North Gippsland Region 924 1162
94 Euroa Hume Region 924 2773
95 Eaglehawk (S) Loddon Mallee Region 925 4352
96 Venus Bay Gippsland Region 925 513
97 Bruthen Gippsland Region 925 625
98 Longwarry Gippsland Region 925 625
99 North Bendigo (S) Loddon Mallee Region 925 3763
100 Derrinallum Barwon-South Western Region 926 233
101 Chewton Loddon Mallee Region 927 403
102 Myrtleford Hume Region 927 2718
103 Nathalia Hume Region 928 1426
104 Lakes Entrance Gippsland Region 929 5562
105 Alberton Gippsland Region 929 161
106 Port Welshpool Gippsland Region 929 199
107 Mallacoota Rural Catchment Gippsland Region 929 303
108 Meredith Grampians Region 929 315
109 Linton Grampians Region 929 356
110 Cann River Rural Catchment Gippsland Region 930 355
111 Skipton Barwon-South Western Region 930 480
112 Nagambie Hume Region 930 1381
113 Terang Barwon-South Western Region 931 1833
114 Jamieson Hume Region 931 89
115 Rupanyup Grampians Region 931 398
116 Eureka (S) Grampians Region 931 610
117 Violet Town Hume Region 931 682
118 Murchison Hume Region 931 785
119 Mallacoota Gippsland Region 932 975
120 Leitchville Loddon Mallee Region 932 271
121 Seaspray Gippsland Region 933 184
123 Balmoral Barwon-South Western Region 933 188
124 West Bendigo (S) Loddon Mallee Region 933 384

Change and disadvantage in regional Victoria: an overview 19
Small towns <1000 Medium sized towns 1000–3000 Large sized towns >3000
Please use caution reviewing small towns as high rates can be generated in small populations
by a few cases of disadvantage.
Community Name Government Region
Index of
relative socio-
economic
disadvantage
Census
Population
2006, Total
125 Carisbrook Loddon Mallee Region 933 714
126 Rosedale Gippsland Region 933 1077
127 Wycheproof Loddon Mallee Region 934 688
128 Sea Lake Loddon Mallee Region 934 634
129 Charlton Loddon Mallee Region 935 1071
130 Goornong Loddon Mallee Region 936 300
131 Nyah Loddon Mallee Region 936 322
132 Dunolly Rural Catchment Loddon Mallee Region 936 1136
133 Colbinabbin Loddon Mallee Region 937 114
134 Wunghnu Hume Region 937 270
135 Delacombe (S) Grampians Region 937 3818
136 Foster Gippsland Region 938 1042
137 Yea Hume Region 938 1050
138 North Shore (S) Barwon-South Western Region 938 317
139 Korumburra Gippsland Region 939 3144
140 Ironbark (S) Loddon Mallee Region 939 1182
141 Snake Valley Grampians Region 939 331
142 Camperdown Barwon-South Western Region 939 3163
143 Kerang Loddon Mallee Region 939 3775
144 Cobden Barwon-South Western Region 940 1533
145 Strathmerton Hume Region 940 466
146 Donald Loddon Mallee Region 940 1432
147 Grantville Rural Catchment Gippsland Region 941 932
148 Mortlake Barwon-South Western Region 941 992
149 Benalla Hume Region 941 9124
150 Ultima Loddon Mallee Region 941 160
151 Beeac Barwon-South Western Region 941 204
152 Omeo Gippsland Region 942 227
153 Lindenow Gippsland Region 942 337
154 Portland Barwon-South Western Region 942 9819
155 Maryborough Rural Catchment Loddon Mallee Region 943 2639
156 Chiltern Hume Region 944 1066

Change and disadvantage in regional Victoria: an overview 20
Small towns <1000 Medium sized towns 1000–3000 Large sized towns >3000
Please use caution reviewing small towns as high rates can be generated in small populations
by a few cases of disadvantage.
Community Name Government Region
Index of
relative socio-
economic
disadvantage
Census
Population
2006, Total
157 Corryong Hume Region 944 1232
158 Mildura Loddon Mallee Region 944 30008
159 Numurkah Hume Region 945 3680
160 Kyneton Loddon Mallee Region 945 4289
161 Toongabbie Gippsland Region 945 463
162 Birchip Loddon Mallee Region 945 685
163 Woorinen Loddon Mallee Region 946 315
164 Pyalong Hume Region 947 266
165 Colac Barwon-South Western Region 947 10862
166 Shepparton-Mooroopna Hume Region 947 38787
167 Bairnsdale Gippsland Region 948 11271
168 Kyabram Loddon Mallee Region 948 5619
169 Kangaroo Flat (S) Loddon Mallee Region 948 8411
170 Ballarat East (S) Grampians Region 948 4991
171 St Leonards Barwon-South Western Region 948 1620
172 Herne Hill (S) Barwon-South Western Region 949 3269
173 Broadford Hume Region 950 3054
174 Churchill Gippsland Region 950 4601
175 Creswick Grampians Region 951 2485
176 Rochester Loddon Mallee Region 951 2830
177 Harrow Grampians Region 952 94
178 Murrayville Loddon Mallee Region 952 211
179 Macarthur Barwon-South Western Region 952 260
180 Daylesford Grampians Region 952 3071
181 Kaniva Grampians Region 953 742
182 Wedderburn Rural Catchment Loddon Mallee Region 953 480
183 Cohuna Loddon Mallee Region 953 1889
184 Boolarra Gippsland Region 953 527
185 Nhill Grampians Region 953 1919
186 Stanhope Loddon Mallee Region 954 519
187 Clunes Rural Catchment Grampians Region 954 577
188 Natimuk Grampians Region 955 449
Change and disadvantage in regional Victoria: an overview 21
Small towns <1000 Medium sized towns 1000–3000 Large sized towns >3000
Please use caution reviewing small towns as high rates can be generated in small populations
by a few cases of disadvantage.
Community Name Government Region
Index of
relative socio-
economic
disadvantage
Census
Population
2006, Total
189 Forrest Barwon-South Western Region 956 167
190 Great Western Grampians Region 956 190
191 Boort Loddon Mallee Region 956 776
192 Maffra Gippsland Region 956 4141
193 Ouyen Loddon Mallee Region 957 1059
194 Katamatite Hume Region 957 211
195 Swan Hill Loddon Mallee Region 957 9698
196 Guildford Loddon Mallee Region 958 207
197 Underbool Loddon Mallee Region 959 217
198 Ballan Grampians Region 959 1809
199 Golden Square (S) Loddon Mallee Region 960 8165
200 Mount Pleasant (S) Grampians Region 960 1957
201 Gordon Grampians Region 960 453
202 Beaufort Rural Catchment Grampians Region 960 646
203 Nathalia Rural Catchment Hume Region 961 1333
204 White Hills (S) Loddon Mallee Region 961 2623
205 Briagolong Gippsland Region 961 546
206 Drouin Gippsland Region 962 6860
207 Learmonth Grampians Region 962 293
208 Wangaratta Hume Region 962 16865
209 Sale Gippsland Region 962 13337
210 Timboon Barwon-South Western Region 963 870
211 Hazeldene Hume Region 963 537
212 Avoca Rural Catchment Grampians Region 964 1412
213 Bell Post Hill (S) Barwon-South Western Region 964 4920
214 Castlemaine Loddon Mallee Region 964 7259
215 Stratford Gippsland Region 964 1445
216 Trafalgar Gippsland Region 964 2302
217 Indented Head Barwon-South Western Region 965 588
218 Hopetoun Grampians Region 965 592
219 Neerim South Gippsland Region 965 609
220 Sailors Gully (S) Loddon Mallee Region 965 647

Small towns <1000 Medium sized towns 1000–3000 Large sized towns >3000
Please use caution reviewing small towns as high rates can be generated in small populations
by a few cases of disadvantage.
Community Name Government Region
Index of
relative socio-
economic
disadvantage
Census
Population
2006, Total
221 Yarragon Gippsland Region 965 723
222 Echuca Loddon Mallee Region 967 12363
223 Poowong Gippsland Region 967 286
224 Meeniyan Gippsland Region 967 424
225 Maldon Loddon Mallee Region 967 1228
226 Flora Hill (S) Loddon Mallee Region 967 3847
227 Rutherglen Hume Region 967 1990
228 Yarrawonga Hume Region 967 5730
229 Trentham Grampians Region 968 628
230 Portarlington Barwon-South Western Region 968 3023
231 Marong Loddon Mallee Region 970 271
232 Glenrowan Hume Region 970 320
233 Nyah West Rural Catchment Loddon Mallee Region 971 324
234 Alexandra Hume Region 971 2139
235 Bendigo Loddon Mallee Region 971 6052
236 Raywood Loddon Mallee Region 972 133
237 Axedale Loddon Mallee Region 972 229
238 Marshall (S) Barwon-South Western Region 973 843
239 Mount Beauty Hume Region 973 1706
240 Golden Point (S) Grampians Region 973 2138
241 Blackwood Grampians Region 974 235
242 Black Hill (S) Grampians Region 974 2128
243 Tallangatta Hume Region 975 954
244 Ballarat North (S) Grampians Region 975 3884
245 Orbost Rural Catchment Gippsland Region 976 1791
246 Lethbridge Grampians Region 976 497
247 Wodonga Hume Region 978 29696
248 Birregurra Barwon-South Western Region 978 464
249 Dimboola Rural Catchment Grampians Region 978 372
250 Beechworth Hume Region 979 2653
251 Heathcote Rural Catchment Loddon Mallee Region 979 548
252 Horsham Grampians Region 979 14135
Change and disadvantage in the Barwon South West region, Victoria 22

Change and disadvantage in regional Victoria: an overview 23
Small towns <1000 Medium sized towns 1000–3000 Large sized towns >3000
Please use caution reviewing small towns as high rates can be generated in small populations
by a few cases of disadvantage.
Community Name Government Region
Index of
relative socio-
economic
disadvantage
Census
Population
2006, Total
253 Campbells Creek Loddon Mallee Region 980 1265
254 St Albans Park (S) Barwon-South Western Region 980 4692
255 Rupanyup Rural Catchment Grampians Region 981 365
256 Nagambie Rural Catchment Hume Region 981 1117
257 Wahgunyah Hume Region 981 810
258 Rushworth Rural Catchment Loddon Mallee Region 981 1026
259 Tatura Hume Region 982 3534
260 Mitchell Park (S) Grampians Region 983 328
261 Hamlyn Heights (S) Barwon-South Western Region 983 5838
262 Enfi eld Grampians Region 984 360
263 Mansfi eld Hume Region 984 2846
264 Traralgon Gippsland Region 984 21980
265 Neerim South Rural Catchment Gippsland Region 984 1148
266 Hamilton Barwon-South Western Region 985 9388
267 San Remo Gippsland Region 985 1012
268Lakes Entrance Rural
CatchmentGippsland Region 985 1499
269 Bakery Hill (S) Grampians Region 986 191
270 Warragul Gippsland Region 986 11491

Change and disadvantage in regional Victoria: an overview 24
Percentage
learning or earning
at ages 15 to 19,
2006
LGA
Rank
Percentage
unskilled and semi-
skilled workers,
2006
LGA
rank
Australian Early
Development
Index (AEDI), 2009
LGA
rank
Calculated from 2006
Census data
(PHIDU 2010)
Calculated from 2006
Census data
(PHIDU 2010)
From a census of all
children in their fi rst
year of school
(RCH 2010)
Regional
Victoria 81.0 - 19.3 - 12.0 -
Melbourne 83.3 - 14.6 - 10.0 -
Alpine 81.1 36 20.0 32 8.1 55
Ararat 82.0 45 20.6 27 7.6 59
Ballarat 80.9 34 16.6 54 9.9 40
Banyule 86.2 70 10.0 68 7.5 64
Bass Coast 75.9 3 17.5 48 12.1 25
Baw Baw 84.8 61 19.9 33 10.3 36
Bayside 88.9 76 5.1 75 4.1 76
Benalla 81.7 42 22.1 12 9.9 41
Boroondara 90.9 79 4.7 76 4.4 75
Brimbank 80.9 33 27.1 2 12.6 22
Buloke 87.8 73 18.6 41 12.9 17
Campaspe 80.1 23 21.6 16 10.6 32
Cardinia 81.1 35 20.6 26 7.3 65
Casey 81.1 38 23.4 7 12.9 18
Central
Goldfi elds 74.6 1 24.8 4 17.9 4
Colac-Otway 82.5 47 23.9 5 12.9 19
Corangamite 82.8 49 20.9 24 8.8 47
Darebin 80.2 25 15.0 59 10.3 37
East
Gippsland 79.1 16 19.7 37 17.3 5
Frankston 76.8 5 19.1 39 14.7 11
Gannawarra 80.6 31 20.7 25 14.9 10
Glen Eira 86.8 71 7.6 73 5.2 72
Glenelg 78.1 11 25.9 3 8.7 48
Golden Plains 84.4 58 21.3 19 7.8 58
Greater
Bendigo 80.1 21 17.8 46 12.6 23
Greater
Dandenong 79.9 19 32.3 1 16.3 8
Appendix B: Select risk factors for disadvantage by LGA

Change and disadvantage in regional Victoria: an overview 25
Percentage
learning or earning
at ages 15 to 19,
2006
LGA
Rank
Percentage
unskilled and semi-
skilled workers,
2006
LGA
rank
Australian Early
Development
Index (AEDI), 2009
LGA
rank
Calculated from 2006
Census data
(PHIDU 2010)
Calculated from 2006
Census data
(PHIDU 2010)
From a census of all
children in their fi rst
year of school
(RCH 2010)
Greater
Geelong 81.6 40 18.0 45 9.4 43
Greater
Shepparton 77.7 9 21.2 21 12.6 24
Hepburn 79.7 17 17.2 51 6.5 66
Hindmarsh 85.8 68 21.1 22 20.6 2
Hobsons Bay 80.5 30 17.5 49 11.7 27
Horsham 81.1 37 16.9 53 7.6 60
Hume 78.8 14 23.3 8 16.4 7
Indigo 85.3 64 20.2 31 6.3 68
Kingston 84.1 55 14.3 60 5.8 69
Knox 85.8 67 15.8 58 7.6 61
La Trobe 77.5 7 20.3 28 16.1 9
Loddon 87.2 72 21.0 23 16.9 6
Macedon
Ranges 85.5 66 14.0 62 8.5 49
Manningham 90.1 78 8.3 72 5.6 71
Mansfi eld 83.9 53 16.2 57 1.9 79
Maribyrnong 80.1 22 17.4 50 12.8 20
Maroondah 85.4 65 13.0 64 9.3 44
Melbourne 81.4 39 4.5 78 19.1 3
Melton 78.8 13 22.0 14 8.5 50
Mildura 77.6 8 21.8 15 13.4 14
Mitchell 82.4 46 21.4 18 9.1 45
Moira 80.4 29 23.6 6 12.0 26
Monash 88.5 75 11.9 66 9.0 46
Moonee Valley 85.2 62 10.5 67 4.5 74
Moorabool 82.6 48 19.8 34 7.6 62
Moreland 80.3 28 13.5 63 10.4 35
Mornington
Peninsula 78.7 12 14.3 61 10.6 33
Mount
Alexander 77.4 6 19.7 35 11.7 28
Moyne 84.2 56 18.3 43 9.7 42

Change and disadvantage in regional Victoria: an overview 26
Percentage
learning or earning
at ages 15 to 19,
2006
LGA
Rank
Percentage
unskilled and semi-
skilled workers,
2006
LGA
rank
Australian Early
Development
Index (AEDI), 2009
LGA
rank
Calculated from 2006
Census data
(PHIDU 2010)
Calculated from 2006
Census data
(PHIDU 2010)
From a census of all
children in their fi rst
year of school
(RCH 2010)
Murrindindi 80.1 24 19.3 38 8.5 51
Nillumbik 88.0 74 8.6 71 3.5 78
Northern
Grampians 80.0 20 21.6 17 14.2 13
Port Phillip 75.8 2 4.7 77 6.5 67
Pyrenees 78.8 15 22.1 13 8.2 53
Queenscliffe 79.9 18 10.0 69 3.6 77
South
Gippsland 84.0 54 18.9 40 8.2 54
Southern
Grampians 83.4 51 16.4 55 10.1 39
Stonnington 85.9 69 4.3 79 7.6 63
Strathbogie 83.7 52 23.2 9 14.3 12
Surf Coast 84.6 59 12.1 65 5.0 73
Swan Hill 77.7 10 22.3 11 13.0 16
Towong 84.7 60 17.7 47 10.8 30
Wangaratta 80.8 32 21.2 20 8.1 56
Warrnambool 81.9 44 18.3 44 11.1 29
Wellington 81.6 41 18.3 42 10.3 38
West
Wimmera 84.3 57 19.7 36 8.3 52
Whitehorse 89.1 77 9.8 70 5.7 70
Whittlesea 81.9 43 22.9 10 10.8 31
Wodonga 80.2 27 20.3 30 13.4 15
Wyndham 80.2 26 20.3 29 12.8 21
Yarra 76.6 4 5.6 74 10.6 34
Yarra Ranges 83.3 50 16.3 56 7.9 57
Yarriambiack 85.2 63 16.9 52 21.7 1
Change and disadvantage in regional Victoria: an overview 27
ABS (Australian Bureau of Statistics) (2006) Census of Population and Housing data. Australian
Bureau of Statistics website. www.abs.gov.au. Accessed July 2010.
ABS (Australian Bureau of Statistics) (2010) SEIFA: Socioeconomic Indexes for Areas webpage
www.abs.gov.au/websitedbs/D3310114.nsf/home/Seifa_entry_page. Accessed July 2010.
AHURI (Australian Housing and Urban Research Institute) (2005) Why low-income households move:
the search for affordable housing and employment. Research and Policy Bulletin, Issue 53 Available at
www.ahuri.edu.au/publications/download/8726 Accessed July 2010.
Australian Government (2009) A compendium of social inclusion indicators. How’s Australia faring?
www.socialinclusion.gov.au >Publications. Accessed July 2010.
Barr N (2009) The House on the Hill: the transformation of Australia’s farming communities. Land &
Water Australia in association with Halstead Press: Canberra.
DHS (Department of Human Services Workforce Planning, Portfolio Services and Strategic
Projects Division) (2009) 2009 Local Government Area Statistical Profi les and Town and
Community Profi les 2008.
DHS (Department of Human Services) (2010) Summary of Housing Assistance Programs 2008-09
(word version). DHS Housing and Community Building Division: Melbourne. Available at
www.housing.vic.gov.au/publications/reports Accessed July 2010.
DIIRD (Department of Innovation, Industry and Regional Development) (2010) Live in Victoria website.
www.liveinvictoria.vic.gov.au/working-and-employment/skill-shortages. Accessed July 2006.
DPCD (Department of Planning and Community Development) (2008a) Victoria in Future 2008
- Population Projections. DPCD: Melbourne. Available at www.dpi.vic.gov.au/DSE/dsenres.nsf/
LinkView/BD4EF8A400A9E6DECA256D8D00151A4F775206E3E0281595CA256F0E0013C1FB
Accessed July 2010.
DPCD (Department of Planning and Community Development) (2010) Strategic Policy Research
and Forecasting, DPCD. LGA maps of the SEIFA Index of Relative Socio-economic Disadvantage
mapped at the collector district level. www.dpcd.vic.gov.au >Urban and Regional > Demographics
Accessed July 2006.
DPCD (Department of Planning and Community Development) (2010b) Victoria’s regional centres -
a generation of change. Bendigo. DPCD: Melbourne. Forthcoming on www.dpcd.vic.gov.au
DSE (Department of Sustainability and Environment) (2005) Regional Matters: an atlas of Regional
Victoria 2005. www.dpcd.vic.gov.au. Accessed July 2010.
References
DPCD gratefully acknowledges the Department of Health and its two data collation products
from which most of the data for this report (referenced below) has been drawn:
› 2009 Local Government Area Statistical Profi les (DHS 2009)
› Town and Community Profi les 2008 (DHS 2009)
LGA profi les now available online: www.health.vic.gov.au/modelling/planning.htm

Change and disadvantage in regional Victoria: an overview 28
PHIDU (Public Health Information Development Unit) (2010) The Social Health Atlas of Australia:
Victoria. (Editions since 1999). www.publichealth.gov.au. Accessed July 2010.
RCH (Royal Children’s Hospital) (2010) Australian Early Childhood Development Index.
www.rch.org.au/aedi Accessed April 2011.
Saunders P & Wong M (2009) Still doing it tough: an update on deprivation and social exclusion
among welfare service clients. Social Policy Research Centre, University of New South Wales.
www.sprc.unsw.edu.au. Accessed July 2010.
SGS Economics & Planning (2009) The role of community development in responding to economic
decline. Paper commissioned by Community Development, DPCD.
Vinson T (2007) Dropping Off the Edge. JSS & CSSA: Melbourne.

Change and disadvantage in regional Victoria: an overview 29
If you would like to receive this publication in an accessible format, such as large print or audio, please telephone Jeanette Pope on 9208 3849, or email [email protected].
This publication is published in PDF and Word formats on www.dpcd.vic.gov.au
Published by the Department of Planning and Community Development
1 Spring Street Melbourne, Victoria 3000
Telephone (03) 9208 3799
May 2011
© Copyright State Government of Victoria 2007
This publication is copyright. No part may be reproduced by any process
except in accordance with provisions of the Copyright Act 1968.
Authorised by the Victorian Government, Melbourne.
DO
T5
95
6/1
1