chandra s. pathak, - | south florida water management...
TRANSCRIPT
Development of Satellite-Based Evapotranspiration (ET)
Historical Data Over Florida
Chandra S. Pathak, Ph.D., P.E.
Development of Satellite-Based Evapotranspiration (ET)
Historical Data Over Florida
Chandra S. Pathak, Ph.D., P.E.
March 7, 2008SFWMD/USGS Coop Program
Annual 2008 - Data Meeting SFWMD B-1 Auditorium
West Palm Beach, FL

Presentation will include following topics. Presentation will include following topics.
What are the benefits of the project ? What was the objective of the project ?What was the scope of the project?Which ET methods were investigated?Which ET method recommended and used?When and where the datasets are available ?
What are the benefits of the project ? What was the objective of the project ?What was the scope of the project?Which ET methods were investigated?Which ET method recommended and used?When and where the datasets are available ?

This project, first in the US, developed historical daily ET estimates that will be used in a varieties of water resources projects.
This project, first in the US, developed historical daily ET estimates that will be used in a varieties of water resources projects. ♦
used in Hydrologic Models.
♦ used in the development of Water Supply Plans.
♦ used for Regulation and Permitting
♦ used for Water Budgets.
♦ used in Hydrologic Models.♦
used in the development of Water Supply Plans.
♦ used for Regulation and Permitting♦ used for Water Budgets.
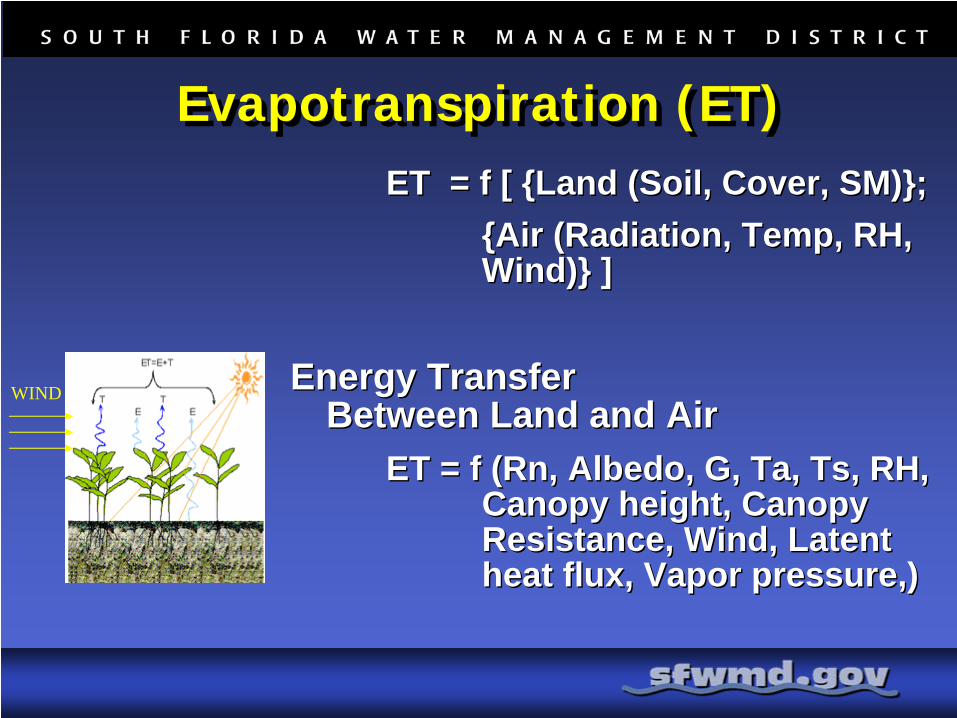
ET = f [ {Land (Soil, Cover, SM)};{Air (Radiation, Temp, RH, Wind)} ]
Energy Transfer Between Land and Air
ET = f (Rn, Albedo, G, Ta, Ts, RH, Canopy height, Canopy Resistance, Wind, Latent heat flux, Vapor pressure,)
ET = f [ {Land (Soil, Cover, SM)};{Air (Radiation, Temp, RH, Wind)} ]
Energy Transfer Between Land and Air
ET = f (Rn, Albedo, G, Ta, Ts, RH, Canopy height, Canopy Resistance, Wind, Latent heat flux, Vapor pressure,)
WIND
Evapotranspiration (ET)Evapotranspiration (ET)
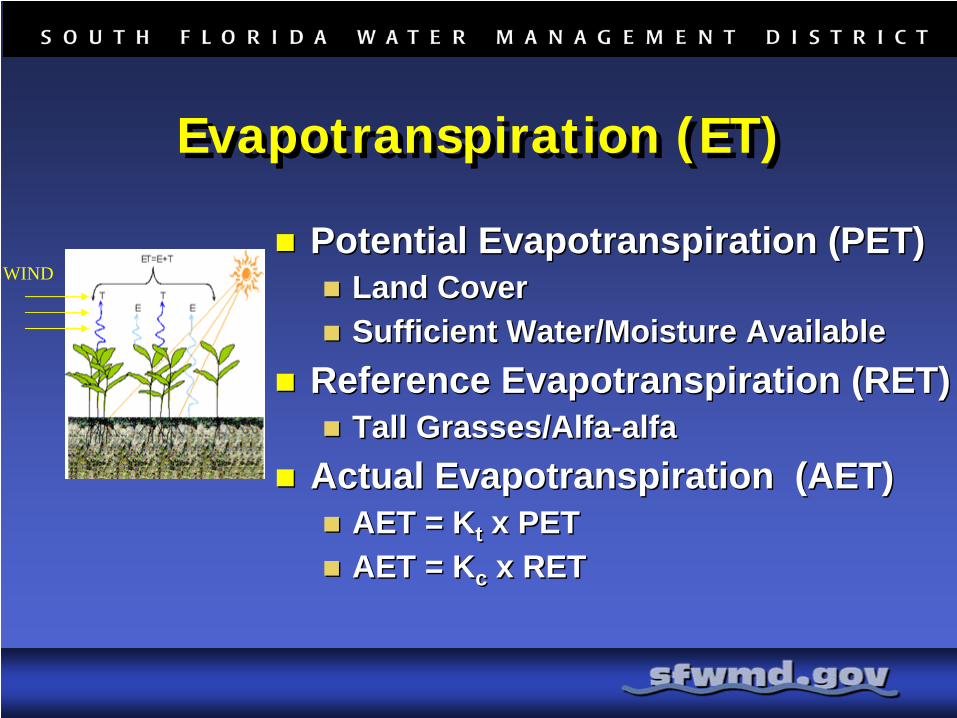
Potential Evapotranspiration (PET)Land CoverSufficient Water/Moisture Available
Reference Evapotranspiration (RET)Tall Grasses/Alfa-alfa
Actual Evapotranspiration (AET)AET = Kt x PETAET = Kc x RET
Potential Evapotranspiration (PET)Land CoverSufficient Water/Moisture Available
Reference Evapotranspiration (RET)Tall Grasses/Alfa-alfa
Actual Evapotranspiration (AET)AET = Kt x PETAET = Kc x RET
WIND
Evapotranspiration (ET)Evapotranspiration (ET)
The project’s objective was to develop spatially distributed daily ET estimates.
The project’s objective was to develop spatially distributed daily ET estimates.
Potential Evapotranspiration (PET)Reference Evapotranspiration (RET)Daily estimates from 1995 to 2004Spatially distributed at 2km x 2km grid
Potential Evapotranspiration (PET)Reference Evapotranspiration (RET)Daily estimates from 1995 to 2004Spatially distributed at 2km x 2km grid
Satellite-based PET and RET estimates over Florida were developed in this project.
Satellite-based PET and RET estimates over Florida were developed in this project.
Project was performed under USGS contract. Project duration was ~ 36 months.Three WMDs and USGS funded approximately $400k for this work effort.
Project was performed under USGS contract. Project duration was ~ 36 months.Three WMDs and USGS funded approximately $400k for this work effort.
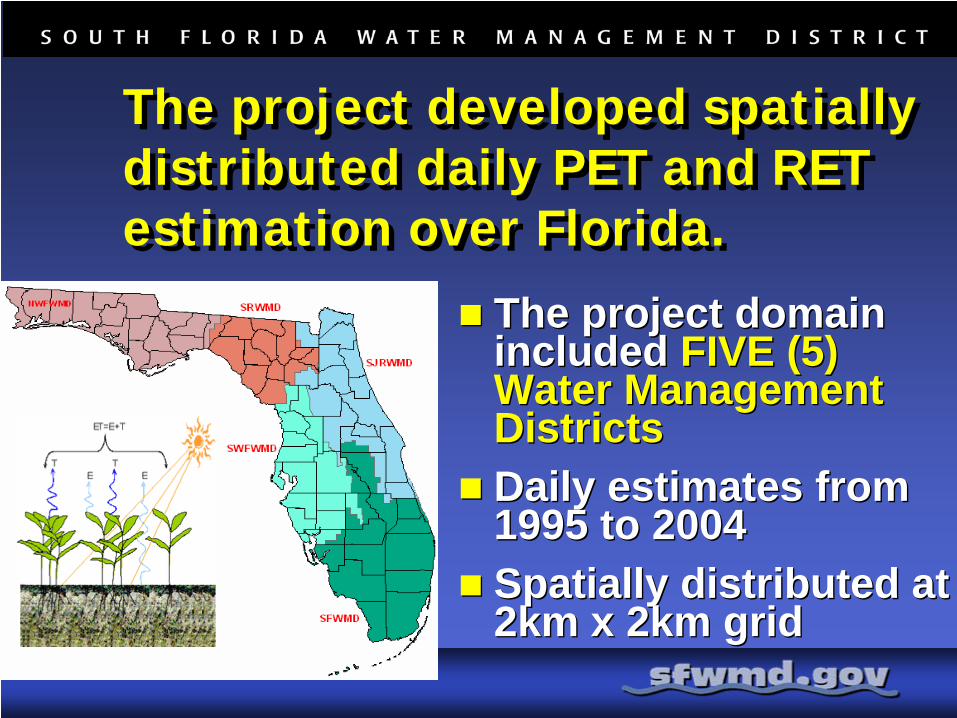
The project developed spatially distributed daily PET and RET estimation over Florida.
The project developed spatially distributed daily PET and RET estimation over Florida.
The project domain included FIVE (5) Water Management DistrictsDaily estimates from 1995 to 2004Spatially distributed at 2km x 2km grid
The project domain included FIVE (5) Water Management DistrictsDaily estimates from 1995 to 2004Spatially distributed at 2km x 2km grid
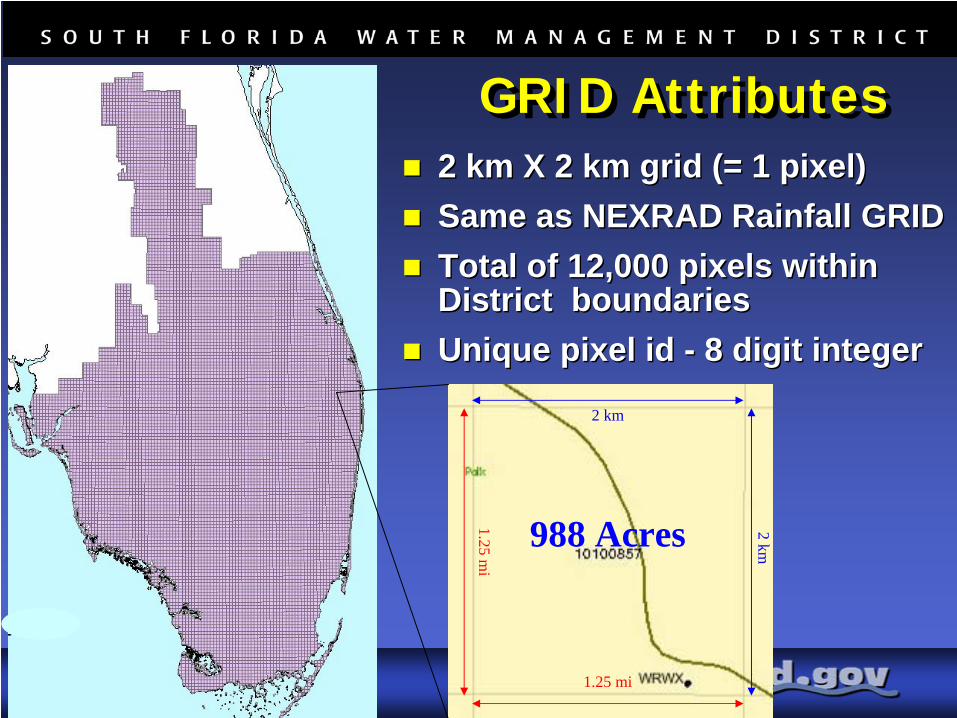
GRID AttributesGRID Attributes2 km X 2 km grid (= 1 pixel)Same as NEXRAD Rainfall GRIDTotal of 12,000 pixels within District boundariesUnique pixel id - 8 digit integer
2 km X 2 km grid (= 1 pixel)Same as NEXRAD Rainfall GRIDTotal of 12,000 pixels within District boundariesUnique pixel id - 8 digit integer
988 Acres
2 km
1.25 mi
1.25 mi
2 km
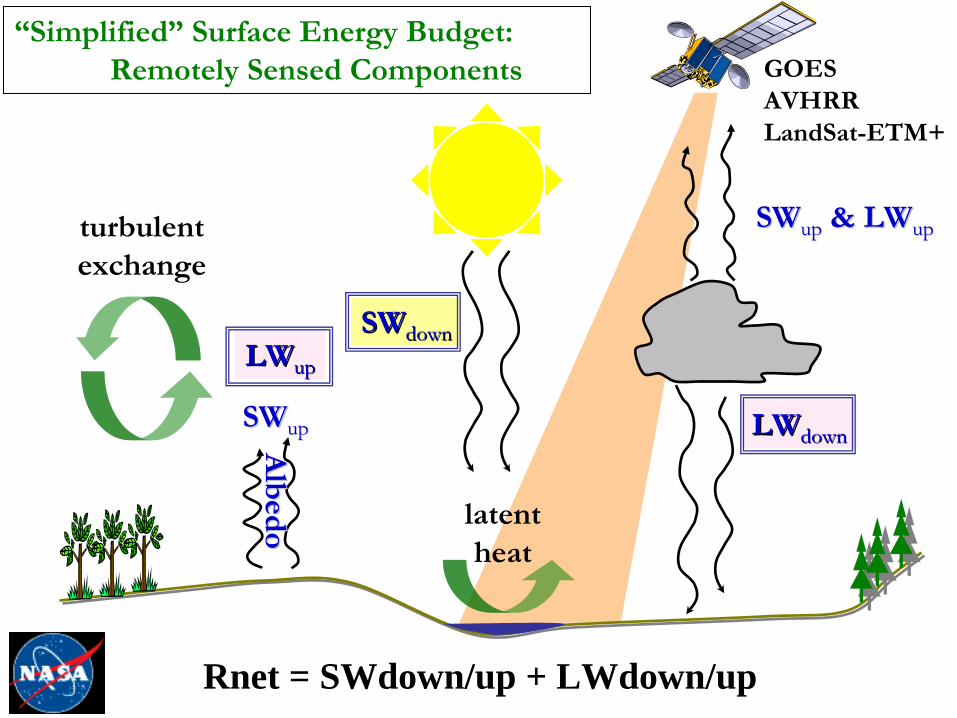
Solar radiation flux is the largest determinant of evapotranspiration (ET) flux.
Solar radiation flux is the largest determinant of evapotranspiration (ET) flux.
Solar radiation explain about 70 percent of the variation.Solar radiation is measured by a ground-based pyranometernetwork. Net radiation data are collected at all ET Measured Sites Rnet = SWdown/up + LWdown/up
Solar radiation explain about 70 percent of the variation.Solar radiation is measured by a ground-based pyranometernetwork. Net radiation data are collected at all ET Measured Sites Rnet = SWdown/up + LWdown/up
11
SWSWdowndown
SWSWupup LWLWdowndown
turbulentexchange
latentheat
SWSWupup
& & LWLWupup
“Simplified”
Surface Energy Budget:
Remotely Sensed Components GOESAVHRRLandSat-ETM+
LWLWupup
Rnet = SWdown/up + LWdown/upA
lbed
oA
lbed
o
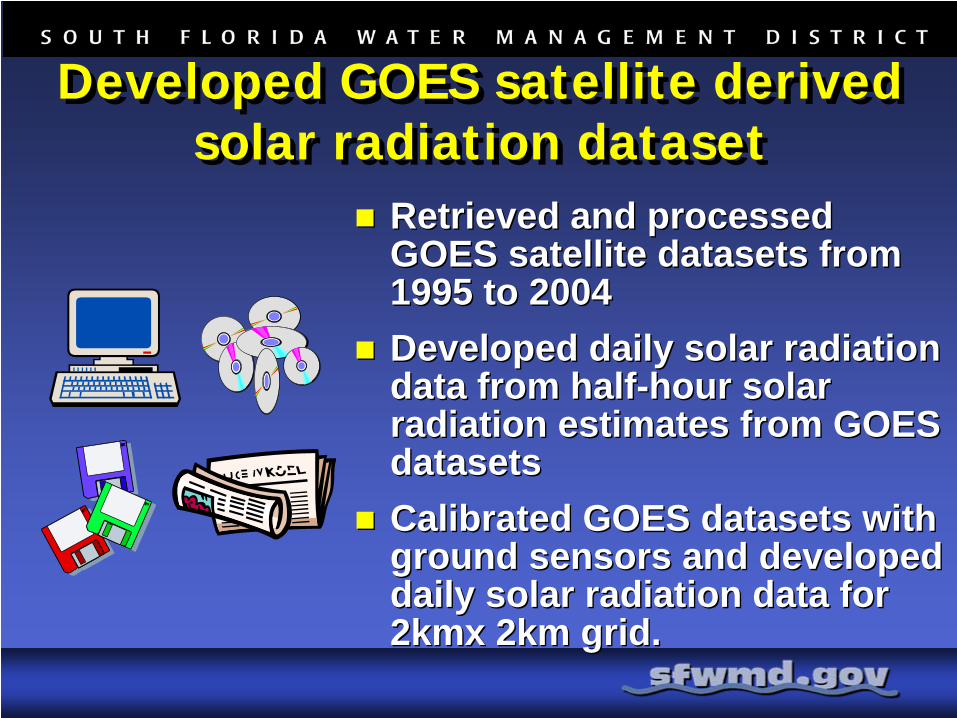
Developed GOES satellite derived solar radiation dataset
Developed GOES satellite derived solar radiation dataset
Retrieved and processed GOES satellite datasets from 1995 to 2004Developed daily solar radiation data from half-hour solar radiation estimates from GOES datasetsCalibrated GOES datasets with ground sensors and developed daily solar radiation data for 2kmx 2km grid.
Retrieved and processed GOES satellite datasets from 1995 to 2004Developed daily solar radiation data from half-hour solar radiation estimates from GOES datasetsCalibrated GOES datasets with ground sensors and developed daily solar radiation data for 2kmx 2km grid.
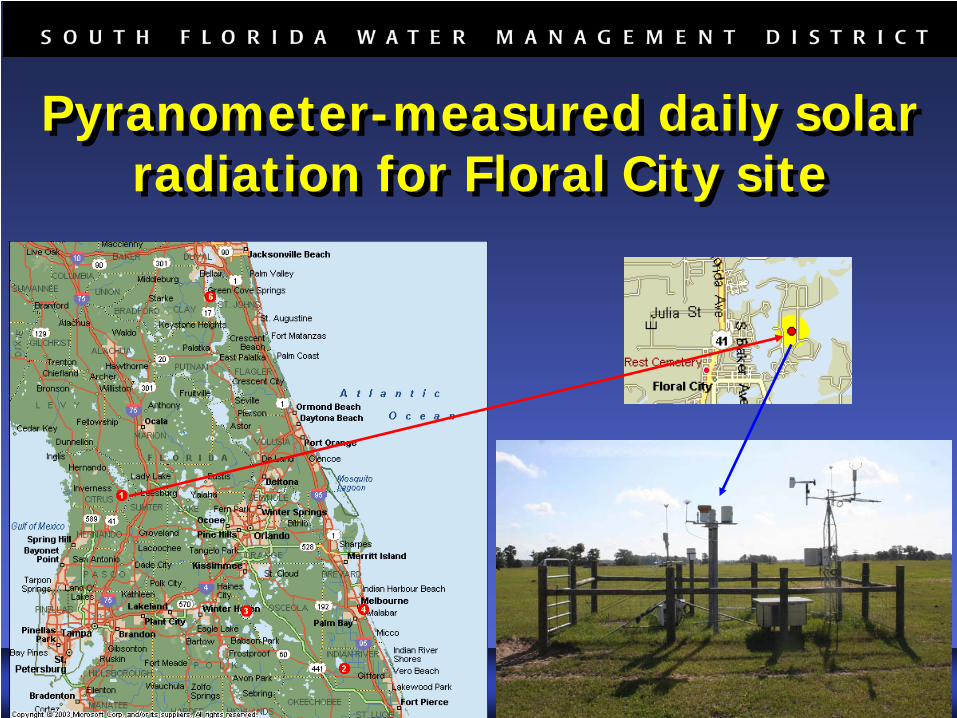
Pyranometer-measured daily solar radiation for Floral City site
Pyranometer-measured daily solar radiation for Floral City site
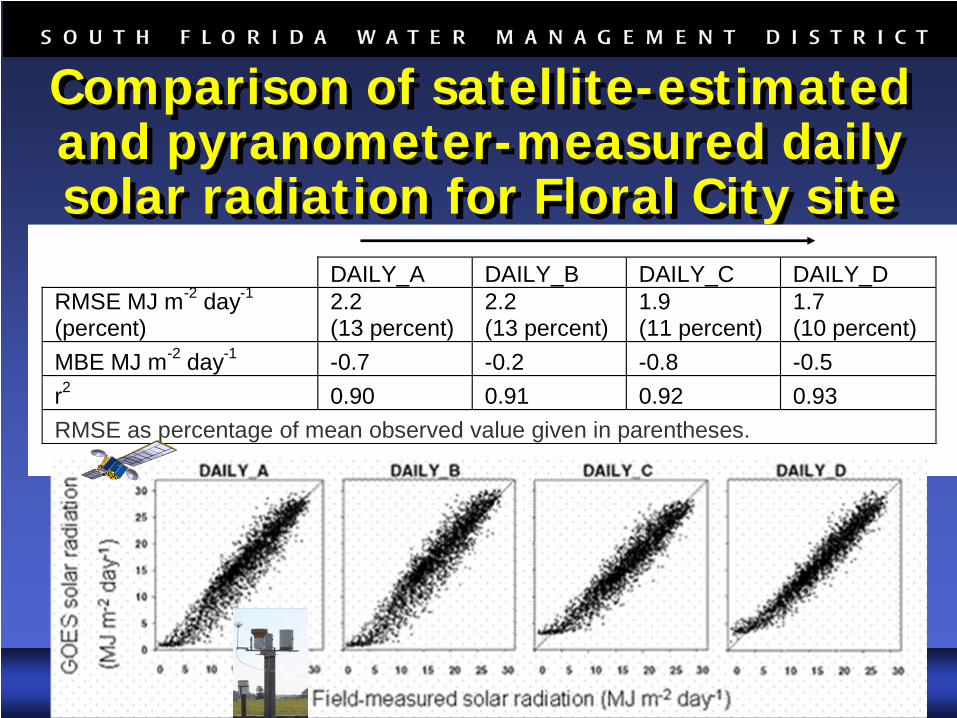
Comparison of satellite-estimated and pyranometer-measured daily solar radiation for Floral City site
Comparison of satellite-estimated and pyranometer-measured daily solar radiation for Floral City site
DAILY_A DAILY_B DAILY_C DAILY_D RMSE MJ m-2 day-1 (percent)
2.2 (13 percent)
2.2 (13 percent)
1.9 (11 percent)
1.7 (10 percent)
MBE MJ m-2 day-1 -0.7 -0.2 -0.8 -0.5 r2 0.90 0.91 0.92 0.93 RMSE as percentage of mean observed value given in parentheses.
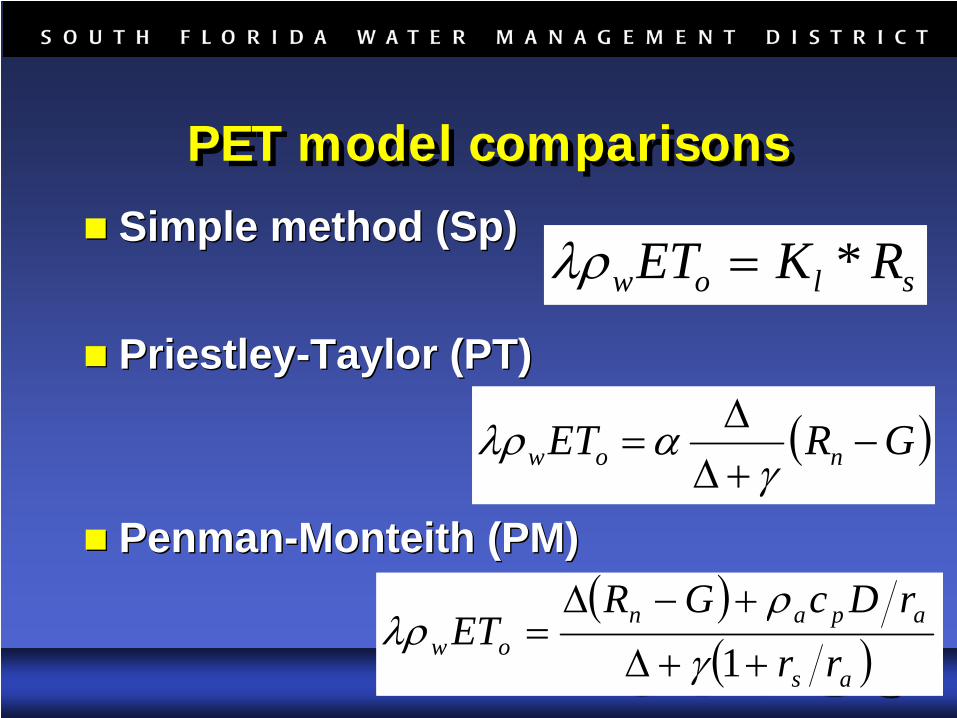
Simple method (Sp)
Priestley-Taylor (PT)
Penman-Monteith (PM)
Simple method (Sp)
Priestley-Taylor (PT)
Penman-Monteith (PM)
PET model comparisonsPET model comparisons
slow RKET *=λρ
( )GRET now −+ΔΔ
=γ
αλρ
( )( )as
apanow rr
rDcGRET
++Δ
+−Δ=
1γρ
λρ
Comparison of Three PET ModelsComparison of Three PET Models
Computed ET using data collected at sites in sites in different locations and with differing land covers. Compared performance of three models with actual ET observations.Recommended the “best” model for computing ET across Florida.
Computed ET using data collected at sites in sites in different locations and with differing land covers. Compared performance of three models with actual ET observations.Recommended the “best” model for computing ET across Florida.
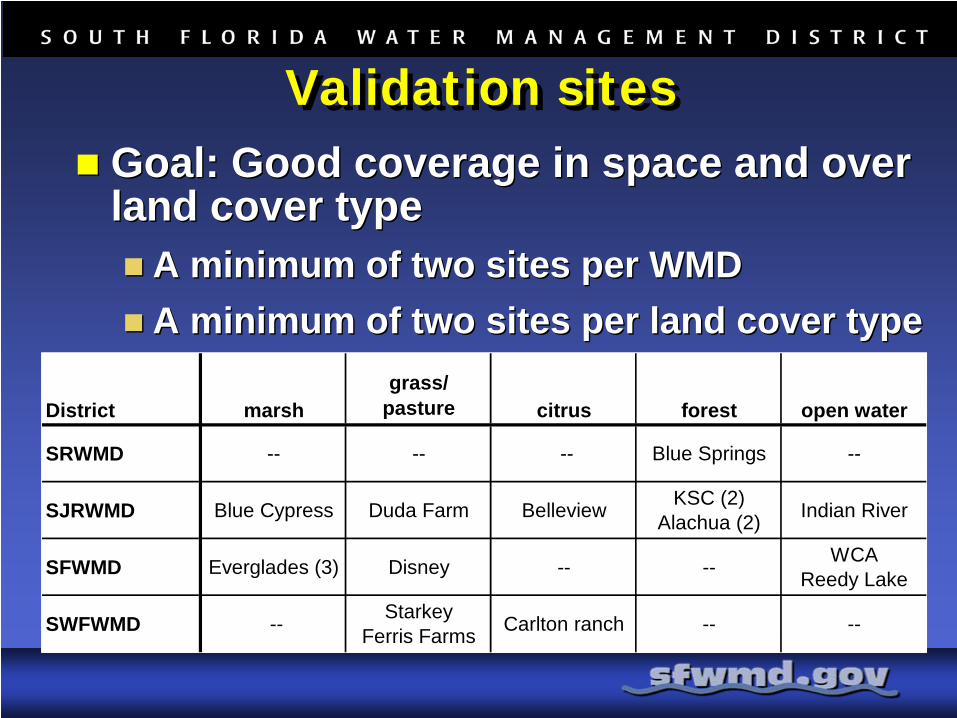
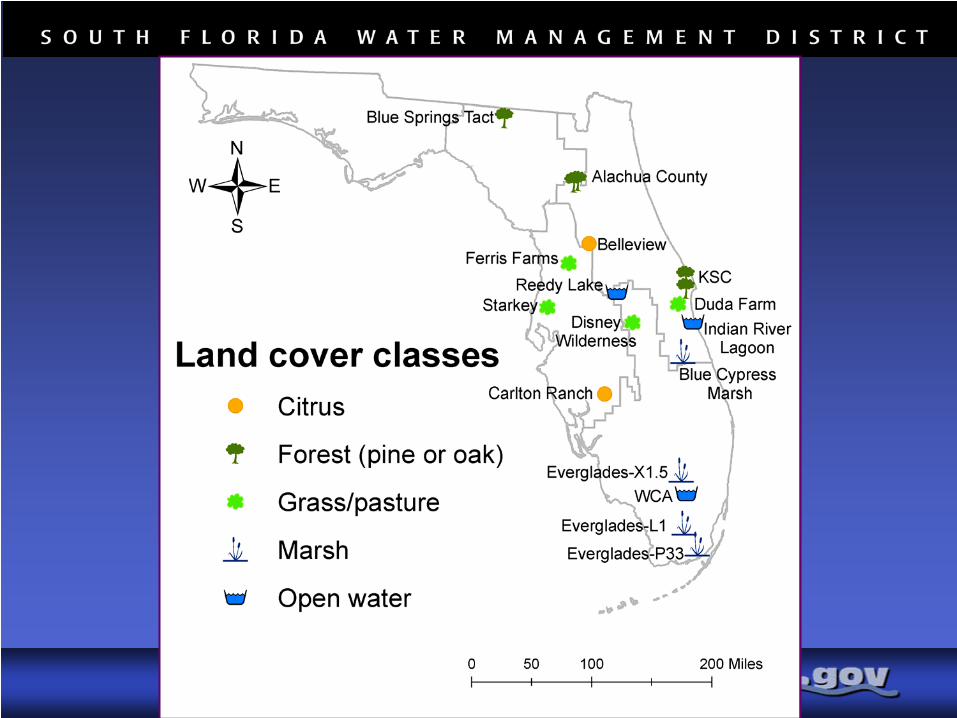
Validation sitesValidation sitesGoal: Good coverage in space and over land cover type
A minimum of two sites per WMDA minimum of two sites per land cover type
Goal: Good coverage in space and over land cover type
A minimum of two sites per WMDA minimum of two sites per land cover type
District marshgrass/
pasture citrus forest open water
SRWMD -- -- -- Blue Springs --
SJRWMD Blue Cypress Duda Farm Belleview KSC (2) Alachua (2) Indian River
SFWMD Everglades (3) Disney -- -- WCA Reedy Lake
SWFWMD -- Starkey Ferris Farms Carlton ranch -- --
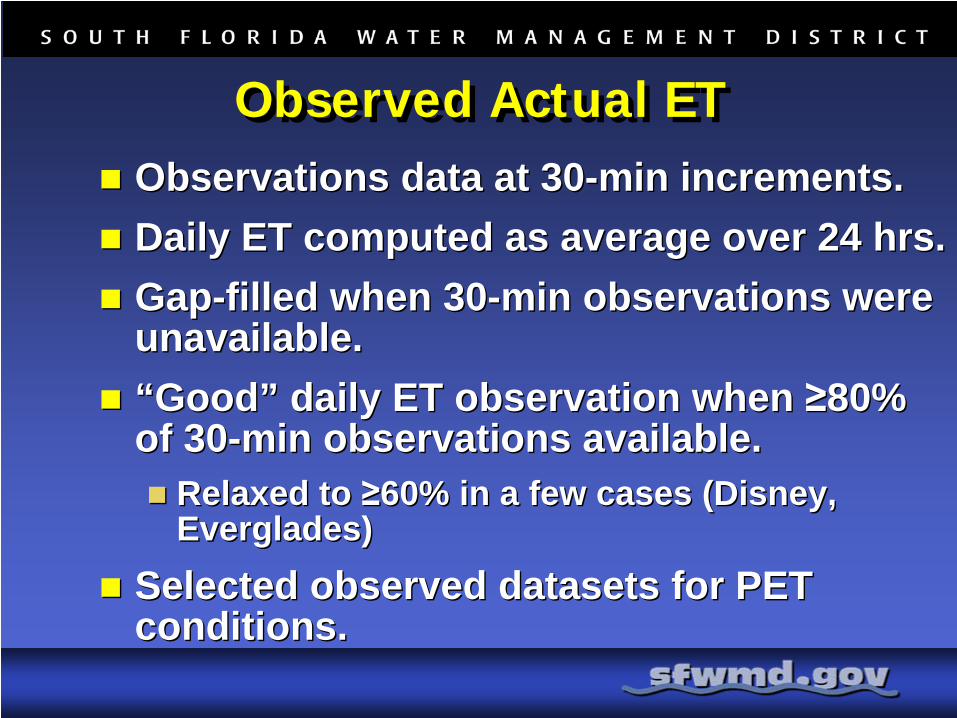
Observed Actual ETObserved Actual ETObservations data at 30-min increments.Daily ET computed as average over 24 hrs.Gap-filled when 30-min observations were unavailable.“Good” daily ET observation when ≥80% of 30-min observations available.
Relaxed to ≥60% in a few cases (Disney, Everglades)
Selected observed datasets for PET conditions.
Observations data at 30-min increments.Daily ET computed as average over 24 hrs.Gap-filled when 30-min observations were unavailable.“Good” daily ET observation when ≥80% of 30-min observations available.
Relaxed to ≥60% in a few cases (Disney, Everglades)
Selected observed datasets for PET conditions.
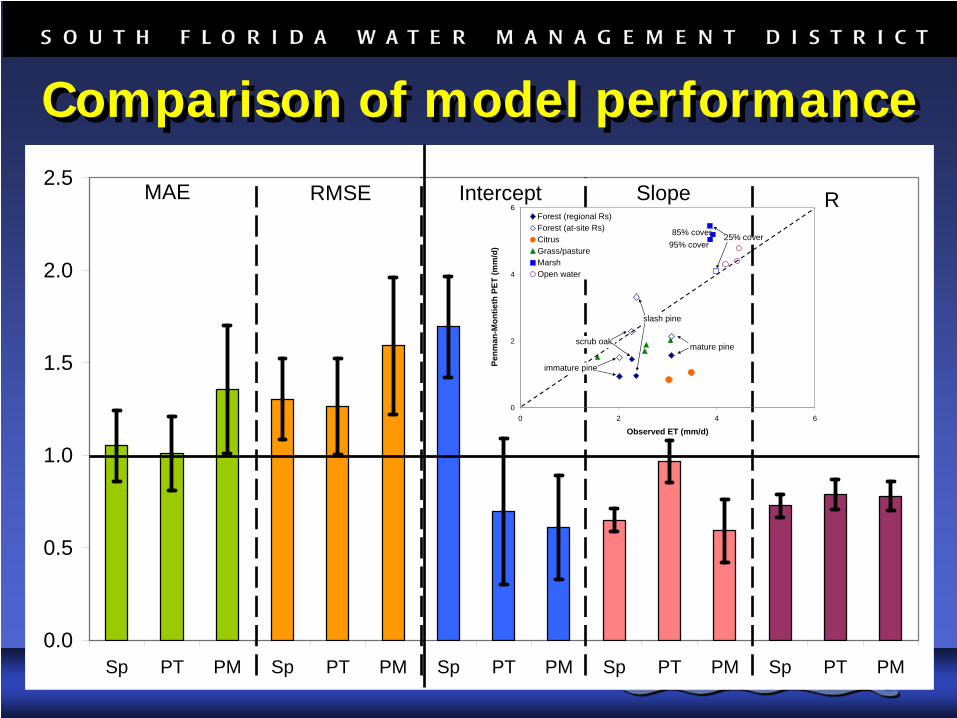
Comparison of model performanceComparison of model performance
0.0
0.5
1.0
1.5
2.0
2.5
Sp PT PM Sp PT PM Sp PT PM Sp PT PM Sp PT PM
MAE RMSE RIntercept Slope
0
2
4
6
0 2 4 6
Observed ET (mm/d)
Penm
an-M
ontie
th P
ET (m
m/d
)
Forest (regional Rs)Forest (at-site Rs)CitrusGrass/pastureMarshOpen water
immature pine
mature pinescrub oak
slash pine
25% cover85% cover95% cover
PET model recommendationPET model recommendation
Each method has strengths and weaknesses.PM could be more accurate with better parameters estimates, but these are difficult to measure and regionalize.PT can be computed with readily available data and is comparable in accuracy to PM.RECOMMEND USE OF PT model
Each method has strengths and weaknesses.PM could be more accurate with better parameters estimates, but these are difficult to measure and regionalize.PT can be computed with readily available data and is comparable in accuracy to PM.RECOMMEND USE OF PT model
Daily PET and RET DatasetsDaily PET and RET DatasetsPET dataset developed using:
Priestley-Taylor ModelSpatially distributed at 2km x 2km gridDaily data from 1995 to 2004
RET dataset developed using:ASCE 2000 reference ET method – PM Model.Spatially distributed at 2km x 2km gridDaily data from 1995 to 2004
PET dataset developed using: Priestley-Taylor ModelSpatially distributed at 2km x 2km gridDaily data from 1995 to 2004
RET dataset developed using:ASCE 2000 reference ET method – PM Model.Spatially distributed at 2km x 2km gridDaily data from 1995 to 2004
Availability of DatasetsAvailability of Datasets
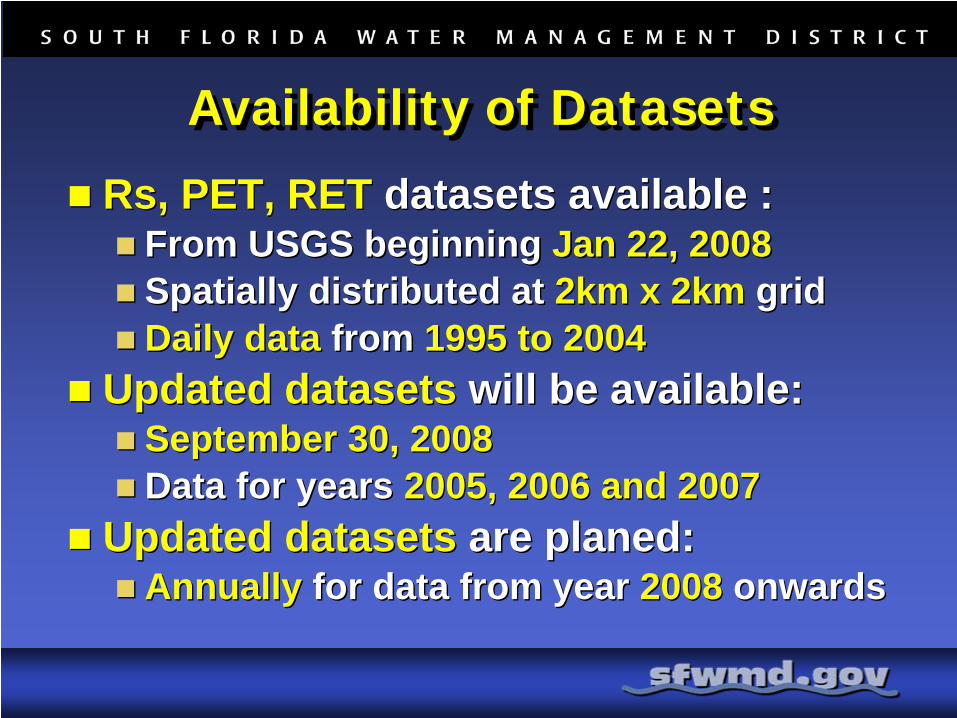
Rs, PET, RET datasets available : From USGS beginning Jan 22, 2008Spatially distributed at 2km x 2km gridDaily data from 1995 to 2004
Updated datasets will be available:September 30, 2008Data for years 2005, 2006 and 2007
Updated datasets are planed:Annually for data from year 2008 onwards
Rs, PET, RET datasets available : From USGS beginning Jan 22, 2008Spatially distributed at 2km x 2km gridDaily data from 1995 to 2004
Updated datasets will be available:September 30, 2008Data for years 2005, 2006 and 2007
Updated datasets are planed:Annually for data from year 2008 onwards
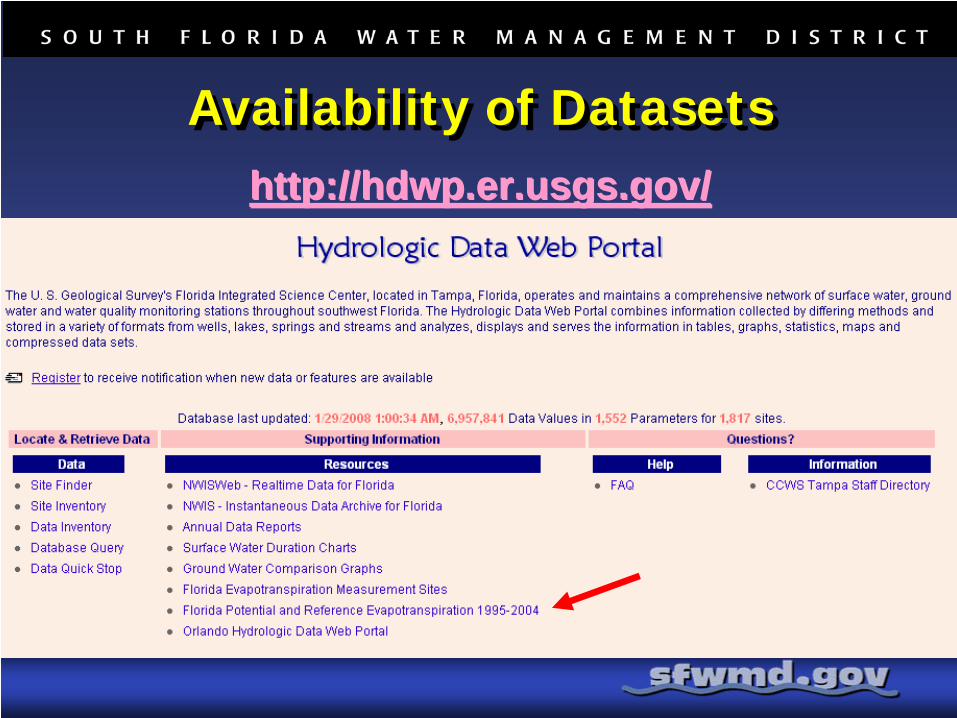
Availability of DatasetsAvailability of Datasetshttp://hdwp.er.usgs.gov/http://hdwp.er.usgs.gov/
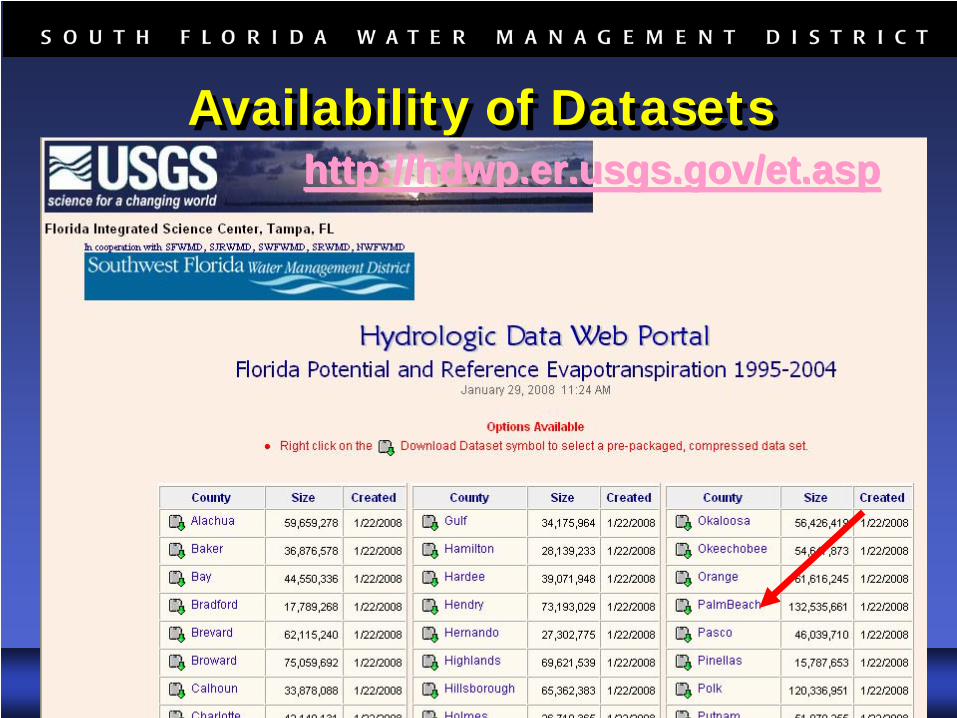
Availability of DatasetsAvailability of Datasetshttp://hdwp.er.usgs.gov/et.asphttp://hdwp.er.usgs.gov/et.asp
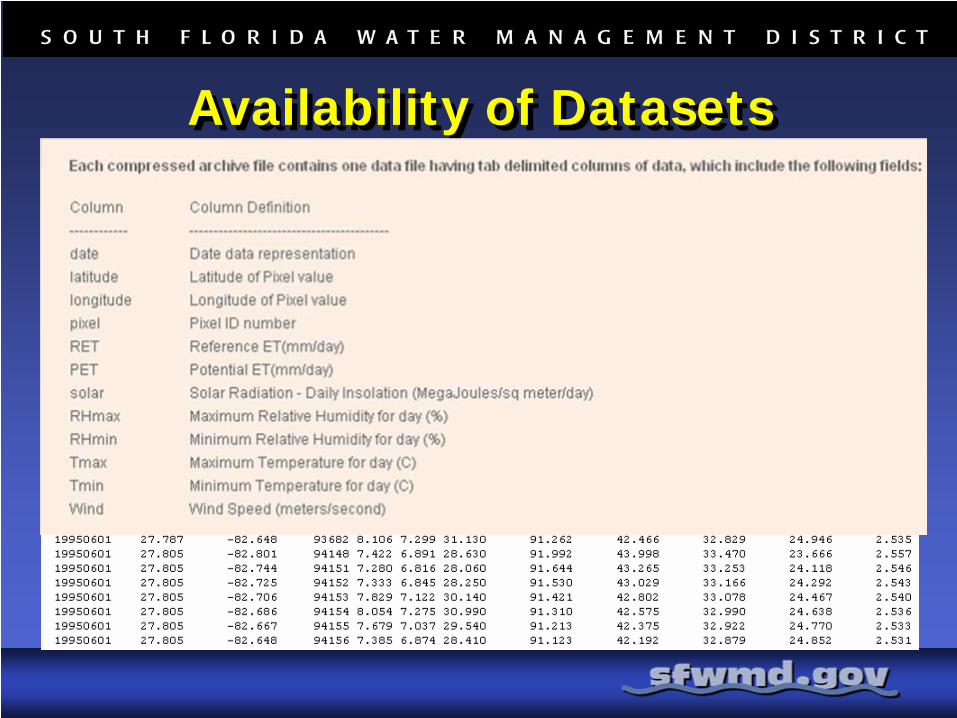
Availability of DatasetsAvailability of Datasetshttp://hdwp.er.usgs.gov/et.asphttp://hdwp.er.usgs.gov/et.asp
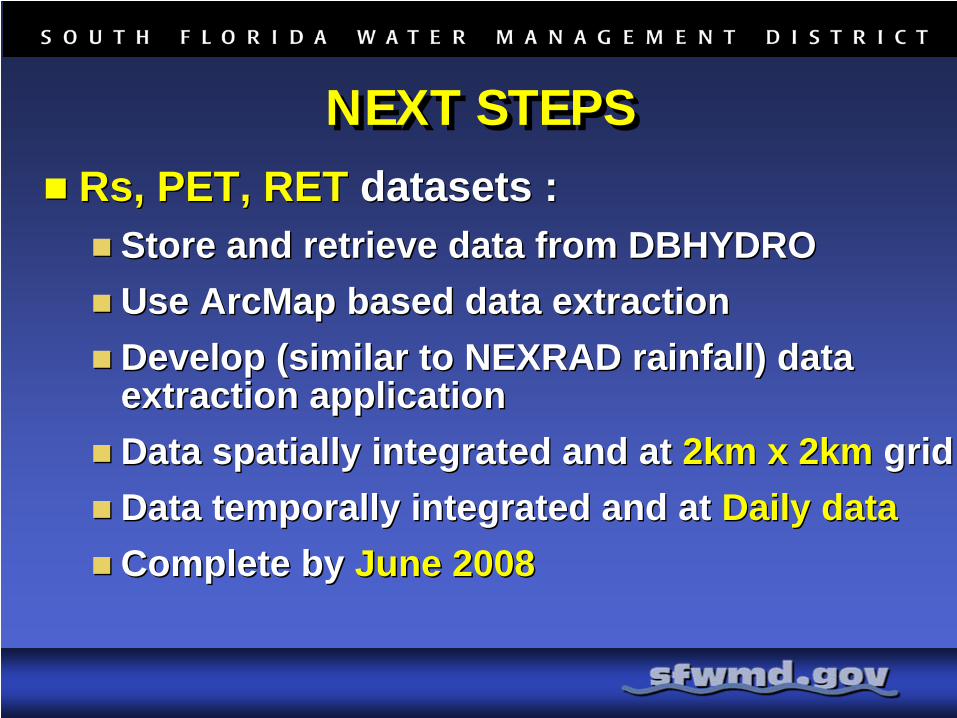
NEXT STEPSNEXT STEPSRs, PET, RET datasets :
Store and retrieve data from DBHYDRO Use ArcMap based data extraction Develop (similar to NEXRAD rainfall) data extraction applicationData spatially integrated and at 2km x 2km gridData temporally integrated and at Daily dataComplete by June 2008
Rs, PET, RET datasets : Store and retrieve data from DBHYDRO Use ArcMap based data extraction Develop (similar to NEXRAD rainfall) data extraction applicationData spatially integrated and at 2km x 2km gridData temporally integrated and at Daily dataComplete by June 2008
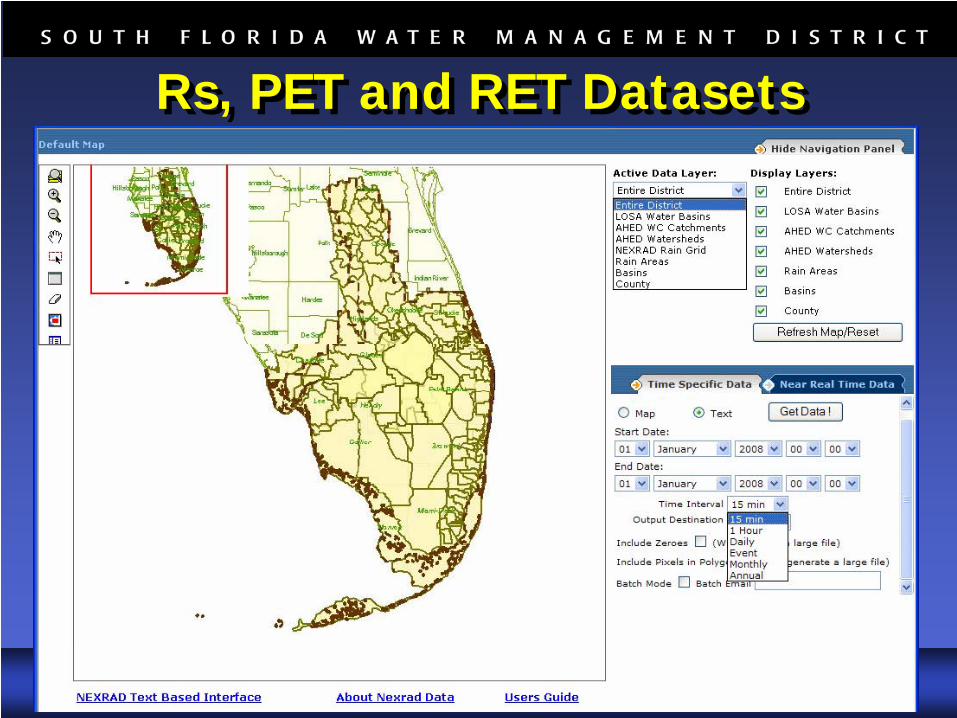
Rs, PET and RET DatasetsRs, PET and RET Datasets
In summary, the ET datasets will benefit to various existing and future projects.
In summary, the ET datasets will benefit to various existing and future projects.
These ET datasets will benefit by providing improved daily ET estimates from 1995 to 2004 that are spatially distributed over the domain of existing and future projects including CERP projects.
These ET datasets will benefit by providing improved daily ET estimates from 1995 to 2004 that are spatially distributed over the domain of existing and future projects including CERP projects.

Questions and AnswersQuestions and Answers

Thank you Thank you