challenges in inferring internet … challenges in inferring internet congestion using throughput...
TRANSCRIPT

w w w .caida.or
www.caida.org
CHALLENGES IN INFERRING INTERNET CONGESTION USING
THROUGHPUT TESTS
1
Amogh [email protected]
with Srikanth Sundaresan (Princeton)Danny Lee (Georgia Tech)
Xiaohong Deng, Yun Feng (UNSW)

w w w .caida.or
(sub-title)In the Press
2

w w w .caida.or
Measurement Lab (M-lab)
• M-lab operates a large server-side infrastructure with hundreds of testing servers
• Tools deployed on server-side: NDT, Glasnost, Shaperprobe..
3
w w w .caida.or
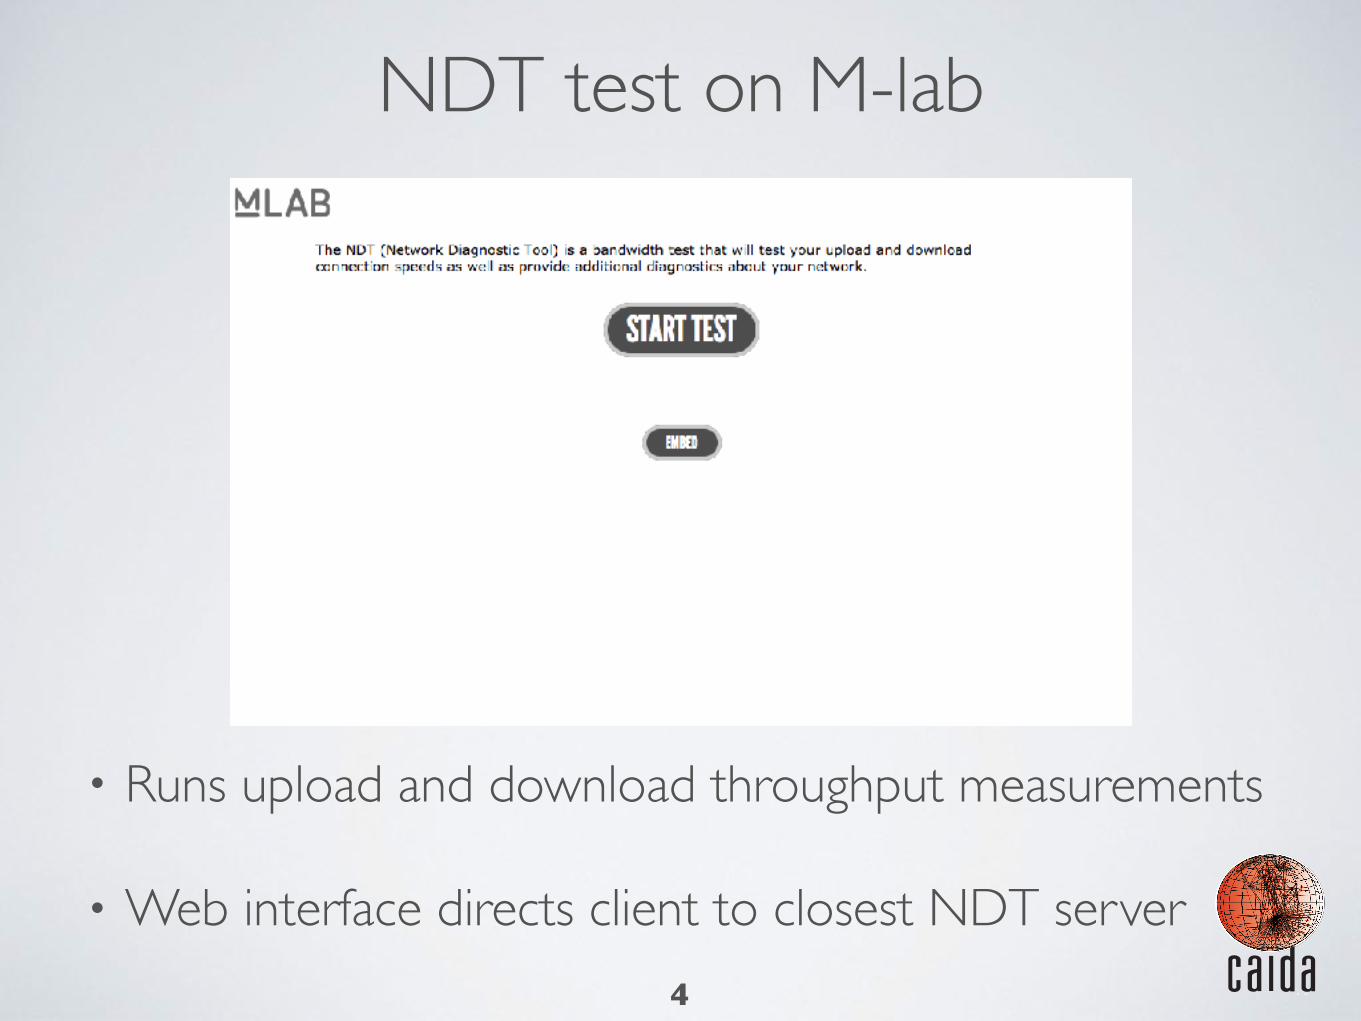
NDT test on M-lab
• Runs upload and download throughput measurements
• Web interface directs client to closest NDT server4

w w w .caida.or
NDT test on M-lab
• Runs upload and download throughput measurements
• Web interface directs client to closest NDT server4
w w w .caida.or
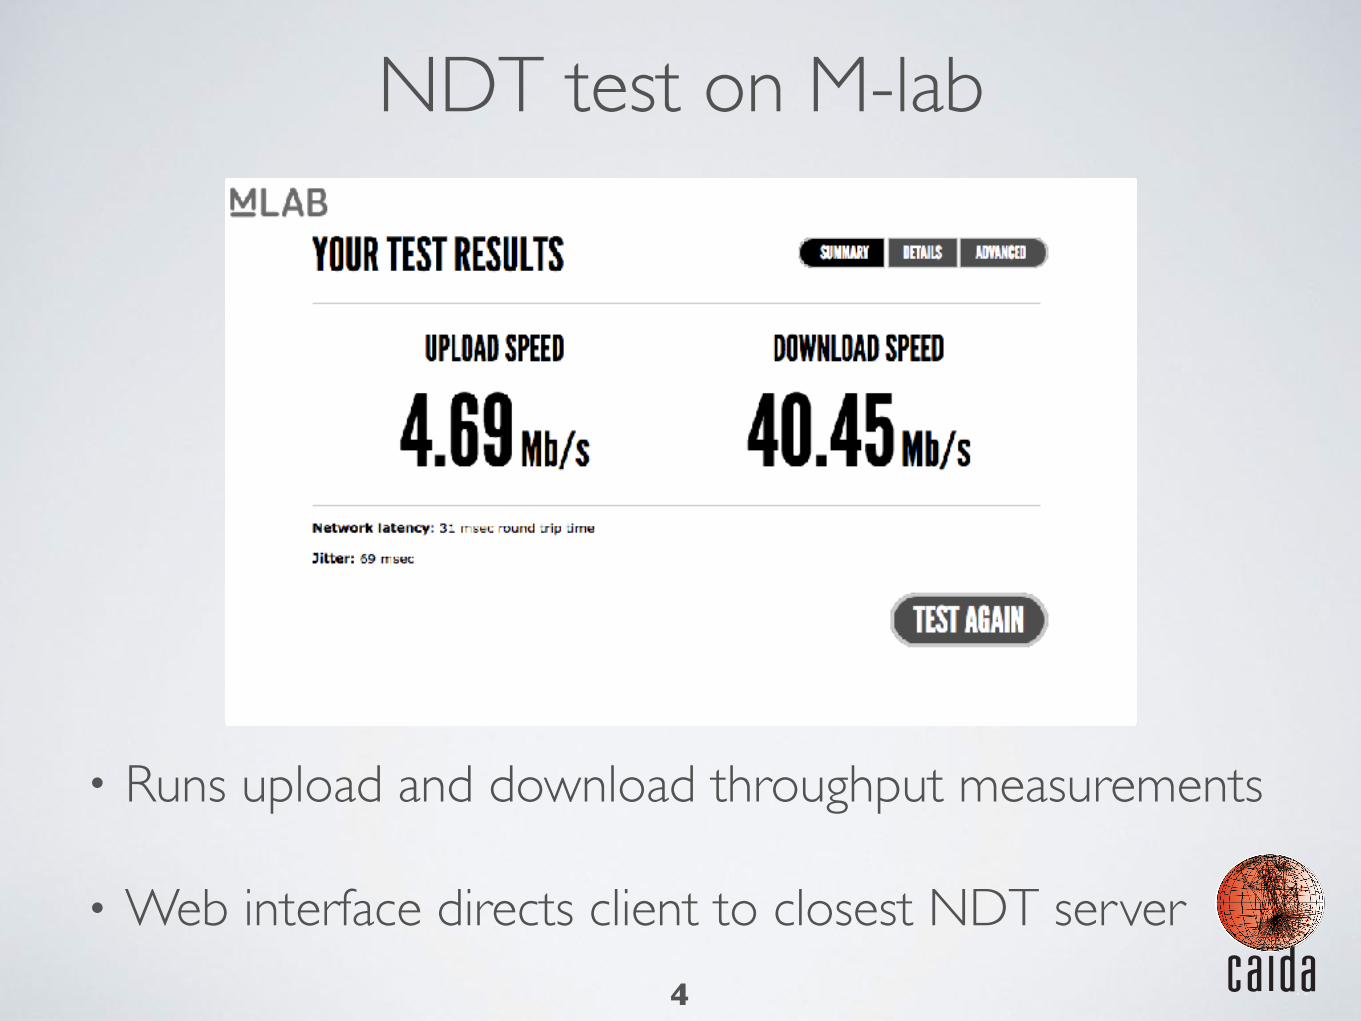
NDT test on M-lab
• Runs upload and download throughput measurements
• Web interface directs client to closest NDT server4

w w w .caida.or
Using NDT Data to Infer Congestion
5
October 2014
May 2015

w w w .caida.or
Using NDT Data to Infer Congestion
6
M-lab serverISP X
Access ISP A Access ISP B
M-lab serverISP Y

w w w .caida.or
Using NDT Data to Infer Congestion
7
?
?
?
M-lab serverISP X
M-lab serverISP Y
Access ISP A Access ISP B

w w w .caida.or
Using NDT Data to Infer Congestion
8
M-lab serverISP X
M-lab serverISP Y
Access ISP A Access ISP B

w w w .caida.or
Using NDT Data to Infer Congestion
9
M-lab serverISP X
M-lab serverISP Y
Access ISP A Access ISP B

w w w .caida.or
Using NDT Data to Infer Congestion
10
!
M-lab serverISP X
M-lab serverISP Y
Access ISP A Access ISP B

w w w .caida.or
Policy Implications
11

w w w .caida.or
Policy Implications
11

w w w .caida.or
Policy Implications
11

w w w .caida.or
Policy Implications
11
w w w .caida.or
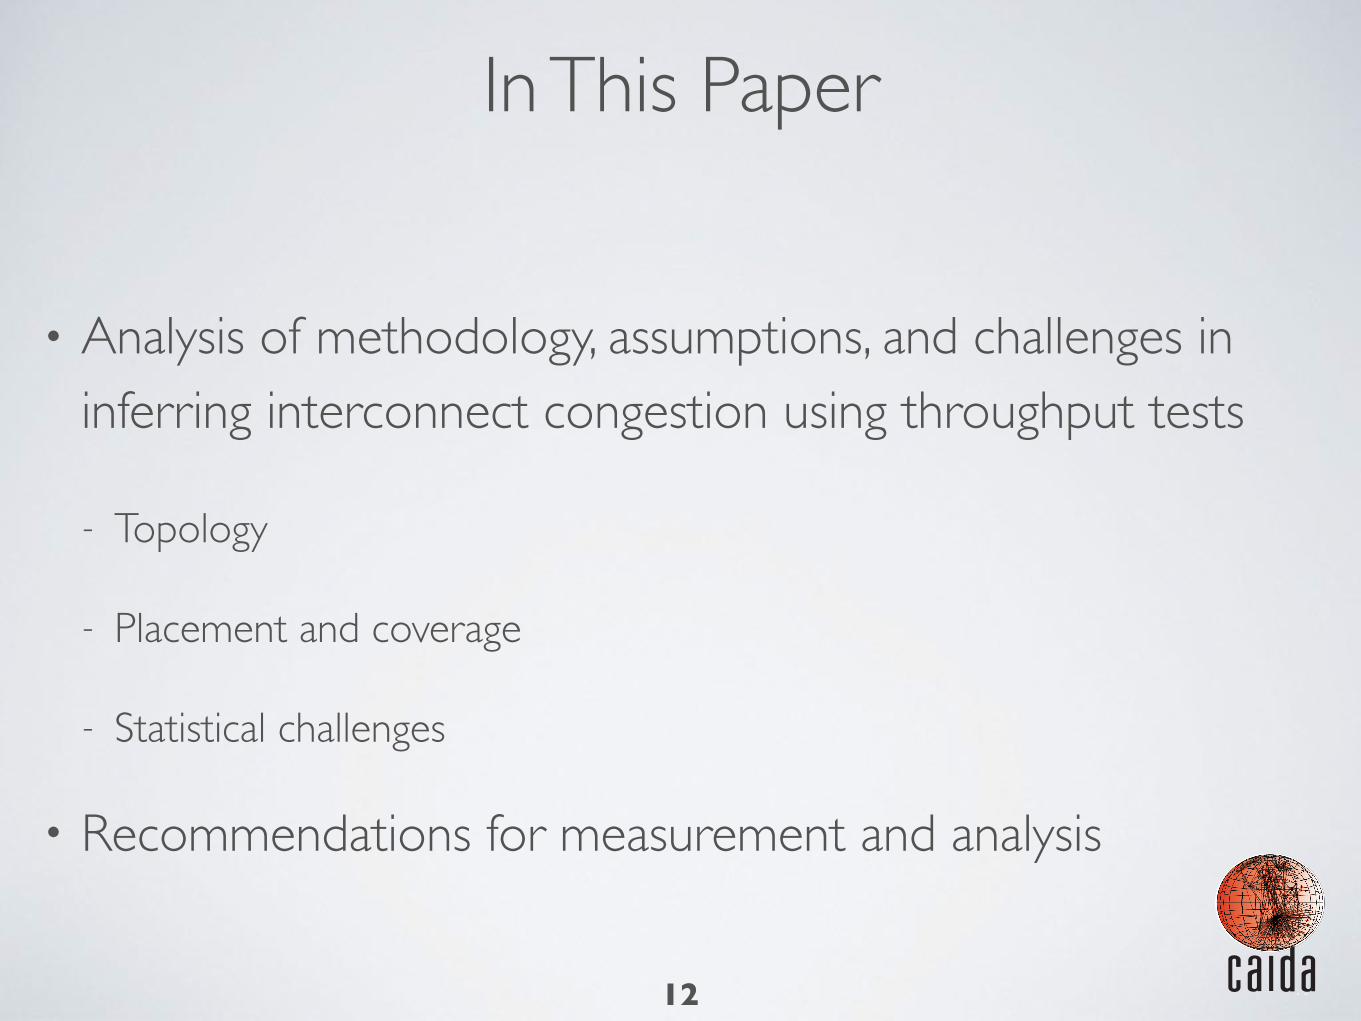
In This Paper
• Analysis of methodology, assumptions, and challenges in inferring interconnect congestion using throughput tests
- Topology
- Placement and coverage
- Statistical challenges
• Recommendations for measurement and analysis
12
w w w .caida.or
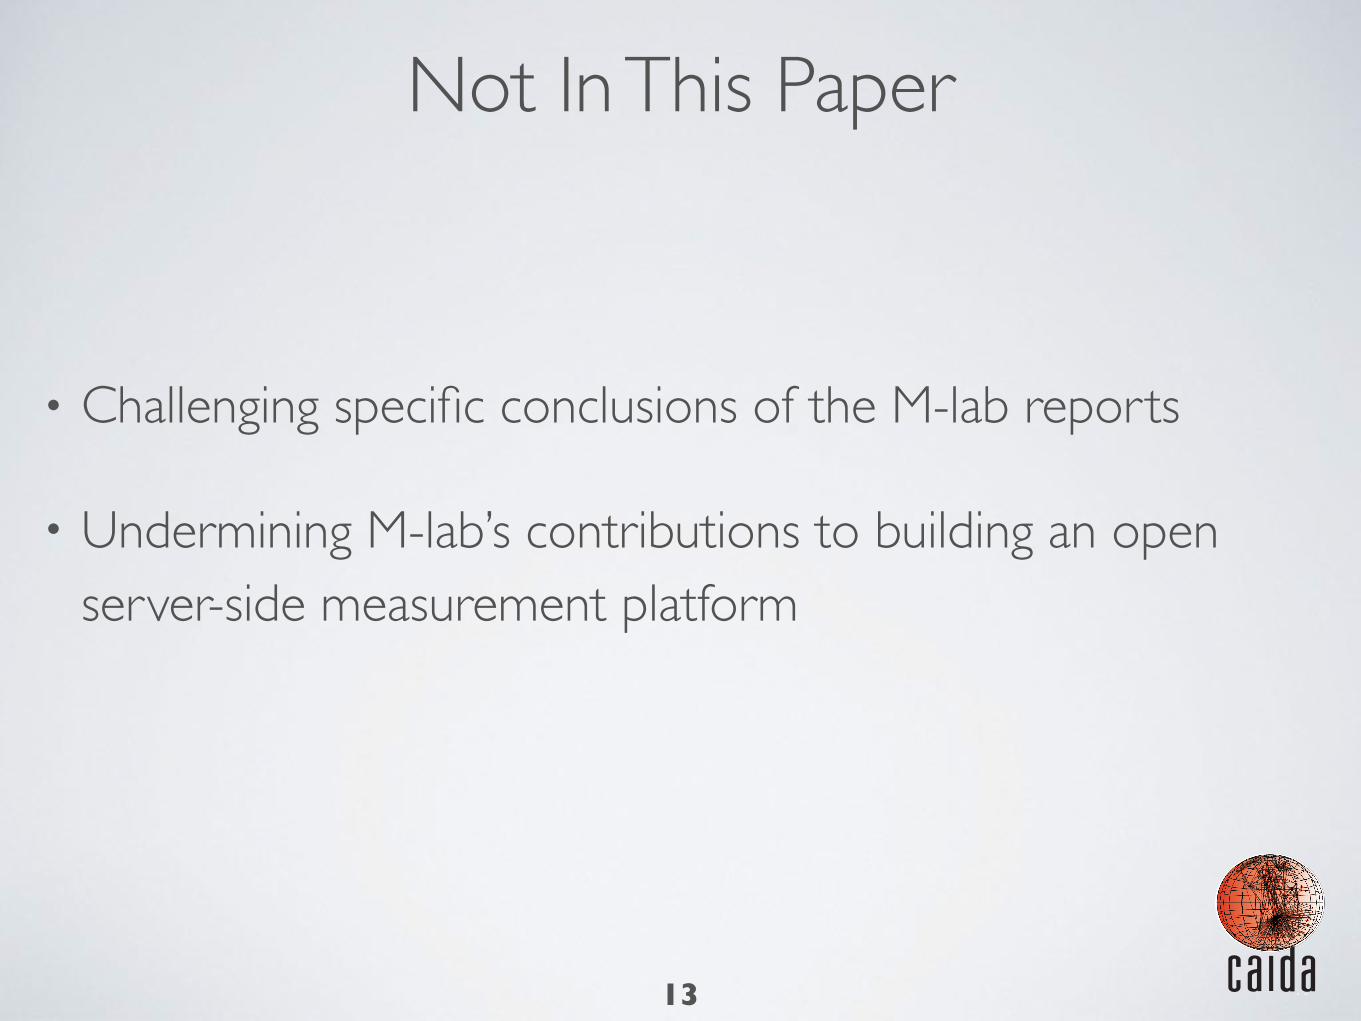
Not In This Paper
• Challenging specific conclusions of the M-lab reports
• Undermining M-lab’s contributions to building an open server-side measurement platform
13

w w w .caida.or
Challenge: Topology
• Implicit assumptions involved in using throughput tests to infer interconnection congestion
• A1: No congestion internal to ASes, any congestion is at borders
• A2: Server and client ASes are directly connected
• A3: All tests between server and client AS pass through same IP link (or “similar” IP links)
14

w w w .caida.or
Are Server and Client AS Directly Connected ?
• Method: Use Paris traceroutes associated with NDT tests to infer connectivity between server and client AS
• Use MAP-IT to infer AS boundaries in traceroute, infer which tests traverse a single AS hop
• Case study: NDT servers to top US ISPs from the FCC Measurement Broadband America (MBA) report in 2015
15Marder, Smith, “MAP-IT: Multi-pass Accurate Passive Inferences from Traceroute”, IMC 2016
w w w .caida.or
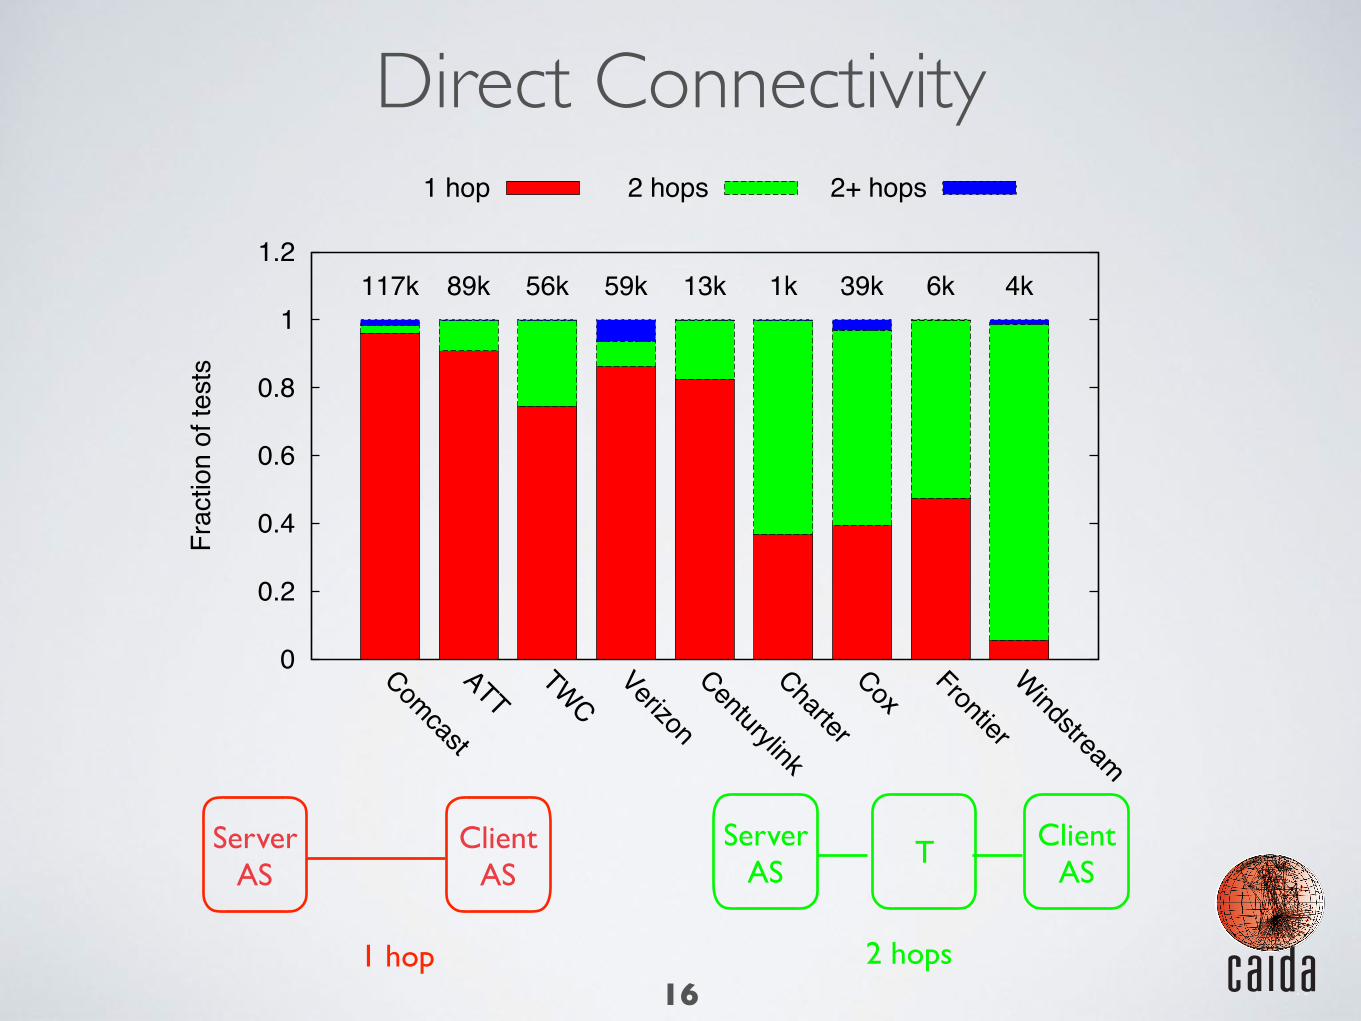
Direct Connectivity
16
0
0.2
0.4
0.6
0.8
1
1.2
Comcast
ATTTWC
Verizon
Centurylink
Charter
CoxFrontier
Windstream
Frac
tion
of te
sts
ISP
1 hop 2 hops 2+ hops
117k 89k 56k 59k 13k 1k 39k 6k 4k
ServerAS
ClientAS
1 hop
ServerAS
ClientAS
2 hops
T

w w w .caida.or
Direct Connectivity
17
0
0.2
0.4
0.6
0.8
1
1.2
Comcast
ATTTWC
Verizon
Centurylink
Charter
CoxFrontier
Windstream
Frac
tion
of te
sts
ISP
1 hop 2 hops 2+ hops
117k 89k 56k 59k 13k 1k 39k 6k 4k
Top-5 U.S. ISPs in Q3 2015

w w w .caida.or
Direct Connectivity
17
0
0.2
0.4
0.6
0.8
1
1.2
Comcast
ATTTWC
Verizon
Centurylink
Charter
CoxFrontier
Windstream
Frac
tion
of te
sts
ISP
1 hop 2 hops 2+ hops
117k 89k 56k 59k 13k 1k 39k 6k 4k
Top-5 U.S. ISPs in Q3 2015 ISPs in top 10 but not top-5

w w w .caida.or
Direct Connectivity
• Overall 82% of traces were a single hop from server AS to client AS (or siblings)
• Depends on (server AS, client AS) pair
- Direct connection assumption invalid for some ISPs in the top-10
• Driven by the economic incentives of ASes hosting M-lab servers and client ASes
- AS-level ecosystem is dynamic, warrants periodic re-examination
18
w w w .caida.or
Diversity of Interconnection
• How many IP-level links are traversed in NDT tests from a server to client AS?
• Are the traversed links in the same geographical area?
• Congestion can have geographical effects; aggregation across different geographical areas could be misleading
19
Claffy et al., “Policy Challenges in Mapping Internet Interdomain Congestion”, TPRC 2016

w w w .caida.or
Diversity of Interconnection
• Case study: M-lab’s NDT server in Atlanta (atl02) hosted by Level 3
• Used MAP-IT to infer all IP-level links traversed from atl02 to large U.S. access ISPs in May 2015
• Associated each IP link with the number of tests crossing the link
20

w w w .caida.or
Diversity of Interconnection
21
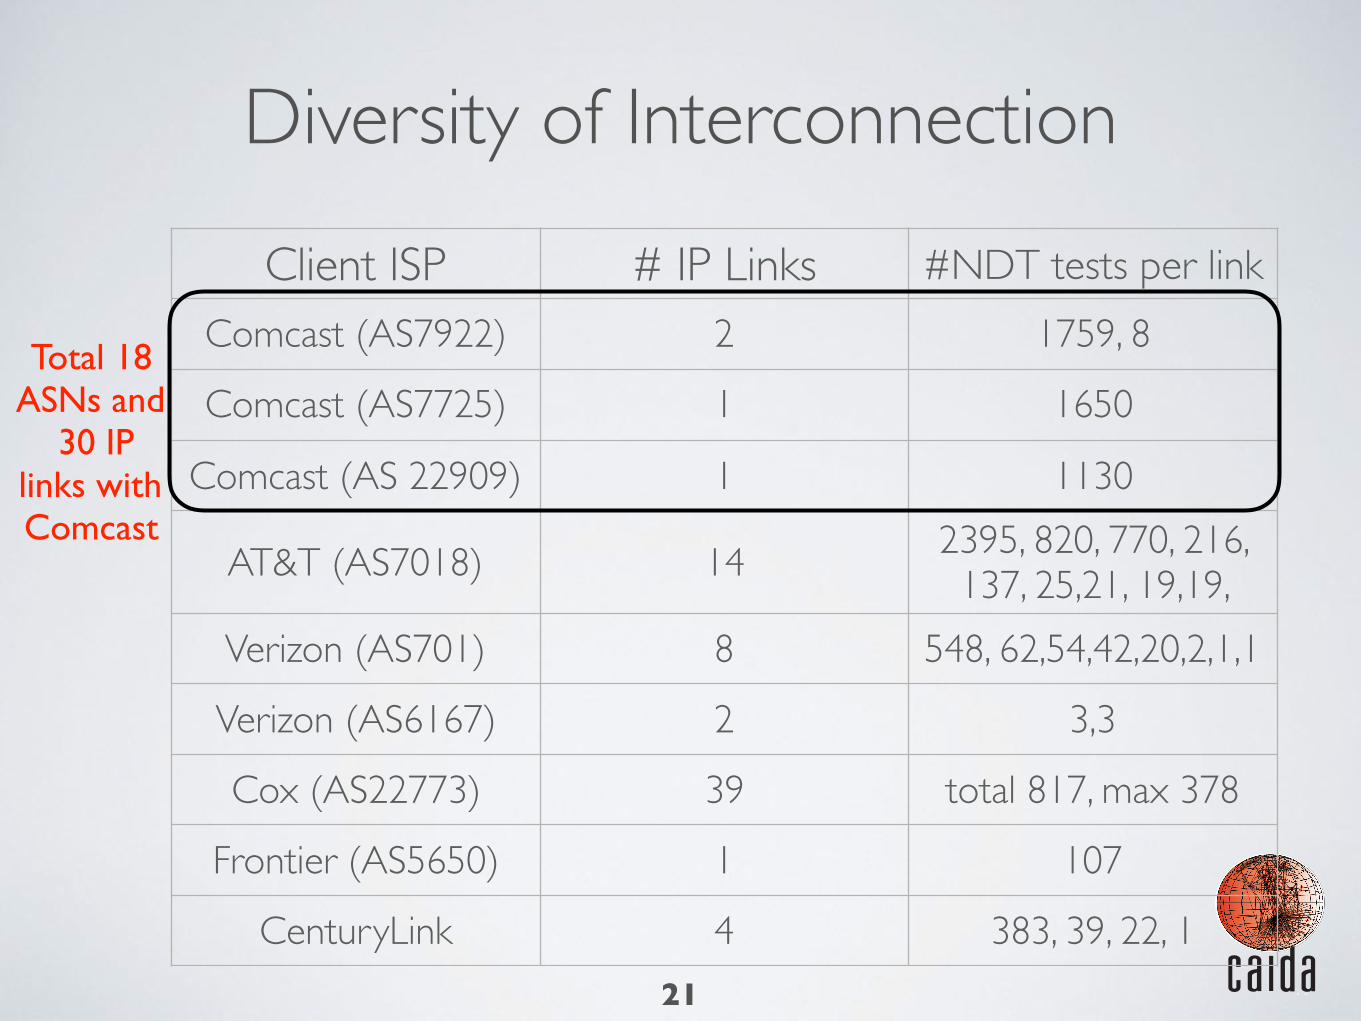
Client ISP # IP Links #NDT tests per linkComcast (AS7922) 2 1759, 8
Comcast (AS7725) 1 1650
Comcast (AS 22909) 1 1130
AT&T (AS7018) 14 2395, 820, 770, 216, 137, 25,21, 19,19,
Verizon (AS701) 8 548, 62,54,42,20,2,1,1
Verizon (AS6167) 2 3,3
Cox (AS22773) 39 total 817, max 378
Frontier (AS5650) 1 107
CenturyLink 4 383, 39, 22, 1
w w w .caida.or
Diversity of Interconnection
21
Client ISP # IP Links #NDT tests per linkComcast (AS7922) 2 1759, 8
Comcast (AS7725) 1 1650
Comcast (AS 22909) 1 1130
AT&T (AS7018) 14 2395, 820, 770, 216, 137, 25,21, 19,19,
Verizon (AS701) 8 548, 62,54,42,20,2,1,1
Verizon (AS6167) 2 3,3
Cox (AS22773) 39 total 817, max 378
Frontier (AS5650) 1 107
CenturyLink 4 383, 39, 22, 1
Total 18 ASNs and
30 IP links with Comcast
That’s a lot!

w w w .caida.or
Location of Interconnection (DNS)
22
Level3 Interconnections with Cox from atl02

w w w .caida.or
Location of Interconnection (DNS)
22
Level3 Interconnections with Cox from atl02
Atlanta
NDT SERVER

w w w .caida.or
Location of Interconnection (DNS)
22
Level3 Interconnections with Cox from atl02
Washington, D.C.
Atlanta
Dallas
Los Angeles
San Jose
NDT SERVER
7 links
5 links
12 links
9 links

w w w .caida.or
Location of Interconnection (DNS)
22
Level3 Interconnections with Cox from atl02
Washington, D.C.
Atlanta
Dallas
Los Angeles
San Jose
Large geographical diversity in traversed interconnections
NDT SERVER
7 links
5 links
12 links
9 links

w w w .caida.or
Summary and Recommendations
• Assumption of direct connectivity may not always be valid, analysis must use path information to verify assumption
• Traceroutes in both directions would be most useful
- But clients typically run NDT from a web interface
• Tools like bdrmap or MAP-IT on server-side infrastructure would help match NDT tests with interconnection links traversed
23
w w w .caida.or
What is the Coverage of Testing Servers?
• Which interconnections of an access network are “testable” using M-lab and speedtest.net servers?
• Which interconnections traversed on the path to popular web content are testable using M-lab and speedtest.net servers?
24
w w w .caida.or
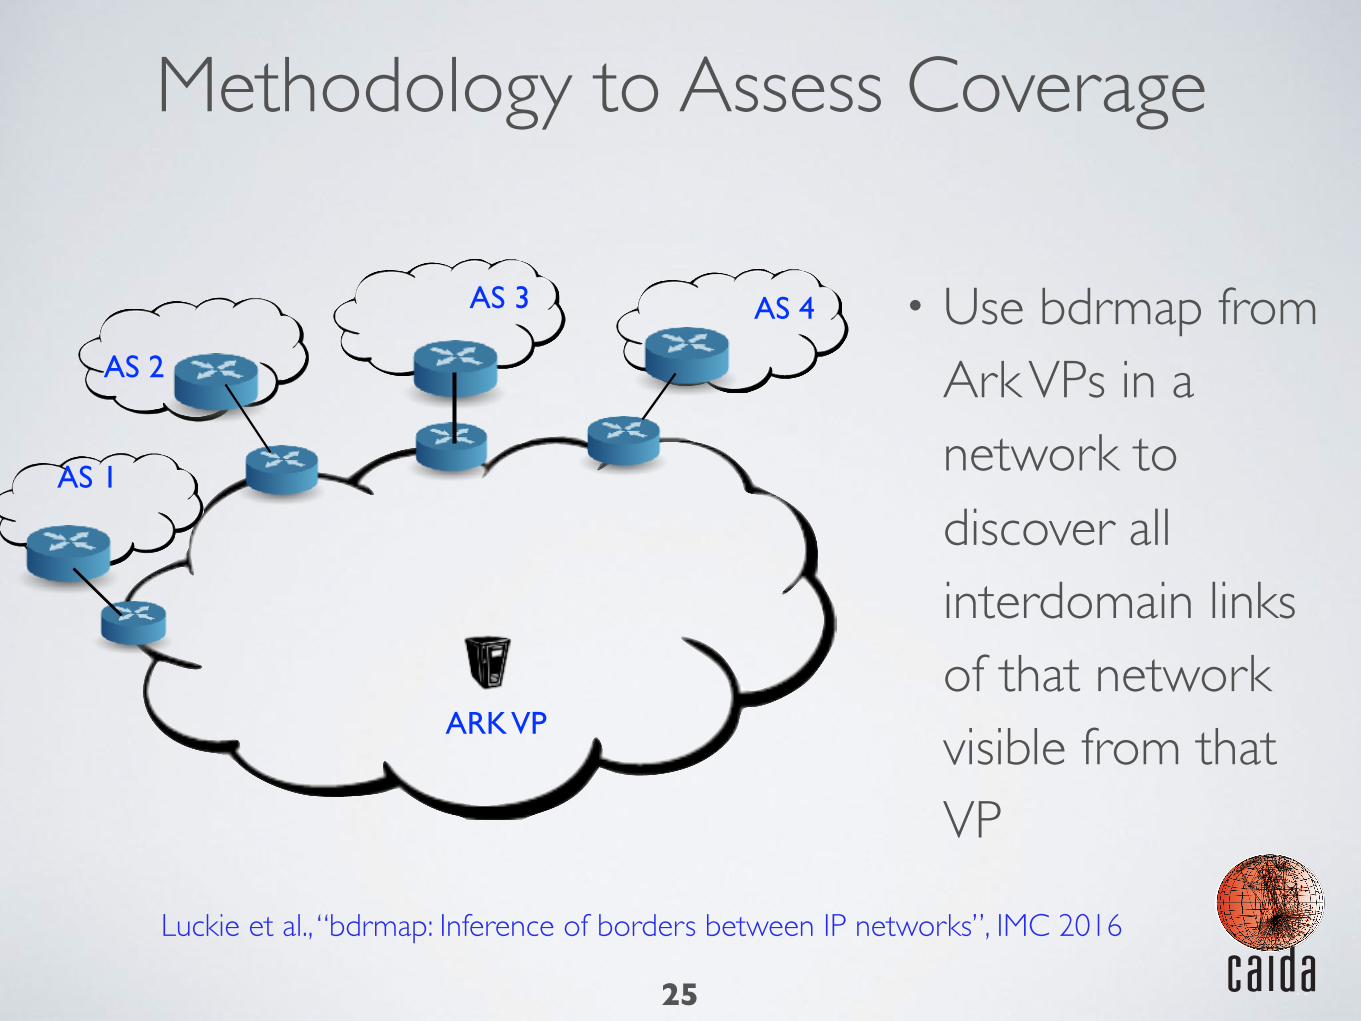
Methodology to Assess Coverage
25
• Use bdrmap from Ark VPs in a network to discover all interdomain links of that network visible from that VP
Luckie et al., “bdrmap: Inference of borders between IP networks”, IMC 2016
AS 1
AS 2
AS 3 AS 4
ARK VP

w w w .caida.or
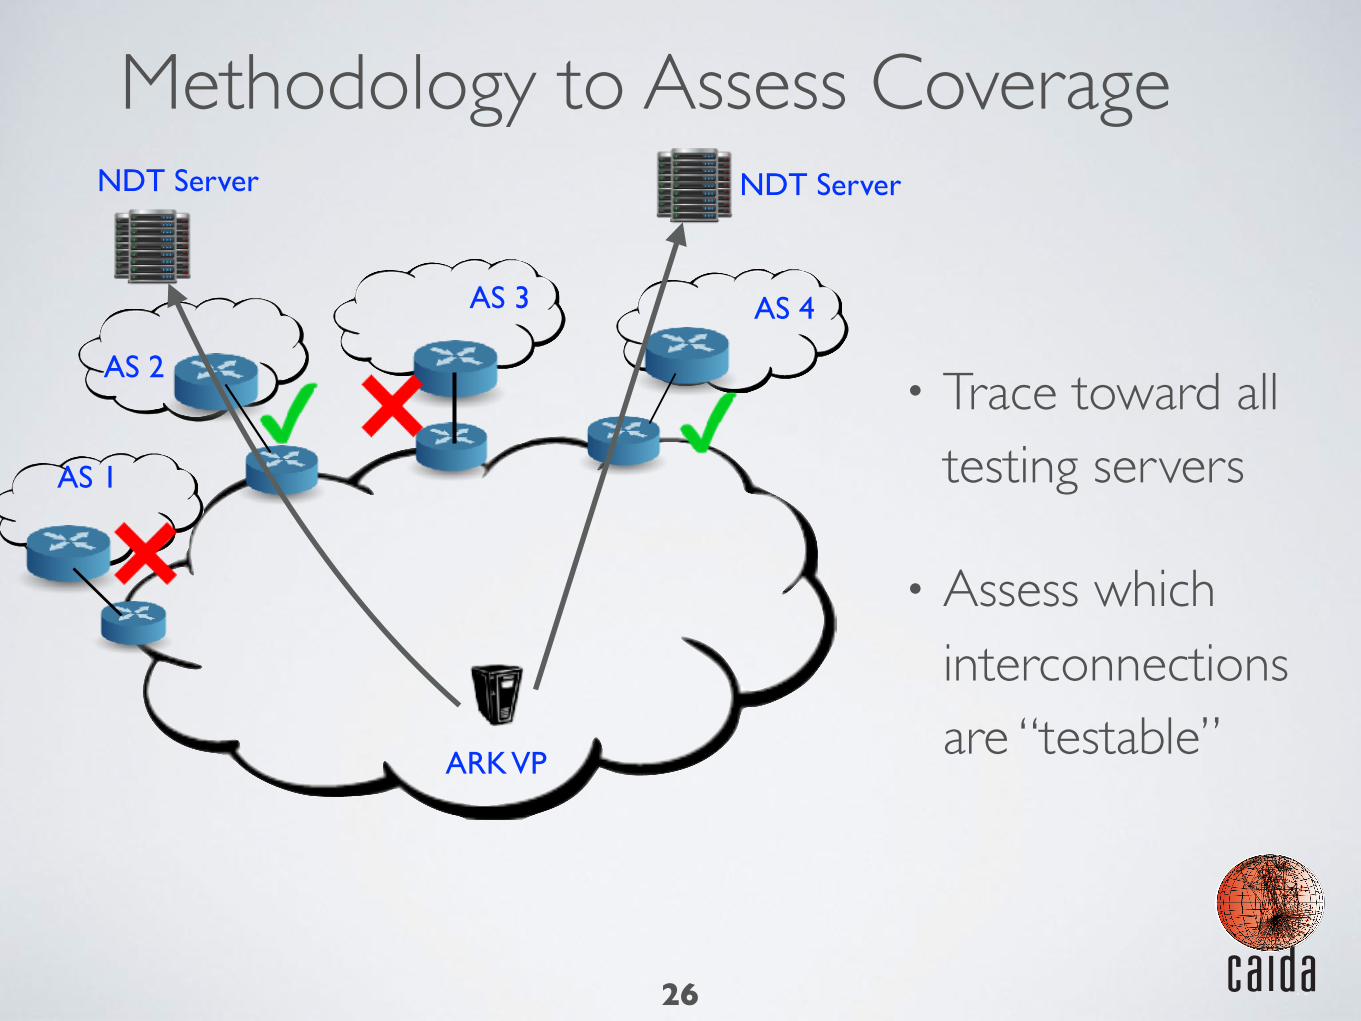
Methodology to Assess Coverage
26
• Trace toward all testing servers
• Assess which interconnections are “testable”
NDT Server NDT Server
ARK VP
AS 1
AS 2
AS 3 AS 4
w w w .caida.or
Methodology to Assess Coverage
26
• Trace toward all testing servers
• Assess which interconnections are “testable”
NDT Server NDT Server
ARK VP
AS 1
AS 2
AS 3 AS 4
w w w .caida.or
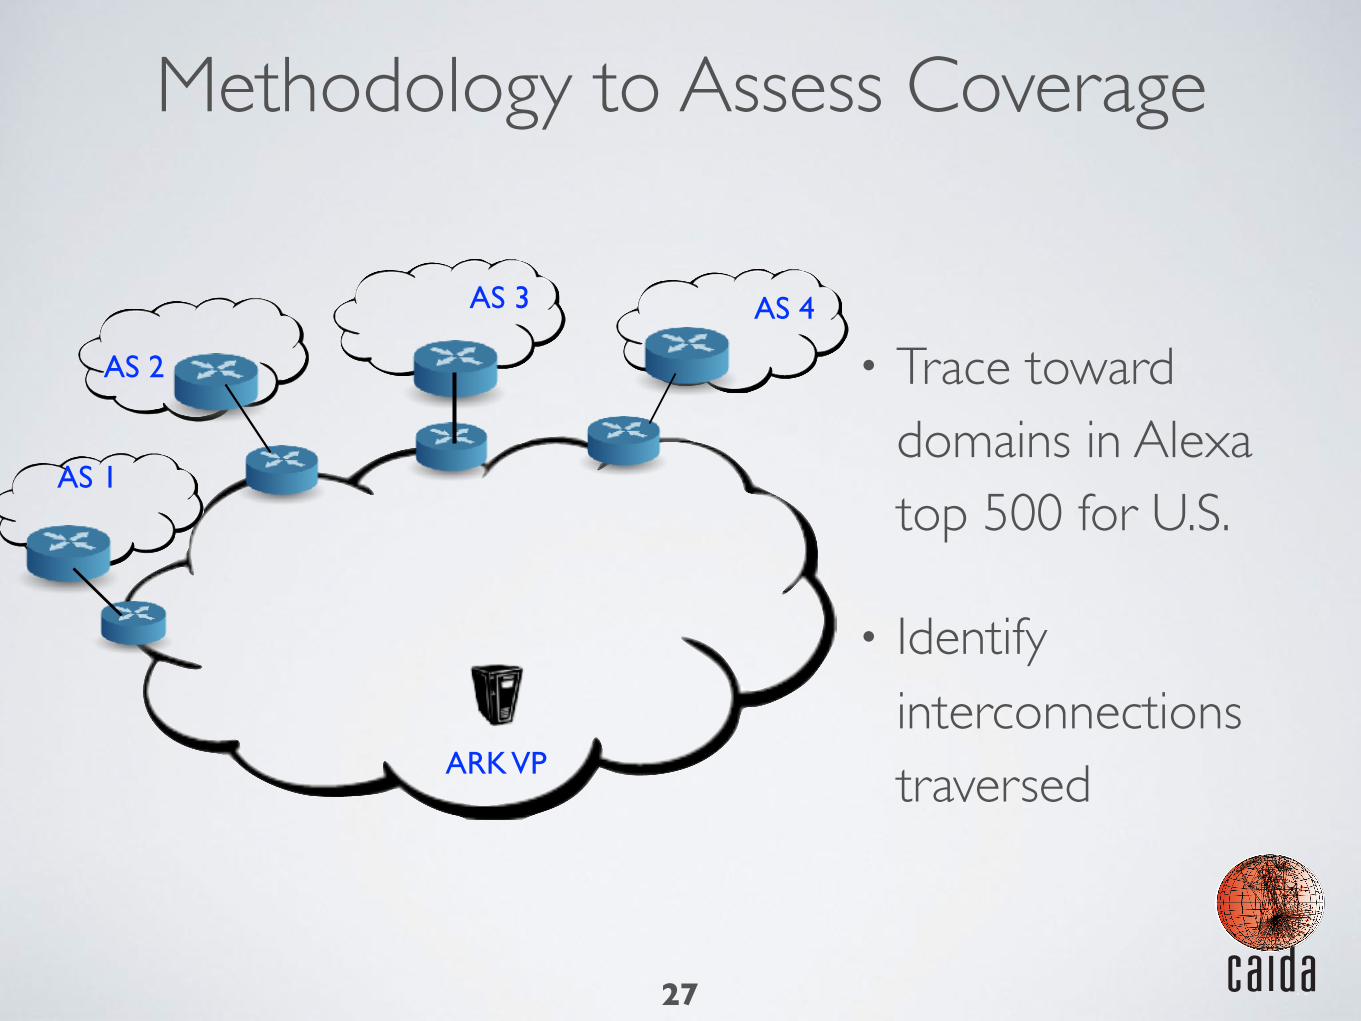
Methodology to Assess Coverage
27
• Trace toward domains in Alexa top 500 for U.S.
• Identify interconnections traversedARK VP
AS 1
AS 2
AS 3 AS 4

w w w .caida.or
Methodology to Assess Coverage
27
• Trace toward domains in Alexa top 500 for U.S.
• Identify interconnections traversedARK VP
AS 1
AS 2
AS 3 AS 4

w w w .caida.or
Methodology to Assess Coverage
27
• Trace toward domains in Alexa top 500 for U.S.
• Identify interconnections traversed
Alexa Alexa
ARK VP
AS 1
AS 2
AS 3 AS 4

w w w .caida.or
Measurement Study
• 16 Ark VPs in the US: Comcast (5), Time Warner (3), Cox (2), AT&T, Verizon, CenturyLink, Charter, Frontier, Sonic, RCN
• Crawled Alexa U.S. top 500, resolved domains and subdomains locally on monitor
• Traceroutes toward Alexa targets, M-lab servers, speedtest.net servers
28

w w w .caida.or
Low Coverage of Interconnections
• Between 0.4% (AT&T) and 9% (Frontier) of interconnections were testable with M-lab servers
29
1
10
100
1000
10000
CO
M-1
CO
M-2
CO
M-3
CO
M-4
CO
M-5
VZ TWC
-1TW
C-2
TWC
-3C
OX-1
CO
X-2C
ENT
SON
CR
CN
FRO
NATT
ASin
terc
onne
ctio
ns
Bordermap Mlab Speedtest

w w w .caida.or
Low Coverage of Interconnections
29
1
10
100
1000
10000
CO
M-1
CO
M-2
CO
M-3
CO
M-4
CO
M-5
VZ TWC
-1TW
C-2
TWC
-3C
OX-1
CO
X-2C
ENT
SON
CR
CN
FRO
NATT
ASin
terc
onne
ctio
ns
Bordermap Mlab Speedtest

w w w .caida.or
Low Coverage of Interconnections
29
1
10
100
1000
10000
CO
M-1
CO
M-2
CO
M-3
CO
M-4
CO
M-5
VZ TWC
-1TW
C-2
TWC
-3C
OX-1
CO
X-2C
ENT
SON
CR
CN
FRO
NATT
ASin
terc
onne
ctio
ns
Bordermap Mlab Speedtest
• Better coverage with speedtest.net servers: between 2.3% (AT&T) and 28% (Sonic)

w w w .caida.or
Peer Interconnections
• Between 2.8% (RCN) and 30% (Sonic) of peer interconnections were testable with M-lab servers
30
1
10
100
CO
M-1
CO
M-2
CO
M-3
CO
M-4
CO
M-5
VZ TWC
-1TW
C-2
TWC
-3C
OX-1
CO
X-2C
ENT
SON
CR
CN
FRO
NATT
ASin
terc
onne
ctio
nsBordermap Mlab Speedtest

w w w .caida.or
Overlap with Popular Web Content
• Significant number of AS interconnections on paths to Alexa web content not testable using M-lab or Speedtest
31
0
20
40
60
80
100
CO
M-1
CO
M-2
CO
M-3
CO
M-4
CO
M-5
VZ TWC
-1TW
C-2
TWC
-3C
OX-1
CO
X-2C
ENT
SON
CR
CN
FRO
NATT
ASin
terc
onne
ctio
ns
Mlab-AlexaAlexa-Mlab
Speedtest-AlexaAlexa-Speedtest

w w w .caida.or
Summary and Recommendations• Currently a small fraction of interdomain interconnections
of an access network are “testable” using M-lab or Speedtest
- Better coverage for Speedtest, but not an open testing platform
• Prioritize placement of testing servers on paths to popular content
• Our analysis does not capture video providers, need different methodology
32
w w w .caida.or
Statistical Challenges
• Limitations of crowdsourcing
- Samples cannot be controlled: clients test when they will
- Time of day variations: more samples during peak than off-peak
- Service plan variations
- Home network performance problems
• Thresholds to detect congestion
33
w w w .caida.or
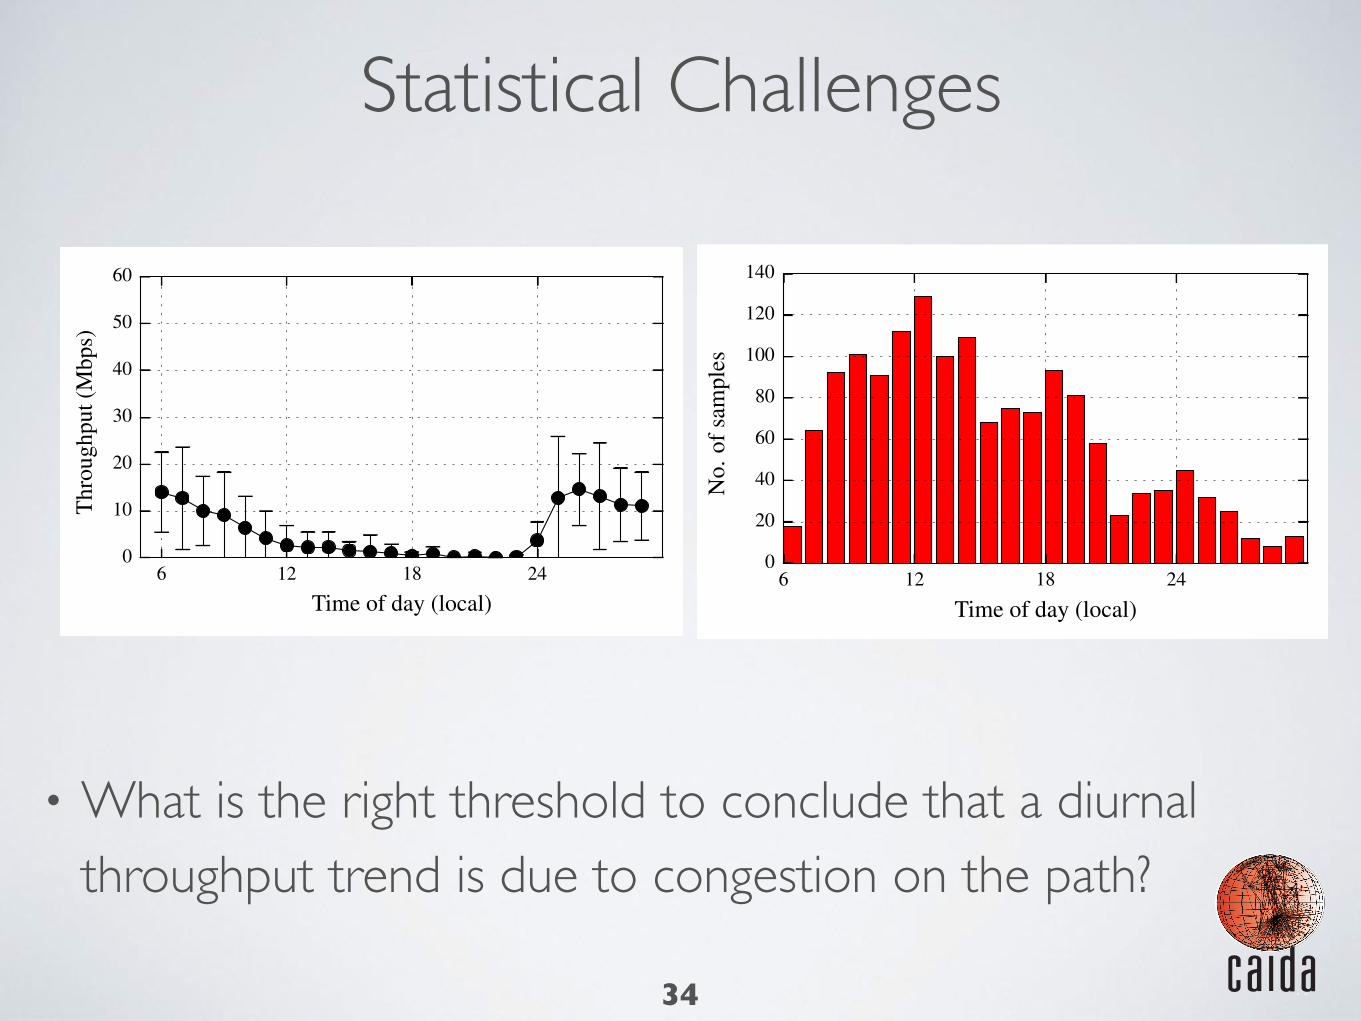
Statistical Challenges
• What is the right threshold to conclude that a diurnal throughput trend is due to congestion on the path?
34
6 12 18 24
Time of day (local)
0
10
20
30
40
50
60
Thro
ughp
ut(M
bps)
6 12 18 24
Time of day (local)
0
20
40
60
80
100
120
140
No.
ofsa
mpl
es

w w w .caida.or
Statistical Challenges
• 20-30% difference in throughput between peak and off-peak
35
6 12 18 24
Time of day (local)
0
10
20
30
40
50
60
Thro
ughp
ut(M
bps)
6 12 18 24Time of day (local)
0
50
100
150
200
250
No.
ofsa
mpl
es
w w w .caida.or
Summary and Recommendations
• Analysis should ensure enough samples are available for statistical significance
- Particularly if analysis is done per-link, samples will be sparse
• Need periodic, deterministic measurements to overcome the limitations of crowdsourcing
36
