challenges and opportunities for the u.s. dairy industry · jeff bulk konhokton south new berlin...
TRANSCRIPT
1
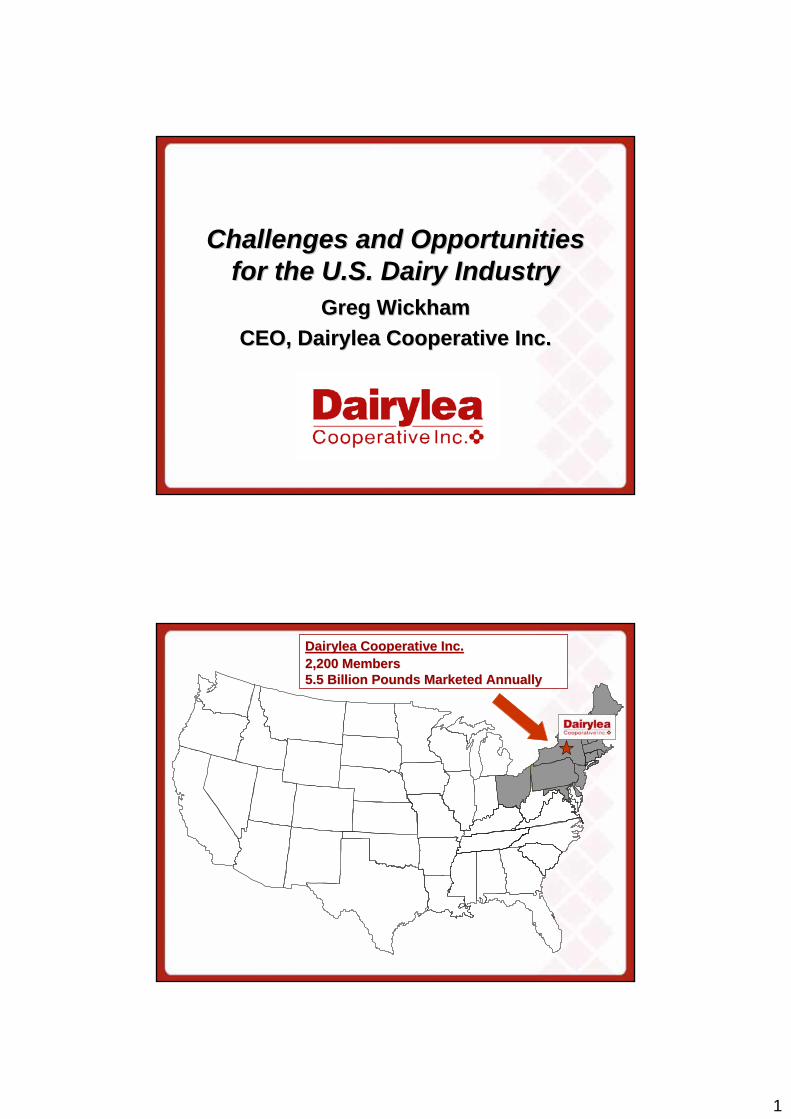
Challenges and Opportunities Challenges and Opportunities for the U.S. Dairy Industryfor the U.S. Dairy Industry
Greg WickhamGreg WickhamCEO, Dairylea Cooperative Inc.CEO, Dairylea Cooperative Inc.
Dairylea Cooperative Inc.Dairylea Cooperative Inc.2,200 Members2,200 Members5.5 Billion Pounds Marketed Annually5.5 Billion Pounds Marketed Annually
2
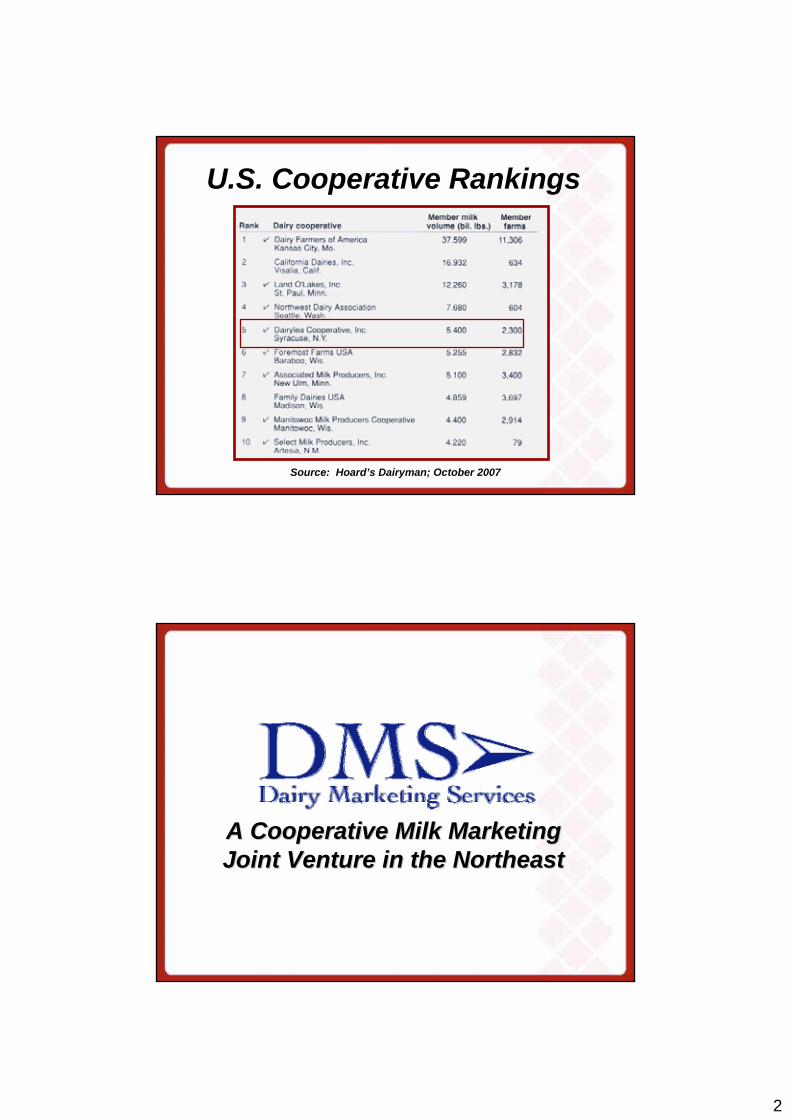
U.S. Cooperative Rankings
Source: Hoard’s Dairyman; October 2007
A Cooperative Milk Marketing A Cooperative Milk Marketing Joint Venture in the NortheastJoint Venture in the Northeast
3
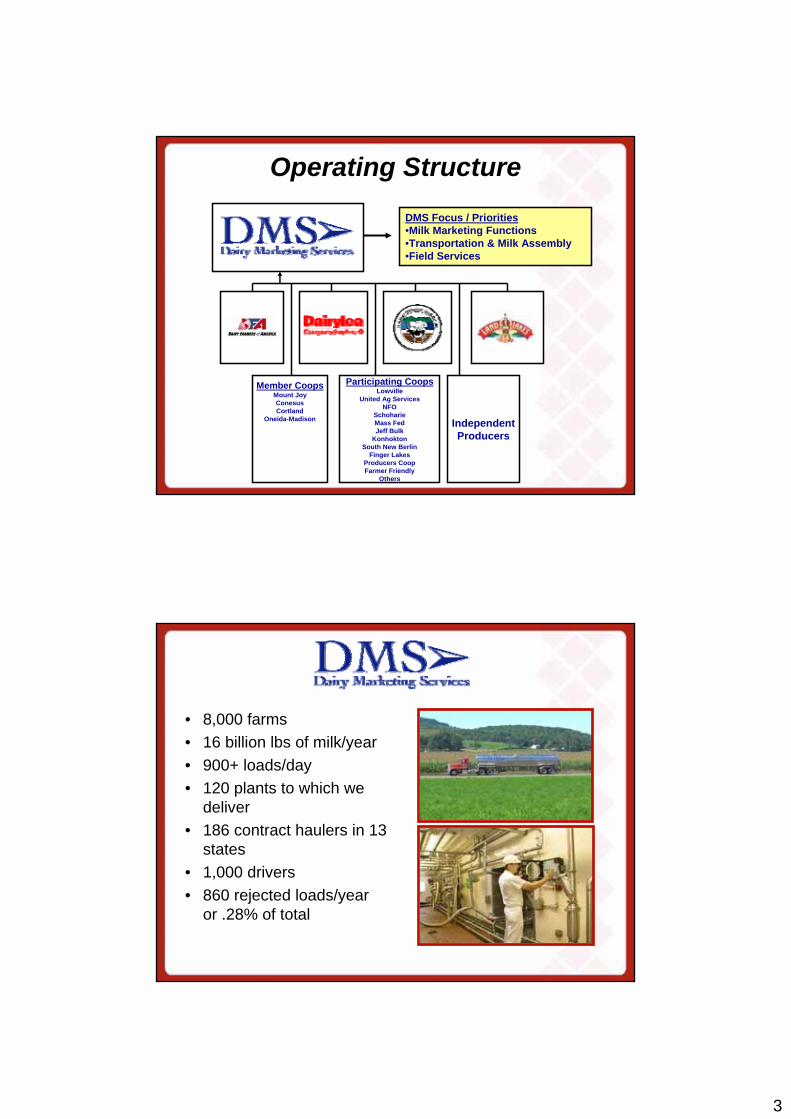
Operating Structure
Participating CoopsLowville
United Ag ServicesNFO
SchoharieMass FedJeff Bulk
KonhoktonSouth New Berlin
Finger LakesProducers CoopFarmer Friendly
Others
IndependentProducers
DMS Focus / Priorities•Milk Marketing Functions•Transportation & Milk Assembly•Field Services
Member CoopsMount JoyConesusCortland
Oneida-Madison
• 8,000 farms• 16 billion lbs of milk/year• 900+ loads/day• 120 plants to which we
deliver• 186 contract haulers in 13
states• 1,000 drivers• 860 rejected loads/year
or .28% of total

4
December 2007Northeast Market Share
DMS 56.1%
Unknown 4.8%
Independents13.6%
DMS MEC1.2%
AgriMark8.9%
Upstate Niagara5.6%
MD-VA4.2%
Other Cooperatives4.4%
Division 951.0%
7 Unique Farm Services

5
Dairylea is a Dairylea is a Member Cooperative of DFAMember Cooperative of DFA
Area Councils
American Dairy BrandsAmerican Cheese
Italian Cheese Formulated Dairy Foods
AffiliatesIngredients
DFA Business Units
Fluid

6
Dairy PlantsDFA Marketing Network
DFA Marketing NetworkDean Foods (105)DFA Branded (4)DFA Cheese (5)DFA Formulated (6)DFA Manufacturing (7)Fluid JV (64)Leprino Foods Co (9)Manufacturing JV (15)
Member Demographics
12,183 Members
500 Largest Farms Make 50% of total milk marketed

7
EconomicsEconomics
What Affects Milk Prices?• International markets• National milk
production• Economy• Dairy product
consumption• CWT• Weather• rbST use

8
$7 Corn and $120 Oil$7 Corn and $120 OilDo not work with Do not work with
$18 Milk$18 Milk
Prices Will Continue to Cycle but at a Higher Level
Central NY Annual Average Gross Milk Price 1996-2008
$11.00
$13.00
$15.00
$17.00
$19.00
$21.00
1996
1997
1998
1999
2000
2001
2002
2003
2004
2005
2006
2007
2008
E
$ pe
r hu
ndre
dwei
ght

9
U.S. Milk Production GrowthYear-over-year, 2005-2008
3.9%2.7%
2.1%2.7%
0.0%1.0%2.0%3.0%4.0%5.0%
2005 2006 2007 2008E
U.S. Dairy Exports as a Percent of U.S. Milk Production, 2001-2007
5.5 5.15.7
7.58.3
9.3 9.5
0
2
4
6
8
10
01 02 03 04 05 06 07
% o
f milk
pro
duct
ion Data Source: US Dairy Export Council

10
Costs UpCosts UpSubstantiallySubstantially
U.S. Average Purchased Feed Cost, 2002-2008
$3.59 $3.68 $3.97 $3.50 $3.88$5.22
$7.23
$0
$2
$4
$6
$8
2002 2003 2004 2005 2006 2007 2008E
$ pe
r C
WT
of M
ilk

11
U.S. Dairy Industry U.S. Dairy Industry Trends & Trends &
BackgroundBackground
Size of Average U.S. Dairy Farm1992 - 2007
74 76 80 84 87 92 100105 111 118123135140 147
155
129
0
25
50
75
100
125
150
175
1992
1993
1994
1995
1996
1997
1998
1999
2000
2001
2002
2003
2004
2005
2006
2007
Dai
ry C
ows
per F
arm

12
Farm Size Trends… % of Milk in U.S. by Farm Size
Year 200-499 500-999 1,000-1,999 2,000+ Total1980 2.10% 0.50% 0% 0% 2.60%2002 17.5% 13.9% 13.0% 15.0% 59.4%2009 11.6% 12.3% 17.3% 33.8% 75.0%
U.S. Annual Milk Production 1997-2007
150,000
155,000
160,000
165,000
170,000
175,000
180,000
185,000
190,000
1997 1998 1999 2000 2001 2002 2003 2004 2005 2006 2007
Mill
ion
Poun
ds
Annual Growth Rate Approximately 2% Over Time

13
Production Per Cow1997-2007
10,000
12,000
14,000
16,000
18,000
20,000
22,000
1997 1998 1999 2000 2001 2002 2003 2004 2005 2006 2007
Poun
ds
U.S.Northeast
The 3,000 biggest farms in the The 3,000 biggest farms in the U.S. produce more milk than U.S. produce more milk than any single country in the EU!any single country in the EU!

14
Regional Changes10-Year Milk Shed Shift
50%50%50%50%50%50%50%50%50%
-53%-53%-53%-53%-53%-53%-53%-53%-53%
-17%-17%-17%-17%-17%-17%-17%-17%-17%
-15%-15%-15%-15%-15%-15%-15%-15%-15% -41%-41%-41%-41%-41%-41%-41%-41%-41%-27%-27%-27%-27%-27%-27%-27%-27%-27%
-42%-42%-42%-42%-42%-42%-42%-42%-42%
-38%-38%-38%-38%-38%-38%-38%-38%-38%
-10%-10%-10%-10%-10%-10%-10%-10%-10%1%1%1%1%1%1%1%1%1%
62%62%62%62%62%62%62%62%62% -62%-62%-62%-62%-62%-62%-62%-62%-62%
49%49%49%49%49%49%49%49%49%
56%56%56%56%56%56%56%56%56%
-10%-10%-10%-10%-10%-10%-10%-10%-10%
-7%-7%-7%-7%-7%-7%-7%-7%-7%
131%131%131%131%131%131%131%131%131%
-15%-15%-15%-15%-15%-15%-15%-15%-15%
8%8%8%8%8%8%8%8%8%
85%85%85%85%85%85%85%85%85%-31%-31%-31%-31%-31%-31%-31%-31%-31%
-54%-54%-54%-54%-54%-54%-54%-54%-54%
-10%-10%-10%-10%-10%-10%-10%-10%-10%
31%31%31%31%31%31%31%31%31%
-10%-10%-10%-10%-10%-10%-10%-10%-10%
-48%-48%-48%-48%-48%-48%-48%-48%-48%
-28%-28%-28%-28%-28%-28%-28%-28%-28%
15%15%15%15%15%15%15%15%15%
3%3%3%3%3%3%3%3%3%
20%20%20%20%20%20%20%20%20%
92%92%92%92%92%92%92%92%92%
5%5%5%5%5%5%5%5%5%
-29%-29%-29%-29%-29%-29%-29%-29%-29%
-39%-39%-39%-39%-39%-39%-39%-39%-39%
9%9%9%9%9%9%9%9%9%
-5%-5%-5%-5%-5%-5%-5%-5%-5%
38%38%38%38%38%38%38%38%38%
1%1%1%1%1%1%1%1%1%
-24%-24%-24%-24%-24%-24%-24%-24%-24%
3%3%3%3%3%3%3%3%3%
-37%-37%-37%-37%-37%-37%-37%-37%-37%
16%16%16%16%16%16%16%16%16%
13%13%13%13%13%13%13%13%13%
-5%-5%-5%-5%-5%-5%-5%-5%-5%
5%5%5%5%5%5%5%5%5%
-24%-24%-24%-24%-24%-24%-24%-24%-24%
4%4%4%4%4%4%4%4%4%
26%26%26%26%26%26%26%26%26%
Pct Change in Annual Milk Production3-Year Average: 1995-1997 / 2005-2007
Increase greater than 25% (10)Increase from 10 to 25% (4)Increase from 0 to 10% (9)Decrease from 0 to 10% (6)Decrease from 10 to 25% (6)Decrease greater than 25% (13)
Why the Shift West?
• Land availability & price
• California Real Estate $$
• State incentives• Environmental
15
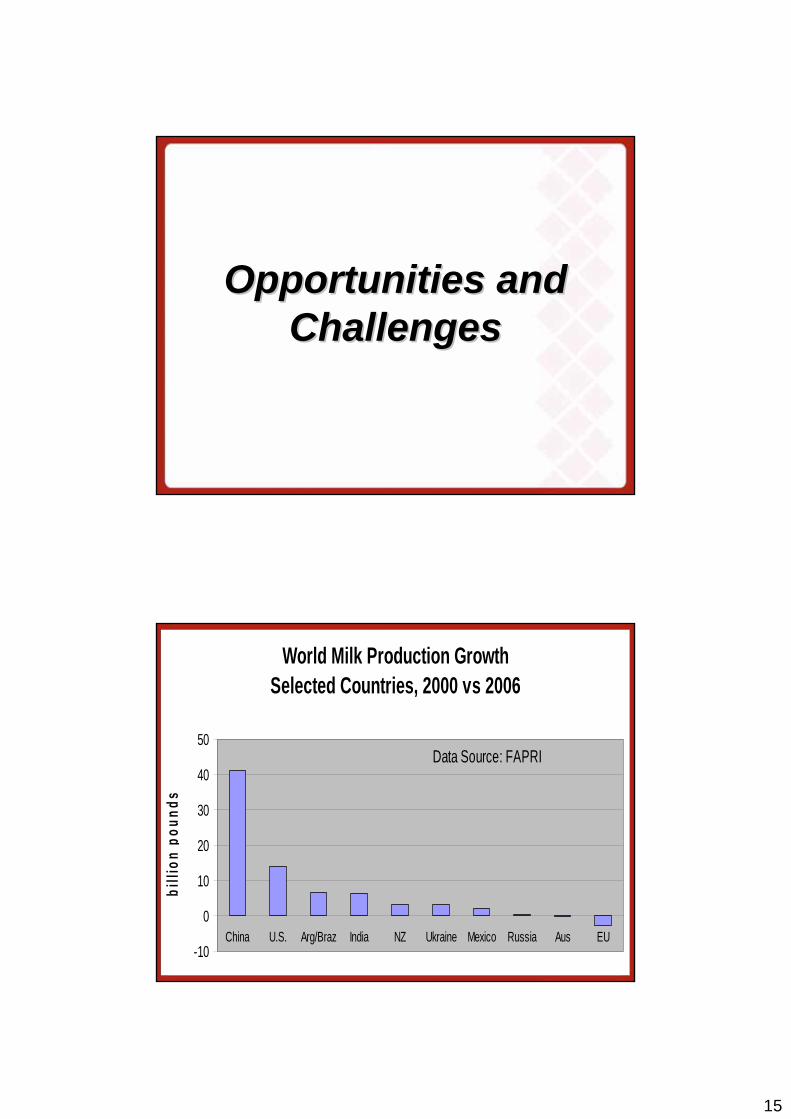
Opportunities and Opportunities and ChallengesChallenges
World Milk Production GrowthSelected Countries, 2000 vs 2006
-10
0
10
20
30
40
50
China U.S. Arg/Braz India NZ Ukraine Mexico Russia Aus EU
billi
on p
ound
s
Data Source: FAPRI

16
Reduced World Inventories
Low World Stocks = Low World Stocks = Upward Price Pressure Upward Price Pressure
& More Volatility& More Volatility

17
China's GDP Per Person, RNB, 1953-2005
02,0004,0006,0008,000
10,00012,00014,00016,000
53 56 59 62 65 68 71 74 77 80 83 86 89 92 95 98 01 04
Year
RN
B P
er P
erso
n RNB = Renminbi, official currency of China
• China GDP has almost doubled since 2000• RNB 14,000 = $ 1,866• U.S. GDP per person = $ 44,000
U.S. History of Exports
• 1950 – 1995“Anyhow Exporter”
• 1995 – 2000Farm Leadership Interest in Exports
• 2000 – PresentIndustry Very Focused on Exports
18
US Attitude on Dairy Exports
• Previous– Sell what we make– Price takers– Other countries lead world sales
• Current– Listen to customer needs– Want to be price makers– Desire to represent ourselves on sales
Slumping Value of the U.S. Dollar
On Purpose?How Much Did it Help Exports?

19
Ethanol Boom or Bust…
Biofuel … Is It Good U.S. Policy?
20
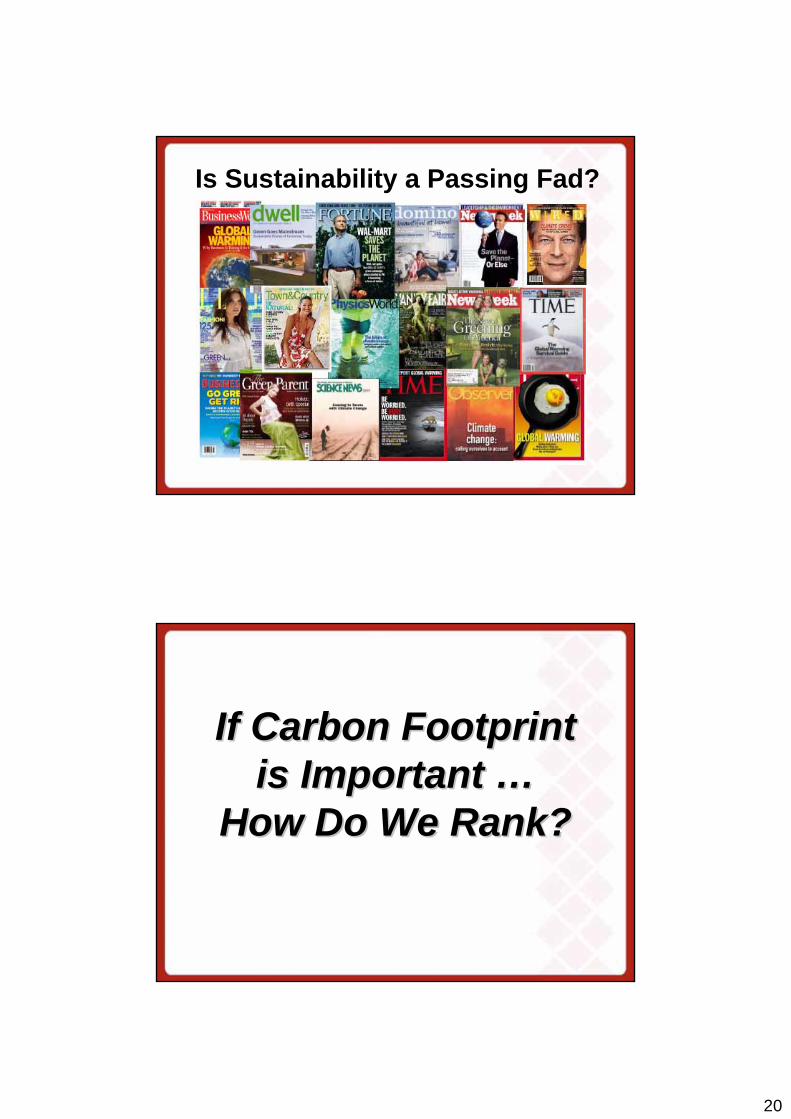
Is Sustainability a Passing Fad?
If Carbon Footprint If Carbon Footprint is Important …is Important …
How Do We Rank?How Do We Rank?

21
Carbon Footprint
• Low– Maximum
Technology• High
– Organic / Less Technology
Industry Consolidation
• Processors• Cooperatives• Dairy Farms• Federal Orders

22
Will rbST RIP?

23
!
!
! !
!
!!
!
!
CrowleyConcord
CalabroEast Haven
FarmlandWallington
OaktreeEast Northpor
St AlbansSt Albans
OakhurstPortland
HoodPortland
GrantsBangor
Houlton DairyHoulton
rbST-free Plants 2006
24
!
!
!!
!
!
!
!
!
!
! !
!!
!
!
!
!
!
!
!
!
!!
!
!
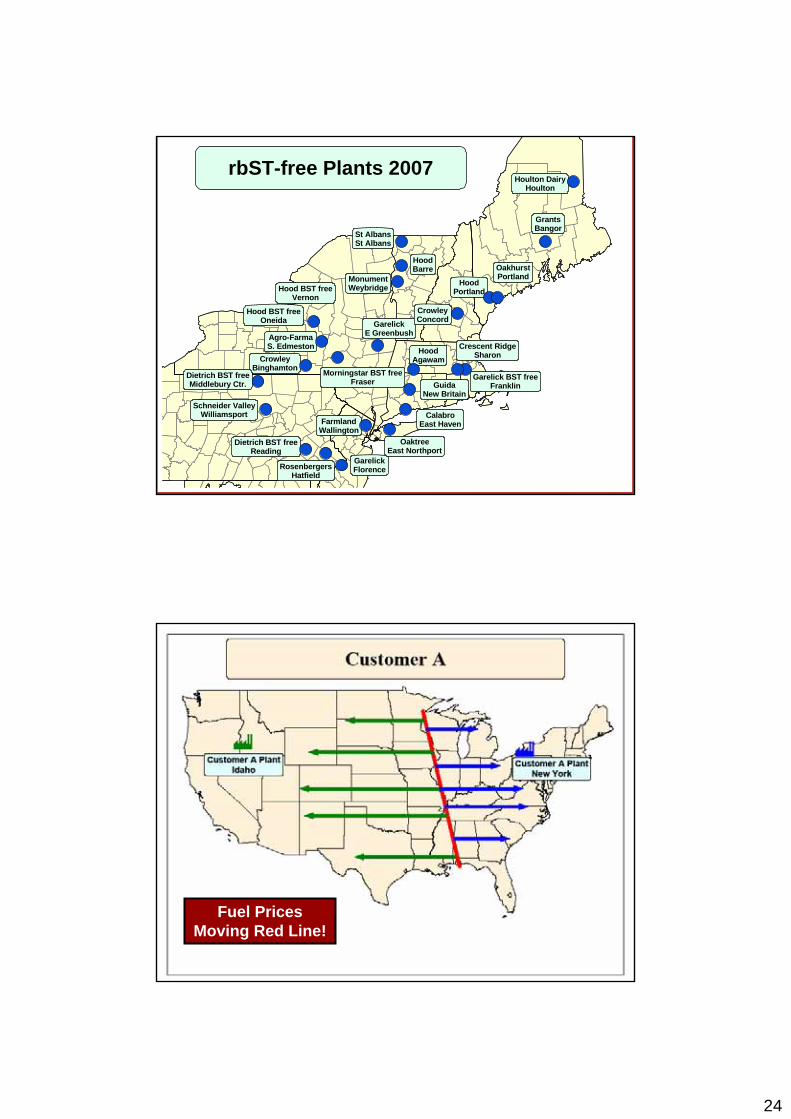
GarelickE Greenbush
Schneider ValleyWilliamsport
Dietrich BST freeReading
RosenbergersHatfield
GarelickFlorence
FarmlandWallington
CrowleyBinghamton
Dietrich BST freeMiddlebury Ctr.
Agro-FarmaS. Edmeston
Morningstar BST freeFraser
Hood BST freeOneida
Hood BST freeVernon
Crescent RidgeSharonHood
Agawam
OaktreeEast Northport
CalabroEast Haven
GuidaNew Britain
Garelick BST freeFranklin
CrowleyConcord
HoodBarre
MonumentWeybridge
St AlbansSt Albans
OakhurstPortland
HoodPortland
GrantsBangor
Houlton DairyHoulton
rbST-free Plants 2007
Fuel Prices Moving Red Line!

25
Immigration Reform
Can the U.S. Dairy Can the U.S. Dairy Industry Continue Industry Continue
To Grow?To Grow?

26
New Technology• Remove Water
• Genetics
• Robotics
• Fractionalization
Will U.S. Farms Will U.S. Farms Invest Outside the Invest Outside the
U.S.?U.S.?

27
Thank YouThank You