challenges and opportunities for conservation, agricultural production…€¦ · ·...
TRANSCRIPT
v
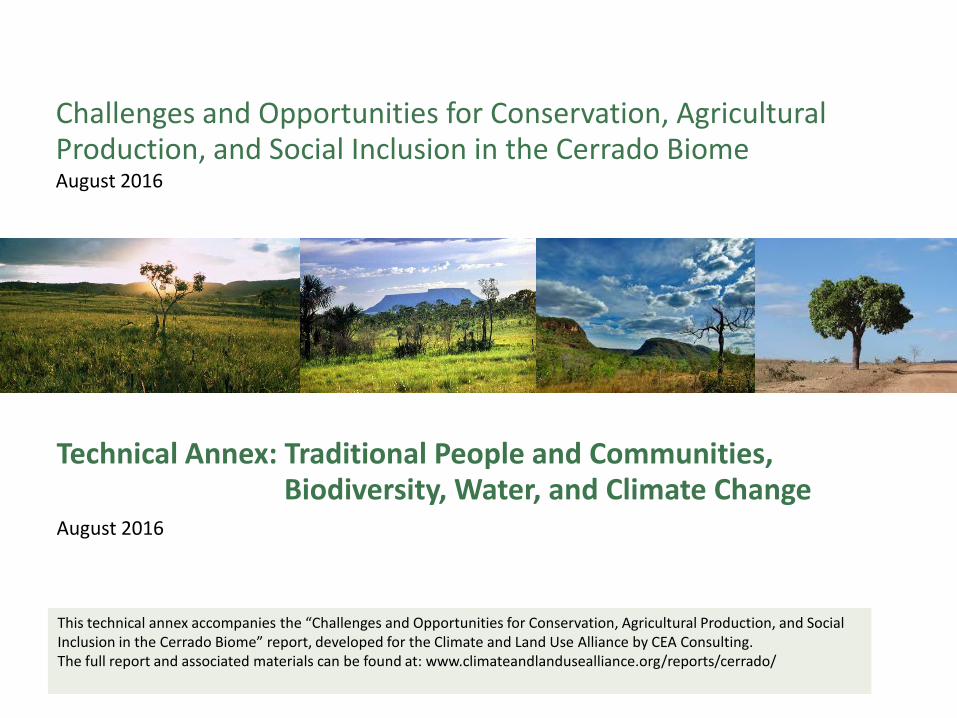
Technical Annex: Traditional People and Communities, Biodiversity, Water, and Climate Change
August 2016
Challenges and Opportunities for Conservation, Agricultural Production, and Social Inclusion in the Cerrado Biome August 2016
This technical annex accompanies the “Challenges and Opportunities for Conservation, Agricultural Production, and Social Inclusion in the Cerrado Biome” report, developed for the Climate and Land Use Alliance by CEA Consulting. The full report and associated materials can be found at: www.climateandlandusealliance.org/reports/cerrado/
Table of Contents
Traditional people and communities 3
Biodiversity and protected areas 16
Water in the Cerrado 30
Climate change and the Cerrado 43
2
TRADITIONAL PEOPLE AND COMMUNITIES
3
Traditional people and communities in the Cerrado
• The Matopiba region of the Cerrado is home to a rich diversity of cultures and people. It is an active area for family farmers and traditional forms of agriculture (including communal and extractive use of the land). It is also one of the poorest regions in the country.
• The most representative groups in the Cerrado are: indigenous people, quilombolas (descendants of former African slaves), extractivists, geraizeiros (artisanal farmers in Minas Gerais and Bahia), and groups that subsist in riverine environments (ribeirinhos and vazanteiros).
• In the Cerrado, traditional communities do not a strong political presence. Interviewees noted that this lack of capacity is a result of the lack of public and international attention historically given to the biome.
• The initiatives aimed at protecting these communities are dispersed across the biome and there is a lack of coordination among them.
• The most vocal groups tend to be completely opposed to the current agribusiness model, which is seen by many as a threat to the communities. Indeed, many communities feel that they are being pushed off of their land by large agribusinesses.
• PDA-MATOPIBA, the government’s new agriculture and livestock development plan for the Matopiba region is seen as major threat.
• Because these groups use artisanal ways of managing their land, some groups of the civil society believe that an important way to increase Cerrado conservation is by strengthening the communities.
4
The people in the Cerrado – a general overview
The communities in the Cerrado are very diversified, although there is not an official typology. The major groups include:
• Indigenous people: The Cerrado holds more than 80 indigenous group, most of which relied
on hunting activities and Coivara agriculture (an artisanal type of agriculture that relies on management with controlled fire and crop rotation). Indigenous groups in the Cerrado include Xavantes, Krahôs, Krikatis, Apinajés, Kanelas, Paresis, Karajás, Terenas, Kiniquinawas, Xakriabás, Kaxixos, and Guarani Kaiowás.
• Quilombolas: These people are descendants of African slaves who established their own groups, called Quilombos. Their relation with the land is more oriented toward the maintenance of their identity, culture, material/immaterial goods, and social relations than toward economic purposes.
• Geraizeiros: Acknowledged as the original farmers from the Cerrado, they are groups that used to manage the land, the cattle, and their crops in a collective fashion. Today they are concentrated in the north of Minas Gerais and the west of Bahia.
• Family farmers/Extractivists: In the Cerrado, family farming also includes extractive activities as a means to supplement income. Throughout the year, according to crop yields and timing, farmers collect native species for their own consumption, for selling, or for processing.
• Vazanteiros and Ribeirinhos: These groups inhabit areas near rivers and draw their livelihoods from the rivers. The groups are well adapted to the conditions of constant change caused by constant changes in riverine environments. Their main activities are artisanal fishing and agriculture.
5
Traditional people are frequently good environmental stewards
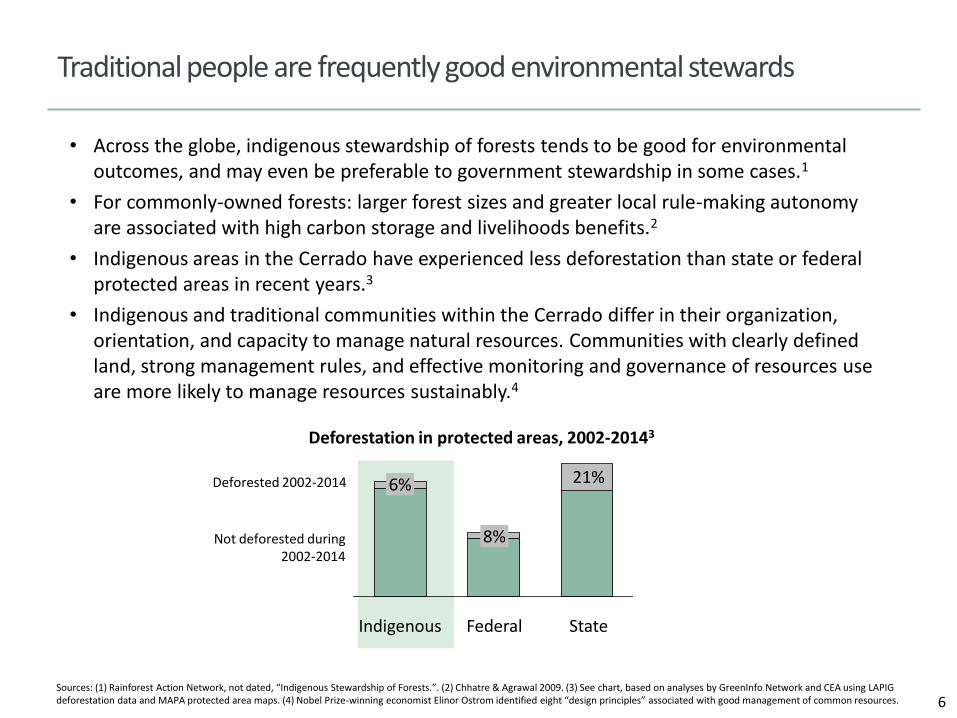
• Across the globe, indigenous stewardship of forests tends to be good for environmental outcomes, and may even be preferable to government stewardship in some cases.1
• For commonly-owned forests: larger forest sizes and greater local rule-making autonomy are associated with high carbon storage and livelihoods benefits.2
• Indigenous areas in the Cerrado have experienced less deforestation than state or federal protected areas in recent years.3
• Indigenous and traditional communities within the Cerrado differ in their organization, orientation, and capacity to manage natural resources. Communities with clearly defined land, strong management rules, and effective monitoring and governance of resources use are more likely to manage resources sustainably.4
6 Sources: (1) Rainforest Action Network, not dated, “Indigenous Stewardship of Forests.”. (2) Chhatre & Agrawal 2009. (3) See chart, based on analyses by GreenInfo Network and CEA using LAPIG deforestation data and MAPA protected area maps. (4) Nobel Prize-winning economist Elinor Ostrom identified eight “design principles” associated with good management of common resources.
6%
8%
Federal Indigenous State
21%
Deforestation in protected areas, 2002-20143
Not deforested during 2002-2014
Deforested 2002-2014
Mapping community lands is a priority for the Cerrado
7 Source: http://www.socioambiental.org/sites/blog.socioambiental.org/files/nsa/arquivos/mapa_babacu_10.pdf
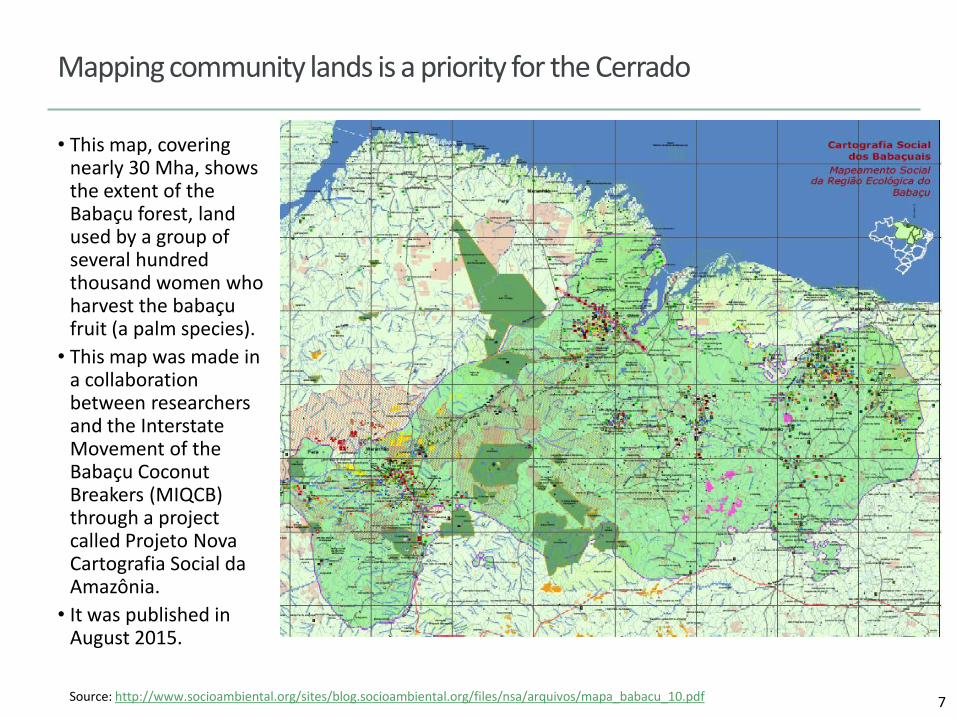
• This map, covering nearly 30 Mha, shows the extent of the Babaçu forest, land used by a group of several hundred thousand women who harvest the babaçu fruit (a palm species).
• This map was made in a collaboration between researchers and the Interstate Movement of the Babaçu Coconut Breakers (MIQCB) through a project called Projeto Nova Cartografia Social da Amazônia.
• It was published in August 2015.
The land issue is the primary concern of the communities
• Brazil has a long-standing history of conflicts over land, going back to the colonization period of the country. These conflicts are understood by many to be deep rooted and chronic, with no easy solution.
• According to the agrarian economist Bastiaan Reydon, the main problem with land conflict in Brazil is "the effective disability that the Brazilian State has always had with regularizing the land market and access to land for social, economic and environmental purposes.”
• In the Cerrado, there is considerable conflict between traditional communities, who have occupied the land for many generations, and large agribusiness actors, who are aggressively expanding in the region.
• Helping traditional communities and small-scale family farmers maintain control of their land and regularize their holdings should be a high priority for both the social movement and conservation agendas in Brazil.
• Reducing the conflict on the landscape will require support for communities and family farmers, through mapping their situation and needs, providing capacity building and legal training, engagement of the state level public prosecutors, identification of means to ensure access/right to land, coordination between various federal and state ministries and investment in upgraded data systems.
• Many stakeholders actively working with communities believe that the Rural Environmental Registry (CAR) is being used as a way to formalize land grabbing. Poor communities often do not have resources to register their land. A key need is providing means to support their inclusion in the registry.
8 Source: MDA, Núcleo de Estudos Agrários e Desenvolvimento Rural. Mercado de Terras no Brasil: estrutura e dinâmica. Brasília, 2006.
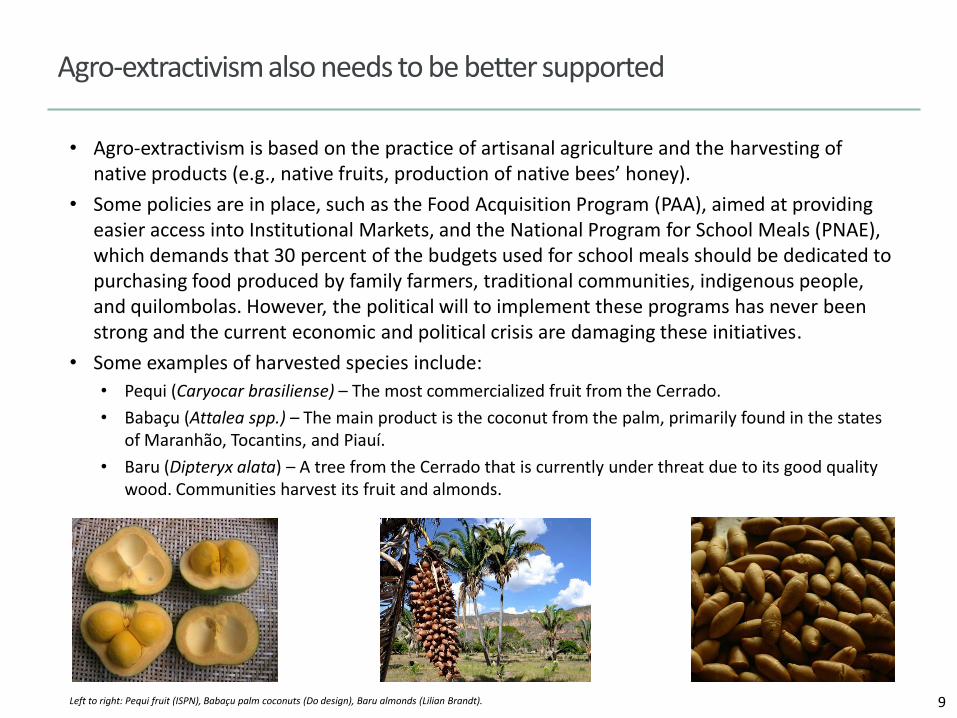
Agro-extractivism also needs to be better supported
• Agro-extractivism is based on the practice of artisanal agriculture and the harvesting of native products (e.g., native fruits, production of native bees’ honey).
• Some policies are in place, such as the Food Acquisition Program (PAA), aimed at providing easier access into Institutional Markets, and the National Program for School Meals (PNAE), which demands that 30 percent of the budgets used for school meals should be dedicated to purchasing food produced by family farmers, traditional communities, indigenous people, and quilombolas. However, the political will to implement these programs has never been strong and the current economic and political crisis are damaging these initiatives.
• Some examples of harvested species include:
• Pequi (Caryocar brasiliense) – The most commercialized fruit from the Cerrado.
• Babaçu (Attalea spp.) – The main product is the coconut from the palm, primarily found in the states of Maranhão, Tocantins, and Piauí.
• Baru (Dipteryx alata) – A tree from the Cerrado that is currently under threat due to its good quality wood. Communities harvest its fruit and almonds.
9 Left to right: Pequi fruit (ISPN), Babaçu palm coconuts (Do design), Baru almonds (Lilian Brandt).
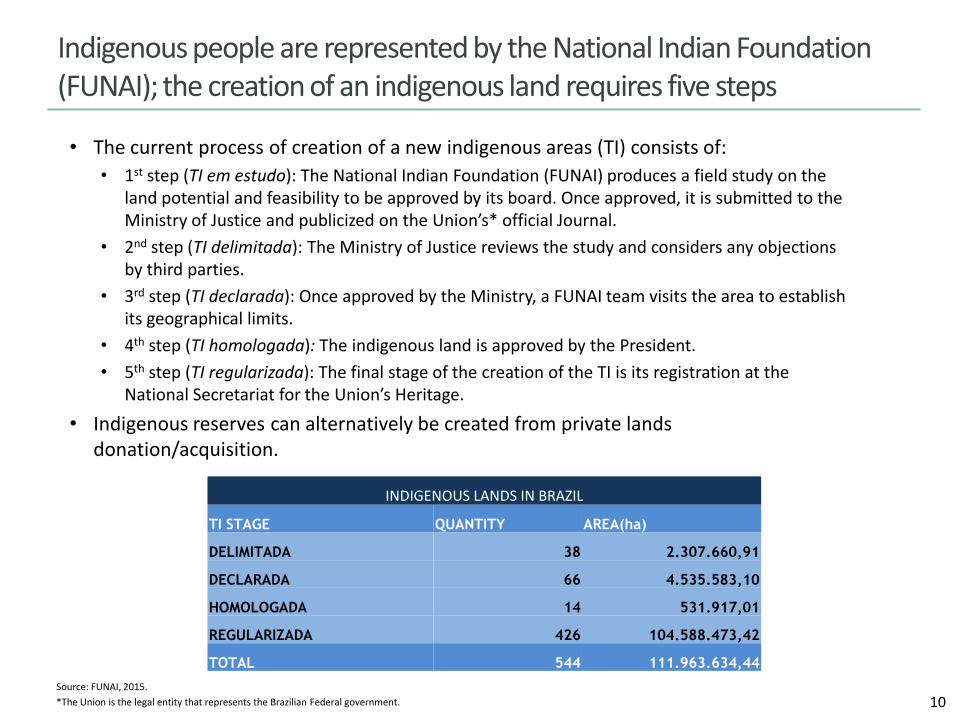
Indigenous people are represented by the National Indian Foundation (FUNAI); the creation of an indigenous land requires five steps
• The current process of creation of a new indigenous areas (TI) consists of:
• 1st step (TI em estudo): The National Indian Foundation (FUNAI) produces a field study on the land potential and feasibility to be approved by its board. Once approved, it is submitted to the Ministry of Justice and publicized on the Union’s* official Journal.
• 2nd step (TI delimitada): The Ministry of Justice reviews the study and considers any objections by third parties.
• 3rd step (TI declarada): Once approved by the Ministry, a FUNAI team visits the area to establish its geographical limits.
• 4th step (TI homologada): The indigenous land is approved by the President.
• 5th step (TI regularizada): The final stage of the creation of the TI is its registration at the National Secretariat for the Union’s Heritage.
• Indigenous reserves can alternatively be created from private lands donation/acquisition.
10 Source: FUNAI, 2015.
*The Union is the legal entity that represents the Brazilian Federal government.
INDIGENOUS LANDS IN BRAZIL
TI STAGE QUANTITY AREA(ha)
DELIMITADA 38 2.307.660,91
DECLARADA 66 4.535.583,10
HOMOLOGADA 14 531.917,01
REGULARIZADA 426 104.588.473,42
TOTAL 544 111.963.634,44
The current political debate around the creation of future indigenous areas and quilombola lands is concerning
• A bill under discussion at the House of Representatives wants to change the 4th step of the process by changing the power of approval of the creation of future new indigenous areas from the President to the Brazilian Congress.
• This power also includes the re-approval of all the proposed areas that have been approved (4th step), but have not yet been regularized (5th step). It also establishes that new quilombola lands would need to be created by law.
• There has been constant mobilization of the civil society groups with a concern that economic interests are going to be prioritized even more and community control will be further weakened.
• The common concern of the communities is that this proposition is especially dangerous during a time when a rural and conservative caucus is in place with considerable political strength in the National Congress – one of the most outspoken audiences against the creation of new indigenous areas.
11
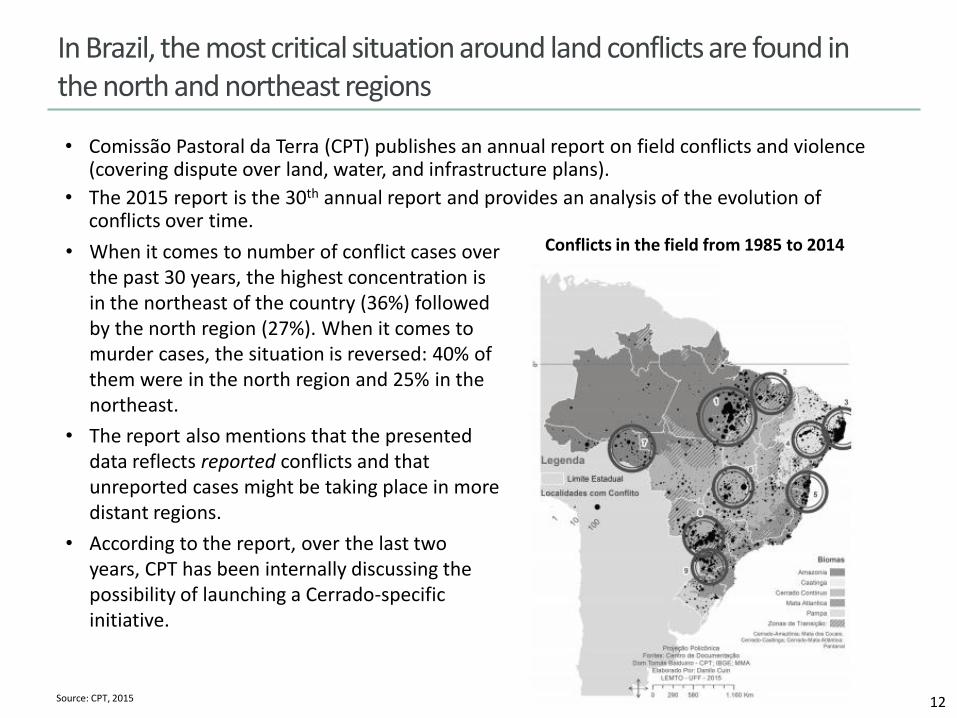
In Brazil, the most critical situation around land conflicts are found in the north and northeast regions
• Comissão Pastoral da Terra (CPT) publishes an annual report on field conflicts and violence (covering dispute over land, water, and infrastructure plans).
• The 2015 report is the 30th annual report and provides an analysis of the evolution of conflicts over time.
12 Source: CPT, 2015
• When it comes to number of conflict cases over the past 30 years, the highest concentration is in the northeast of the country (36%) followed by the north region (27%). When it comes to murder cases, the situation is reversed: 40% of them were in the north region and 25% in the northeast.
• The report also mentions that the presented data reflects reported conflicts and that unreported cases might be taking place in more distant regions.
• According to the report, over the last two years, CPT has been internally discussing the possibility of launching a Cerrado-specific initiative.
Conflicts in the field from 1985 to 2014
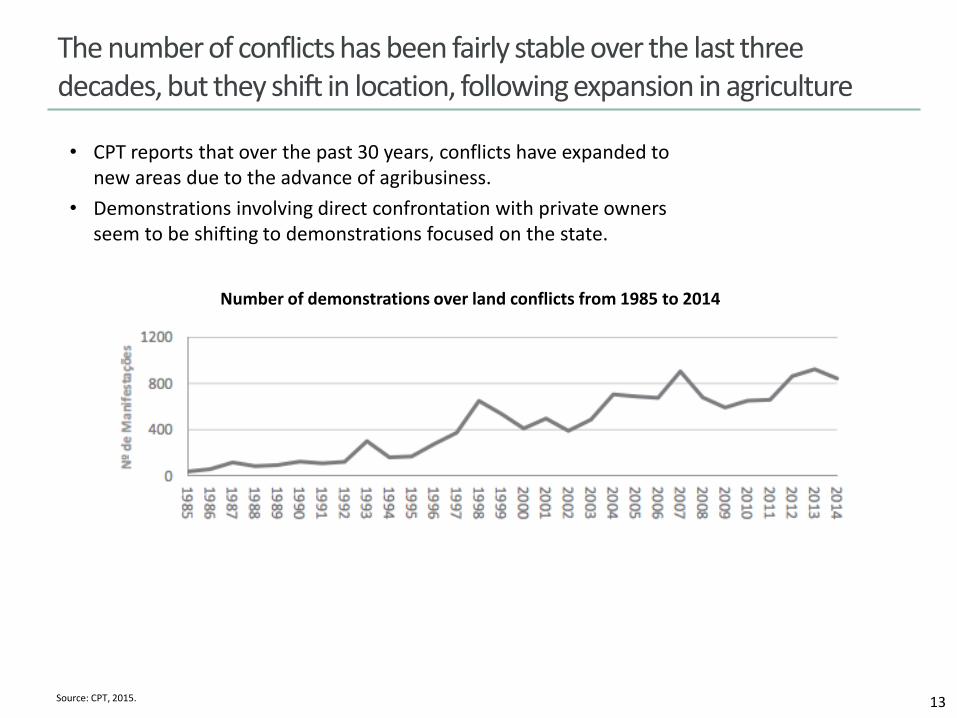
The number of conflicts has been fairly stable over the last three decades, but they shift in location, following expansion in agriculture
• CPT reports that over the past 30 years, conflicts have expanded to new areas due to the advance of agribusiness.
• Demonstrations involving direct confrontation with private owners seem to be shifting to demonstrations focused on the state.
13 Source: CPT, 2015.
Number of demonstrations over land conflicts from 1985 to 2014
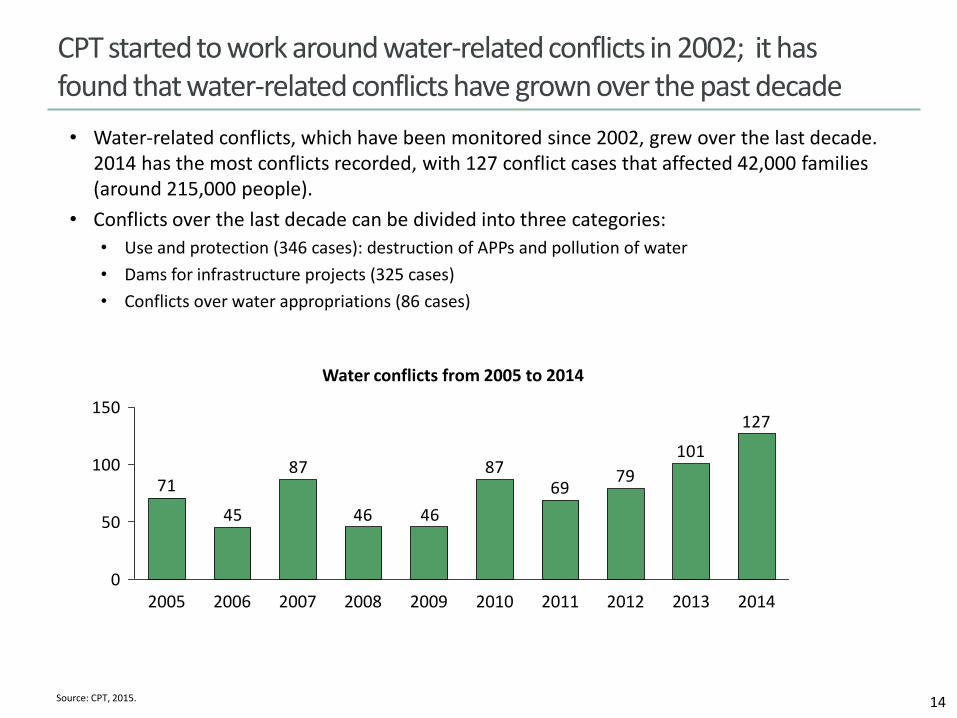
CPT started to work around water-related conflicts in 2002; it has found that water-related conflicts have grown over the past decade
• Water-related conflicts, which have been monitored since 2002, grew over the last decade. 2014 has the most conflicts recorded, with 127 conflict cases that affected 42,000 families (around 215,000 people).
• Conflicts over the last decade can be divided into three categories:
• Use and protection (346 cases): destruction of APPs and pollution of water
• Dams for infrastructure projects (325 cases)
• Conflicts over water appropriations (86 cases)
14 Source: CPT, 2015.
127
101
7969
87
4646
87
45
71
0
50
100
150
2005 2006 2007 2013 2008 2012 2011 2014 2009 2010
Water conflicts from 2005 to 2014
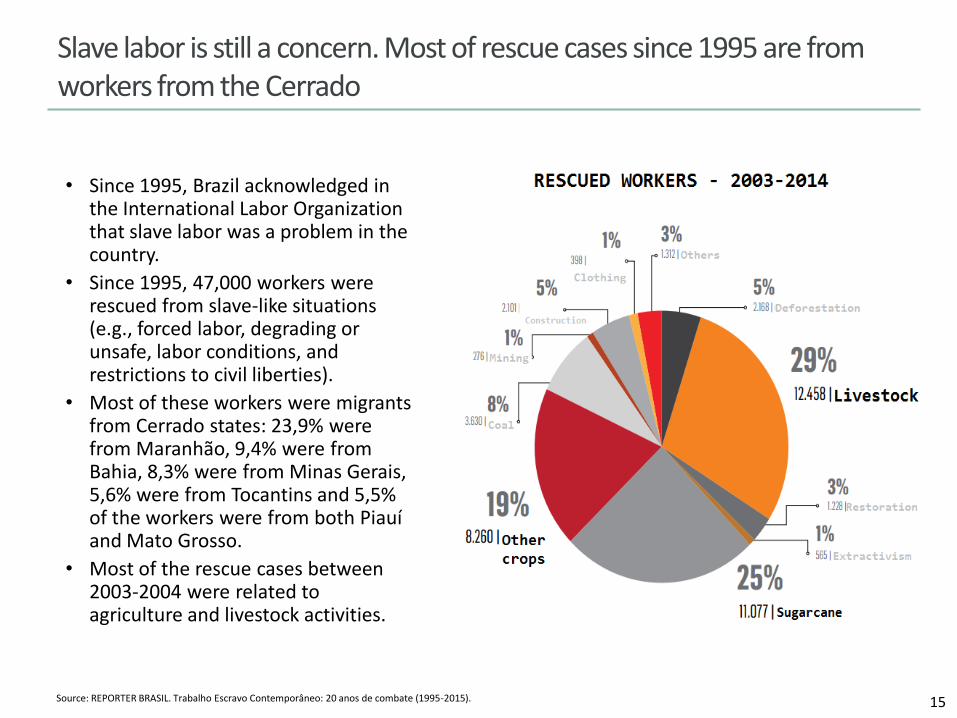
Slave labor is still a concern. Most of rescue cases since 1995 are from workers from the Cerrado
15 Source: REPORTER BRASIL. Trabalho Escravo Contemporâneo: 20 anos de combate (1995-2015).
• Since 1995, Brazil acknowledged in the International Labor Organization that slave labor was a problem in the country.
• Since 1995, 47,000 workers were rescued from slave-like situations (e.g., forced labor, degrading or unsafe, labor conditions, and restrictions to civil liberties).
• Most of these workers were migrants from Cerrado states: 23,9% were from Maranhão, 9,4% were from Bahia, 8,3% were from Minas Gerais, 5,6% were from Tocantins and 5,5% of the workers were from both Piauí and Mato Grosso.
• Most of the rescue cases between 2003-2004 were related to agriculture and livestock activities.
BIODIVERSITY AND PROTECTED AREAS
16
Biodiversity and protected areas in the Cerrado
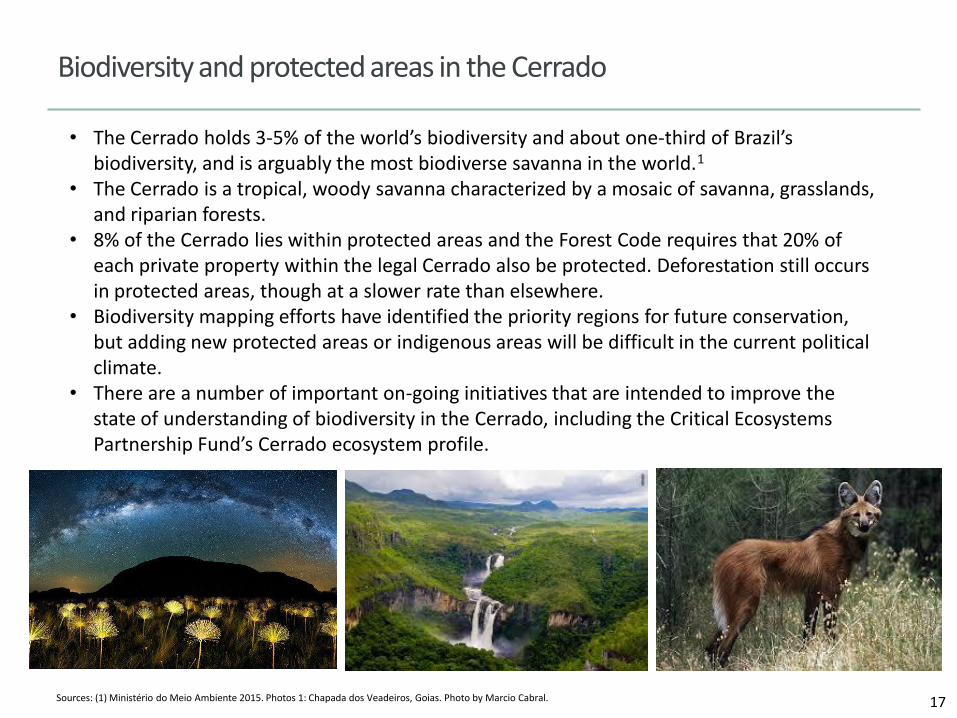
• The Cerrado holds 3-5% of the world’s biodiversity and about one-third of Brazil’s biodiversity, and is arguably the most biodiverse savanna in the world.1
• The Cerrado is a tropical, woody savanna characterized by a mosaic of savanna, grasslands, and riparian forests.
• 8% of the Cerrado lies within protected areas and the Forest Code requires that 20% of each private property within the legal Cerrado also be protected. Deforestation still occurs in protected areas, though at a slower rate than elsewhere.
• Biodiversity mapping efforts have identified the priority regions for future conservation, but adding new protected areas or indigenous areas will be difficult in the current political climate.
• There are a number of important on-going initiatives that are intended to improve the state of understanding of biodiversity in the Cerrado, including the Critical Ecosystems Partnership Fund’s Cerrado ecosystem profile.
17 Sources: (1) Ministério do Meio Ambiente 2015. Photos 1: Chapada dos Veadeiros, Goias. Photo by Marcio Cabral.
The Cerrado is a hotspot for species found nowhere else
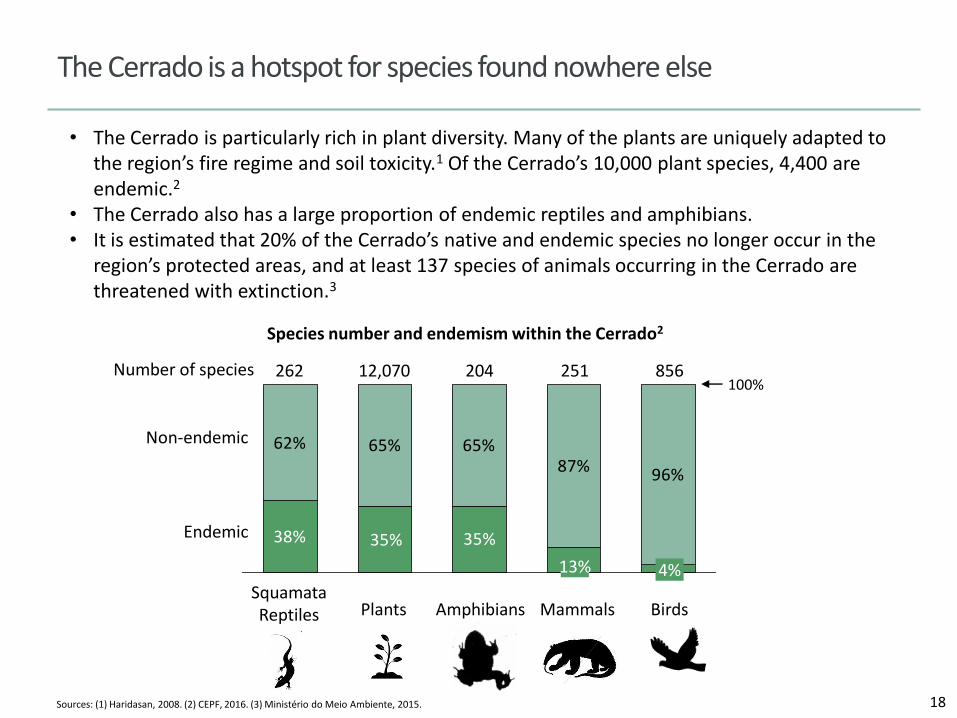
• The Cerrado is particularly rich in plant diversity. Many of the plants are uniquely adapted to the region’s fire regime and soil toxicity.1 Of the Cerrado’s 10,000 plant species, 4,400 are endemic.2
• The Cerrado also has a large proportion of endemic reptiles and amphibians. • It is estimated that 20% of the Cerrado’s native and endemic species no longer occur in the
region’s protected areas, and at least 137 species of animals occurring in the Cerrado are threatened with extinction.3
18 Sources: (1) Haridasan, 2008. (2) CEPF, 2016. (3) Ministério do Meio Ambiente, 2015.
Species number and endemism within the Cerrado2
38%
62% 65% 65%87% 96%
35% 35%
Amphibians
856
Squamata Reptiles
204
Mammals Birds
13%
262 12,070
4%
Plants
251 100%
Non-endemic
Endemic
Number of species
Forest
(Dry forest) (Gallery forest) (Riparian forest)
Savanna
Savanna
Grassland
The Cerrado encompasses a range of vegetation types, from riparian forests to grasslands
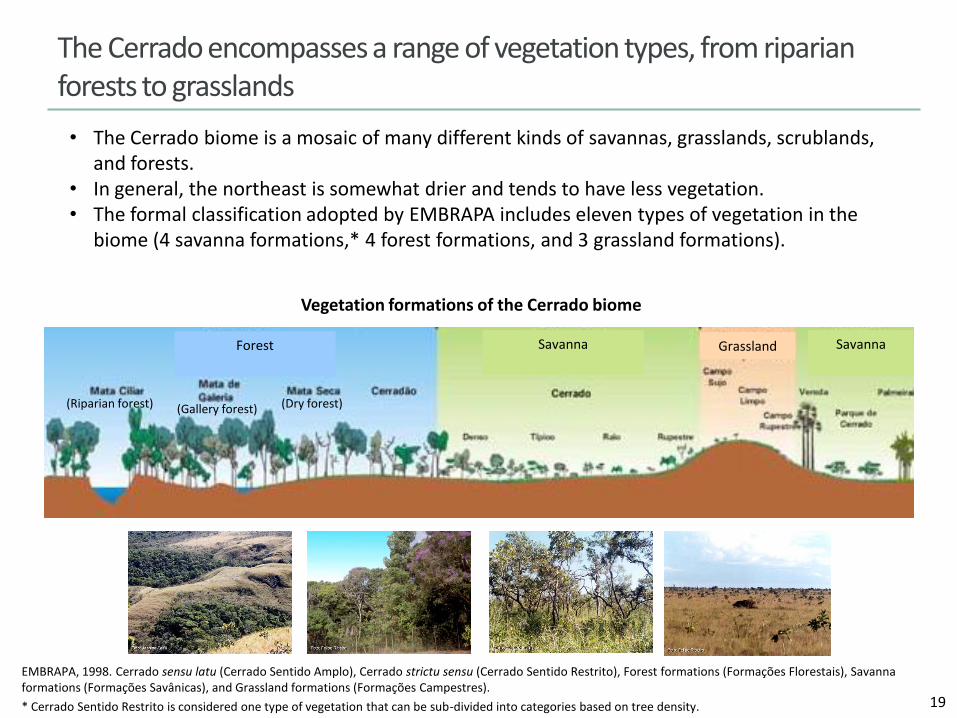
• The Cerrado biome is a mosaic of many different kinds of savannas, grasslands, scrublands, and forests.
• In general, the northeast is somewhat drier and tends to have less vegetation. • The formal classification adopted by EMBRAPA includes eleven types of vegetation in the
biome (4 savanna formations,* 4 forest formations, and 3 grassland formations).
19
EMBRAPA, 1998. Cerrado sensu latu (Cerrado Sentido Amplo), Cerrado strictu sensu (Cerrado Sentido Restrito), Forest formations (Formações Florestais), Savanna formations (Formações Savânicas), and Grassland formations (Formações Campestres).
* Cerrado Sentido Restrito is considered one type of vegetation that can be sub-divided into categories based on tree density.
Vegetation formations of the Cerrado biome

The Cerrado’s savannas
• Cerrado sentido restrito: This vegetation formation has low, contorted trees and an abundance of shrubs and herbaceous (non-woody) plants. Most of the species have adapted to resist fire and drought using a range of mechanisms (e.g., thicker bark, leaves that resist fire and avoid extreme transpiration, and the capacity to quickly re-sprout in response to fire episodes).
• Parque de Cerrado: This formation is similar to Cerrado sentido restrito, but trees are concentrated in small hillocks called murundus.
• Palmeiral: This formation is located in interfluves (higher land in between rivers) and possesses an abundance of certain palm species.
• Vereda: This formation is dominated by the buriti palm (Mauritia flexuosa), which grows interspersed with shrubs and herbaceous plants, generally in clay-like and poorly drained areas, which are common around water springs.
20 Images from top to bottom: Cerrado sentido restrito; Murundus distributed along a Parque de Cerrado landscape; Palmeiral in the state of Goiás; Vereda around a water spring. Credits: José Felipe Ribeiro, Edu Jung, Francisco Aragão, and Bruno Rocha, respectively.
The Cerrado’s savannas are home to plants adapted to soil toxicity as well as periodic fires and droughts
The Cerrado’s forests
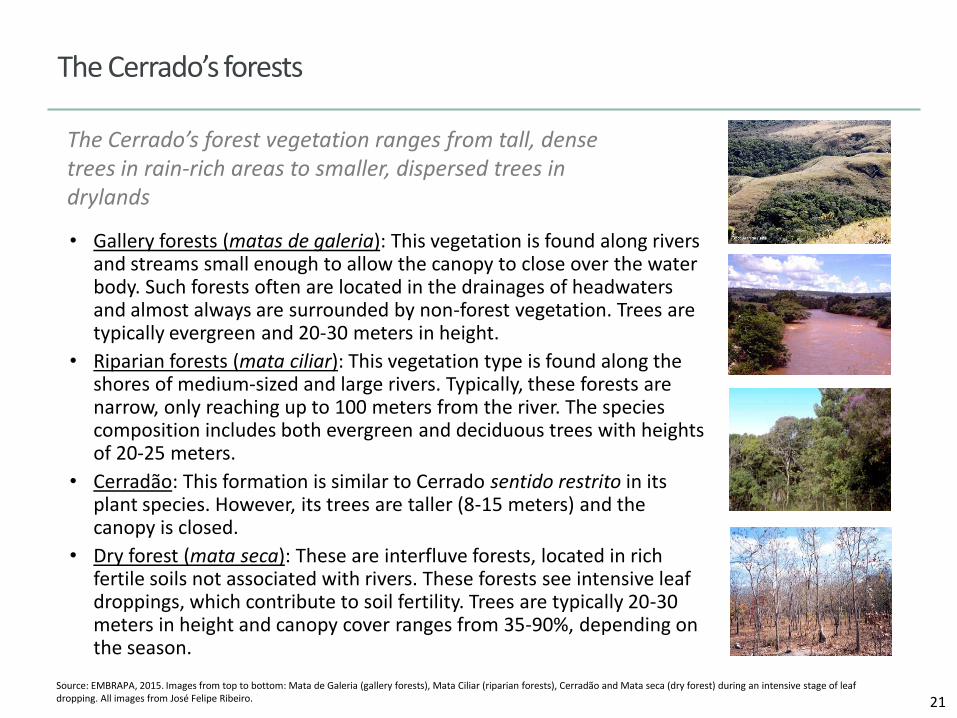
• Gallery forests (matas de galeria): This vegetation is found along rivers and streams small enough to allow the canopy to close over the water body. Such forests often are located in the drainages of headwaters and almost always are surrounded by non-forest vegetation. Trees are typically evergreen and 20-30 meters in height.
• Riparian forests (mata ciliar): This vegetation type is found along the shores of medium-sized and large rivers. Typically, these forests are narrow, only reaching up to 100 meters from the river. The species composition includes both evergreen and deciduous trees with heights of 20-25 meters.
• Cerradão: This formation is similar to Cerrado sentido restrito in its plant species. However, its trees are taller (8-15 meters) and the canopy is closed.
• Dry forest (mata seca): These are interfluve forests, located in rich fertile soils not associated with rivers. These forests see intensive leaf droppings, which contribute to soil fertility. Trees are typically 20-30 meters in height and canopy cover ranges from 35-90%, depending on the season.
21 Source: EMBRAPA, 2015. Images from top to bottom: Mata de Galeria (gallery forests), Mata Ciliar (riparian forests), Cerradão and Mata seca (dry forest) during an intensive stage of leaf dropping. All images from José Felipe Ribeiro.
The Cerrado’s forest vegetation ranges from tall, dense trees in rain-rich areas to smaller, dispersed trees in drylands
The Cerrado’s grasslands
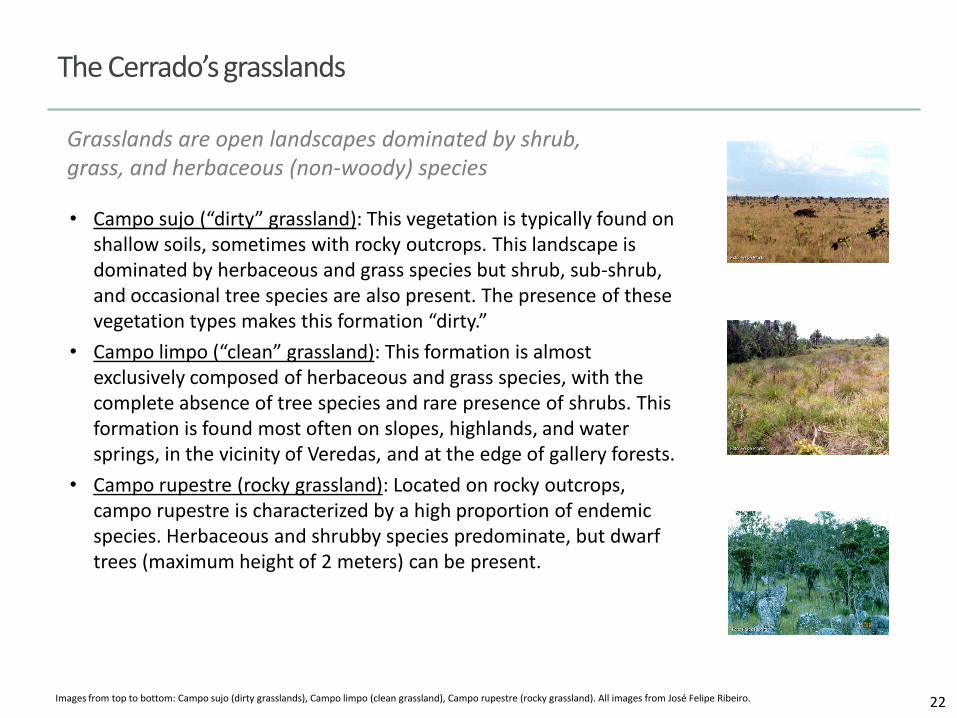
• Campo sujo (“dirty” grassland): This vegetation is typically found on shallow soils, sometimes with rocky outcrops. This landscape is dominated by herbaceous and grass species but shrub, sub-shrub, and occasional tree species are also present. The presence of these vegetation types makes this formation “dirty.”
• Campo limpo (“clean” grassland): This formation is almost exclusively composed of herbaceous and grass species, with the complete absence of tree species and rare presence of shrubs. This formation is found most often on slopes, highlands, and water springs, in the vicinity of Veredas, and at the edge of gallery forests.
• Campo rupestre (rocky grassland): Located on rocky outcrops, campo rupestre is characterized by a high proportion of endemic species. Herbaceous and shrubby species predominate, but dwarf trees (maximum height of 2 meters) can be present.
22 Images from top to bottom: Campo sujo (dirty grasslands), Campo limpo (clean grassland), Campo rupestre (rocky grassland). All images from José Felipe Ribeiro.
Grasslands are open landscapes dominated by shrub, grass, and herbaceous (non-woody) species

Biodiversity hotspots for different species groups vary across the Cerrado
• A number of biodiversity hotspots are spread across the Cerrado.
• Northern Maranhão (see upper right hand corner of maps to the right) is important for a range of species types.
• The Espinhaço Mountains of Minas Gerais and Bahia contain an extremely high number of species. This area is threatened by mining.
23 Source: WWF, 2013.
Plants
Birds Reptiles
Amphibians
Hotspots of biological diversity in the Cerrado1
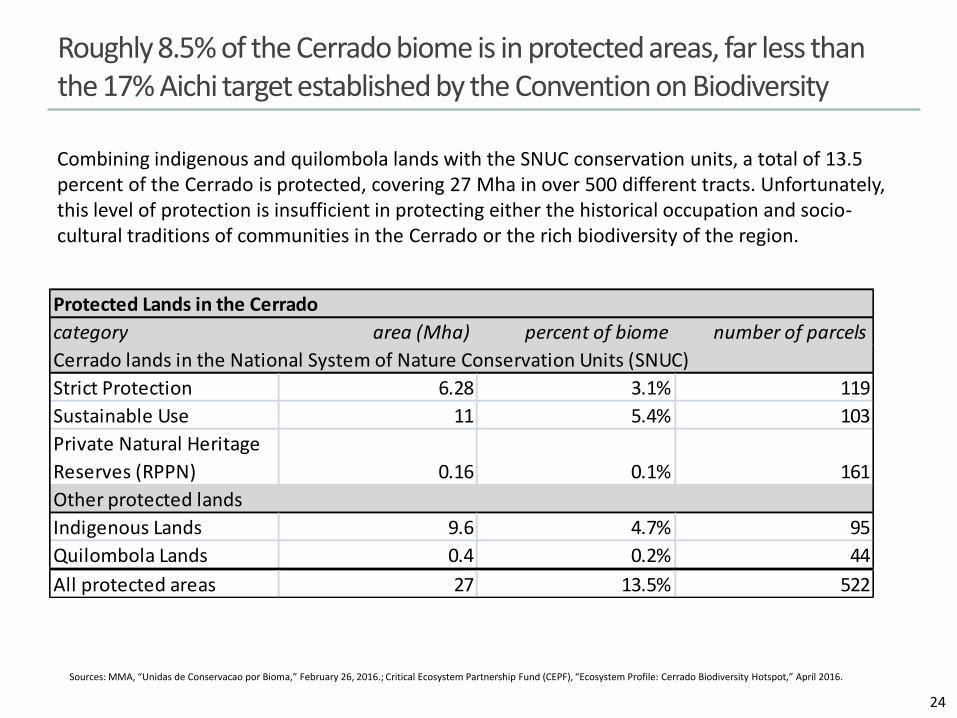
Roughly 8.5% of the Cerrado biome is in protected areas, far less than the 17% Aichi target established by the Convention on Biodiversity
24
Sources: MMA, “Unidas de Conservacao por Bioma,” February 26, 2016.; Critical Ecosystem Partnership Fund (CEPF), “Ecosystem Profile: Cerrado Biodiversity Hotspot,” April 2016.
Protected Lands in the Cerrado
category area (Mha) percent of biome number of parcels
Cerrado lands in the National System of Nature Conservation Units (SNUC)
Strict Protection 6.28 3.1% 119
Sustainable Use 11 5.4% 103
Private Natural Heritage
Reserves (RPPN) 0.16 0.1% 161
Other protected lands
Indigenous Lands 9.6 4.7% 95
Quilombola Lands 0.4 0.2% 44
All protected areas 27 13.5% 522
Combining indigenous and quilombola lands with the SNUC conservation units, a total of 13.5 percent of the Cerrado is protected, covering 27 Mha in over 500 different tracts. Unfortunately, this level of protection is insufficient in protecting either the historical occupation and socio-cultural traditions of communities in the Cerrado or the rich biodiversity of the region.
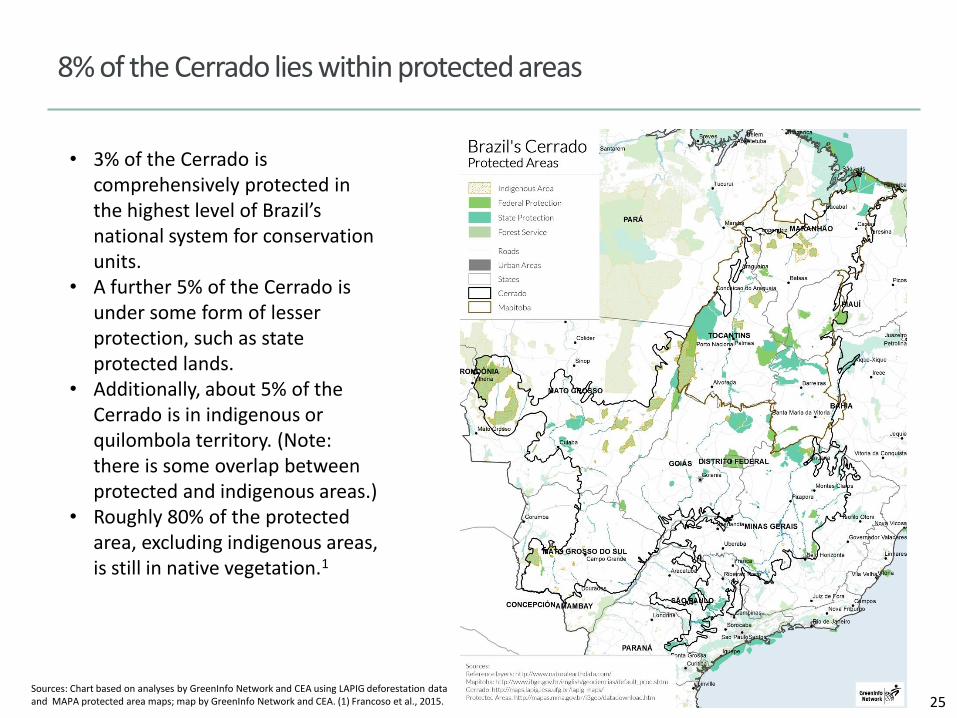
8% of the Cerrado lies within protected areas
• 3% of the Cerrado is comprehensively protected in the highest level of Brazil’s national system for conservation units.
• A further 5% of the Cerrado is under some form of lesser protection, such as state protected lands.
• Additionally, about 5% of the Cerrado is in indigenous or quilombola territory. (Note: there is some overlap between protected and indigenous areas.)
• Roughly 80% of the protected area, excluding indigenous areas, is still in native vegetation.1
25 Sources: Chart based on analyses by GreenInfo Network and CEA using LAPIG deforestation data and MAPA protected area maps; map by GreenInfo Network and CEA. (1) Francoso et al., 2015.
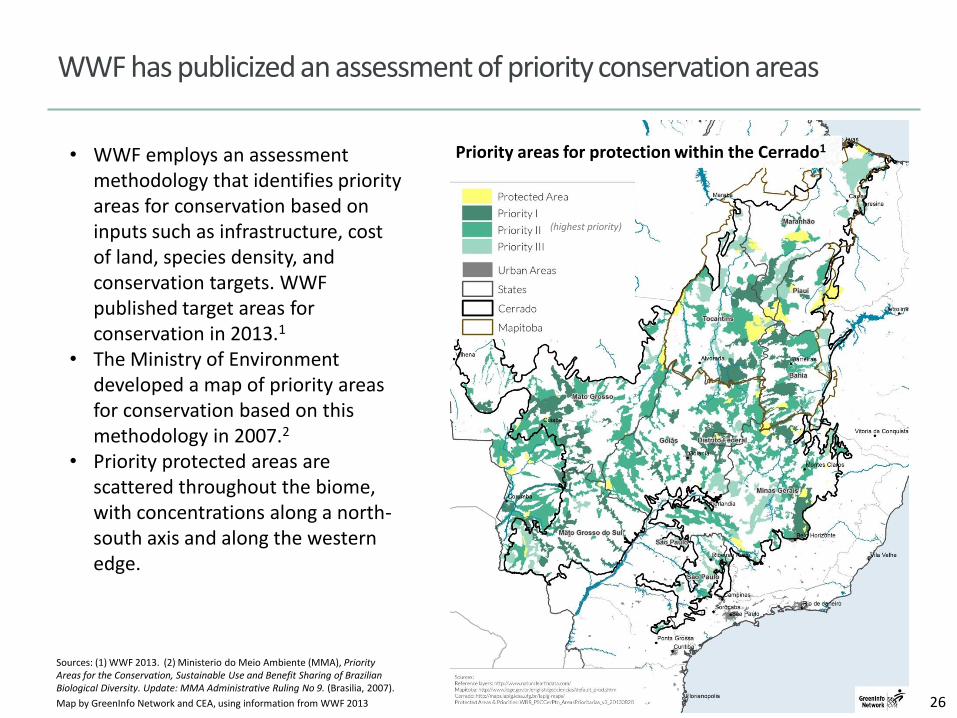
WWF has publicized an assessment of priority conservation areas
• WWF employs an assessment methodology that identifies priority areas for conservation based on inputs such as infrastructure, cost of land, species density, and conservation targets. WWF published target areas for conservation in 2013.1
• The Ministry of Environment developed a map of priority areas for conservation based on this methodology in 2007.2
• Priority protected areas are scattered throughout the biome, with concentrations along a north-south axis and along the western edge.
26
Sources: (1) WWF 2013. (2) Ministerio do Meio Ambiente (MMA), Priority Areas for the Conservation, Sustainable Use and Benefit Sharing of Brazilian Biological Diversity. Update: MMA Administrative Ruling No 9. (Brasilia, 2007).
Map by GreenInfo Network and CEA, using information from WWF 2013
Top priority
High priority
Priority
Already protected
Indigenous areas
Priority for protection
(highest priority)
SDFSD Priority areas for protection within the Cerrado1

27
CEPF has also completed an assessment of priority biodiversity areas
• The Critical Ecosystem Partnerships Fund (CEPF) has just published an Ecosystem Profile of the Cerrado which identifies 765 key biodiversity areas (KBAs) covering 118 million hectares (Mha), roughly 10% of which are inside protected areas or indigenous areas.
• Approximately 21 Mha of CEPF’s KBAs are classified as “priority”.
• KBAs are strategic locations for the conservation of globally important biodiversity in the Cerrado.
Source:
Map by GreenInfo Network and CEA, using information from CEPF, 2016.
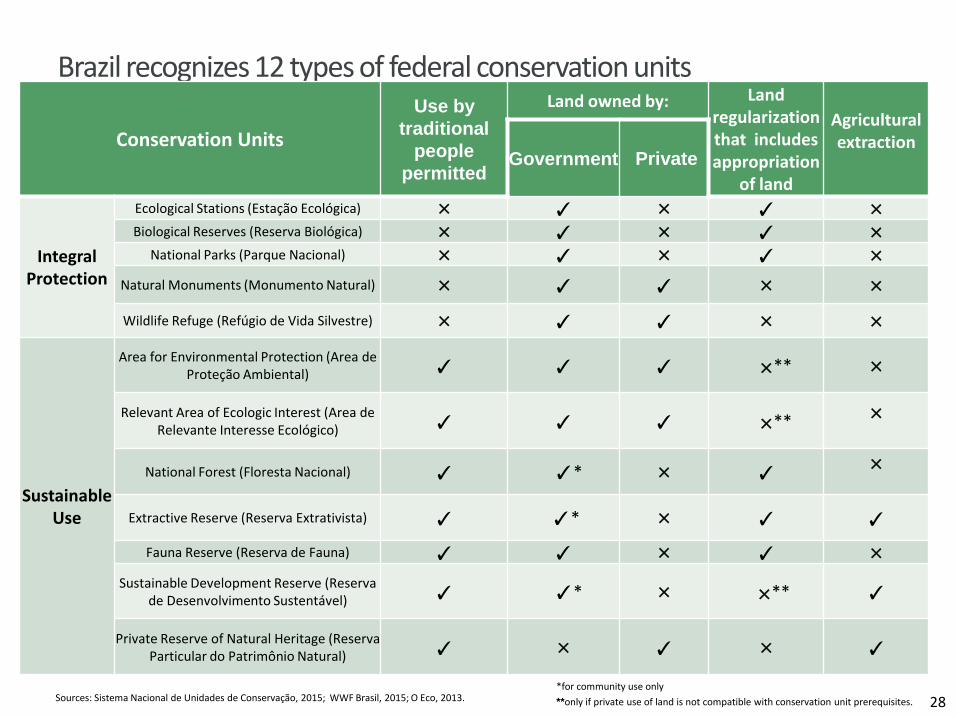
Brazil recognizes 12 types of federal conservation units
28 Sources: Sistema Nacional de Unidades de Conservação, 2015; WWF Brasil, 2015; O Eco, 2013.
Conservation Units
Use by
traditional
people
permitted
Land owned by: Land regularization that includes appropriation
of land
Agricultural extraction
Government Private
Integral Protection
Ecological Stations (Estação Ecológica) ✕ ✓ ✕ ✓ ✕
Biological Reserves (Reserva Biológica) ✕ ✓ ✕ ✓ ✕
National Parks (Parque Nacional) ✕ ✓ ✕ ✓ ✕
Natural Monuments (Monumento Natural) ✕ ✓ ✓ ✕ ✕
Wildlife Refuge (Refúgio de Vida Silvestre) ✕ ✓ ✓ ✕ ✕
Sustainable Use
Area for Environmental Protection (Area de Proteção Ambiental) ✓ ✓ ✓ ✕** ✕
Relevant Area of Ecologic Interest (Area de Relevante Interesse Ecológico) ✓ ✓ ✓ ✕**
✕
National Forest (Floresta Nacional) ✓ ✓* ✕ ✓ ✕
Extractive Reserve (Reserva Extrativista) ✓ ✓* ✕ ✓ ✓
Fauna Reserve (Reserva de Fauna) ✓ ✓ ✕ ✓ ✕
Sustainable Development Reserve (Reserva de Desenvolvimento Sustentável) ✓ ✓* ✕ ✕** ✓
Private Reserve of Natural Heritage (Reserva Particular do Patrimônio Natural) ✓ ✕ ✓ ✕ ✓
*for community use only
**only if private use of land is not compatible with conservation unit prerequisites.
Several initiatives promise to shed additional light on the biodiversity of the Cerrado by both generating and aggregating data
• The Critical Ecosystems Partnership Fund (CEPF) has developed an ecosystem profile of the Cerrado. Their assessment combines a comprehensive literature review of the biodiversity and threats to the biome as well as an analysis of Key Biodiversity Areas (KBAs) and Corridors using new IUCN red list information to identify areas that are particularly important for biodiversity protection, ecosystem services, and water supply for urban areas, etc. See www.cepf.net.
• The Brazilian Biodiversity Information System (SiBBr) is an initiative of the Ministry of Science, Technology and Innovation aimed at creating a repository of publically available biodiversity information. This effort will establish two databases: one focused on ecological data and the other on species distribution. This sort of information will speed up conservation-oriented processes such as determining priority protected areas, which currently takes nearly a decade. The development of these databases and an associated web portal is underway and will likely take a few years to complete.
• ComCerrado is research network focused on sharing knowledge and supporting conservation of the biome. One shared activity will be performing survey sampling across the Cerrado to determine ecosystem health and function. This sampling will include plants, soils, birds, amphibians, and vertebrates. 29
WATER IN THE CERRADO
30
Water in the Cerrado
• Brazil has a global reputation as being water rich. However, the water rich part of Brazil (the Amazon basin) is far from the population and economic centers of the country. o The Northeast is the driest (semi-arid) and poorest part of the country, and it is vulnerable to the El Niño Southern
Oscillation, which means it is prone to drought.
o São Paulo and Rio de Janeiro rely heavily on massive water storage and conveyance systems, although they are not directly dependent on the Cerrado’s waters. Brasilia is at the top of three watersheds in the center of the Cerrado (in the long run, this could be a challenge for Brasilia because there isn’t upstream room for storage).
• The Cerrado, which has a pronounced wet and dry season, is home to the headwaters of three major river systems (São Francisco, Tocantins, and La Plata) which serve much of Brazil and neighboring countries. (For example, Buenos Aires is at the mouth of the La Plata river.)
• Brazil has very sophisticated water engineers, water planning agencies and governance systems. Yet, the country is behind on infrastructure upgrades in many cities, a partial cause of the problems leading to the São Paulo drought.
• Water quality is also a major issue in Brazil. The country lacks sufficient wastewater treatment facilities, which greatly diminishes the quantity of usable water.
• 80% of Brazil’s energy comes from hydropower, which means that both water supply and energy supply are threatened by drought.
• With climate change, the Cerrado is expected to see temperatures increase and its dry season lengthen.
• There is a growing body of science around the interactions between land cover and rainfall, with evidence accumulating that, above a certain threshold, deforestation can have a notable impact on weather patterns and that deforestation around water springs can dry them up.
• Farmers in Brazil are increasingly concerned about water supply.
31
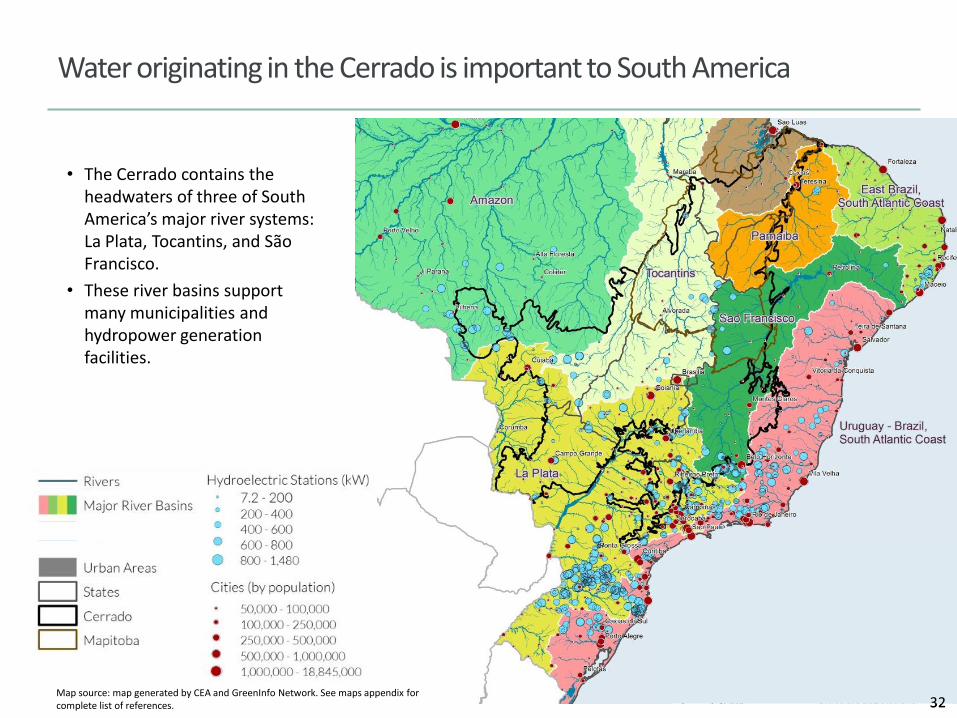
• The Cerrado contains the headwaters of three of South America’s major river systems: La Plata, Tocantins, and São Francisco.
• These river basins support many municipalities and hydropower generation facilities.
32
Water originating in the Cerrado is important to South America
32 Map source: map generated by CEA and GreenInfo Network. See maps appendix for complete list of references.
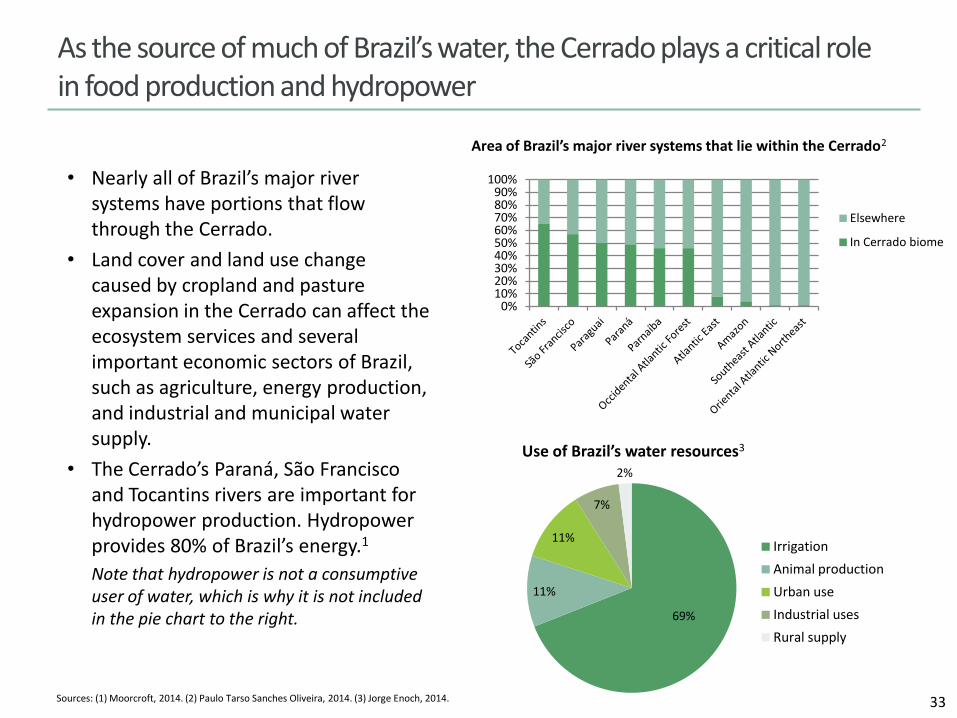
As the source of much of Brazil’s water, the Cerrado plays a critical role in food production and hydropower
• Nearly all of Brazil’s major river systems have portions that flow through the Cerrado.
• Land cover and land use change caused by cropland and pasture expansion in the Cerrado can affect the ecosystem services and several important economic sectors of Brazil, such as agriculture, energy production, and industrial and municipal water supply.
• The Cerrado’s Paraná, São Francisco and Tocantins rivers are important for hydropower production. Hydropower provides 80% of Brazil’s energy.1
Note that hydropower is not a consumptive user of water, which is why it is not included in the pie chart to the right.
33 Sources: (1) Moorcroft, 2014. (2) Paulo Tarso Sanches Oliveira, 2014. (3) Jorge Enoch, 2014.
69%
11%
11%
7%
2%
Irrigation
Animal production
Urban use
Industrial uses
Rural supply
Use of Brazil’s water resources3
Area of Brazil’s major river systems that lie within the Cerrado2
0% 10% 20% 30% 40% 50% 60% 70% 80% 90%
100%
Elsewhere
In Cerrado biome
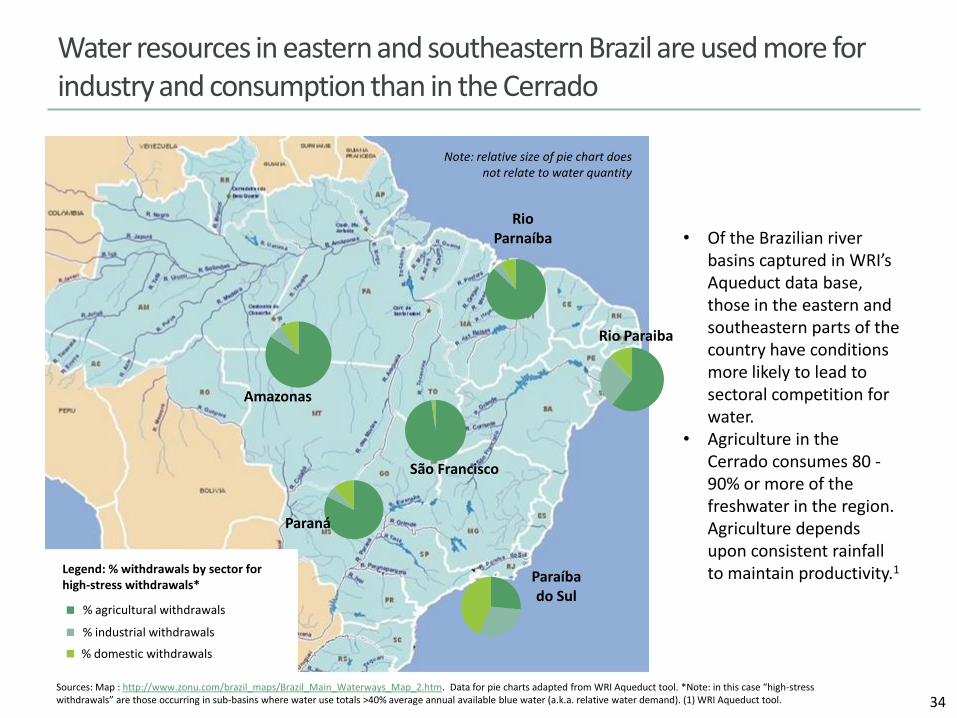
Water resources in eastern and southeastern Brazil are used more for industry and consumption than in the Cerrado
34 Sources: Map : http://www.zonu.com/brazil_maps/Brazil_Main_Waterways_Map_2.htm. Data for pie charts adapted from WRI Aqueduct tool. *Note: in this case “high-stress withdrawals” are those occurring in sub-basins where water use totals >40% average annual available blue water (a.k.a. relative water demand). (1) WRI Aqueduct tool.
São Francisco
Rio Parnaíba
Paraná
Amazonas
Rio Paraiba
Paraíba do Sul
% agricultural withdrawals
% industrial withdrawals
% domestic withdrawals
Note: relative size of pie chart does not relate to water quantity
• Of the Brazilian river basins captured in WRI’s Aqueduct data base, those in the eastern and southeastern parts of the country have conditions more likely to lead to sectoral competition for water.
• Agriculture in the Cerrado consumes 80 - 90% or more of the freshwater in the region. Agriculture depends upon consistent rainfall to maintain productivity.1 Legend: % withdrawals by sector for
high-stress withdrawals*
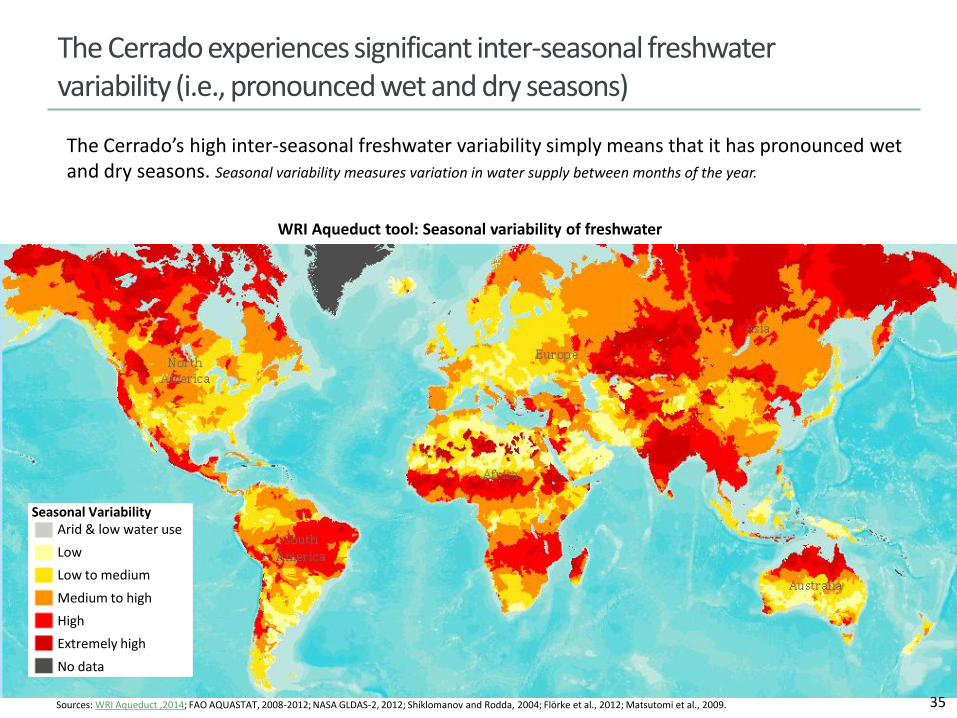
The Cerrado experiences significant inter-seasonal freshwater variability (i.e., pronounced wet and dry seasons)
35 Sources: WRI Aqueduct ,2014; FAO AQUASTAT, 2008-2012; NASA GLDAS-2, 2012; Shiklomanov and Rodda, 2004; Flörke et al., 2012; Matsutomi et al., 2009.
WRI Aqueduct tool: Seasonal variability of freshwater
The Cerrado’s high inter-seasonal freshwater variability simply means that it has pronounced wet and dry seasons. Seasonal variability measures variation in water supply between months of the year.
Seasonal Variability Arid & low water use
Low
Low to medium
Medium to high
High
Extremely high
No data

Water demand is expected to increase in parts of the Cerrado by 2040
The growing demand for water implies increasing conflict between hydropower, municipalities and agriculture. Agricultural surface water withdrawals could be threatened. Projected change in water
demand shows how development and/or climate change are expected to affect water demand. The “business as usual” scenario (SSP2 RCP8.5) represents a world with stable economic development and steadily rising global carbon emissions.
36 Sources: WRI Aqueduct, 2014; FAO AQUASTAT, 2008-2012; NASA GLDAS-2, 2012; Shiklomanov and Rodda, 2004; Flörke et al., 2012; Matsutomi et al., 2009.
WRI Aqueduct tool: Change in water demand through 2040 - BAU scenario
Projected change in water demand (Change from baseline to 2040 business as usual)
1.7x or greater decrease
1.4x decrease
1.2x decrease
Near normal
1.2x increase
1.4x increase
1.7x or greater increase
No data
Inter-annual water variability in the Cerrado is generally low, while inter-seasonal water variability is very high
The Cerrado has a concentrated rainy period from September/October to April/March, and practically no rain during the dry season (the remainder of the year).1
• Because of the seasonal nature of its rainfall, the Cerrado is very sensitive to small changes in precipitation patterns. For example, anecdotally, a 10-day dry period during the wet season does not significantly impact soy yields, but a 15-day dry spell in the rainy season can wipe out up to 20% of soy crops.2
• A decreased length of the rainy season may make it more difficult to double-crop, significantly harming yields.3
• Agriculture in the Cerrado is largely rain-fed, although farmers are increasingly turning to irrigation systems in the face of more variable precipitation patterns.
• It is estimated that the Cerrado has about 10 million hectares that are suitable for irrigation, but less than 1 million are currently under cultivation.1
Groundwater and wells are not a major source of water for agriculture.1
• In general, studies indicate that the pressure in wells (from groundwater) in the region is insufficient for large-scale irrigation. There are exceptions, however, such as in western Bahia, where the deep wells have a significant enough flow to irrigate as much as 100 hectares. But even there the groundwater is primarily used for supplying homes and small communities.1
37 Sources: (1) Jorge Enoch, 2014. (2) CEA interview. (3) CEA interview.

Brazil is expected to have an increase in water demand within its five geographic regions by 2025
• In 2010, the National Water Agency (ANA) publicized a Water Atlas with an assessment of the water quality, availability, and infrastructure of all Brazilian municipalities in 2005 and development scenarios for 2015 and 2025.
• Four main problems were analyzed: lack of water supply, intermittent supply, pollution of waters due to the lack of sewage treatment, and conflicts over water use.
• An increase of water demand was projected for all geographic regions.
• Meeting this demand will require solutions such as identifying new water sources (surface and groundwater) and constructing water production systems (catchment, treatment, and distribution).
38 Source: ANA, 2010.
AVERAGE WATER URBAN DEMAND (m3/s)
YEAR NORTH NORTHEAST MIDWEST SOUTHEAST SOUTH TOTAL BRAZIL
2005 34 115 33 247 65 494
2015 45 136 39 275 75 570
2025 54 151 44 298 83 630
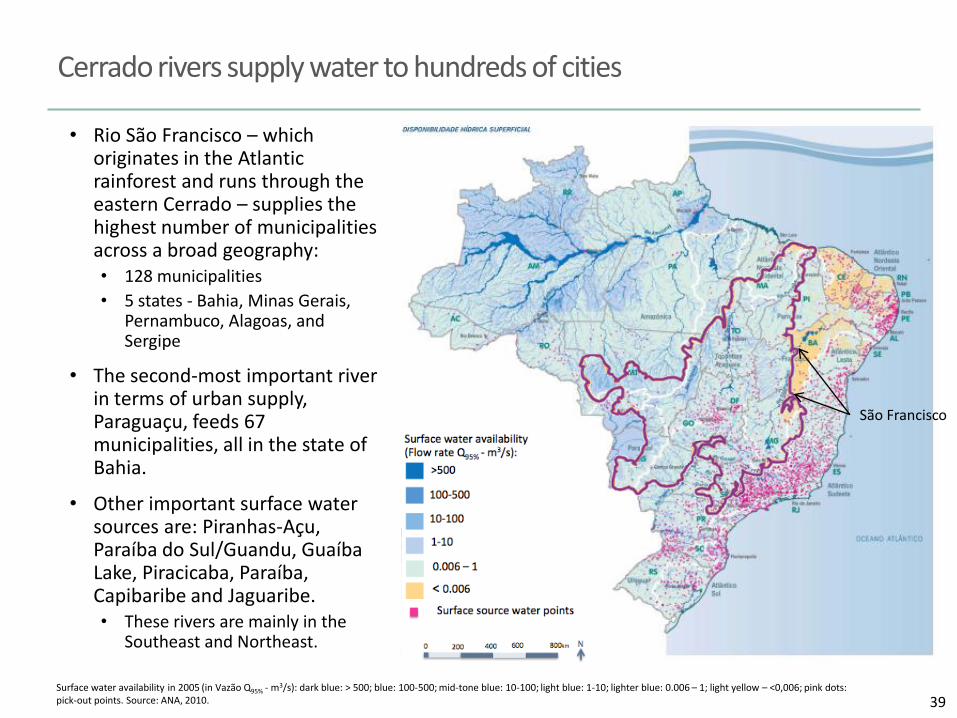
Cerrado rivers supply water to hundreds of cities
• Rio São Francisco – which originates in the Atlantic rainforest and runs through the eastern Cerrado – supplies the highest number of municipalities across a broad geography: • 128 municipalities
• 5 states - Bahia, Minas Gerais, Pernambuco, Alagoas, and Sergipe
• The second-most important river in terms of urban supply, Paraguaçu, feeds 67 municipalities, all in the state of Bahia.
• Other important surface water sources are: Piranhas-Açu, Paraíba do Sul/Guandu, Guaíba Lake, Piracicaba, Paraíba, Capibaribe and Jaguaribe. • These rivers are mainly in the
Southeast and Northeast.
39 Surface water availability in 2005 (in Vazão Q95% - m
3/s): dark blue: > 500; blue: 100-500; mid-tone blue: 10-100; light blue: 1-10; lighter blue: 0.006 – 1; light yellow – <0,006; pink dots: pick-out points. Source: ANA, 2010.
São Francisco
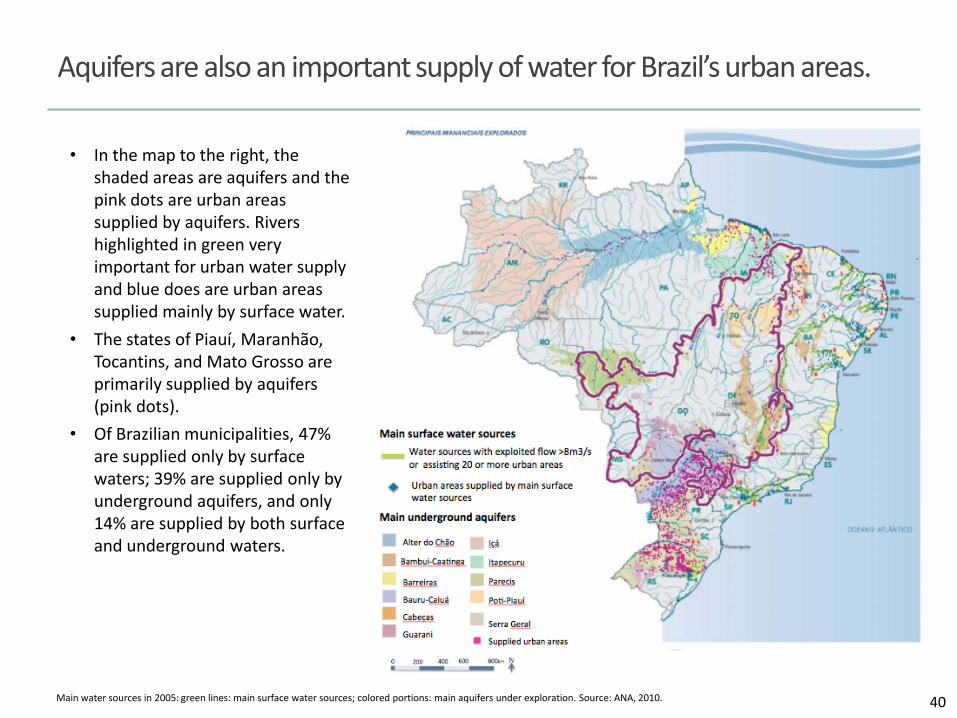
Aquifers are also an important supply of water for Brazil’s urban areas.
• In the map to the right, the shaded areas are aquifers and the pink dots are urban areas supplied by aquifers. Rivers highlighted in green very important for urban water supply and blue does are urban areas supplied mainly by surface water.
• The states of Piauí, Maranhão, Tocantins, and Mato Grosso are primarily supplied by aquifers (pink dots).
• Of Brazilian municipalities, 47% are supplied only by surface waters; 39% are supplied only by underground aquifers, and only 14% are supplied by both surface and underground waters.
40 Main water sources in 2005: green lines: main surface water sources; colored portions: main aquifers under exploration. Source: ANA, 2010.

In 2005, ANA projected that 46% of Brazil’s cities would need infrastructure investments for water by 2015
• ANA’s 2005 report projected that by 2015, 45% of the Brazilian municipalities would have satisfactory supply (52 million people would have water access).
• The remaining 55% of the cities were projected to have problems relating to water quality, quantity, and capacity of the production system. These were divided into two groups:
• 46% of cities will need infrastructure investments.
• 9% will need solutions around hydric availability and new supply system sources.
41 Urban water supply vs. demand in 2015. Orange portions (471 municipalities) require new water sources; yellow portions (2.556 municipalities) require infrastructure investments; green portions (2.502 municipalities) have satisfactory water supply; gray portions (36 municipalities) represent inadequate information. Source: ANA, 2010.
Greater than 400 (220 units)
From 50 to 500 (1,183 units)
From 20 to 50 (1,414 units)
Less than 20 (2,748 units)
Capitals and main urban areas
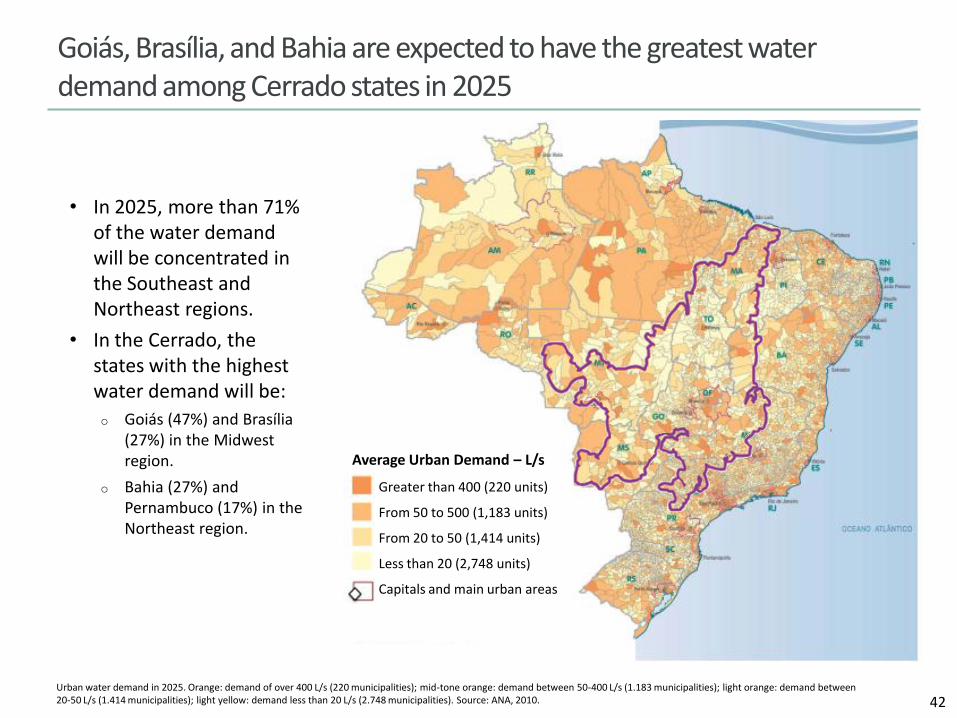
Goiás, Brasília, and Bahia are expected to have the greatest water demand among Cerrado states in 2025
• In 2025, more than 71% of the water demand will be concentrated in the Southeast and Northeast regions.
• In the Cerrado, the states with the highest water demand will be:
o Goiás (47%) and Brasília (27%) in the Midwest region.
o Bahia (27%) and Pernambuco (17%) in the Northeast region.
42 Urban water demand in 2025. Orange: demand of over 400 L/s (220 municipalities); mid-tone orange: demand between 50-400 L/s (1.183 municipalities); light orange: demand between 20-50 L/s (1.414 municipalities); light yellow: demand less than 20 L/s (2.748 municipalities). Source: ANA, 2010.
A Average Urban Demand – L/s

CLIMATE CHANGE AND THE CERRADO
43
The Cerrado is vulnerable to climate change
The Brazilian Panel on Climate Change developed an assessment of the projected climate change effects across the country, looking at vulnerabilities, impacts and adaptation needs.
• The Midwest and Northeastern regions of Brazil, which largely overlap with the Cerrado, are projected to be the most affected by forthcoming climate change.
• Studies developed by INPE and EMBRAPA suggest that temperatures will increase by between 1 oC and 5.8 oC in the Midwest by 2070, with a drier and warmer dry season.
• IPCC studies find that by 2050 the Midwest region will incur costs of up to 4.5% of the country’s GDP for necessary adaptation investments.
• The agriculture and livestock sectors—key activities in Cerrado—are the Brazilian economic sectors that are most sensitive to climate change. In the Midwest region, these activities are expected to suffer productivity reduction due to changes in hydrological and crop (phenology) cycles as well as temperature increases.
• Further, most of the rivers in the Midwest will see reduced flow in the years from 2017-2100.
44 Source: Brazilian Panel on Climate Change, 2013.

Climate models suggest significant rainfall reductions in the Cerrado, especially during the dry season
45 Source: Malhi et al., 2008.
December-January-February June-July-August
Probability of rainfall
reduction (%)
The graphic to the right shows the likelihood of >0%, >20%, and >50% decreases in rainfall through the end of this century under midrange GHG emissions scenarios during the wet season (December-January-February) and the dry season (June-July-August). Takeaways: • Changes in dry season rainfall are most
pronounced. Dry season rainfall is generally the most critical for determining vegetation patterns, and is often driven mostly by locally generated convection and may be more strongly affected by deforestation.
• The majority of the Cerrado is likely (>60%) to see rainfall reductions during the dry season this century due to climate change.
• The entirety of the Cerrado is likely (>50%) to see rainfall reductions of >20%, during the dry season, during this century.
• Large portions of the Cerrado may see (40-50% likely) rainfall reductions of greater than 50%, during the dry season.
Climate variability already significantly impacts year-over-year yields in some major crops grown in the Cerrado
46 Source: Ray et al., 2014.
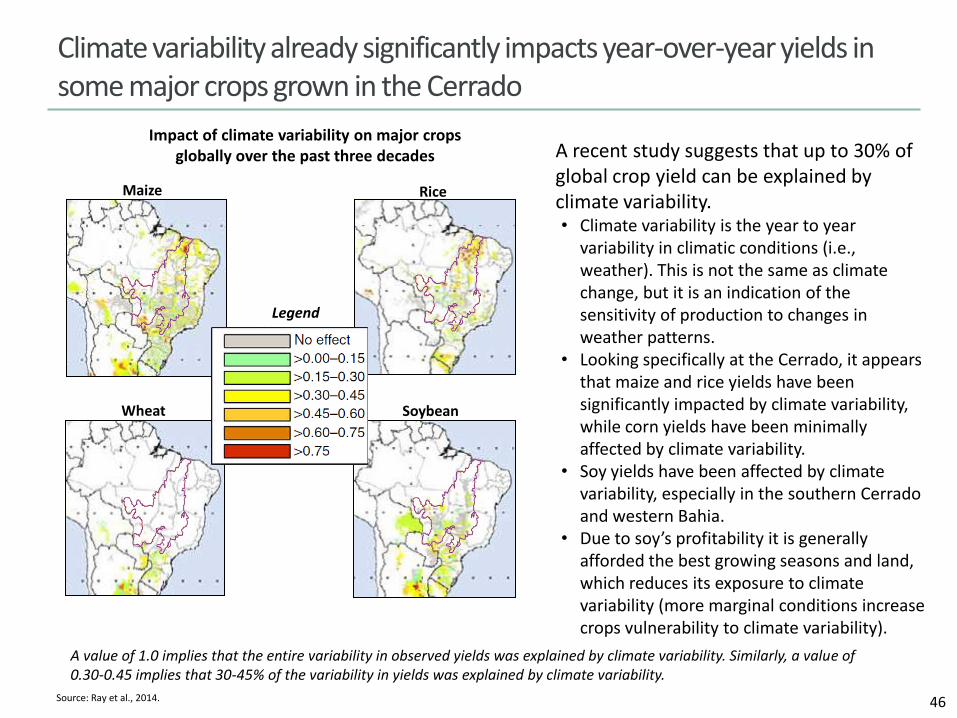
Impact of climate variability on major crops globally over the past three decades
A value of 1.0 implies that the entire variability in observed yields was explained by climate variability. Similarly, a value of 0.30-0.45 implies that 30-45% of the variability in yields was explained by climate variability.
Maize Rice
Wheat Soybean
Legend
A recent study suggests that up to 30% of global crop yield can be explained by climate variability. • Climate variability is the year to year
variability in climatic conditions (i.e., weather). This is not the same as climate change, but it is an indication of the sensitivity of production to changes in weather patterns.
• Looking specifically at the Cerrado, it appears that maize and rice yields have been significantly impacted by climate variability, while corn yields have been minimally affected by climate variability.
• Soy yields have been affected by climate variability, especially in the southern Cerrado and western Bahia.
• Due to soy’s profitability it is generally afforded the best growing seasons and land, which reduces its exposure to climate variability (more marginal conditions increase crops vulnerability to climate variability).

Embrapa’s Brazil 2040 study showed that climate change may significantly impact agricultural yields
Study overview
• The Brazil 2040 study was commissioned by SAE (Secretariat of Strategic Affairs of the Presidency).
• Embrapa looked at climate models from IPCC and INPE, to try to understand how growing conditions may vary in the country by 2040, 2070, and 2100. It focused on climate extremes based on differing emissions scenarios.
Projected (potential) climate impacts
• The study shows that acreage suitable for soy production in Brazil could decrease up to 39% by 2040 due to climate change. Acreage suitable for the growing of other crops may also decrease, such as beans, rice, and winter maize, by as much as 26%, 24% and 28%, respectively.
• The study points to an increase in heat waves and extreme weather in coming years, which harm crop productivity and increase water stress.
• In addition to temperature change to hydrological cycles and some areas of cultivation, some areas that are today considered low-risk would be categorized as high climatic risk, preventing investments. Under the rules of the agricultural credit in Brazil, to secure a loan for a particular crop, the farm must be located in a place where the crop failure risk is less than 20% (a loss every five years).
• In the worst emissions scenario modeled by Embrapa, 99% of the South would be considered a “high risk” area for soybeans in 2040 (i.e., >20% chance of crop failure).
47 Source: http://www.observatoriodoclima.eco.br/area-de-cultivo-de-soja-no-brasil-pode-diminuir-39-ate-2040/.
Land cover change can affect local climate, amplify the impacts of global climate change, and impact water availability directly
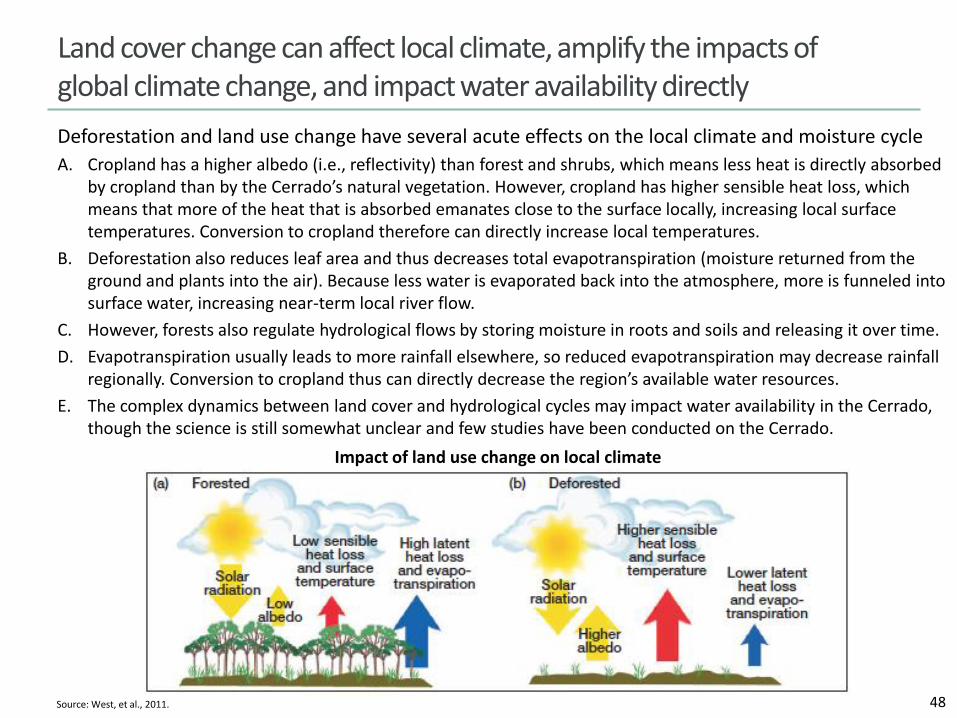
Deforestation and land use change have several acute effects on the local climate and moisture cycle
A. Cropland has a higher albedo (i.e., reflectivity) than forest and shrubs, which means less heat is directly absorbed by cropland than by the Cerrado’s natural vegetation. However, cropland has higher sensible heat loss, which means that more of the heat that is absorbed emanates close to the surface locally, increasing local surface temperatures. Conversion to cropland therefore can directly increase local temperatures.
B. Deforestation also reduces leaf area and thus decreases total evapotranspiration (moisture returned from the ground and plants into the air). Because less water is evaporated back into the atmosphere, more is funneled into surface water, increasing near-term local river flow.
C. However, forests also regulate hydrological flows by storing moisture in roots and soils and releasing it over time.
D. Evapotranspiration usually leads to more rainfall elsewhere, so reduced evapotranspiration may decrease rainfall regionally. Conversion to cropland thus can directly decrease the region’s available water resources.
E. The complex dynamics between land cover and hydrological cycles may impact water availability in the Cerrado, though the science is still somewhat unclear and few studies have been conducted on the Cerrado.
48 Source: West, et al., 2011.
Impact of land use change on local climate