challenges and improvements in diagnostic services across seven day services
DESCRIPTION
Prof Erika Denton, National Clinical Director for Diagnostics. Slides from Erika's presentation at the 7 Day services events in West Midlands 11th June and East Midlands 12th June, 2014.TRANSCRIPT
The Challenges and
Improvements in Diagnostic
Services across 7 Day Services
Prof Erika Denton, National Clinical Director for Diagnostics
West Midlands
June 11th 2014

• The NHS and diagnostics
• National data
• Geographical variation
• 7 day & 24/7 working
• Diagnostic service improvement work
The aim for all healthcare…..
To deliver appropriate, good quality, cost effective care
co-ordinated across primary and secondary care

The five pillars of diagnostics
10% of NHS spend, £8 billion
1 billion tests pa
Ge
net
ics
Cyt
o &
mo
loec
ula
r ge
net
ics
Imag
ing
eg x
-Ray
, CT,
MR
I, u
ltra
sou
nd
End
osc
op
y in
c co
lon
osc
op
y
Ph
ysio
logy
Eg
Au
dio
logy
, Res
p, C
ard
iac
Pat
ho
logy
B
loo
d, C
ellu
lar,
Infe
ctio
n
The five pillars of diagnostics

Why does diagnostics matter?
Key examples:
• Pathology, imaging & endoscopy for cancer diagnosis
• Timely brain imaging enables thrombolysis and doubles number of stroke patients who walk, from 1/3 to 2/3
• Interventional radiology for post partum haemorrhage vs hysterectomy, in limb ischemia vs amputation
• Sleep studies initiate treatment to prevent morbidity & mortality
• Genetic testing enables monitoring or intervention to avoid early death & hereditary transmission
• Long term condition management of diabetes, rheumatological disorders etc
NHS Outcomes Framework
Commissioning to support delivery of 5 domains:
• Domain 1 To prevent people from dying prematurely
• Domain 2 To enhance the quality of life for people with long term conditions
• Domain 3 To help people recover from episodes of ill health or following injury
• Domain 4 To ensure that people have a positive experience of care
• Domain 5 To treat and care for people in a safe environment and protect them
from avoidable harm

Sounds simple for a CCG….?
1-3 large acute
contracts, value
>£50million
10 - 30 smaller
inpatient and
community contracts
c. £1million
100s of single
provider
contracts or
individual patient
placements
<£100k
Cataracts
General surgery
A&E
Trauma
Maternity
Comorbidities
Dementia
Neurology
Weight management
Cancer
Depression
Respiratory
Long Term conditions
Rehab
Deprivation
Disadvantaged
groups
Specialised Commissioning
• 5 groups of Service Specific CRGs
• Specialised is for popn >1m, rare conditions
• Directly commissioned by NHSE
• Standardised structure for all CRGs

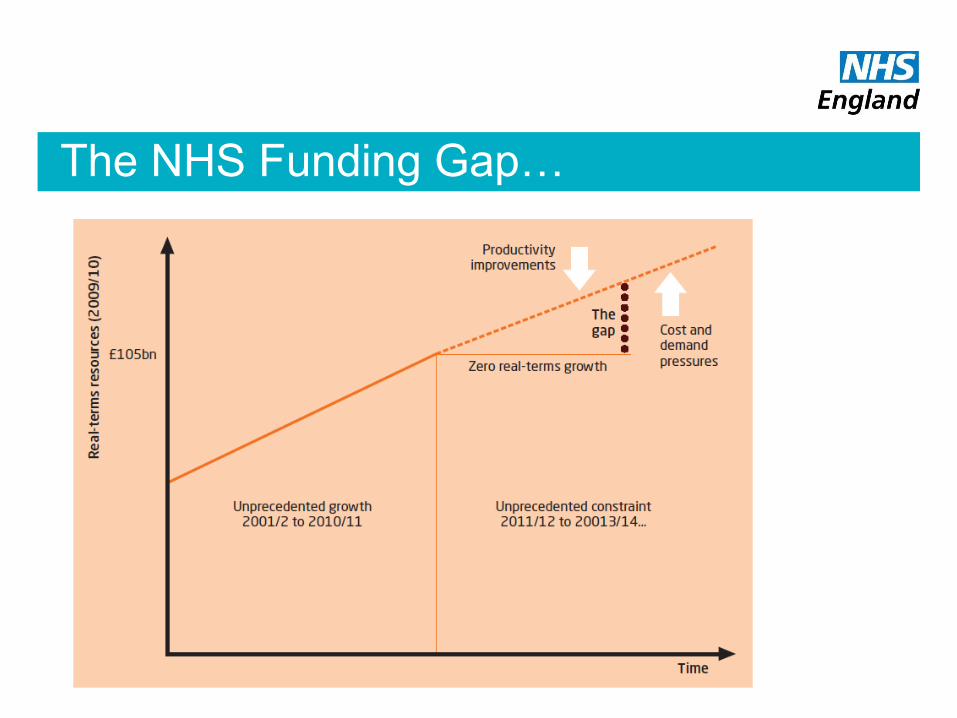
The NHS Funding Gap…

Projected Rate Of Population Growth
By Age Last Birthday Graph showing projected rate of growth of Projected populations at mid-years by
age last birthday (under 60 years and over 60 years) over the next 8 years.
Source: Government's actuarial department
0%
2%
4%
6%
8%
10%
12%
14%
16%
Year
Projected Population
Increase from 2004 %
Under 60 (% increase from 2004)
Over 60 (% increase from 2004)
Under 60 (% increase from 2004) 0.0% 0.5% 0.8% 0.8% 0.7% 0.9% 1.0% 1.3% 1.5%
Over 60 (% increase from 2004) 0.0% 1.4% 2.8% 5.6% 7.9% 9.8% 11.5% 13.1% 14.6%
2004 2005 2006 2007 2008 2009 2010 2011 2012
The vast majority of increase in population over the next 6 years is predicted to be in
the 60+ age bracket.
The vast majority of increase in population over the next 6 years is predicted to be in
the 60+ age bracket.
(Source: Government’s actuarial
department).

Causes Of Death, over 60s
Respiratory Diseases
GI Disease
Mental/Behavioural
CNS Disease
Abnormal Findngs
All Others
Circulatory Diseases
Neoplasms 80% of death of
the over 60s
attributed to 3
underlying
causes
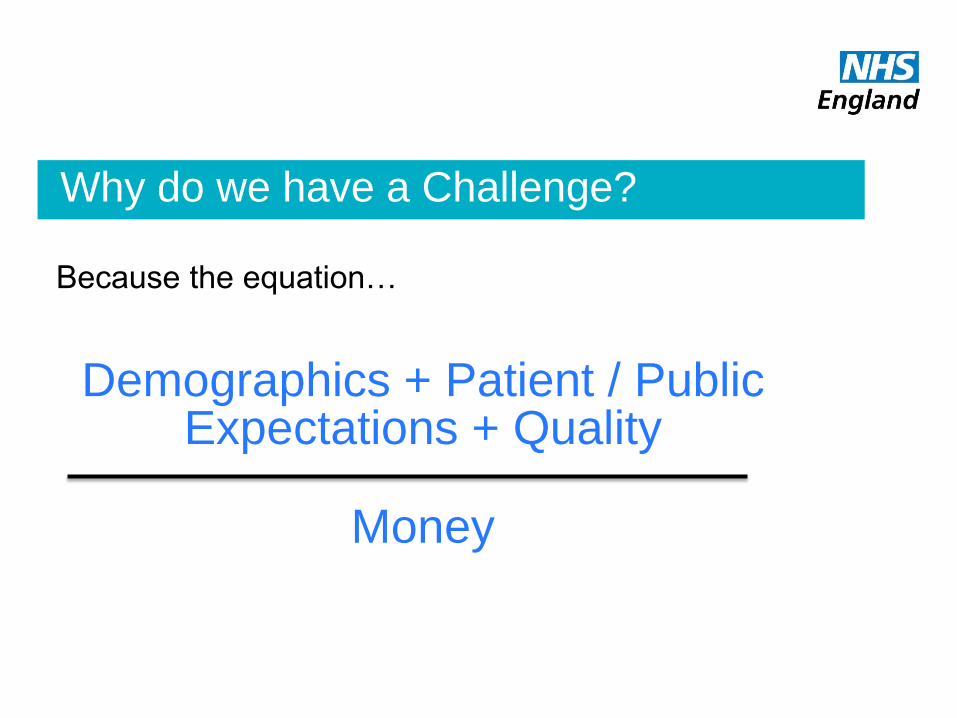
Why do we have a Challenge?
Because the equation…
Demographics + Patient / Public Expectations + Quality
Money

Rising to the Challenge?
Demographics + Patient / Public Expectations + Quality
Money
Solution = transformational change to the current way of delivering health care

‘Old’ vs ‘New’ change methodology
Transactional change:
Doing things better
Transformational change:
Doing better things
‘You can’t solve a problem by using
the same thinking that created it’
Albert Einstein
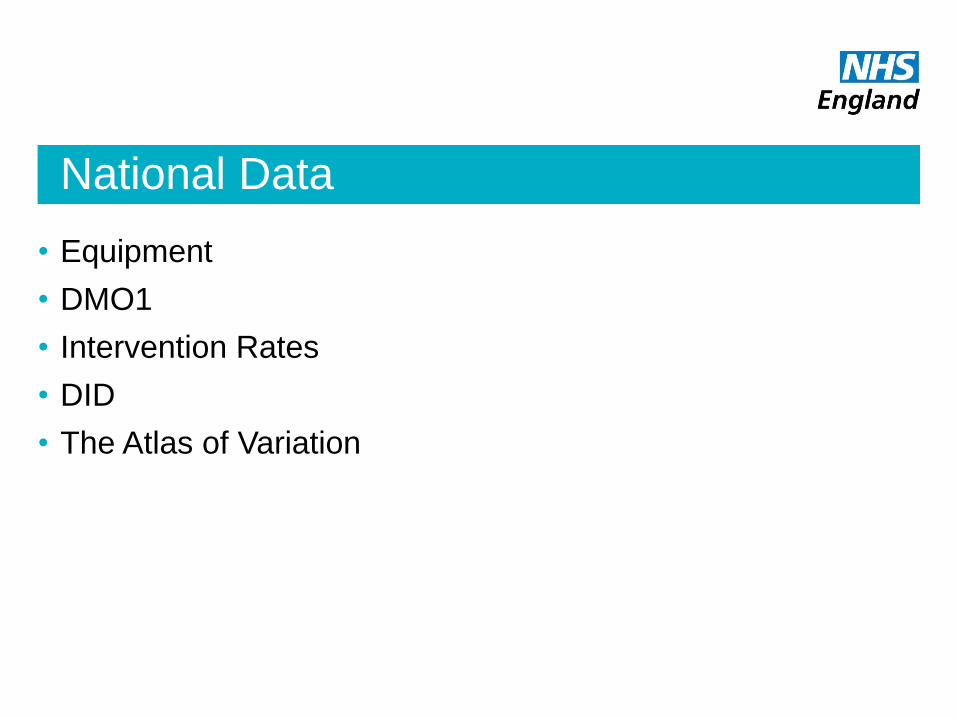
National Data
• Equipment
• DMO1
• Intervention Rates
• DID
• The Atlas of Variation

National Audit Office Report 2011
Managing high value capital
equipment in the NHS in England
• MR, CT, RT linacs
• Poor VFM in purchase & maintenance
• Variable utilisation
• Poor cost & performance data
NHS Supply chain currently reviewing existing equipment in NHS to baseline & evidence benefit of modernisation
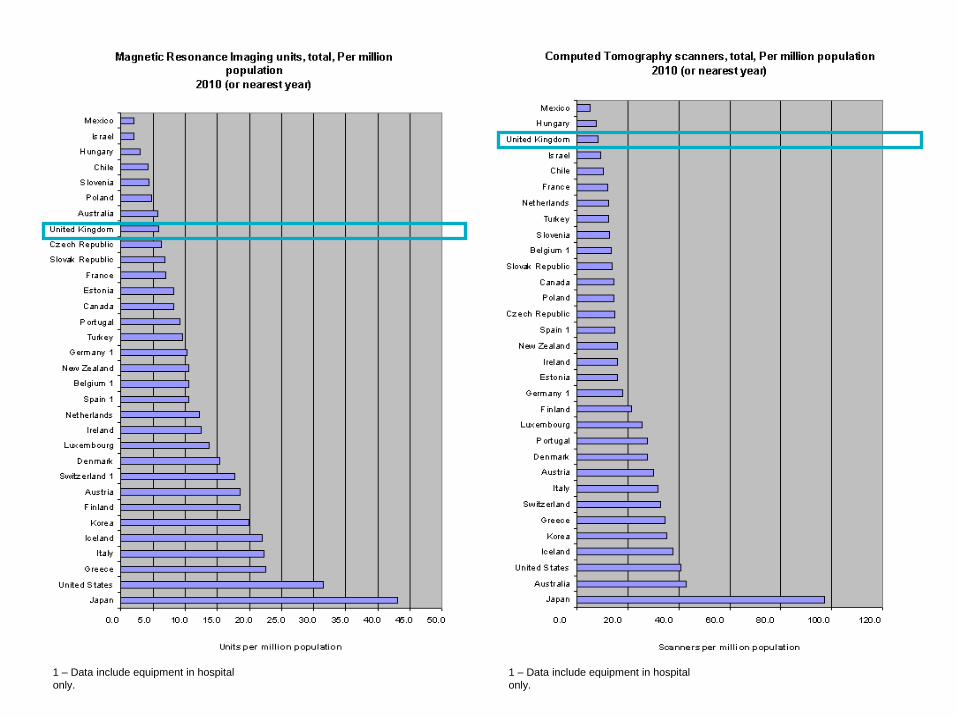
1 – Data include equipment in hospital
only.
1 – Data include equipment in hospital
only.

20
0
200,000
400,000
600,000
800,000
1,000,000
1,200,000
1,400,000
1,600,000
All 15 key tests
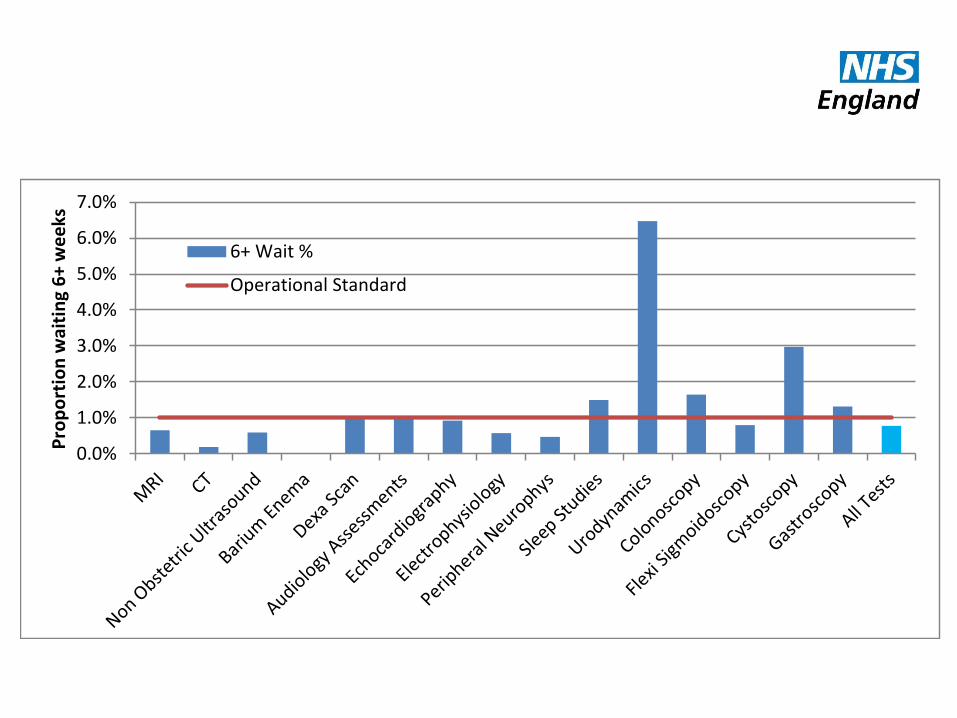
0.0%
1.0%
2.0%
3.0%
4.0%
5.0%
6.0%
7.0%
Pro
po
rtio
n w
aiti
ng
6+
we
eks
6+ Wait %
Operational Standard
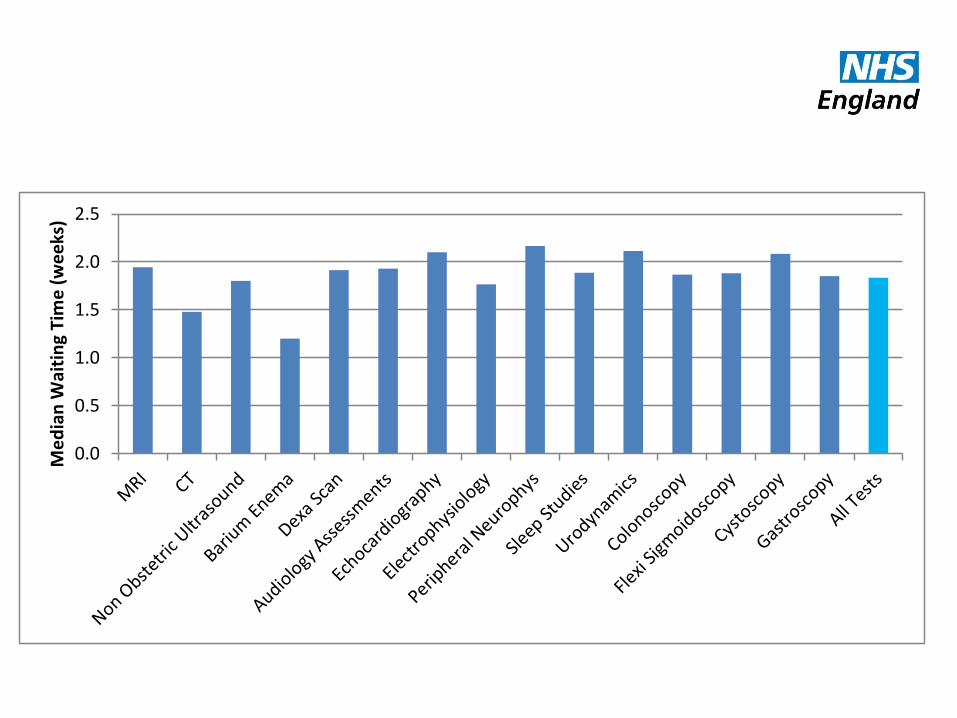
0.0
0.5
1.0
1.5
2.0
2.5
Me
dia
n W
aiti
ng
Tim
e (
we
eks
)

-
5,000
10,000
15,000
20,000
25,000
30,000
Gastroscopy

24
0
10000
20000
30000
40000
50000
60000
Gastroscopy
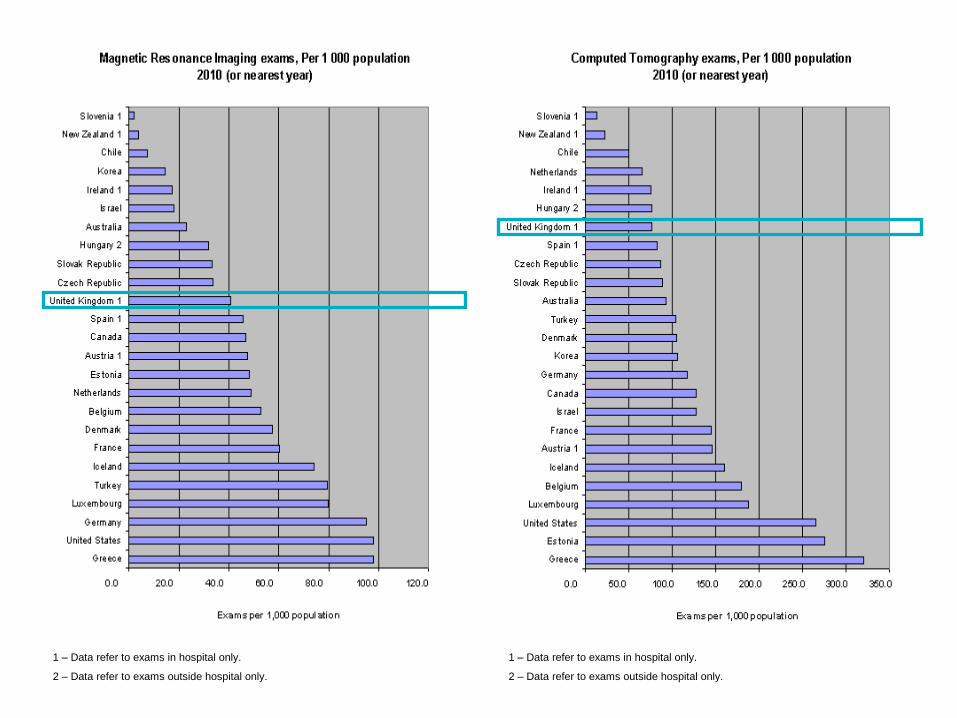
1 – Data refer to exams in hospital only.
2 – Data refer to exams outside hospital only.
1 – Data refer to exams in hospital only.
2 – Data refer to exams outside hospital only.
The Diagnostic Imaging Dataset: DID
• Monthly
• Direct from RIS
• Every imaging event: requester, demographics, code of test etc
• Report turnaround & waiting times
• Link to outcomes via HES & Cancer registries?
• Extending to include all diagnostics?
Aim: to establish “optimum” intervention rates
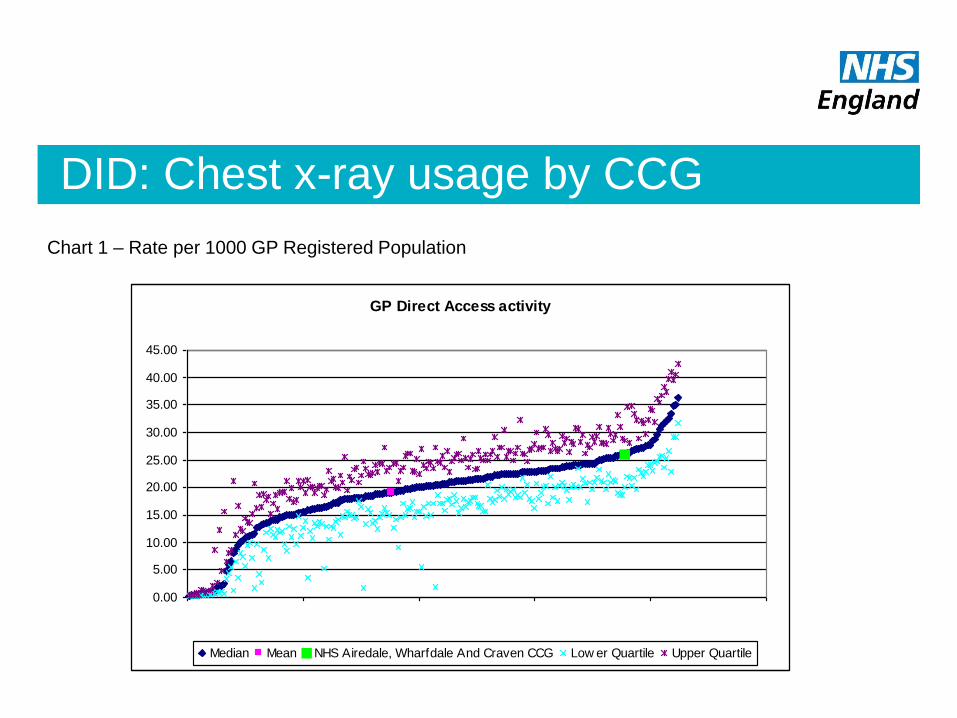
DID: Chest x-ray usage by CCG
Chart 1 – Rate per 1000 GP Registered Population
GP Direct Access activity
0.00
5.00
10.00
15.00
20.00
25.00
30.00
35.00
40.00
45.00
0 50 100 150 200 250
Median Mean NHS Airedale, Wharfdale And Craven CCG Low er Quartile Upper Quartile
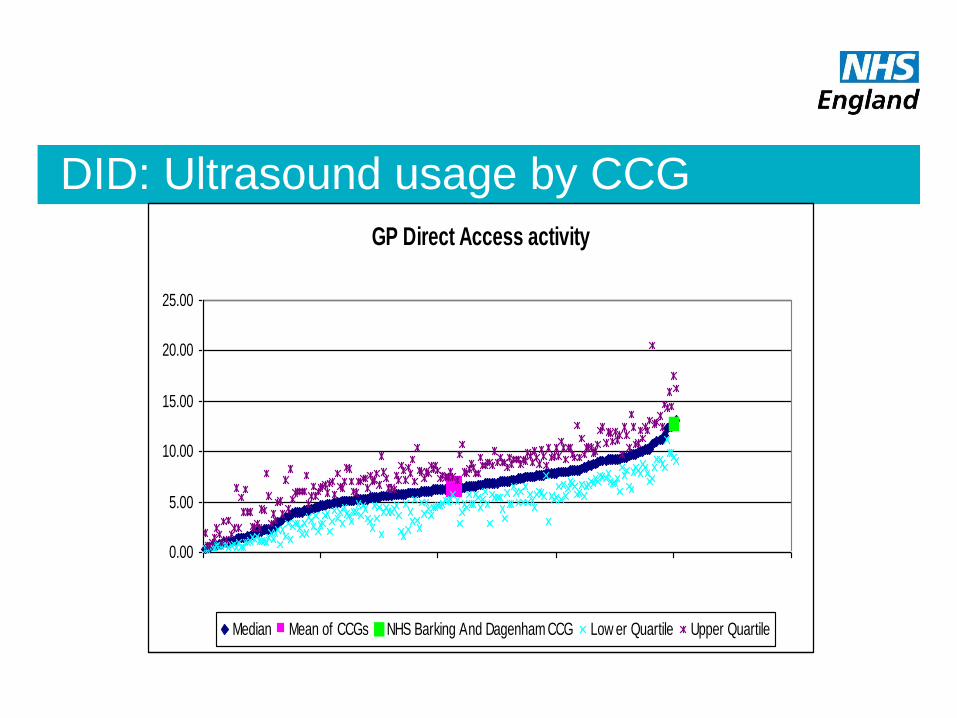
DID: Ultrasound usage by CCG
GP Direct Access activity
0.00
5.00
10.00
15.00
20.00
25.00
0 50 100 150 200 250
Median Mean of CCGs NHS Barking And Dagenham CCG Low er Quartile Upper Quartile

Life across the NHS?
Just do more!!

The NHS Atlas of Variation
Looking at rate of healthcare interventions undertaken per
population
eg. For sleep studies 2010/11
60 fold variation between the highest PCT and lowest PCT
still a 27-fold variation, when you don’t consider the top 5
and bottom 5 PCTs
Similar pattern across diagnostic services
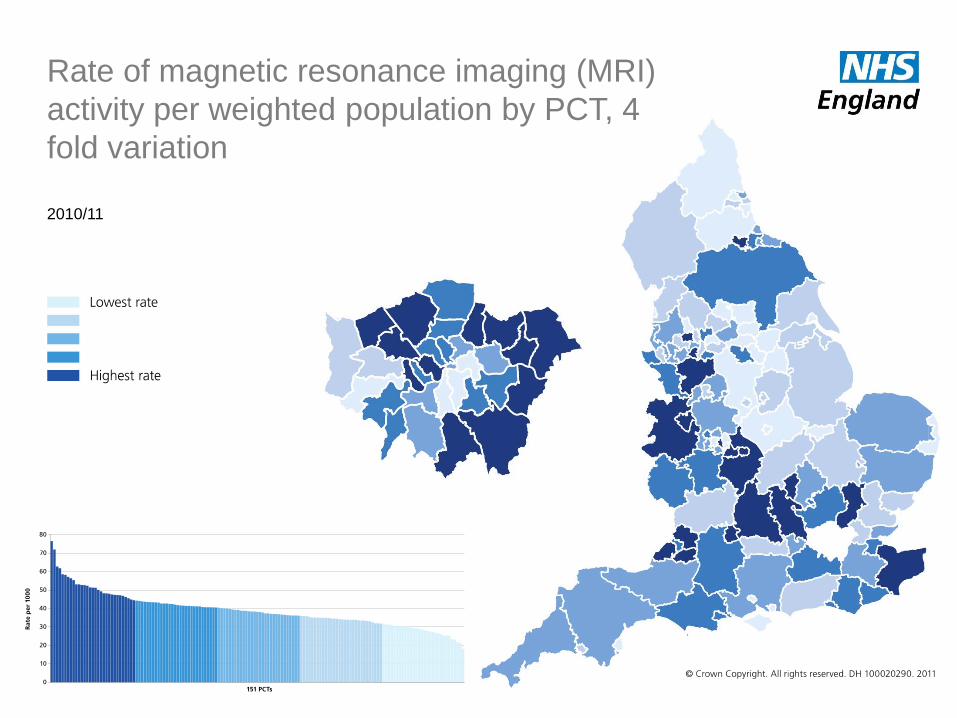
Rate of magnetic resonance imaging (MRI)
activity per weighted population by PCT, 4
fold variation
2010/11
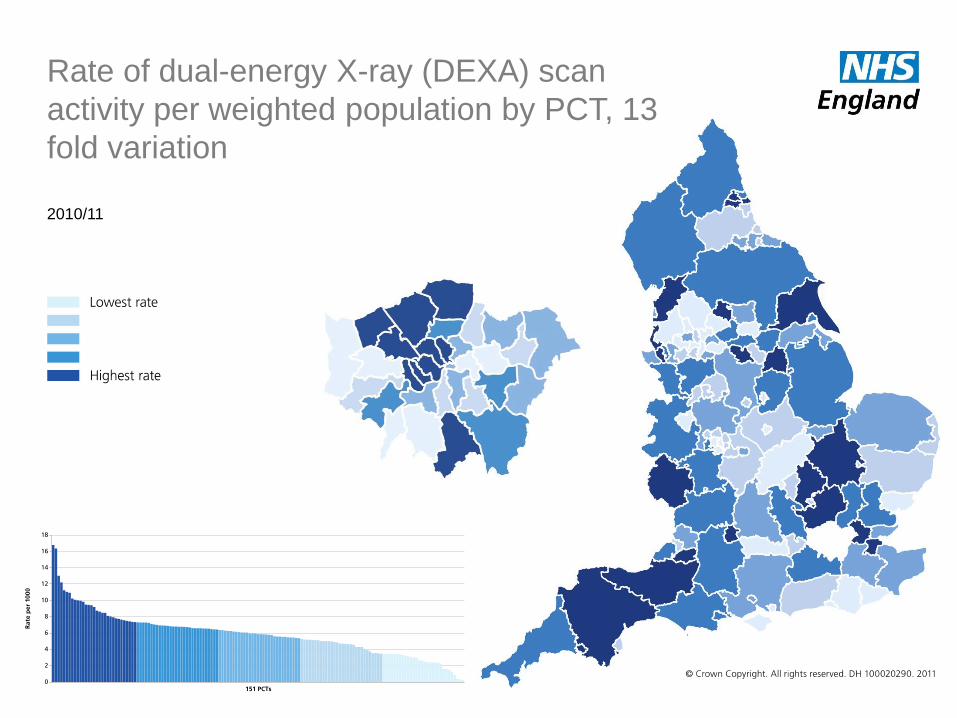
Rate of dual-energy X-ray (DEXA) scan
activity per weighted population by PCT, 13
fold variation
2010/11

Rate of PET/CT activity per population,
by PCT, 25 fold variation
2010/11
• Benchmarking
• NHS diagnostic service improvement
• Pathology
• Endoscopy
• Interventional radiology
• 7 day services
NHS | Presentation to [XXXX Company] | [Type Date] 34
NHS Service Improvement
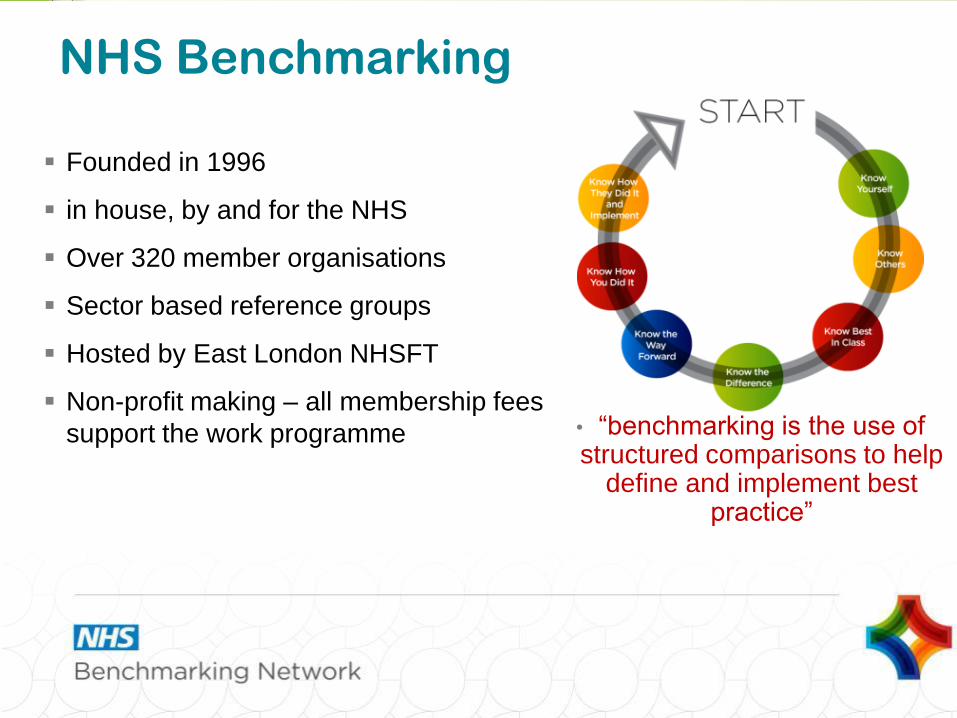
Founded in 1996
in house, by and for the NHS
Over 320 member organisations
Sector based reference groups
Hosted by East London NHSFT
Non-profit making – all membership fees
support the work programme
NHS Benchmarking
• “benchmarking is the use of structured comparisons to help
define and implement best practice”
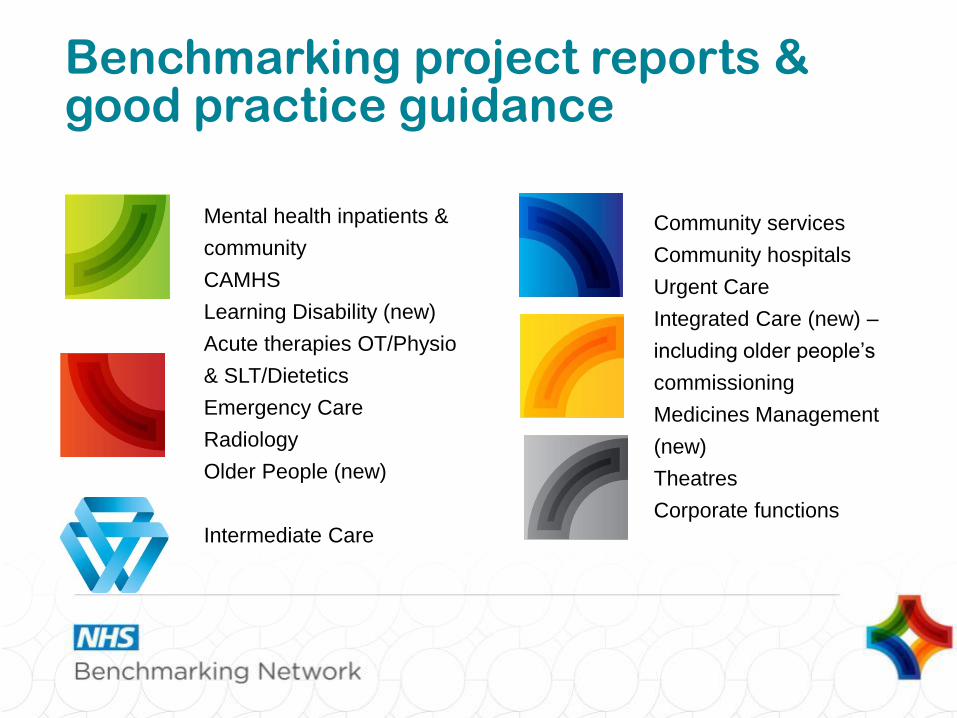
Community services
Community hospitals
Urgent Care
Integrated Care (new) –
including older people’s
commissioning
Medicines Management
(new)
Theatres
Corporate functions
Benchmarking project reports & good practice guidance
Mental health inpatients &
community
CAMHS
Learning Disability (new)
Acute therapies OT/Physio
& SLT/Dietetics
Emergency Care
Radiology
Older People (new)
Intermediate Care
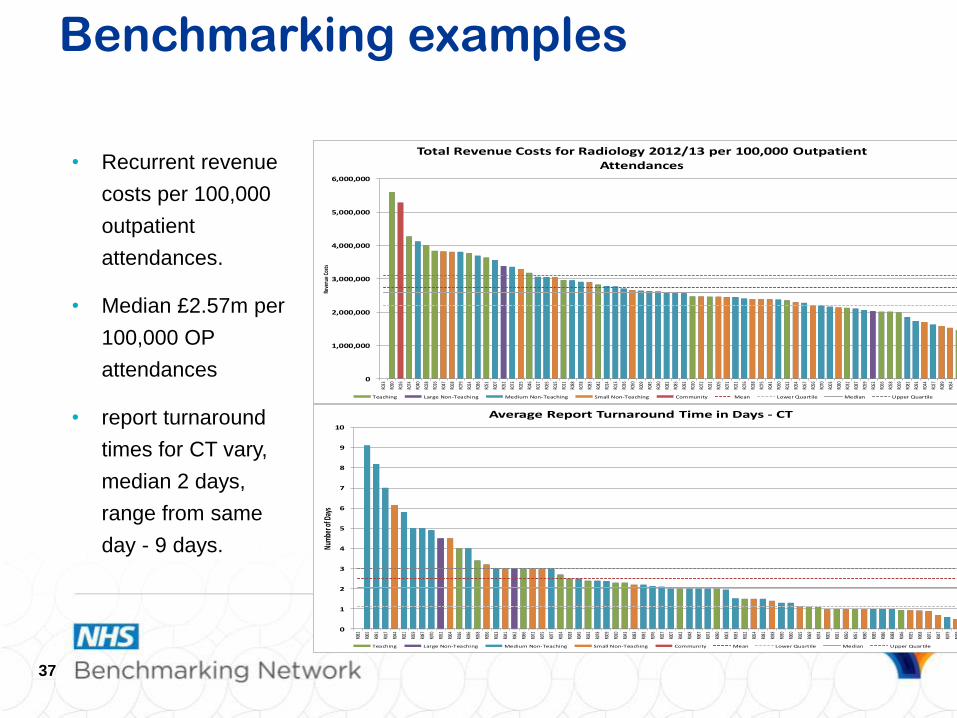
• Recurrent revenue
costs per 100,000
outpatient
attendances.
• Median £2.57m per
100,000 OP
attendances
• report turnaround
times for CT vary,
median 2 days,
range from same
day - 9 days.
Benchmarking examples
37
0
1,000,000
2,000,000
3,000,000
4,000,000
5,000,000
6,000,000
R033
R090
R026
R074
R040
R028
R016
R047
R068
R079
R024
R086
R051
R007
R052
R073
R025
R046
R017
R065
R015
R011
R088
R078
R083
R042
R014
R013
R036
R050
R009
R045
R030
R082
R085
R092
R010
R072
R031
R005
R071
R021
R076
R038
R075
R041
R060
R012
R054
R067
R056
R070
R003
R080
R032
R087
R059
R062
R066
R058
R069
R081
R091
R044
R027
R089
R064
R084
Reve
nue
Cost
s
Total Revenue Costs for Radiology 2012/13 per 100,000 Outpatient Attendances
Teaching Large Non-Teaching Medium Non-Teaching Small Non-Teaching Community Mean Lower Quartile Median Upper Quartile
0
1
2
3
4
5
6
7
8
9
10
R082
R065
R091
R017
R044
R021
R059
R087
R070
R052
R064
R016
R036
R058
R056
R013
R041
R062
R066
R072
R075
R077
R024
R028
R045
R032
R078
R009
R010
R043
R083
R092
R076
R027
R007
R042
R048
R067
R073
R090
R003
R033
R012
R054
R081
R038
R030
R060
R015
R069
R074
R005
R031
R050
R051
R080
R085
R086
R088
R046
R025
R068
R071
R047
R079
R049
Num
ber o
f Day
s
Average Report Turnaround Time in Days - CT
Teaching Large Non-Teaching Medium Non-Teaching Small Non-Teaching Community Mean Lower Quartile Median Upper Quartile

Reporting using Voice Recognition
Average 62% of examinations reported with VR
38
0%
20%
40%
60%
80%
100%
120%
R011
R028
R052
R070
R084
R090
R013
R033
R060
R058
R003
R009
R093
R048
R077
R017
R043
R045
R078
R064
R074
R068
R007
R038
R066
R079
R082
R050
R010
R015
R005
R046
R080
R030
R031
R092
R065
R054
R069
R044
R016
R083
R073
R025
R071
R036
R059
R027
R081
R087
R047
R072
R062
R075
R056
R021
R014
R088
R042
R076
R012
R085
% o
f Exa
min
atio
ns R
epor
ted
Usi
ng V
oice
Rec
ogni
tion
Sof
twar
e
% of Total Examination Reported Using Voice Recognition Software
Teaching Large Non-Teaching Medium Non-Teaching Small Non-Teaching Community Mean Lower Quartile Median Upper Quartile
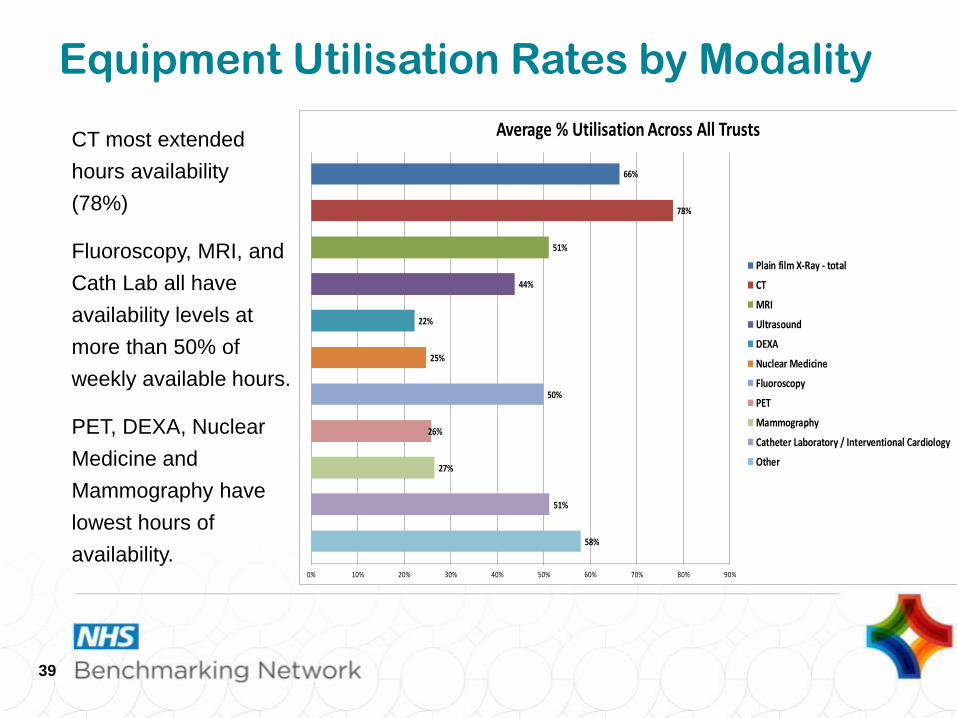
CT most extended
hours availability
(78%)
Fluoroscopy, MRI, and
Cath Lab all have
availability levels at
more than 50% of
weekly available hours.
PET, DEXA, Nuclear
Medicine and
Mammography have
lowest hours of
availability.
Equipment Utilisation Rates by Modality
39
58%
51%
27%
26%
50%
25%
22%
44%
51%
78%
66%
0% 10% 20% 30% 40% 50% 60% 70% 80% 90%
Average % Utilisation Across All Trusts
Plain film X-Ray - total
CT
MRI
Ultrasound
DEXA
Nuclear Medicine
Fluoroscopy
PET
Mammography
Catheter Laboratory / Interventional Cardiology
Other
Pathology Improvement Programme
From 2008
• Cytology
• Histopathology
• Blood Sciences
• Microbiology
• Phlebotomy
• SHA based approach
0102030405060708090
100
Oct-
09
Nov-0
9
Dec-0
9
Jan-1
0
Feb-1
0
Mar-
10
Apr-
10
May-1
0
Jun-1
0
Jul-10
Aug-1
0
Sep-1
0
Oct-
10
Nov-1
0
Perc
en
tag
e (
%)
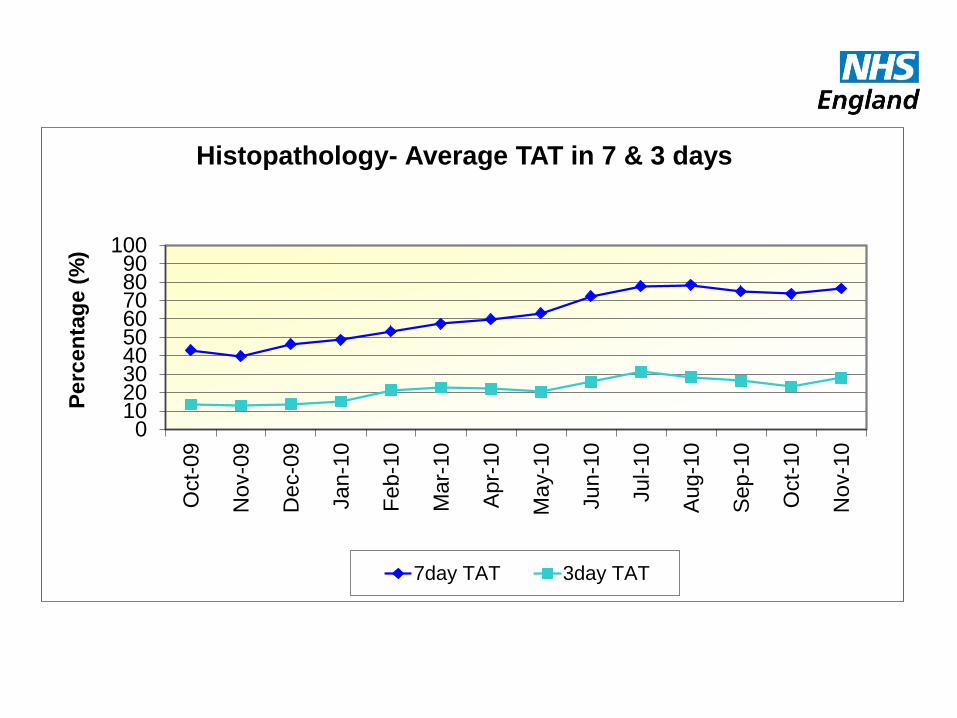
Histopathology- Average TAT in 7 & 3 days
7day TAT 3day TAT
Lessons learned
• In house improvements in pathology impacted positively on whole patient pathways
• Quality was improved
• Turnaround times were reduced
• Sustainment of the improved processes was variable
• The ability of Managers and Leaders was variable
Second Phase for National Pathology
Improvement
• ‘Influencing the future-leadership in action’
Leadership Development Programme
first in pathology now for MDTs with radiology
• Exemplar site development
Organisation development programme learning from those with sustained best practice and
continuing to innovate and improve

Interventional Radiology:
the evidence for change
the evidence for change • NCEPOD on Trauma, Renal, IR & Neuro IR, AAA
• NICE: UAE, NAI etc
• Northwick Park Maternity Services HCC report
• Birmingham Children’s Services HCC report
• National Imaging Board’s reports:
‘Interventional Radiology: Improving Quality and Outcome for Patients’
‘Interventional Radiology: Guidance for Service Delivery’
DH involvement with
Interventional Radiology
• Interventional Radiology (IR):
‘Improving Quality and Outcomes
for Patients’ (DH, National Imaging
Board 2009)
• Interventional Radiology: Guidance
for Service Delivery (DH 2010)
• Delivering the Service:
Interventional Radiology for Major
Trauma Networks (DH 2010)
• Towards best practice in IR – (NHS
Improvement 2012)

College Guidelines: RCR (2009):Standards
for providing a 24-hour radiology service
Acute intervention including damage control surgery, . . . .
. . . . . interventional radiology, haemorrhage control, and blood transfusion.
Interventional suites should be co-located with operating rooms &/or resuscitation areas.
Interventional radiology (IR) taking place within an MTC should be available 24 hours a day.
Patients requiring acute intervention for haemorrhage control should be in a definitive management area (operating room or IR suite) within 60 mins of arrival.
IR Programme 2011-12:
Trauma & IR
Aim: 24/7 Interventional Radiology services in all Major Trauma centres
• National Survey
• Visits to 24 Major Trauma Centres
• Publication of Learning Document
• 2 National Workshops to launch the document and share good practice

Aim: Provide access to IR services for all, 24/7
Focus on core procedures- embolisation for haemorrhage (general and PPH), endovascular intervention, nephrostomy
• Promoting Networks
• East Midlands and South West (Interviews and visits)
• Other possible networks (telephone interviews)
• Workshops East Midlands and Southwest
• 3rd IR Survey 2013
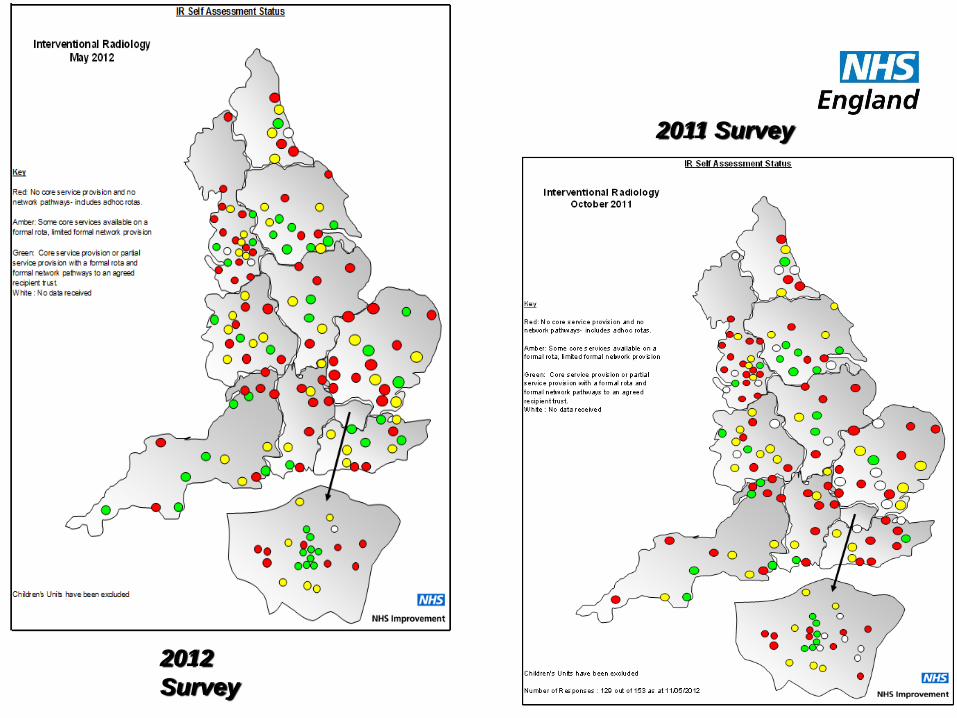
IR work in 2013 IR work in 2013: access to IR

Red: No core service
provision and no network
pathways - includes
adhoc rotas.
Amber: Some core
services available on a
formal rota, limited formal
network provision
Green: Core service
provision or partial
service provision with a
formal rota and formal
network pathways to an
agreed recipient trust.
White : No data received
NHS Improvement Survey
2011, MTCs

2012
Survey
2011 Survey
2012
Survey
2011 Survey
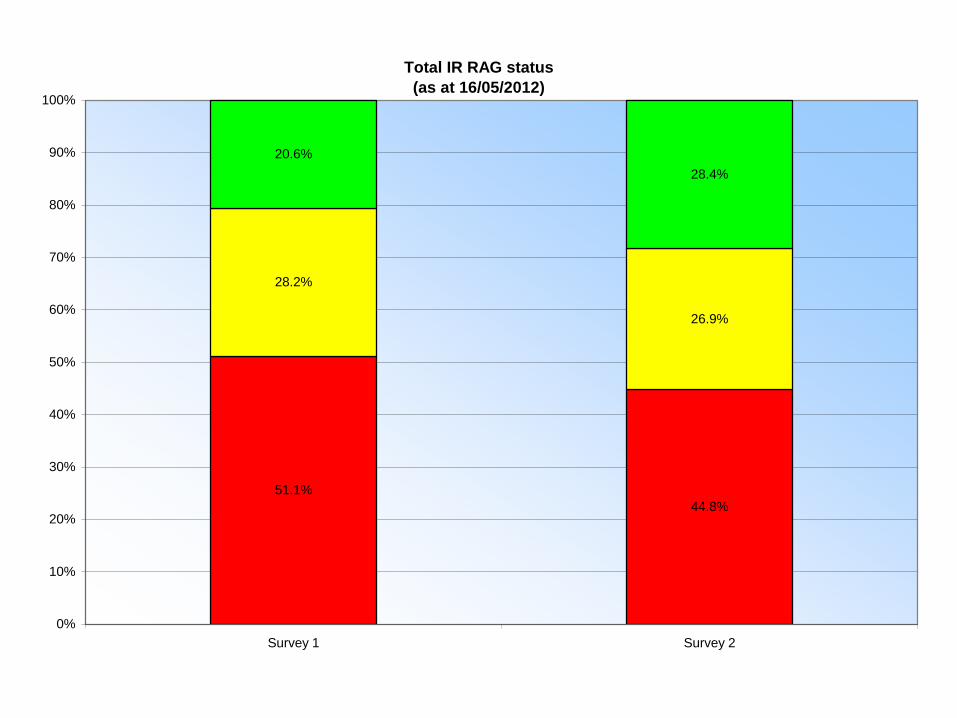
Total IR RAG status
(as at 16/05/2012)
51.1%
44.8%
28.2%
26.9%
20.6%
28.4%
0%
10%
20%
30%
40%
50%
60%
70%
80%
90%
100%
Survey 1 Survey 2

Staffing (Actuals)
0
50
100
150
200
250
300
350
North East North West Yorkshire
and
Humberside
East
Midlands
West
Midlands
East of
England
London South East
Coast
South
Central
South West
WTE Radiologists IR Radiologists Radiographers IR Nurses

Nephrostomy - Interventions per Radiologist
0.00
5.00
10.00
15.00
20.00
25.00
30.00
35.00
Nor
th E
ast
Nor
th W
est
Yor
kshire
and
Hum
berside
Eas
t Midla
nds
West
Mid
land
s
Eas
t of E
ngland
Lond
on
Sou
th E
ast C
oast
Sou
th C
entra
l
Sou
th W
est
# In
terv
en
tio
ns

Uterine Fibroid Emolization - Interventions per
Radiologist
0.001.002.003.004.005.006.007.008.009.00
10.00
Nor
th E
ast
Nor
th W
est
Yor
kshire
and
Hum
bers
ide
Eas
t Midla
nds
Wes
t Mid
land
s
Eas
t of E
ngland
Lond
on
Sou
th E
ast C
oast
Sou
th C
entra
l
Sou
th W
est
# In
terv
en
tio
ns

Two key issues remain
1. Lack of network approaches
2. Lack of IR Radiologists
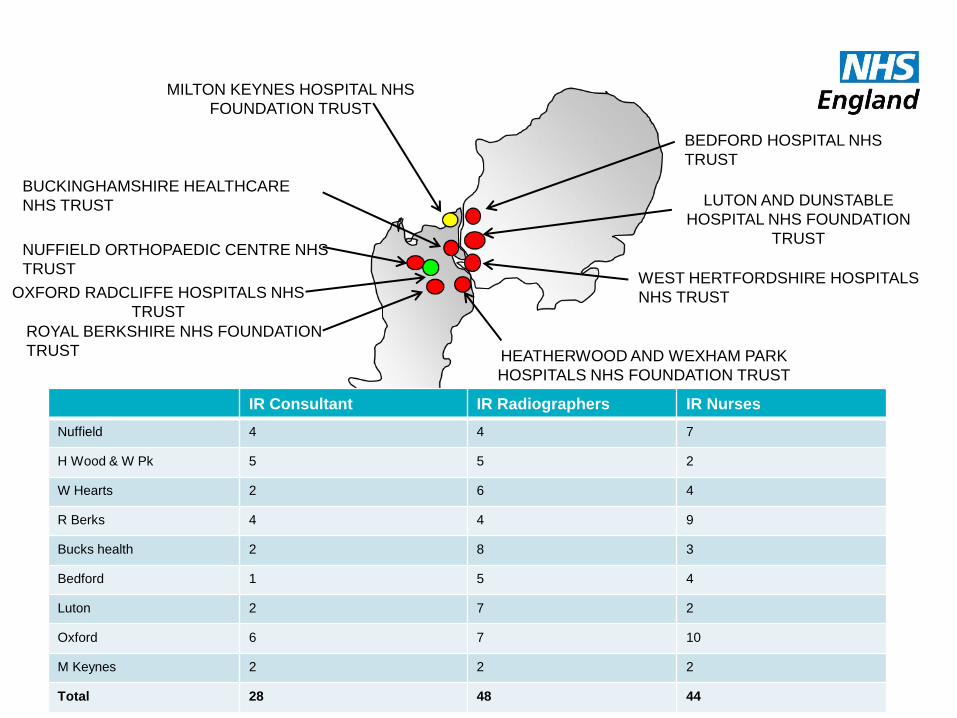
WEST HERTFORDSHIRE HOSPITALS
NHS TRUST
ROYAL BERKSHIRE NHS FOUNDATION
TRUST
OXFORD RADCLIFFE HOSPITALS NHS
TRUST
BUCKINGHAMSHIRE HEALTHCARE
NHS TRUST
MILTON KEYNES HOSPITAL NHS
FOUNDATION TRUST
HEATHERWOOD AND WEXHAM PARK
HOSPITALS NHS FOUNDATION TRUST
NUFFIELD ORTHOPAEDIC CENTRE NHS
TRUST
BEDFORD HOSPITAL NHS
TRUST
LUTON AND DUNSTABLE
HOSPITAL NHS FOUNDATION
TRUST
IR Consultant IR Radiographers IR Nurses
Nuffield 4 4 7
H Wood & W Pk 5 5 2
W Hearts 2 6 4
R Berks 4 4 9
Bucks health 2 8 3
Bedford 1 5 4
Luton 2 7 2
Oxford 6 7 10
M Keynes 2 2 2
Total 28 48 44

WESTON AREA HEALTH NHST
NORTH BRISTOL NHS TRUST
UNIVERSITY HOSPITALS COVENTRY AND
WARWICKSHIRE NHS TRUST
WYE VALLEY NHS TRUST
SOUTH WARWICKSHIRE
UNIVERSITY HOSPITALS BRISTOL NHS
FOUNDATION TRUST
ROYAL UNITED HOSPITAL BATH NHS
TRUST
GREAT WESTERN HOSPITALS NHS
FOUNDATION TRUST
GLOUCESTERSHIRE
HOSPITALS NHS
FOUNDATION TRUST
WORCESTERSHIRE ACUTE HOSPITALS
NHS TRUST
IR Consultants/Consultant
Radiologists
IR Radiographers IR Nurses
RUH Bath 3/16 5 4
UH Bristol 7/29 4 3
Gloucester 3/12 4 6
S Warwickshire 4/9 0 0
Great Western Hospitals 3/11 5 4
Worcester 3/14 8 3
Wye Valley 1/8 3 1
Coventry and Warwick 4/25 3 8
North Bristol 6/24 6 12
Weston Area Health 1/6 1 0
Total 35/154 39 41
South West
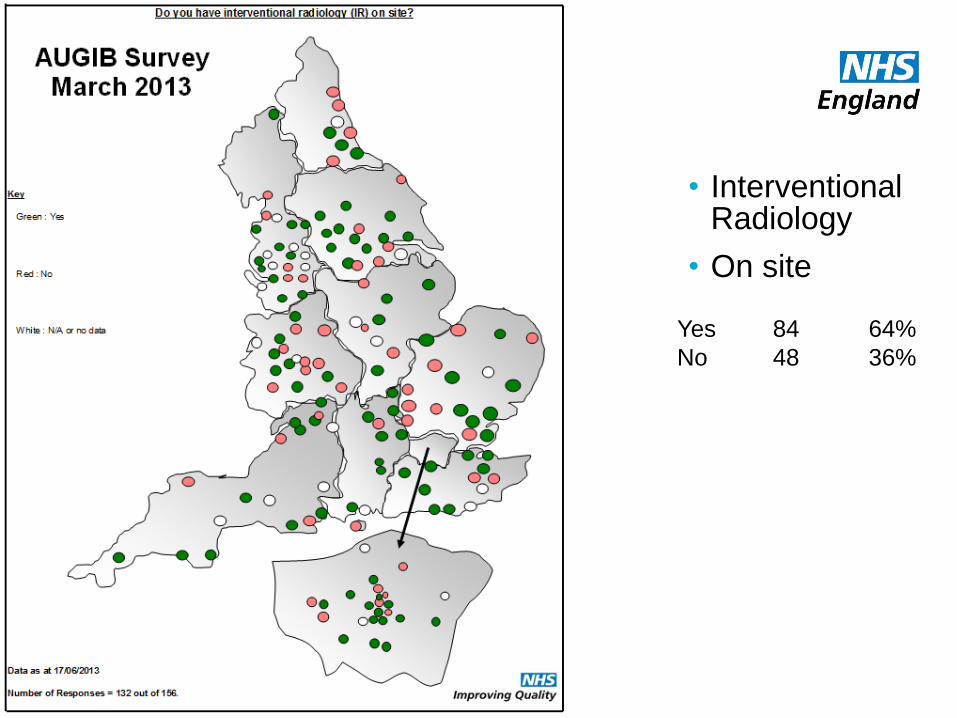
• Interventional Radiology
• On site
Yes 84 64%
No 48 36%
Endoscopy: what looks good?
• An accredited endoscopy service that participates in
• Global Rating System (GRS)
• National audit
• 24/7 service for GI bleeding, networked or in-house
• Access to flexi-sig or colonoscopy in <4 wks for all patients >40 with recent onset rectal bleeding and/or persistent (>3 weeks) diarrhoea.
• Compliant with NICE standards
NHS England

‘‘Hospital services should be commissioned to provide:
24 hr 7 day endoscopy service for GI bleeding’’
‘‘Average GI bleeding mortality rate = 10% is ↓ by
access to 24/7 endoscopy, IR & surgery as an MDT’’
GI bleeding toolkit:
http://aomrc.org.uk/projects/upper-gastrointestinal-bleeding-toolkit.html

• 132 of 156 85% responded
• Self reported RAG status of OOH AUGIB service
Green 81 61%
Amber 32 24%
Red 19 14%
Survey of acute
service providers
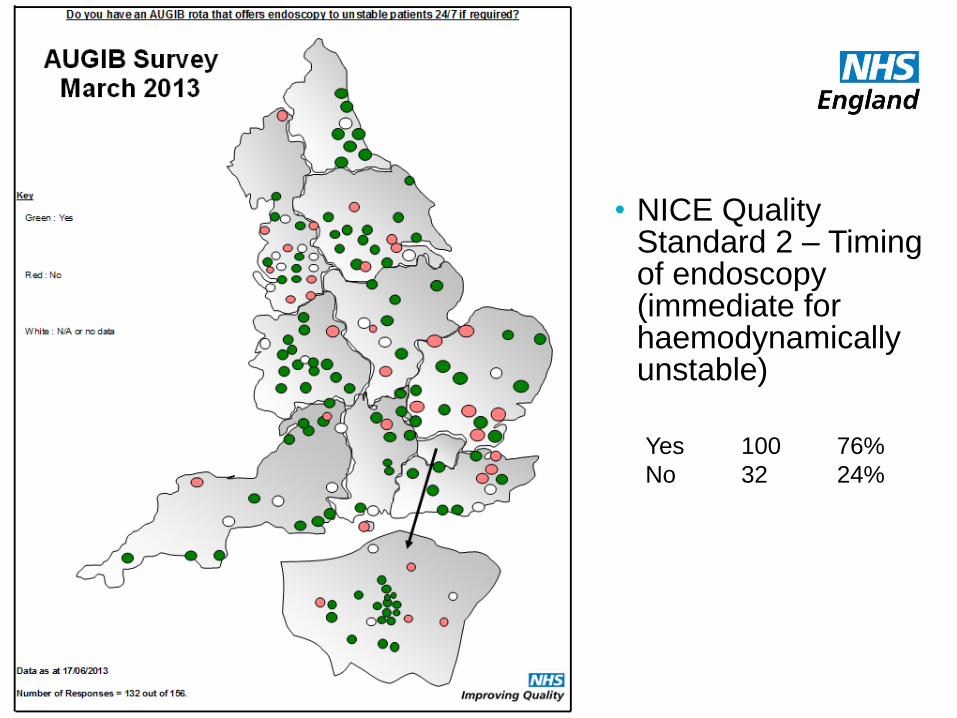
• NICE Quality Standard 2 – Timing of endoscopy (immediate for haemodynamically unstable)
Yes 100 76%
No 32 24%
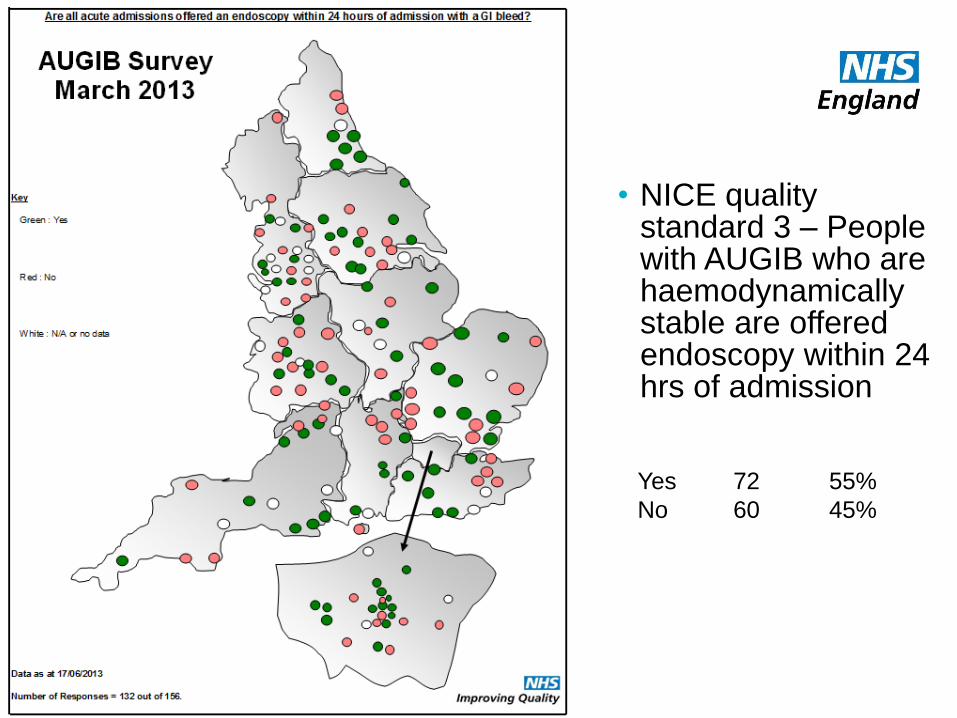
• NICE quality standard 3 – People with AUGIB who are haemodynamically stable are offered endoscopy within 24 hrs of admission
Yes 72 55%
No 60 45%

• Interventional Radiology
• On site
Yes 84 64%
No 48 36%

NHS | Presentation to [XXXX Company] | [Type Date] 67
• Network
Yes 61 46%
No 71 54%

• Barriers currently or envisaged to providing 24/7 therapeutic endoscopy
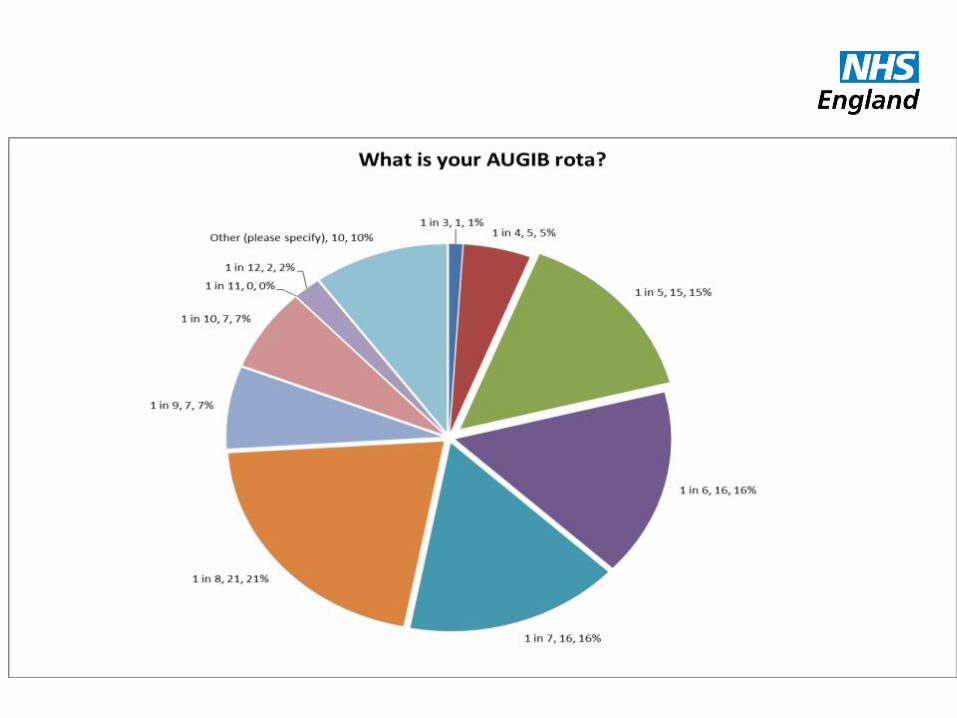
• Rota’s


Open 24 hours?
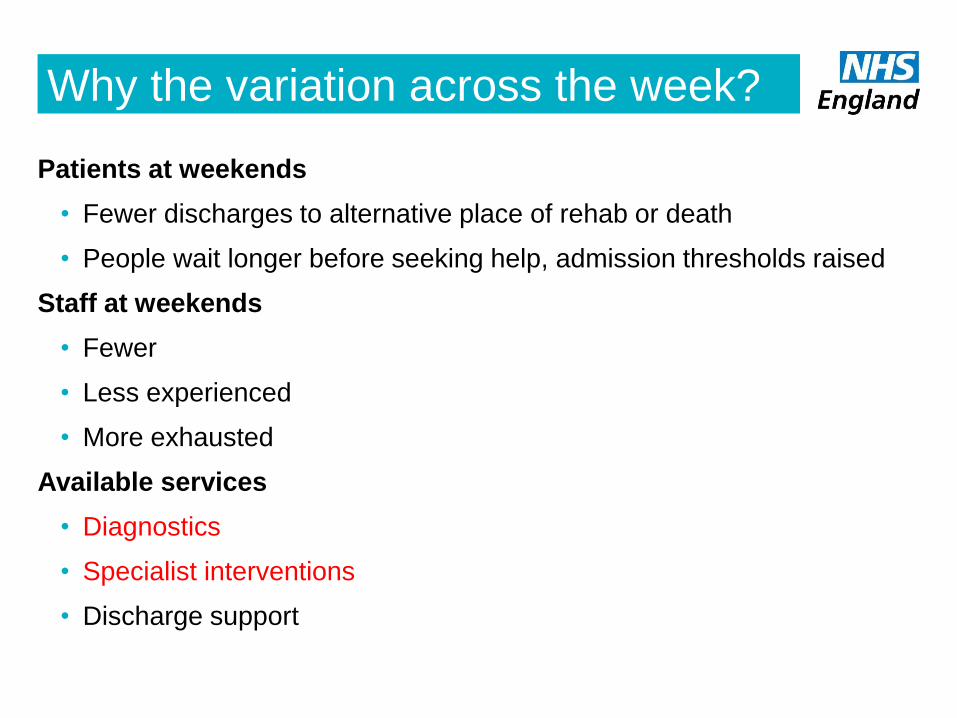
Why the variation across the week?
Patients at weekends
• Fewer discharges to alternative place of rehab or death
• People wait longer before seeking help, admission thresholds raised
Staff at weekends
• Fewer
• Less experienced
• More exhausted
Available services
• Diagnostics
• Specialist interventions
• Discharge support
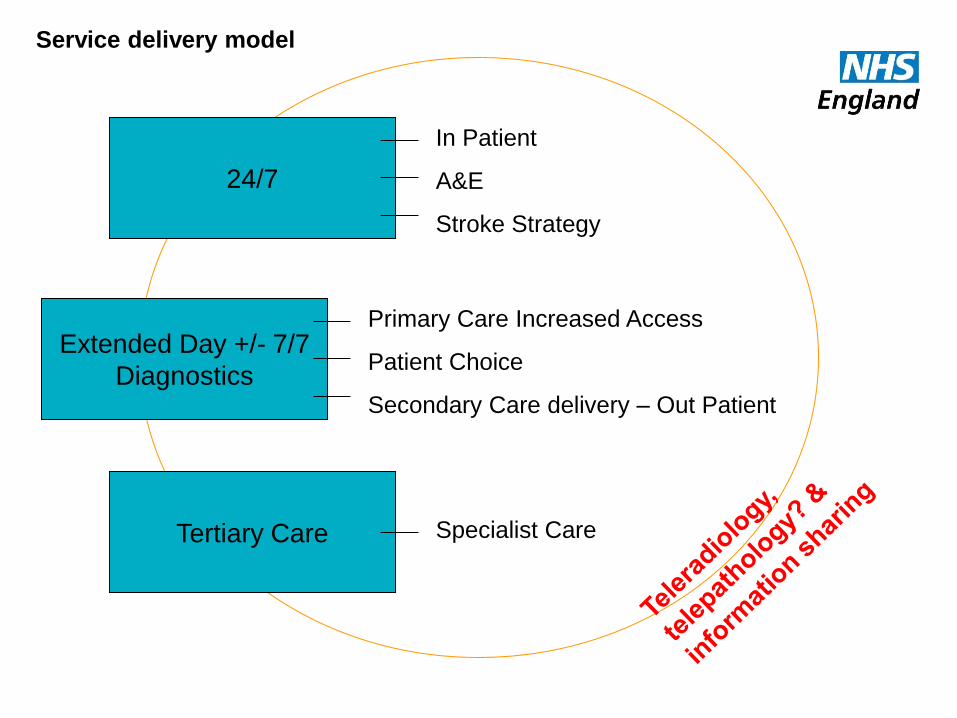
24/7
Extended Day +/- 7/7
Diagnostics
Tertiary Care
In Patient
A&E
Stroke Strategy
Primary Care Increased Access
Patient Choice
Secondary Care delivery – Out Patient
Specialist Care
Service delivery model
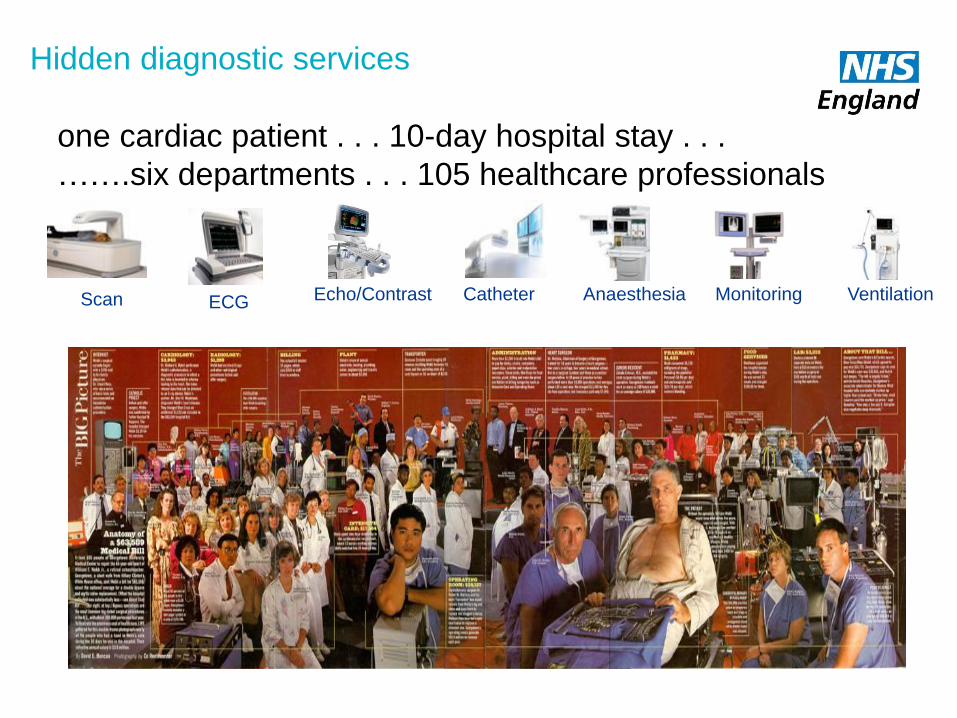
Anaesthesia Monitoring Ventilation ECG Echo/Contrast Catheter Scan
one cardiac patient . . . 10-day hospital stay . . .
…….six departments . . . 105 healthcare professionals
Hidden diagnostic services


“Be ambitious – you can’t
take two steps over a gap”
David Lloyd George