chad: debt sustainability analysis; imf country report … · oil production: chad’s medium- and...
TRANSCRIPT
CHAD REQUEST FOR A THREE-YEAR ARRANGEMENT UNDER THE
EXTENDED CREDIT FACILITY AND CANCELLATION OF THE
CURRENT ARRANGEMENT—DEBT SUSTAINABILITY ANALYSIS
With the accumulation of external debt arrears, Chad is currently in debt distress and the debt
sustainability analysis shows that debt is unsustainable without external commercial debt
restructuring. Two external debt indicators exhibit protracted breaches of their indicative
thresholds. The debt service to revenue ratio continues to be significantly above the threshold
until 2021. Domestic debt has increased in recent years but is projected to decline starting
in 2017. Preserving debt sustainability requires that the authorities maintain fiscal prudence to
gradually improve the primary fiscal balance, and implement prudent debt management
policies, including a comprehensive strategy for domestic arrears clearance. The debt
restructuring currently being pursued by the authorities will be critical to reducing debt to
sustainable levels and lowering the risk of debt distress. Progress in economic diversification
would also strengthen debt sustainability.1
1 Chad’s average CPIA over 2013–15 is estimated at 2.7. This corresponds to a weak policy performance under the
Debt Sustainability Framework for Low-Income Countries (LIC-DSA).
Approved By David Owen and Yan Sun (IMF)
and Paloma Anos-Casero (IDA)
Prepared by the Staffs of the International Monetary
Fund and the International Development Association.
June 19, 2017
CHAD
2 INTERNATIONAL MONETARY FUND
BACKGROUND
1. The composition of Chad’s public debt has changed significantly over the past decade. Over
the last few years, Chad has increasingly relied on domestic and regional banks, non-Paris Club creditors
(e.g., China, Libya, and India), and commercial credits to address its financing needs. There is no recorded
external private debt in Chad.
Public External Debt
2. After stabilizing at around 20 percent, the external public debt-to-GDP ratio increased to
29 percent in 2014 following two non-concessional oil sales’ advance operations with a commercial
creditor, Glencore. In 2013, the authorities signed two agreements for a total of US$600 million with
Glencore to cover revenue shortfalls. In 2014, a new commercial borrowing operation for US$ 1.4 billion
was contracted by SHT (a state-owned oil company) to finance the purchase of Chevron’s shares in Chad’s
largest oil consortium in June of that year.
3. In late 2015, a rescheduling agreement with Glencore consolidated the two oil sales’
advance operations, extending their maturities. The rescheduling agreement provided much needed
debt service flow relief by extending maturity from 4 to over 6 years. However, the imposition of
restructuring fees led to an increase in the present value of the debt. Repaying the Glencore loan using oil
receipts, however, continues to place an excessive burden on the budget. The authorities have publicly
announced their plan to reschedule this debt again.
4. Following the achievement of the HIPC completion point in April 2015, Chad was able to
secure at least US$756 million in debt relief. This amount includes MDRI relief from International
Development Association (IDA) and African Development Bank (AfDB), forgiveness from the IMF, and a
hundred percent cancellation from the Paris Club. Regarding non-Paris Club members, the authorities
signed a new agreement with Saudi Arabia in July 2015 which reschedules their remaining amount on IDA
comparable terms.
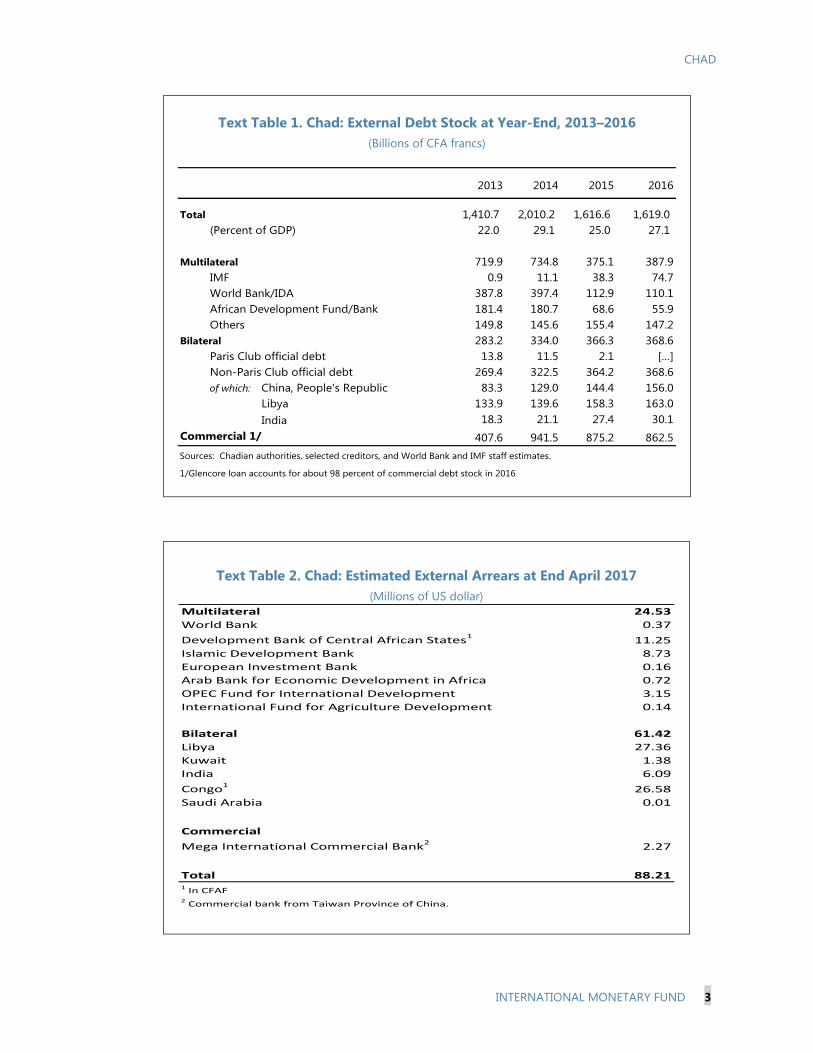
5. As of end-2016, about 53 percent of Chad’s external debt was commercial debt (Text
Table 1). In addition, around 24 percent was owed to multilateral creditors, and 23 percent to bilateral
creditors.
6. External payment arrears accumulated in 2016 and in 2017. As a result of liquidity challenges
the government accrued external arrears vis-à-vis a number of multilateral, bilateral, and commercial
creditors (a bank from Taiwan province of China). The stock of external arrears is estimated at about
US$88 million (0.9 percent of GDP) at end-April 2017 (Text Table 2). The authorities reached out to the
creditors to resolve the arrears. In April 2017, the government reached an agreement with EXIM Bank China
to reschedule overdue (accrued in 2016) and upcoming maturities.
CHAD
INTERNATIONAL MONETARY FUND 3
Text Table 1. Chad: External Debt Stock at Year-End, 2013–2016
(Billions of CFA francs)
Text Table 2. Chad: Estimated External Arrears at End April 2017
(Millions of US dollar)
2013 2014 2015 2016
Total 1,410.7 2,010.2 1,616.6 1,619.0
(Percent of GDP) 22.0 29.1 25.0 27.1
Multilateral 719.9 734.8 375.1 387.9
IMF 0.9 11.1 38.3 74.7
World Bank/IDA 387.8 397.4 112.9 110.1
African Development Fund/Bank 181.4 180.7 68.6 55.9
Others 149.8 145.6 155.4 147.2
Bilateral 283.2 334.0 366.3 368.6
Paris Club official debt 13.8 11.5 2.1 […]
Non-Paris Club official debt 269.4 322.5 364.2 368.6
of which: China, People's Republic 83.3 129.0 144.4 156.0
Libya 133.9 139.6 158.3 163.0
India 18.3 21.1 27.4 30.1
Commercial 1/ 407.6 941.5 875.2 862.5
Sources: Chadian authorities, selected creditors, and World Bank and IMF staff estimates.
1/Glencore loan accounts for about 98 percent of commercial debt stock in 2016
Multilateral 24.53
World Bank 0.37
Development Bank of Central African States111.25
Islamic Development Bank 8.73
European Investment Bank 0.16
Arab Bank for Economic Development in Africa 0.72
OPEC Fund for International Development 3.15
International Fund for Agriculture Development 0.14
Bilateral 61.42
Libya 27.36
Kuwait 1.38
India 6.09
Congo1
26.58
Saudi Arabia 0.01
Commercial
Mega International Commercial Bank22.27
Total 88.211 In CFAF2 Commercial bank from Taiwan Province of China.
CHAD
4 INTERNATIONAL MONETARY FUND
Public Domestic Debt
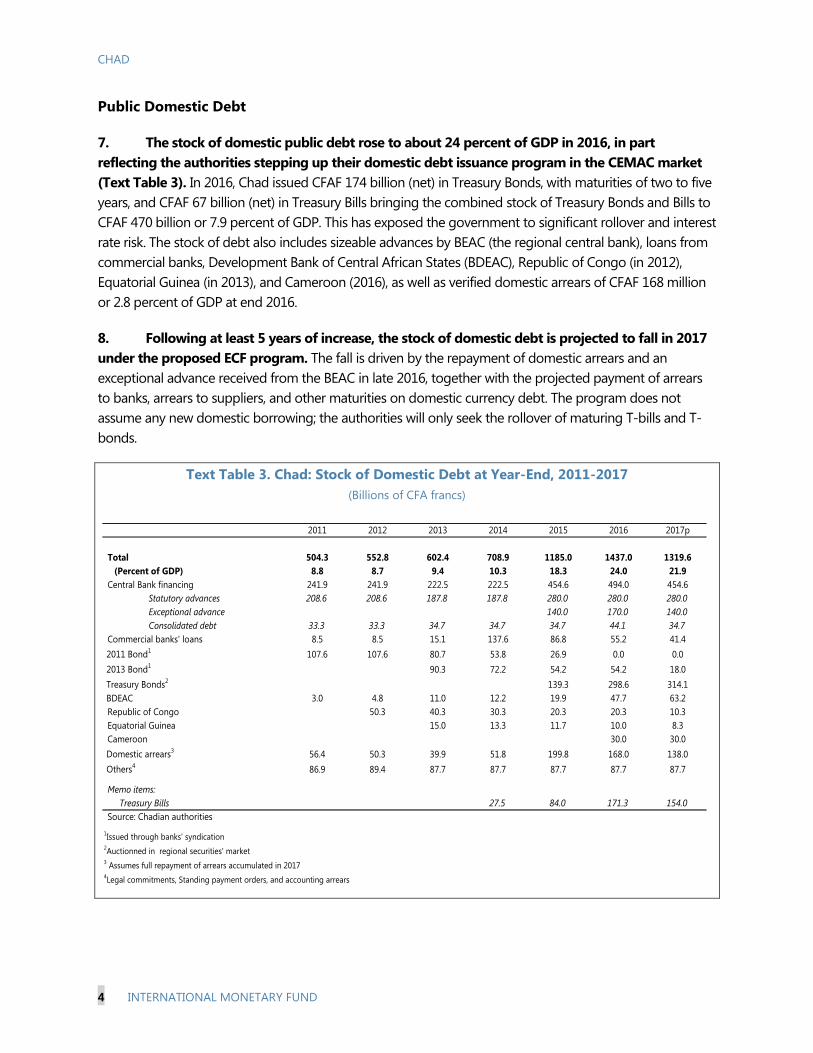
7. The stock of domestic public debt rose to about 24 percent of GDP in 2016, in part
reflecting the authorities stepping up their domestic debt issuance program in the CEMAC market
(Text Table 3). In 2016, Chad issued CFAF 174 billion (net) in Treasury Bonds, with maturities of two to five
years, and CFAF 67 billion (net) in Treasury Bills bringing the combined stock of Treasury Bonds and Bills to
CFAF 470 billion or 7.9 percent of GDP. This has exposed the government to significant rollover and interest
rate risk. The stock of debt also includes sizeable advances by BEAC (the regional central bank), loans from
commercial banks, Development Bank of Central African States (BDEAC), Republic of Congo (in 2012),
Equatorial Guinea (in 2013), and Cameroon (2016), as well as verified domestic arrears of CFAF 168 million
or 2.8 percent of GDP at end 2016.
8. Following at least 5 years of increase, the stock of domestic debt is projected to fall in 2017
under the proposed ECF program. The fall is driven by the repayment of domestic arrears and an
exceptional advance received from the BEAC in late 2016, together with the projected payment of arrears
to banks, arrears to suppliers, and other maturities on domestic currency debt. The program does not
assume any new domestic borrowing; the authorities will only seek the rollover of maturing T-bills and T-
bonds.
Text Table 3. Chad: Stock of Domestic Debt at Year-End, 2011-2017
(Billions of CFA francs)
2011 2012 2013 2014 2015 2016 2017p
Total 504.3 552.8 602.4 708.9 1185.0 1437.0 1319.6
(Percent of GDP) 8.8 8.7 9.4 10.3 18.3 24.0 21.9
Central Bank financing 241.9 241.9 222.5 222.5 454.6 494.0 454.6
Statutory advances 208.6 208.6 187.8 187.8 280.0 280.0 280.0
Exceptional advance 140.0 170.0 140.0
Consolidated debt 33.3 33.3 34.7 34.7 34.7 44.1 34.7
Commercial banks' loans 8.5 8.5 15.1 137.6 86.8 55.2 41.4
2011 Bond1
107.6 107.6 80.7 53.8 26.9 0.0 0.0
2013 Bond1
90.3 72.2 54.2 54.2 18.0
Treasury Bonds2
139.3 298.6 314.1
BDEAC 3.0 4.8 11.0 12.2 19.9 47.7 63.2
Republic of Congo 50.3 40.3 30.3 20.3 20.3 10.3
Equatorial Guinea 15.0 13.3 11.7 10.0 8.3
Cameroon 30.0 30.0
Domestic arrears3
56.4 50.3 39.9 51.8 199.8 168.0 138.0
Others4
86.9 89.4 87.7 87.7 87.7 87.7 87.7
27.5 84.0 171.3 154.0
Source: Chadian authorities
1Issued through banks' syndication
2Auctionned in regional securities' market
3 Assumes full repayment of arrears accumulated in 2017
4Legal commitments, Standing payment orders, and accounting arrears
Memo items:
Treasury Bills
CHAD
INTERNATIONAL MONETARY FUND 5
DSA ASSUMPTIONS
9. The DSA incorporates historical information on external debt until 2016. The historical
information on external debt is based on the World Bank-DRS database and information provided by
Chadian authorities.
10. The DSA’s baseline scenario assumes fiscal adjustment under the proposed ECF program but
does not include debt restructuring. It includes a stable path for oil price, a recovery in oil production,
and policies to stabilize the fiscal position and support a sustainable recovery in non-oil activity. It assumes
clearance of external arrears within the program period, substantial budget support from donors but does
not assume the restructuring of commercial debt, which is necessary to reestablish debt sustainability and
fill the financing gap that emerges under the proposed program.
11. Oil production: Chad’s medium- and long-term macroeconomic outlook is characterized by
gradual increase in oil production over the period 2017–21, but a steady decline over the longer term.
• Oil export is expected to rise from 122,000 bpd in 2016 to about 153,000 bpd in 2021. Proven
reserves in the new fields are much smaller than in the original Doba basin and will also likely be
nearly exhausted around 2030. Hence, oil production and exports are projected to decline
steadily to negligible levels beyond 2030. These prospects might change with new oil
exploration activities or with the use of new oil extraction techniques.2
• Chad’s oil trades below the WEO reference price, reflecting a quality discount and transport cost
of US$ 4-12 per barrel. For the medium term (five-year horizon) the price of a barrel of Chadian
oil is assumed to average about US$50 in 2017–21, in line with the trend projected in the WEO.
From 2021 onward, the price is assumed to increase, on average, by around 2 percent per year
in U.S. dollar terms (Box 1).
12. Fiscal policy: The analysis assumes that the substantial fiscal adjustment of the past two years will
be broadly preserved, with additional adjustment gradually implemented over the medium term through
improvement in non-oil revenue. The non-oil primary deficit (NOPD) is expected to improve from
4.4 percent of non-oil GDP to 2.8 percent in 2021. Oil revenue is projected to increase to 6.4 percent of
non-oil GDP in 2017 from 3.5 percent last year and then moderate over the medium and long term.3 Over
the longer term, in transition to the post-oil era, it is assumed that dwindling oil revenues will be partly
offset by a stabilization of total government primary spending at around 19 percent of GDP, while the
2 Oil production at the Doba oilfield (exploited by the Esso-led consortium) started in 2003, reached its peak of
63 million barrels in 2005 and, absent other oil developments, will decline with annual output projected to become
negligible beyond 2030. In 2011, oil production began at a second oil field, Bongor, operated by CNPC
(about one-third the size of the Doba field). Exports of crude oil from Bongor started in 2014. Oil from another
smaller operator (Caracal, formerly Griffiths) started to be produced in late 2013.
3 In contrast to previous DSAs, oil revenue is presented on gross basis, i.e., without excluding the debt service on oil
sales advances (to Glencore). It only nets out the operation costs associated with the government ownership in the
Doba consortium, and oil transportation cost.
CHAD
6 INTERNATIONAL MONETARY FUND
primary balance will be adjusted gradually to reach a small deficit of less than 2 percent of non-oil GDP by
the end of the projection horizon. The latter is projected to be achieved mainly by: (i) gradually increasing
non-oil revenues (from about 8 percent of non-oil GDP at present to about 14 percent of non-oil GDP
by 2037); ii) maintaining total investment outlays around 8 percent of non-oil GDP in the long term; and
(iii) keeping recurrent spending at relatively low levels by streamlining transfers and subsidies to public
enterprises and improving wage bill management. The analysis also assumes a comprehensive strategy for
clearing domestic arrears and avoiding further accumulation going forward.
13. Arrears. The authorities’ strategy is that arrears to external creditors will be paid within the
program period. Arrears accumulated in 2017 are assumed to be repaid in the next few months. Clearance
of arrears to official external creditors is programmed within the next 12 months. Arrears to other creditors
are programmed to be cleared within the program period. The authorities are making good faith efforts to
reach collaborative agreement with the bank from Taiwan province of China. The baseline scenario also
includes a gradual reduction in the stock of verified domestic arrears. An audit of domestic arrears is
planned to start in 2017 and depending on its outcome, the stock of domestic arrears and the path of
repayment may change.
14. The DSA baseline remains subject to downside risks. Implementation challenges related to
planned government reforms could weigh on growth prospects, particularly in the medium and longer run.
Risks stem from additional domestic debt and arrears that may be off the books but remain to be identified
through increased monitoring efforts, including planned audits in 2017. The SOE portfolio may add fiscal
exposure. There is also uncertainty around future oil prices and the security situation. A further fall in oil
prices would put additional pressure on fiscal accounts and compromise the government’s ability to
finance its planned expenditure and deb. In addition, unexpected security costs and increased expenditure
demands of addressing economic disruptions could divert resources away from priority social and
structural programs as well as institutional capacity-building. At the same time, a negative climatic shock
would affect the prospects for agricultural growth and significantly reduce GDP growth.
CHAD
INTERNATIONAL MONETARY FUND 7
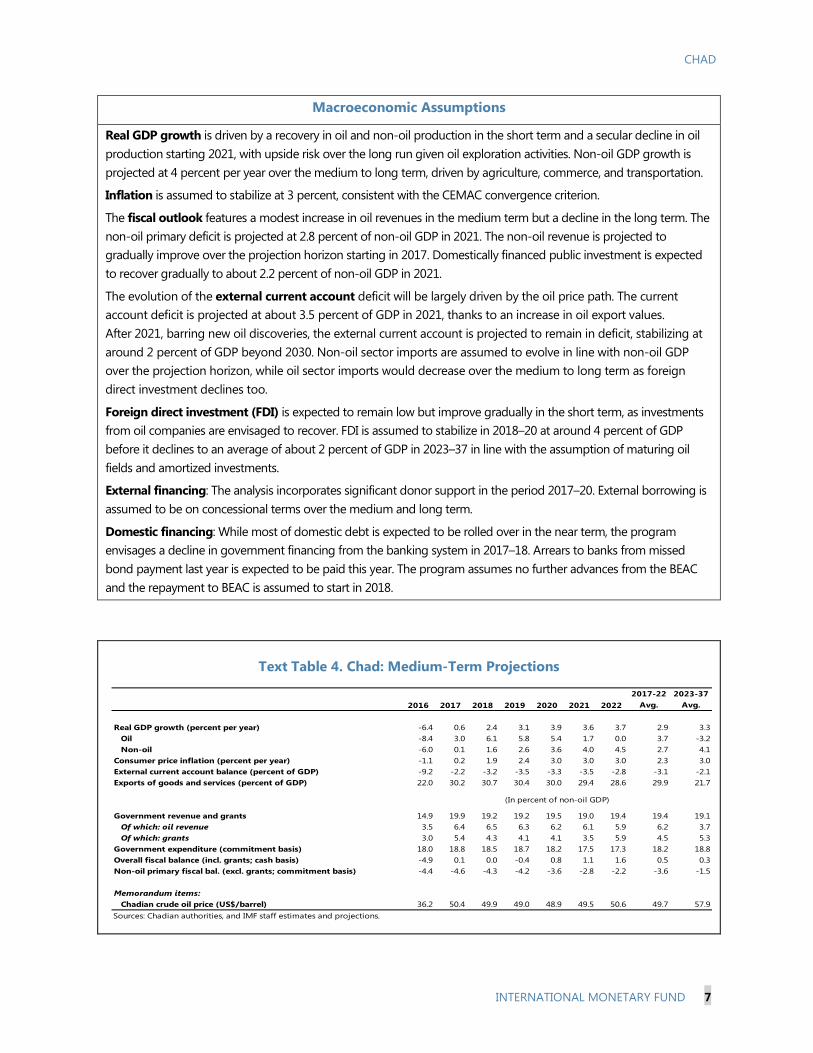
Macroeconomic Assumptions
Real GDP growth is driven by a recovery in oil and non-oil production in the short term and a secular decline in oil
production starting 2021, with upside risk over the long run given oil exploration activities. Non-oil GDP growth is
projected at 4 percent per year over the medium to long term, driven by agriculture, commerce, and transportation.
Inflation is assumed to stabilize at 3 percent, consistent with the CEMAC convergence criterion.
The fiscal outlook features a modest increase in oil revenues in the medium term but a decline in the long term. The
non-oil primary deficit is projected at 2.8 percent of non-oil GDP in 2021. The non-oil revenue is projected to
gradually improve over the projection horizon starting in 2017. Domestically financed public investment is expected
to recover gradually to about 2.2 percent of non-oil GDP in 2021.
The evolution of the external current account deficit will be largely driven by the oil price path. The current
account deficit is projected at about 3.5 percent of GDP in 2021, thanks to an increase in oil export values.
After 2021, barring new oil discoveries, the external current account is projected to remain in deficit, stabilizing at
around 2 percent of GDP beyond 2030. Non-oil sector imports are assumed to evolve in line with non-oil GDP
over the projection horizon, while oil sector imports would decrease over the medium to long term as foreign
direct investment declines too.
Foreign direct investment (FDI) is expected to remain low but improve gradually in the short term, as investments
from oil companies are envisaged to recover. FDI is assumed to stabilize in 2018–20 at around 4 percent of GDP
before it declines to an average of about 2 percent of GDP in 2023–37 in line with the assumption of maturing oil
fields and amortized investments.
External financing: The analysis incorporates significant donor support in the period 2017–20. External borrowing is
assumed to be on concessional terms over the medium and long term.
Domestic financing: While most of domestic debt is expected to be rolled over in the near term, the program
envisages a decline in government financing from the banking system in 2017–18. Arrears to banks from missed
bond payment last year is expected to be paid this year. The program assumes no further advances from the BEAC
and the repayment to BEAC is assumed to start in 2018.
Text Table 4. Chad: Medium-Term Projections
2017-22 2023-37
Avg. Avg.
Real GDP growth (percent per year) -6.4 0.6 2.4 3.1 3.9 3.6 3.7 2.9 3.3
Oil -8.4 3.0 6.1 5.8 5.4 1.7 0.0 3.7 -3.2
Non-oil -6.0 0.1 1.6 2.6 3.6 4.0 4.5 2.7 4.1
Consumer price inflation (percent per year) -1.1 0.2 1.9 2.4 3.0 3.0 3.0 2.3 3.0
External current account balance (percent of GDP) -9.2 -2.2 -3.2 -3.5 -3.3 -3.5 -2.8 -3.1 -2.1
Exports of goods and services (percent of GDP) 22.0 30.2 30.7 30.4 30.0 29.4 28.6 29.9 21.7
Government revenue and grants 14.9 19.9 19.2 19.2 19.5 19.0 19.4 19.4 19.1
Of which: oil revenue 3.5 6.4 6.5 6.3 6.2 6.1 5.9 6.2 3.7
Of which: grants 3.0 5.4 4.3 4.1 4.1 3.5 5.9 4.5 5.3
Government expenditure (commitment basis) 18.0 18.8 18.5 18.7 18.2 17.5 17.3 18.2 18.8
Overall fiscal balance (incl. grants; cash basis) -4.9 0.1 0.0 -0.4 0.8 1.1 1.6 0.5 0.3
Non-oil primary fiscal bal. (excl. grants; commitment basis) -4.4 -4.6 -4.3 -4.2 -3.6 -2.8 -2.2 -3.6 -1.5
Memorandum items:
Chadian crude oil price (US$/barrel) 36.2 50.4 49.9 49.0 48.9 49.5 50.6 49.7 57.9
Sources: Chadian authorities, and IMF staff estimates and projections.
2016 2017 2018 2019 2020 2021 2022
(In percent of non-oil GDP)
CHAD
8 INTERNATIONAL MONETARY FUND
EXTERNAL DSA
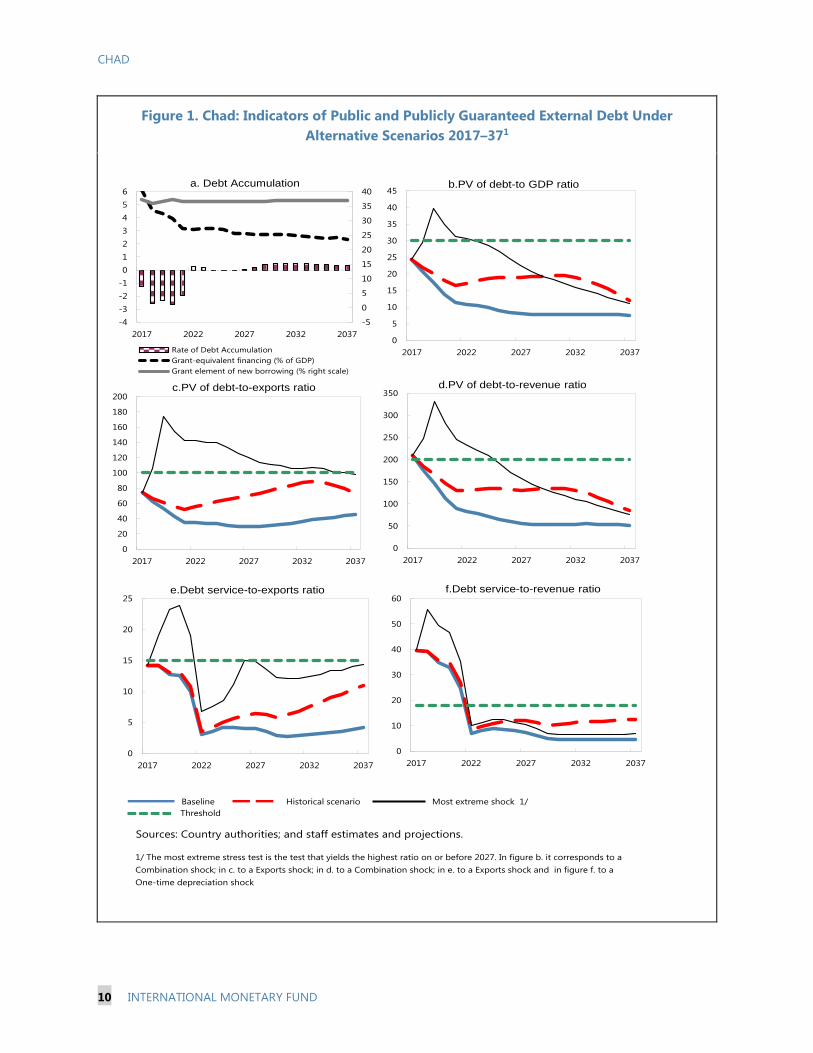
15. The evolution of external debt is driven by the government’s borrowing strategy which
envisages a reasonable volume of project and budget support loans and no further usage of
commercial loans. Under the ECF-supported program, external financing is assumed to be on
concessional terms over the medium to long term mostly financed by disbursements from multilaterals
such as the IMF, WB, AfDB, Islamic Development Bank, and Arab Bank for Economic Development in Africa,
and from other development partners. This leads to a grant element of an average of 36.7 percent over the
projection period (Figure 1).
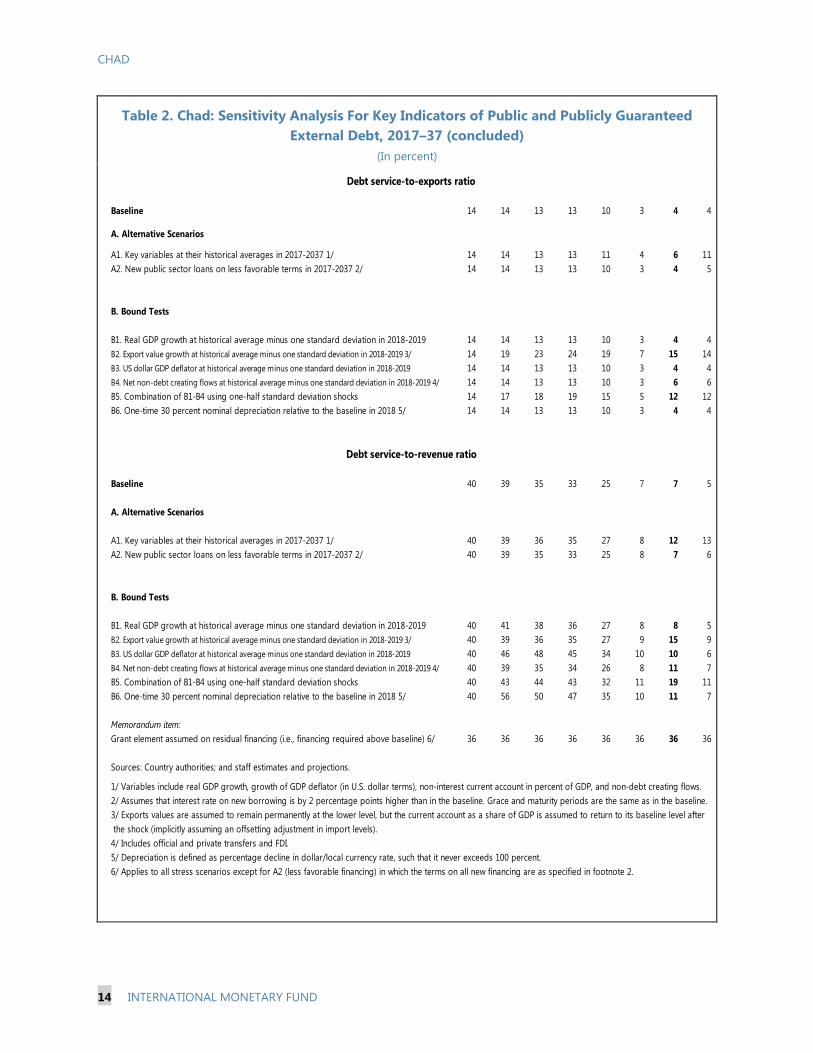
16. Without debt restructuring, debt is unsustainable as reflected in particular by the large
breach of the debt service to revenue threshold over the next four years (Figure 1, Table 1). Without
debt restructuring, debt service is projected to be about 40 percent of revenue in 2017–18 and average
above 30 percent per year during 2019–21.4 Burdened by a high debt service and weak budgetary
resources, the country accumulated significant domestic and external payment arrears in 2016 despite
significant fiscal contraction. The country would not be able to continue to sustain such a high burden of
debt service, which would lead to further fiscal contraction and a likely disorderly adjustment with severely
adverse social and economic consequences.
Stress Tests
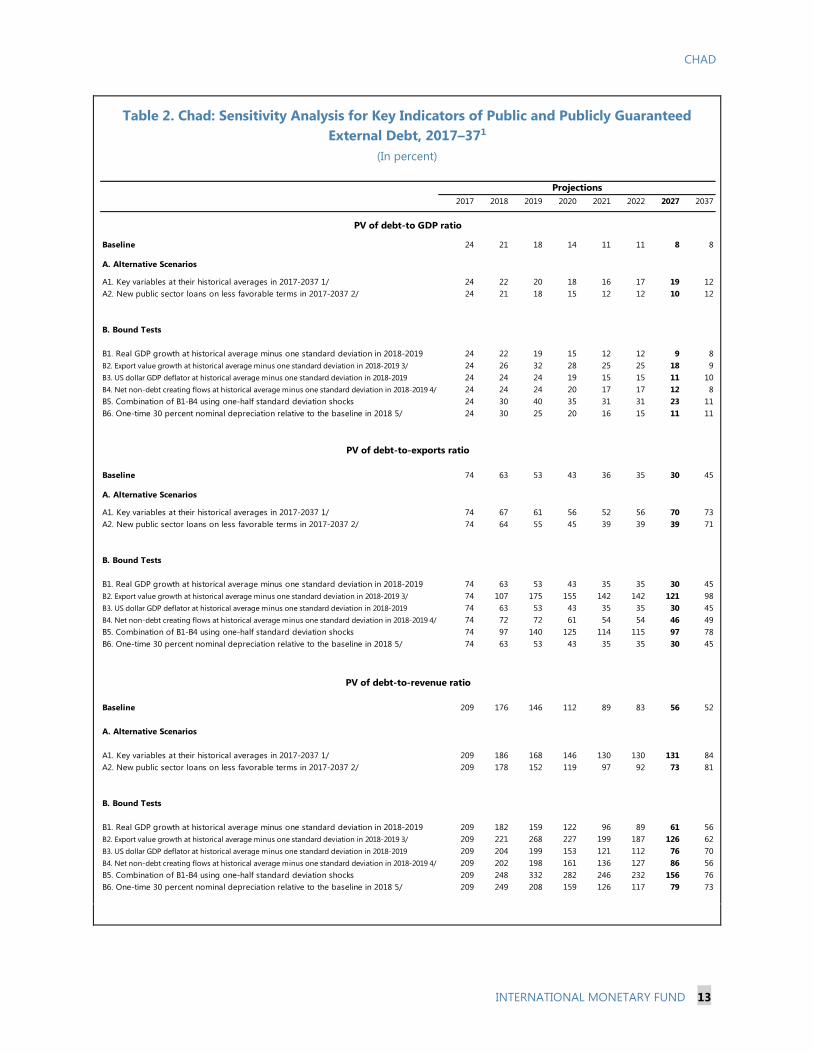
17. Stress tests highlight the susceptibility of Chad’s external debt to shocks, especially in the
next few years (Table 2, Figure 1). As in the baseline scenario, if the main economic variables remain at
their historical averages, two of the indicators breach their indicative thresholds, one of which is a minor
breach of the debt-to-revenue ratio in 2017. Bounds tests reveal that Chad is most vulnerable to an adverse
shock to exports (although this is unlikely given that the oil price shock has happened in the past two
years), and a scenario that combines different types of macroeconomic shocks. A one-time depreciation
shock (30 percent nominal depreciation in 2017) generates further vulnerability in the debt service-to-
revenue indicator. These shocks have the potential to raise the debt burden indicators significantly above
their thresholds, especially over the short and medium term. The PV of debt-to-exports ratio is particularly
sensitive to a poor export performance, showing a protracted breach under this stress test.
PUBLIC DSA
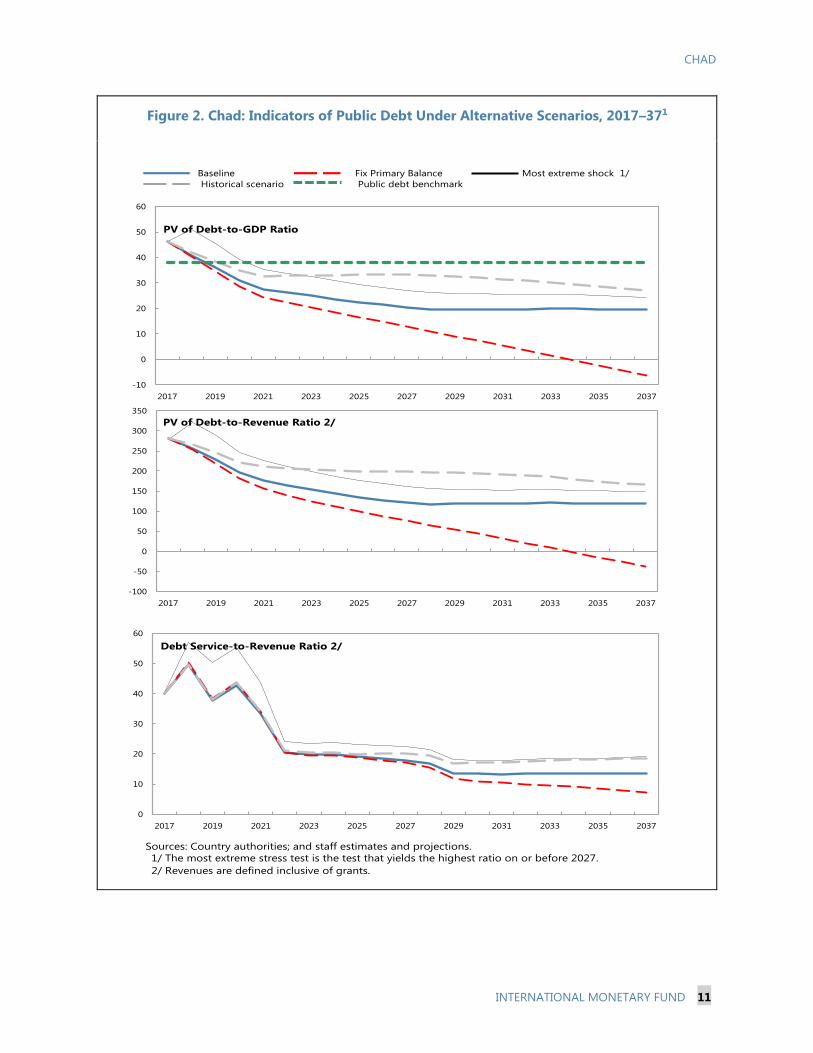
18. Domestic debt has increased in recent years, but is projected to decline (Table 3 and Figure 2).
With the accumulation of domestic arrears and the increased issuances of debt securities in the regional
market, the PV of debt-to-GDP ratio shows a breach in 2017–20 under the baseline scenario. Under the
requested ECF arrangement, with prudent fiscal policies, the domestic debt component would fall from
22 percent of GDP in 2017 to 17 percent of GDP in 2020. Beyond 2020, domestic debt to GDP continues to
4 The residuals in Table 1 are associated with the significant debt relief in 2015; and a substantial loss in international reserves
in 2015 and 2016. The existence of historical and projected residuals can also be explained by shortcomings in quality affecting
balance of payments data.
CHAD
INTERNATIONAL MONETARY FUND 9
decline steadily until it reaches about 12.6 percent of GDP in 2037. Altogether, the public debt stock would
decrease from about 50 percent of GDP in 2017 to 30 percent of GDP in 2022 until it stabilizes around an
average of 23 percent of GDP in 2023–37.
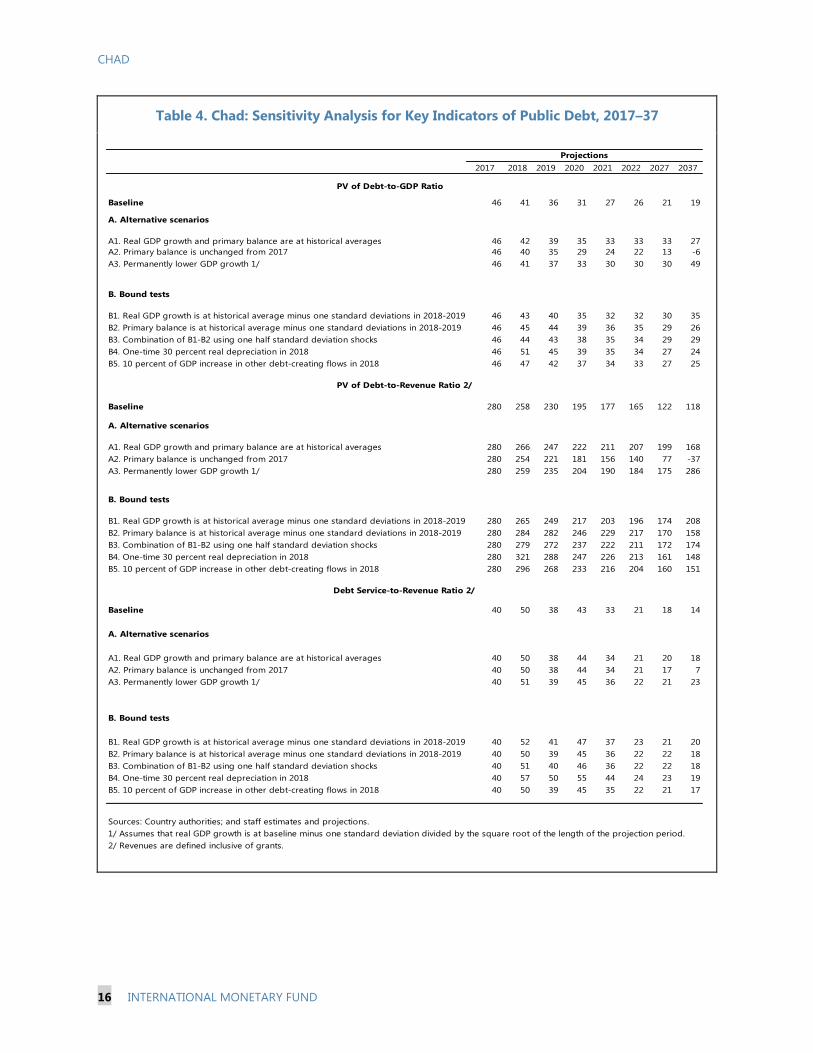
19. Standard stress tests indicate sustainability risks in the next few years. In particular, a real
depreciation shock in 2016 could impair public debt sustainability in the short to medium term (Most
Extreme Shock in Figure 2 and Bound Tests in Table 4).
CONCLUSION
20. Chad is in debt distress and debt is unsustainable without external commercial debt
restructuring. The burden of external commercial debt service is taking a heavy toll on government
finances. The government has accumulated significant domestic and external arrears despite significant
fiscal adjustments. Without commercial debt restructuring, debt service to revenue ratio breaches the
indicative threshold for the next four years by a significant margin. However, with the rescheduling of debt
in line with parameters of the newly requested ECF arrangement, and the projected recovery in the oil and
non-oil sector, debt ratios can decline significantly over the near and medium term, significantly reducing
the risk of debt distress. With the appointment of financial and legal advisors, discussions with the creditor
are set to begin soon. Given the exhaustible and volatile oil revenues, it is also necessary to strengthen
fiscal and debt management, maintain a prudent external and domestic borrowing policy, and make
further progress in diversifying the economy. Effective inter-agency coordination will be important for
strengthening the capacity to record and monitor public debt.
21. The authorities broadly concur with the staff assessment. They agreed that the burden of debt
service, particularly of the external commercial loan, was weighing heavily on the budgetary resources and
on debt sustainability. They agreed that a debt restructuring is necessary to make debt sustainable. They
have announced their intention to restructure the debt with Glencore and are firmly committed to achieve
a restructuring that restore debt sustainability and is in line with the proposed program parameters. They
are committed to a prudent borrowing policy, including seeking external loans on concessional terms in
line with program assumptions. They have taken steps to improve debt management practices, including
by improving interagency coordination and through technical assistance to improve their cash flow and
debt management databases. They have started issuing annual debt management reports (with support
from Fund TA), and will undertake institutional improvements in the management of domestic payment
arrears in line with Fund TA recommendations. In addition, they also recognize the importance of
diversifying their economy, and are finalizing a National Development Plan that strives to do so.
CHAD
10 INTERNATIONAL MONETARY FUND
Figure 1. Chad: Indicators of Public and Publicly Guaranteed External Debt Under
Alternative Scenarios 2017–371
Sources: Country authorities; and staff estimates and projections.
Figure 1. Chad: Indicators of Public and Publicly Guaranteed External Debt under
Alternative Scenarios 2017 - 371/
1/ The most extreme stress test is the test that yields the highest ratio on or before 2027. In figure b. it corresponds to a
Combination shock; in c. to a Exports shock; in d. to a Combination shock; in e. to a Exports shock and in figure f. to a
One-time depreciation shock
Baseline Historical scenario Most extreme shock 1/
Threshold
0
10
20
30
40
50
60
2017 2022 2027 2032 2037
f.Debt service-to-revenue ratio
-5
0
5
10
15
20
25
30
35
40
-4
-3
-2
-1
0
1
2
3
4
5
6
2017 2022 2027 2032 2037
Rate of Debt Accumulation
Grant-equivalent financing (% of GDP)
Grant element of new borrowing (% right scale)
a. Debt Accumulation
0
20
40
60
80
100
120
140
160
180
200
2017 2022 2027 2032 2037
c.PV of debt-to-exports ratio
0
5
10
15
20
25
30
35
40
45
2017 2022 2027 2032 2037
b.PV of debt-to GDP ratio
0
50
100
150
200
250
300
350
2017 2022 2027 2032 2037
d.PV of debt-to-revenue ratio
0
5
10
15
20
25
2017 2022 2027 2032 2037
e.Debt service-to-exports ratio
CHAD
INTERNATIONAL MONETARY FUND 11
Figure 2. Chad: Indicators of Public Debt Under Alternative Scenarios, 2017–371
Most extreme shock One-time depreciation
Sources: Country authorities; and staff estimates and projections.
1/ The most extreme stress test is the test that yields the highest ratio on or before 2027.
2/ Revenues are defined inclusive of grants.
Figure 2. Chad: Indicators of Public Debt Under Alternative Scenarios, 2017-2037 1/
Baseline
Public debt benchmark
Most extreme shock 1/
Historical scenario
Fix Primary Balance
-100
-50
0
50
100
150
200
250
300
350
2017 2019 2021 2023 2025 2027 2029 2031 2033 2035 2037
PV of Debt-to-Revenue Ratio 2/
-10
0
10
20
30
40
50
60
2017 2019 2021 2023 2025 2027 2029 2031 2033 2035 2037
PV of Debt-to-GDP Ratio
0
10
20
30
40
50
60
2017 2019 2021 2023 2025 2027 2029 2031 2033 2035 2037
Debt Service-to-Revenue Ratio 2/
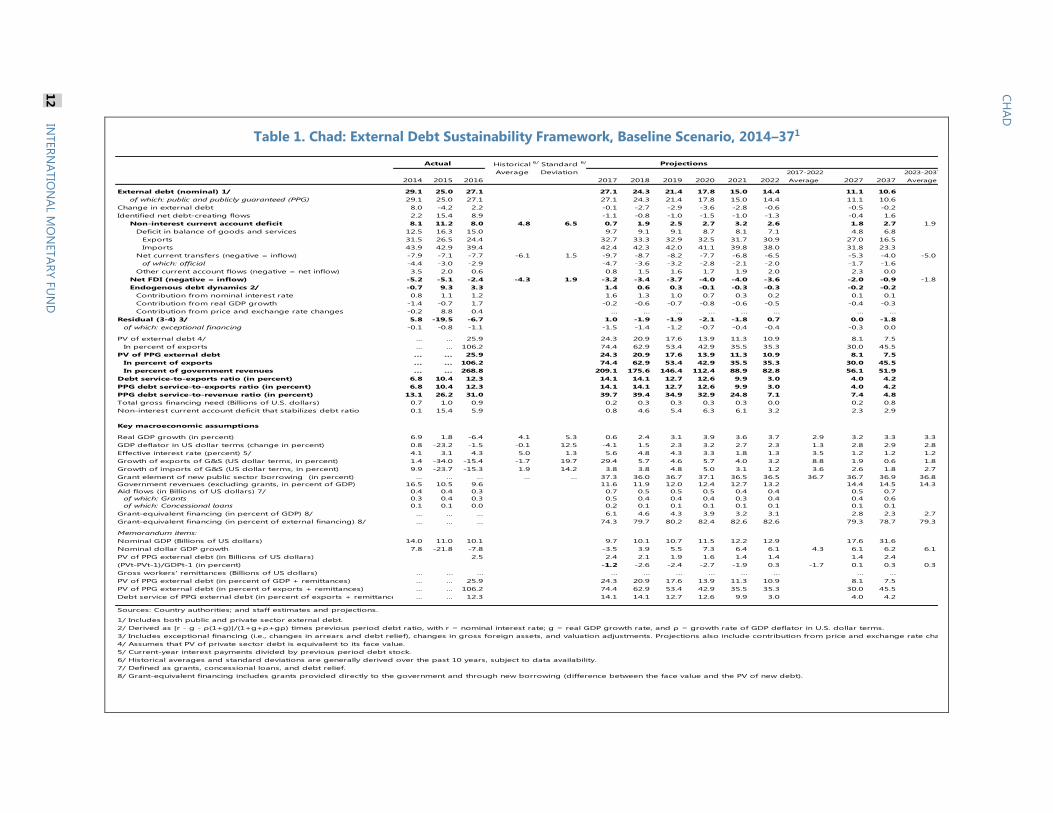
Table 1. Chad: External Debt Sustainability Framework, Baseline Scenario, 2014–371
Historical 6/ Standard 6/
Average Deviation 2017-2022 2023-2037
2014 2015 2016 2017 2018 2019 2020 2021 2022 Average 2027 2037 Average
External debt (nominal) 1/ 29.1 25.0 27.1 27.1 24.3 21.4 17.8 15.0 14.4 11.1 10.6
of which: public and publicly guaranteed (PPG) 29.1 25.0 27.1 27.1 24.3 21.4 17.8 15.0 14.4 11.1 10.6
Change in external debt 8.0 -4.2 2.2 -0.1 -2.7 -2.9 -3.6 -2.8 -0.6 -0.5 -0.2
Identified net debt-creating flows 2.2 15.4 8.9 -1.1 -0.8 -1.0 -1.5 -1.0 -1.3 -0.4 1.6
Non-interest current account deficit 8.1 11.2 8.0 4.8 6.5 0.7 1.9 2.5 2.7 3.2 2.6 1.8 2.7 1.9
Deficit in balance of goods and services 12.5 16.3 15.0 9.7 9.1 9.1 8.7 8.1 7.1 4.8 6.8
Exports 31.5 26.5 24.4 32.7 33.3 32.9 32.5 31.7 30.9 27.0 16.5
Imports 43.9 42.9 39.4 42.4 42.3 42.0 41.1 39.8 38.0 31.8 23.3
Net current transfers (negative = inflow) -7.9 -7.1 -7.7 -6.1 1.5 -9.7 -8.7 -8.2 -7.7 -6.8 -6.5 -5.3 -4.0 -5.0
of which: official -4.4 -3.0 -2.9 -4.7 -3.6 -3.2 -2.8 -2.1 -2.0 -1.7 -1.6
Other current account flows (negative = net inflow) 3.5 2.0 0.6 0.8 1.5 1.6 1.7 1.9 2.0 2.3 0.0
Net FDI (negative = inflow) -5.2 -5.1 -2.4 -4.3 1.9 -3.2 -3.4 -3.7 -4.0 -4.0 -3.6 -2.0 -0.9 -1.8
Endogenous debt dynamics 2/ -0.7 9.3 3.3 1.4 0.6 0.3 -0.1 -0.3 -0.3 -0.2 -0.2
Contribution from nominal interest rate 0.8 1.1 1.2 1.6 1.3 1.0 0.7 0.3 0.2 0.1 0.1
Contribution from real GDP growth -1.4 -0.7 1.7 -0.2 -0.6 -0.7 -0.8 -0.6 -0.5 -0.4 -0.3
Contribution from price and exchange rate changes -0.2 8.8 0.4 … … … … … … … …
Residual (3-4) 3/ 5.8 -19.5 -6.7 1.0 -1.9 -1.9 -2.1 -1.8 0.7 0.0 -1.8
of which: exceptional financing -0.1 -0.8 -1.1 -1.5 -1.4 -1.2 -0.7 -0.4 -0.4 -0.3 0.0
PV of external debt 4/ ... ... 25.9 24.3 20.9 17.6 13.9 11.3 10.9 8.1 7.5
In percent of exports ... ... 106.2 74.4 62.9 53.4 42.9 35.5 35.3 30.0 45.5
PV of PPG external debt ... ... 25.9 24.3 20.9 17.6 13.9 11.3 10.9 8.1 7.5
In percent of exports ... ... 106.2 74.4 62.9 53.4 42.9 35.5 35.3 30.0 45.5
In percent of government revenues ... ... 268.8 209.1 175.6 146.4 112.4 88.9 82.8 56.1 51.9
Debt service-to-exports ratio (in percent) 6.8 10.4 12.3 14.1 14.1 12.7 12.6 9.9 3.0 4.0 4.2
PPG debt service-to-exports ratio (in percent) 6.8 10.4 12.3 14.1 14.1 12.7 12.6 9.9 3.0 4.0 4.2
PPG debt service-to-revenue ratio (in percent) 13.1 26.2 31.0 39.7 39.4 34.9 32.9 24.8 7.1 7.4 4.8
Total gross financing need (Billions of U.S. dollars) 0.7 1.0 0.9 0.2 0.3 0.3 0.3 0.3 0.0 0.2 0.8
Non-interest current account deficit that stabilizes debt ratio 0.1 15.4 5.9 0.8 4.6 5.4 6.3 6.1 3.2 2.3 2.9
Key macroeconomic assumptions
Real GDP growth (in percent) 6.9 1.8 -6.4 4.1 5.3 0.6 2.4 3.1 3.9 3.6 3.7 2.9 3.2 3.3 3.3
GDP deflator in US dollar terms (change in percent) 0.8 -23.2 -1.5 -0.1 12.5 -4.1 1.5 2.3 3.2 2.7 2.3 1.3 2.8 2.9 2.8
Effective interest rate (percent) 5/ 4.1 3.1 4.3 5.0 1.3 5.6 4.8 4.3 3.3 1.8 1.3 3.5 1.2 1.2 1.2
Growth of exports of G&S (US dollar terms, in percent) 1.4 -34.0 -15.4 -1.7 19.7 29.4 5.7 4.6 5.7 4.0 3.2 8.8 1.9 0.6 1.8
Growth of imports of G&S (US dollar terms, in percent) 9.9 -23.7 -15.3 1.9 14.2 3.8 3.8 4.8 5.0 3.1 1.2 3.6 2.6 1.8 2.7
Grant element of new public sector borrowing (in percent) ... ... ... ... ... 37.3 36.0 36.7 37.1 36.5 36.5 36.7 36.7 36.9 36.8
Government revenues (excluding grants, in percent of GDP) 16.5 10.5 9.6 11.6 11.9 12.0 12.4 12.7 13.2 14.4 14.5 14.3
Aid flows (in Billions of US dollars) 7/ 0.4 0.4 0.3 0.7 0.5 0.5 0.5 0.4 0.4 0.5 0.7
of which: Grants 0.3 0.4 0.3 0.5 0.4 0.4 0.4 0.3 0.4 0.4 0.6
of which: Concessional loans 0.1 0.1 0.0 0.2 0.1 0.1 0.1 0.1 0.1 0.1 0.1
Grant-equivalent financing (in percent of GDP) 8/ ... ... ... 6.1 4.6 4.3 3.9 3.2 3.1 2.8 2.3 2.7
Grant-equivalent financing (in percent of external financing) 8/ ... ... ... 74.3 79.7 80.2 82.4 82.6 82.6 79.3 78.7 79.3
Memorandum items:
Nominal GDP (Billions of US dollars) 14.0 11.0 10.1 9.7 10.1 10.7 11.5 12.2 12.9 17.6 31.6
Nominal dollar GDP growth 7.8 -21.8 -7.8 -3.5 3.9 5.5 7.3 6.4 6.1 4.3 6.1 6.2 6.1
PV of PPG external debt (in Billions of US dollars) 2.5 2.4 2.1 1.9 1.6 1.4 1.4 1.4 2.4
(PVt-PVt-1)/GDPt-1 (in percent) -1.2 -2.6 -2.4 -2.7 -1.9 0.3 -1.7 0.1 0.3 0.3
Gross workers' remittances (Billions of US dollars) … … … … … … … … … … …
PV of PPG external debt (in percent of GDP + remittances) ... ... 25.9 24.3 20.9 17.6 13.9 11.3 10.9 8.1 7.5
PV of PPG external debt (in percent of exports + remittances) ... ... 106.2 74.4 62.9 53.4 42.9 35.5 35.3 30.0 45.5
Debt service of PPG external debt (in percent of exports + remittances) ... ... 12.3 14.1 14.1 12.7 12.6 9.9 3.0 4.0 4.2
Sources: Country authorities; and staff estimates and projections. 0
1/ Includes both public and private sector external debt.
2/ Derived as [r - g - ρ(1+g)]/(1+g+ρ+gρ) times previous period debt ratio, with r = nominal interest rate; g = real GDP growth rate, and ρ = growth rate of GDP deflator in U.S. dollar terms.
3/ Includes exceptional financing (i.e., changes in arrears and debt relief), changes in gross foreign assets, and valuation adjustments. Projections also include contribution from price and exchange rate changes.
4/ Assumes that PV of private sector debt is equivalent to its face value.
5/ Current-year interest payments divided by previous period debt stock.
6/ Historical averages and standard deviations are generally derived over the past 10 years, subject to data availability.
7/ Defined as grants, concessional loans, and debt relief.
8/ Grant-equivalent financing includes grants provided directly to the government and through new borrowing (difference between the face value and the PV of new debt).
Actual
Table 1. Chad: External Debt Sustainability Framework, Baseline Scenario, 2014-2037 1/
(In percent of GDP, unless otherwise indicated)
Projections
12
IN
TER
NA
TIO
NA
L MO
NETA
RY F
UN
D
CH
AD
CHAD
INTERNATIONAL MONETARY FUND 13
Table 2. Chad: Sensitivity Analysis for Key Indicators of Public and Publicly Guaranteed
External Debt, 2017–371
(In percent)
2017 2018 2019 2020 2021 2022 2027 2037
Baseline 24 21 18 14 11 11 8 8
A. Alternative Scenarios
A1. Key variables at their historical averages in 2017-2037 1/ 24 22 20 18 16 17 19 12
A2. New public sector loans on less favorable terms in 2017-2037 2/ 24 21 18 15 12 12 10 12
B. Bound Tests
B1. Real GDP growth at historical average minus one standard deviation in 2018-2019 24 22 19 15 12 12 9 8
B2. Export value growth at historical average minus one standard deviation in 2018-2019 3/ 24 26 32 28 25 25 18 9
B3. US dollar GDP deflator at historical average minus one standard deviation in 2018-2019 24 24 24 19 15 15 11 10
B4. Net non-debt creating flows at historical average minus one standard deviation in 2018-2019 4/ 24 24 24 20 17 17 12 8
B5. Combination of B1-B4 using one-half standard deviation shocks 24 30 40 35 31 31 23 11
B6. One-time 30 percent nominal depreciation relative to the baseline in 2018 5/ 24 30 25 20 16 15 11 11
Baseline 74 63 53 43 36 35 30 45
A. Alternative Scenarios
A1. Key variables at their historical averages in 2017-2037 1/ 74 67 61 56 52 56 70 73
A2. New public sector loans on less favorable terms in 2017-2037 2/ 74 64 55 45 39 39 39 71
B. Bound Tests
B1. Real GDP growth at historical average minus one standard deviation in 2018-2019 74 63 53 43 35 35 30 45
B2. Export value growth at historical average minus one standard deviation in 2018-2019 3/ 74 107 175 155 142 142 121 98
B3. US dollar GDP deflator at historical average minus one standard deviation in 2018-2019 74 63 53 43 35 35 30 45
B4. Net non-debt creating flows at historical average minus one standard deviation in 2018-2019 4/ 74 72 72 61 54 54 46 49
B5. Combination of B1-B4 using one-half standard deviation shocks 74 97 140 125 114 115 97 78
B6. One-time 30 percent nominal depreciation relative to the baseline in 2018 5/ 74 63 53 43 35 35 30 45
Baseline 209 176 146 112 89 83 56 52
A. Alternative Scenarios
A1. Key variables at their historical averages in 2017-2037 1/ 209 186 168 146 130 130 131 84
A2. New public sector loans on less favorable terms in 2017-2037 2/ 209 178 152 119 97 92 73 81
B. Bound Tests
B1. Real GDP growth at historical average minus one standard deviation in 2018-2019 209 182 159 122 96 89 61 56
B2. Export value growth at historical average minus one standard deviation in 2018-2019 3/ 209 221 268 227 199 187 126 62
B3. US dollar GDP deflator at historical average minus one standard deviation in 2018-2019 209 204 199 153 121 112 76 70
B4. Net non-debt creating flows at historical average minus one standard deviation in 2018-2019 4/ 209 202 198 161 136 127 86 56
B5. Combination of B1-B4 using one-half standard deviation shocks 209 248 332 282 246 232 156 76
B6. One-time 30 percent nominal depreciation relative to the baseline in 2018 5/ 209 249 208 159 126 117 79 73
PV of debt-to-exports ratio
PV of debt-to-revenue ratio
Table 2. Chad: Sensitivity Analysis for Key Indicators of Public and Publicly Guaranteed External Debt, 2017-2037
(In percent)
PV of debt-to GDP ratio
Projections
CHAD
14 INTERNATIONAL MONETARY FUND
Table 2. Chad: Sensitivity Analysis For Key Indicators of Public and Publicly Guaranteed
External Debt, 2017–37 (concluded)
(In percent)
Baseline 14 14 13 13 10 3 4 4
A. Alternative Scenarios
A1. Key variables at their historical averages in 2017-2037 1/ 14 14 13 13 11 4 6 11
A2. New public sector loans on less favorable terms in 2017-2037 2/ 14 14 13 13 10 3 4 5
B. Bound Tests
B1. Real GDP growth at historical average minus one standard deviation in 2018-2019 14 14 13 13 10 3 4 4
B2. Export value growth at historical average minus one standard deviation in 2018-2019 3/ 14 19 23 24 19 7 15 14
B3. US dollar GDP deflator at historical average minus one standard deviation in 2018-2019 14 14 13 13 10 3 4 4
B4. Net non-debt creating flows at historical average minus one standard deviation in 2018-2019 4/ 14 14 13 13 10 3 6 6
B5. Combination of B1-B4 using one-half standard deviation shocks 14 17 18 19 15 5 12 12
B6. One-time 30 percent nominal depreciation relative to the baseline in 2018 5/ 14 14 13 13 10 3 4 4
Baseline 40 39 35 33 25 7 7 5
A. Alternative Scenarios
A1. Key variables at their historical averages in 2017-2037 1/ 40 39 36 35 27 8 12 13
A2. New public sector loans on less favorable terms in 2017-2037 2/ 40 39 35 33 25 8 7 6
B. Bound Tests
B1. Real GDP growth at historical average minus one standard deviation in 2018-2019 40 41 38 36 27 8 8 5
B2. Export value growth at historical average minus one standard deviation in 2018-2019 3/ 40 39 36 35 27 9 15 9
B3. US dollar GDP deflator at historical average minus one standard deviation in 2018-2019 40 46 48 45 34 10 10 6
B4. Net non-debt creating flows at historical average minus one standard deviation in 2018-2019 4/ 40 39 35 34 26 8 11 7
B5. Combination of B1-B4 using one-half standard deviation shocks 40 43 44 43 32 11 19 11
B6. One-time 30 percent nominal depreciation relative to the baseline in 2018 5/ 40 56 50 47 35 10 11 7
Memorandum item:
Grant element assumed on residual financing (i.e., financing required above baseline) 6/ 36 36 36 36 36 36 36 36
Sources: Country authorities; and staff estimates and projections.
1/ Variables include real GDP growth, growth of GDP deflator (in U.S. dollar terms), non-interest current account in percent of GDP, and non-debt creating flows.
2/ Assumes that interest rate on new borrowing is by 2 percentage points higher than in the baseline. Grace and maturity periods are the same as in the baseline.
3/ Exports values are assumed to remain permanently at the lower level, but the current account as a share of GDP is assumed to return to its baseline level after
the shock (implicitly assuming an offsetting adjustment in import levels).
4/ Includes official and private transfers and FDI.
5/ Depreciation is defined as percentage decline in dollar/local currency rate, such that it never exceeds 100 percent.
6/ Applies to all stress scenarios except for A2 (less favorable financing) in which the terms on all new financing are as specified in footnote 2.
Debt service-to-exports ratio
Table2. Chad: Sensitivity Analysis for Key Indicators of Public and Publicly Guaranteed External Debt, 2017-2037 (continued)
(In percent)
Debt service-to-revenue ratio
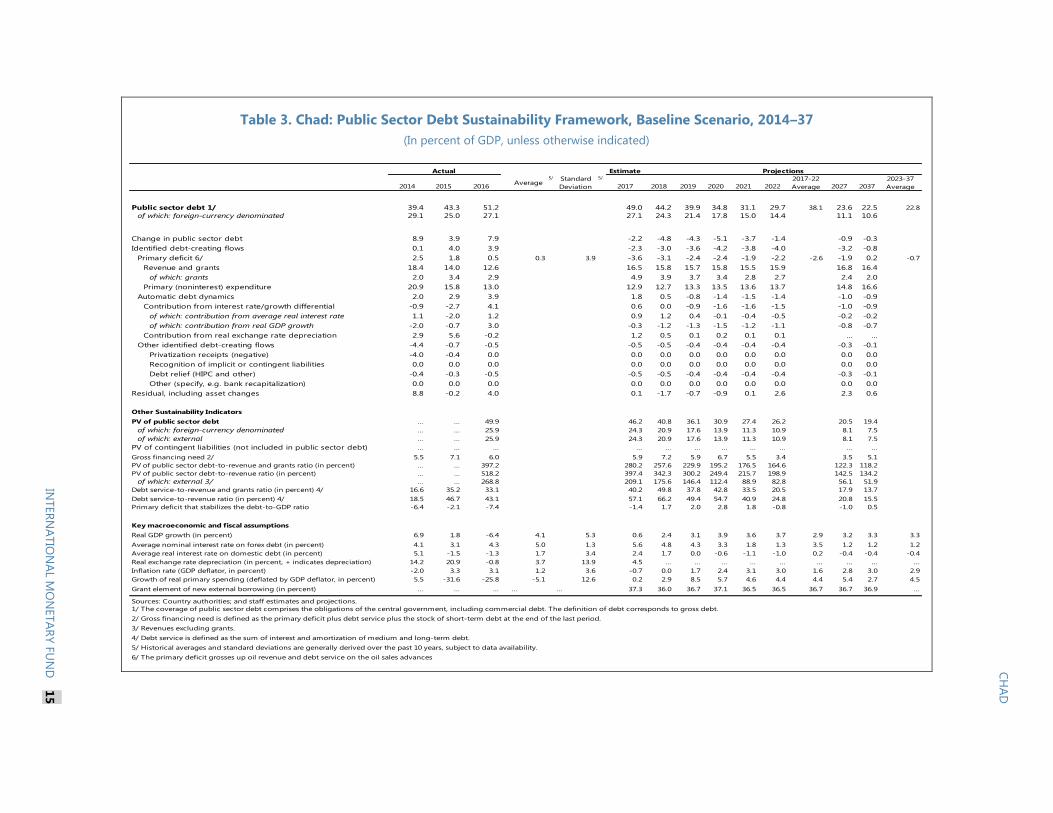
Table 3. Chad: Public Sector Debt Sustainability Framework, Baseline Scenario, 2014–37
(In percent of GDP, unless otherwise indicated)
Estimate
2014 2015 2016Average
5/ Standard
Deviation
5/
2017 2018 2019 2020 2021 2022
2017-22
Average 2027 2037
2023-37
Average
Public sector debt 1/ 39.4 43.3 51.2 49.0 44.2 39.9 34.8 31.1 29.7 38.1 23.6 22.5 22.8
of which: foreign-currency denominated 29.1 25.0 27.1 27.1 24.3 21.4 17.8 15.0 14.4 11.1 10.6
Change in public sector debt 8.9 3.9 7.9 -2.2 -4.8 -4.3 -5.1 -3.7 -1.4 -0.9 -0.3
Identified debt-creating flows 0.1 4.0 3.9 -2.3 -3.0 -3.6 -4.2 -3.8 -4.0 -3.2 -0.8
Primary deficit 6/ 2.5 1.8 0.5 0.3 3.9 -3.6 -3.1 -2.4 -2.4 -1.9 -2.2 -2.6 -1.9 0.2 -0.7
Revenue and grants 18.4 14.0 12.6 16.5 15.8 15.7 15.8 15.5 15.9 16.8 16.4
of which: grants 2.0 3.4 2.9 4.9 3.9 3.7 3.4 2.8 2.7 2.4 2.0
Primary (noninterest) expenditure 20.9 15.8 13.0 12.9 12.7 13.3 13.5 13.6 13.7 14.8 16.6
Automatic debt dynamics 2.0 2.9 3.9 1.8 0.5 -0.8 -1.4 -1.5 -1.4 -1.0 -0.9
Contribution from interest rate/growth differential -0.9 -2.7 4.1 0.6 0.0 -0.9 -1.6 -1.6 -1.5 -1.0 -0.9
of which: contribution from average real interest rate 1.1 -2.0 1.2 0.9 1.2 0.4 -0.1 -0.4 -0.5 -0.2 -0.2
of which: contribution from real GDP growth -2.0 -0.7 3.0 -0.3 -1.2 -1.3 -1.5 -1.2 -1.1 -0.8 -0.7
Contribution from real exchange rate depreciation 2.9 5.6 -0.2 1.2 0.5 0.1 0.2 0.1 0.1 ... ...
Other identified debt-creating flows -4.4 -0.7 -0.5 -0.5 -0.5 -0.4 -0.4 -0.4 -0.4 -0.3 -0.1
Privatization receipts (negative) -4.0 -0.4 0.0 0.0 0.0 0.0 0.0 0.0 0.0 0.0 0.0
Recognition of implicit or contingent liabilities 0.0 0.0 0.0 0.0 0.0 0.0 0.0 0.0 0.0 0.0 0.0
Debt relief (HIPC and other) -0.4 -0.3 -0.5 -0.5 -0.5 -0.4 -0.4 -0.4 -0.4 -0.3 -0.1
Other (specify, e.g. bank recapitalization) 0.0 0.0 0.0 0.0 0.0 0.0 0.0 0.0 0.0 0.0 0.0
Residual, including asset changes 8.8 -0.2 4.0 0.1 -1.7 -0.7 -0.9 0.1 2.6 2.3 0.6
Other Sustainability Indicators
PV of public sector debt ... ... 49.9 46.2 40.8 36.1 30.9 27.4 26.2 20.5 19.4
of which: foreign-currency denominated ... ... 25.9 24.3 20.9 17.6 13.9 11.3 10.9 8.1 7.5
of which: external ... ... 25.9 24.3 20.9 17.6 13.9 11.3 10.9 8.1 7.5
PV of contingent liabilities (not included in public sector debt) ... ... ... ... ... ... ... ... ... ... ...
Gross financing need 2/ 5.5 7.1 6.0 5.9 7.2 5.9 6.7 5.5 3.4 3.5 5.1
PV of public sector debt-to-revenue and grants ratio (in percent) … … 397.2 280.2 257.6 229.9 195.2 176.5 164.6 122.3 118.2
PV of public sector debt-to-revenue ratio (in percent) … … 518.2 397.4 342.3 300.2 249.4 215.7 198.9 142.5 134.2
of which: external 3/ … … 268.8 209.1 175.6 146.4 112.4 88.9 82.8 56.1 51.9
Debt service-to-revenue and grants ratio (in percent) 4/ 16.6 35.2 33.1 40.2 49.8 37.8 42.8 33.5 20.5 17.9 13.7
Debt service-to-revenue ratio (in percent) 4/ 18.5 46.7 43.1 57.1 66.2 49.4 54.7 40.9 24.8 20.8 15.5
Primary deficit that stabilizes the debt-to-GDP ratio -6.4 -2.1 -7.4 -1.4 1.7 2.0 2.8 1.8 -0.8 -1.0 0.5
Key macroeconomic and fiscal assumptions
Real GDP growth (in percent) 6.9 1.8 -6.4 4.1 5.3 0.6 2.4 3.1 3.9 3.6 3.7 2.9 3.2 3.3 3.3
Average nominal interest rate on forex debt (in percent) 4.1 3.1 4.3 5.0 1.3 5.6 4.8 4.3 3.3 1.8 1.3 3.5 1.2 1.2 1.2
Average real interest rate on domestic debt (in percent) 5.1 -1.5 -1.3 1.7 3.4 2.4 1.7 0.0 -0.6 -1.1 -1.0 0.2 -0.4 -0.4 -0.4
Real exchange rate depreciation (in percent, + indicates depreciation) 14.2 20.9 -0.8 3.7 13.9 4.5 ... ... ... ... ... ... ... ... ...
Inflation rate (GDP deflator, in percent) -2.0 3.3 3.1 1.2 3.6 -0.7 0.0 1.7 2.4 3.1 3.0 1.6 2.8 3.0 2.9
Growth of real primary spending (deflated by GDP deflator, in percent) 5.5 -31.6 -25.8 -5.1 12.6 0.2 2.9 8.5 5.7 4.6 4.4 4.4 5.4 2.7 4.5
Grant element of new external borrowing (in percent) ... ... ... … … 37.3 36.0 36.7 37.1 36.5 36.5 36.7 36.7 36.9 ...
Sources: Country authorities; and staff estimates and projections.
1/ The coverage of public sector debt comprises the obligations of the central government, including commercial debt. The definition of debt corresponds to gross debt.
2/ Gross financing need is defined as the primary deficit plus debt service plus the stock of short-term debt at the end of the last period.
3/ Revenues excluding grants.
4/ Debt service is defined as the sum of interest and amortization of medium and long-term debt.
5/ Historical averages and standard deviations are generally derived over the past 10 years, subject to data availability.
6/ The primary deficit grosses up oil revenue and debt service on the oil sales advances
Table 3. Chad: Public Sector Debt Sustainability Framework, Baseline Scenario, 2014-2037(In percent of GDP, unless otherwise indicated)
Actual Projections
INTER
NA
TIO
NA
L MO
NETA
RY F
UN
D
15
CH
AD
CHAD
16 INTERNATIONAL MONETARY FUND
Table 4. Chad: Sensitivity Analysis for Key Indicators of Public Debt, 2017–37
Table 4. Chad: Sensitivity Analysis for Key Indicators of Public Debt, 2017-2037
2017 2018 2019 2020 2021 2022 2027 2037
Baseline 46 41 36 31 27 26 21 19
A. Alternative scenarios
A1. Real GDP growth and primary balance are at historical averages 46 42 39 35 33 33 33 27
A2. Primary balance is unchanged from 2017 46 40 35 29 24 22 13 -6
A3. Permanently lower GDP growth 1/ 46 41 37 33 30 30 30 49
B. Bound tests
B1. Real GDP growth is at historical average minus one standard deviations in 2018-2019 46 43 40 35 32 32 30 35
B2. Primary balance is at historical average minus one standard deviations in 2018-2019 46 45 44 39 36 35 29 26
B3. Combination of B1-B2 using one half standard deviation shocks 46 44 43 38 35 34 29 29
B4. One-time 30 percent real depreciation in 2018 46 51 45 39 35 34 27 24
B5. 10 percent of GDP increase in other debt-creating flows in 2018 46 47 42 37 34 33 27 25
Baseline 280 258 230 195 177 165 122 118
A. Alternative scenarios
A1. Real GDP growth and primary balance are at historical averages 280 266 247 222 211 207 199 168
A2. Primary balance is unchanged from 2017 280 254 221 181 156 140 77 -37
A3. Permanently lower GDP growth 1/ 280 259 235 204 190 184 175 286
B. Bound tests
B1. Real GDP growth is at historical average minus one standard deviations in 2018-2019 280 265 249 217 203 196 174 208
B2. Primary balance is at historical average minus one standard deviations in 2018-2019 280 284 282 246 229 217 170 158
B3. Combination of B1-B2 using one half standard deviation shocks 280 279 272 237 222 211 172 174
B4. One-time 30 percent real depreciation in 2018 280 321 288 247 226 213 161 148
B5. 10 percent of GDP increase in other debt-creating flows in 2018 280 296 268 233 216 204 160 151
Baseline 40 50 38 43 33 21 18 14
A. Alternative scenarios
A1. Real GDP growth and primary balance are at historical averages 40 50 38 44 34 21 20 18
A2. Primary balance is unchanged from 2017 40 50 38 44 34 21 17 7
A3. Permanently lower GDP growth 1/ 40 51 39 45 36 22 21 23
B. Bound tests
B1. Real GDP growth is at historical average minus one standard deviations in 2018-2019 40 52 41 47 37 23 21 20
B2. Primary balance is at historical average minus one standard deviations in 2018-2019 40 50 39 45 36 22 22 18
B3. Combination of B1-B2 using one half standard deviation shocks 40 51 40 46 36 22 22 18
B4. One-time 30 percent real depreciation in 2018 40 57 50 55 44 24 23 19
B5. 10 percent of GDP increase in other debt-creating flows in 2018 40 50 39 45 35 22 21 17
Sources: Country authorities; and staff estimates and projections.
1/ Assumes that real GDP growth is at baseline minus one standard deviation divided by the square root of the length of the projection period.
2/ Revenues are defined inclusive of grants.
PV of Debt-to-GDP Ratio
Projections
PV of Debt-to-Revenue Ratio 2/
Debt Service-to-Revenue Ratio 2/