ch8 social interaction in children with autism and typically developing children in collaborative...
TRANSCRIPT

begonapino.com
Pino, B. (2006) "Computers as an environment for facilitating social interaction in children with autistic spectrum disorders". PhD Thesis, University of Edinburgh, UK
175
Chapter 8: Social interaction in children with autism and typically developing children in collaborative vs. competitive playing
In this final study the social interaction between child and adult was observed during collaborative and
competitive playing. The study involved children with autism as well as typically developing children,
which allowed one to observe the two groups under both conditions. Twenty two children aged 6 to
11 years, (11 with ASD and 11, typically developing children (TD), played a jigsaw puzzle game with
an adult on a computer under an assistive, collaborative and competitive condition, for 5 minutes at a
time.
8.1 Research questions
The study presented here intended to observe the social interaction of two different groups of children
under different computer game conditions and find out whether there are differences between of
children with ASD and typically developing children. Under these conditions, the following questions
arise:
• Which children remain focused On-task longer?
• Which children initiate more interactions?
• Which children seek more eye contact?
• Which children respond more to experimenter?
• What do children do when they are waiting turn?
• Do the children´s social skills influence interaction?
8.2 Methodology
8.2.1 Overview
The study followed the same method described in Chapter 7, involving one session of 25 minutes in
which children played under three different conditions, following a predefined protocol including a
script of the researcher’s behaviour and playing strategies. The sessions with the ASD group were
carried out first, as described in Chapter 7, followed by the sessions with the TD group. Participants
within each of these groups were divided into two matched subgroups each starting with either the
Assisted or Collaborative version first, continuing with either Collaborative or Assisted, and then
finishing with the Competitive version. As indicated in the previous chapter, the whole session was
video recorded in order to obtain 5 minutes of footage in each condition.
begonapino.com
Pino, B. (2006) "Computers as an environment for facilitating social interaction in children with autistic spectrum disorders". PhD Thesis, University of Edinburgh, UK
176
8.2.2 Considerations
Although sessions with the ASD group took place at their school, the sessions with the TD group were
arranged with the parents to fit in the after-school activities of the child and were carried out at their
homes. Both, school and home are familiar environments for children, who could feel equally
comfortable with the experience. The setup as well as the researcher’s behaviour pattern remained the
same as described in Section 7.2.
Also, although it was a one off session for both groups, the TD group sessions took place after the
ASD group, which might have had an impact in the experimenter’s behaviour, such as feedback, eye
contact or assistance. Another factor which might have influenced the researcher´s behaviour was the
different traveling time (2.5 hours -one way for the ASD group).
8.2.3 Study Participants
The participants were 22 children 6-11 years old, 11 typically developing children and 11 with a
diagnosis of ASD. The children with ASD had difficulties in communication and social interaction but
were able to become involved in a computers-based activity. All children were also familiar with the
experimenter, after spending approximately 30 minutes during cognitive assessment. The profiles of
the participants with ASD can be seen in Table 7.1, while the TD participants’ profiles are shown in
Table 8.1 (see also Figure 8.1). Parents of the TD children completed the social items of the Vineland
questionnaire, used to measure social level as in previous studies (see Chapter 4, section 4.3.5).
Although the classroom version was used, and the measures may not be as reliable as a more
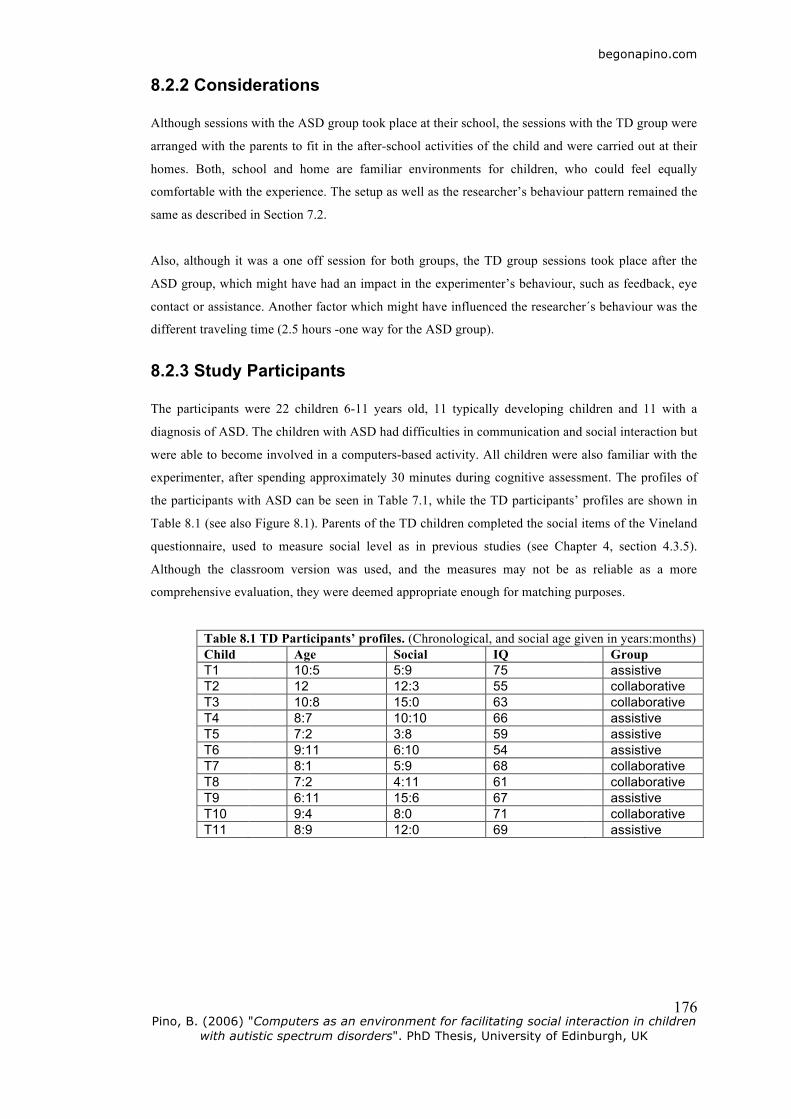
comprehensive evaluation, they were deemed appropriate enough for matching purposes.
Table 8.1 TD Participants’ profiles. (Chronological, and social age given in years:months) Child Age Social IQ Group T1 10:5 5:9 75 assistive T2 12 12:3 55 collaborative T3 10:8 15:0 63 collaborative T4 8:7 10:10 66 assistive T5 7:2 3:8 59 assistive T6 9:11 6:10 54 assistive T7 8:1 5:9 68 collaborative T8 7:2 4:11 61 collaborative T9 6:11 15:6 67 assistive T10 9:4 8:0 71 collaborative T11 8:9 12:0 69 assistive
begonapino.com
Pino, B. (2006) "Computers as an environment for facilitating social interaction in children with autistic spectrum disorders". PhD Thesis, University of Edinburgh, UK
177
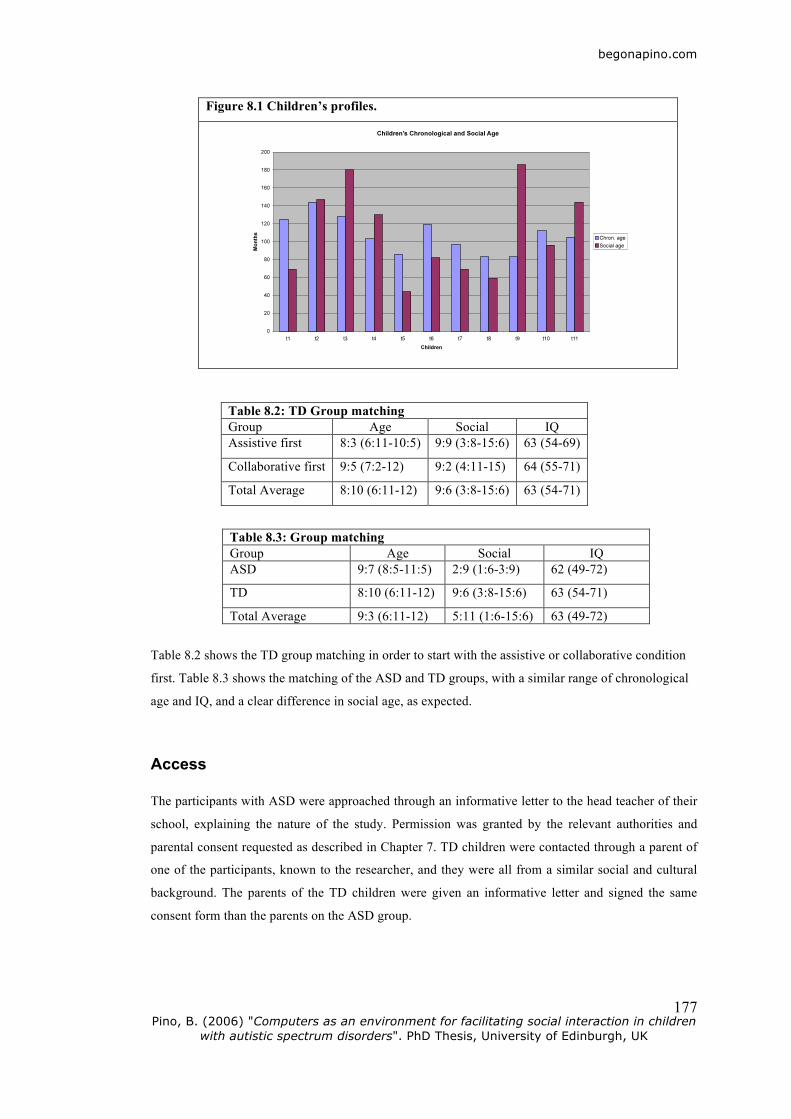
Figure 8.1 Children’s profiles.
Table 8.2: TD Group matching Group Age Social IQ Assistive first 8:3 (6:11-10:5) 9:9 (3:8-15:6) 63 (54-69)
Collaborative first 9:5 (7:2-12) 9:2 (4:11-15) 64 (55-71)
Total Average 8:10 (6:11-12) 9:6 (3:8-15:6) 63 (54-71)
Table 8.3: Group matching Group Age Social IQ ASD 9:7 (8:5-11:5) 2:9 (1:6-3:9) 62 (49-72)
TD 8:10 (6:11-12) 9:6 (3:8-15:6) 63 (54-71)
Total Average 9:3 (6:11-12) 5:11 (1:6-15:6) 63 (49-72)
Table 8.2 shows the TD group matching in order to start with the assistive or collaborative condition
first. Table 8.3 shows the matching of the ASD and TD groups, with a similar range of chronological
age and IQ, and a clear difference in social age, as expected.
Access
The participants with ASD were approached through an informative letter to the head teacher of their
school, explaining the nature of the study. Permission was granted by the relevant authorities and
parental consent requested as described in Chapter 7. TD children were contacted through a parent of
one of the participants, known to the researcher, and they were all from a similar social and cultural
background. The parents of the TD children were given an informative letter and signed the same
consent form than the parents on the ASD group.

begonapino.com
Pino, B. (2006) "Computers as an environment for facilitating social interaction in children with autistic spectrum disorders". PhD Thesis, University of Edinburgh, UK
178
8.2.4 Procedure
Details of the procedure, including the protocol and structure of the session, have been discussed in
Section 7.2.4. All the sessions of the ASD group were carried out at the children´s school, always
accommodating to children’s schedules to minimize disruption. The sessions with the TD group took
place at their homes outside school time, after the sessions with the ASD group had been completed.
In each case (both ASD and TD children) there was a one-off session in which the three different
versions of the jigsaw puzzle game were played at the computer for 5 minutes each.
8.2.5 Video Analysis
A description of recording setup, software used and coding system used for video analysis can be seen
in section 7.2.5. The sessions with the TD group provided 33 video recordings for analysis, which,
together with the ASD group, added up to 66 video recordings.
Table 8.4 Inter-observer reliability (TD). % agreement
frequency kappa % agreement
duration kappa
Verbal behaviour 88 .84 97 .94 Non verbal behaviour 68 .59 82 .74 Total 78 .71 89 .84
A second observer blind to the purpose of the study scored 10 % of the 33 TD group’s videotapes (see
section 7.2.5). Although there was 68% of agreement in the frequency of the Non Verbal behaviour,
slightly under the 70% considered adequate, the total, including the Verbal behaviour (88%) was 78%,
indicating that the coding by the first observer was reliable (see Table 8.4).
Table 8.5 Inter-observer reliability (ASD and TD). % agreement
frequency kappa % agreement
duration kappa
Verbal behaviour 86 .81 95 .92 Non verbal behaviour 78 .71 88 .81 Total 82 .76 91 .86
Taking the coding data from the ASD group (see Section 7.2.5), when the coding for both groups
were put together (see Table 8.5), then the measures for Non Verbal behaviour increased to 78%,
increasing the total to 82%. Since this included the coding of more videotapes, these measures can be
considered more reliable.
begonapino.com
Pino, B. (2006) "Computers as an environment for facilitating social interaction in children with autistic spectrum disorders". PhD Thesis, University of Edinburgh, UK
179
8.3 Results
As in the previous study (Chapter 7), the analysis focused on the frequency of certain events, looking
at On/Off-task behaviour, opportunities for eye contact, opportunities to interact based on the amount
of assistance from the adult partner.
8.3.1 On/Off-task behaviour
Child
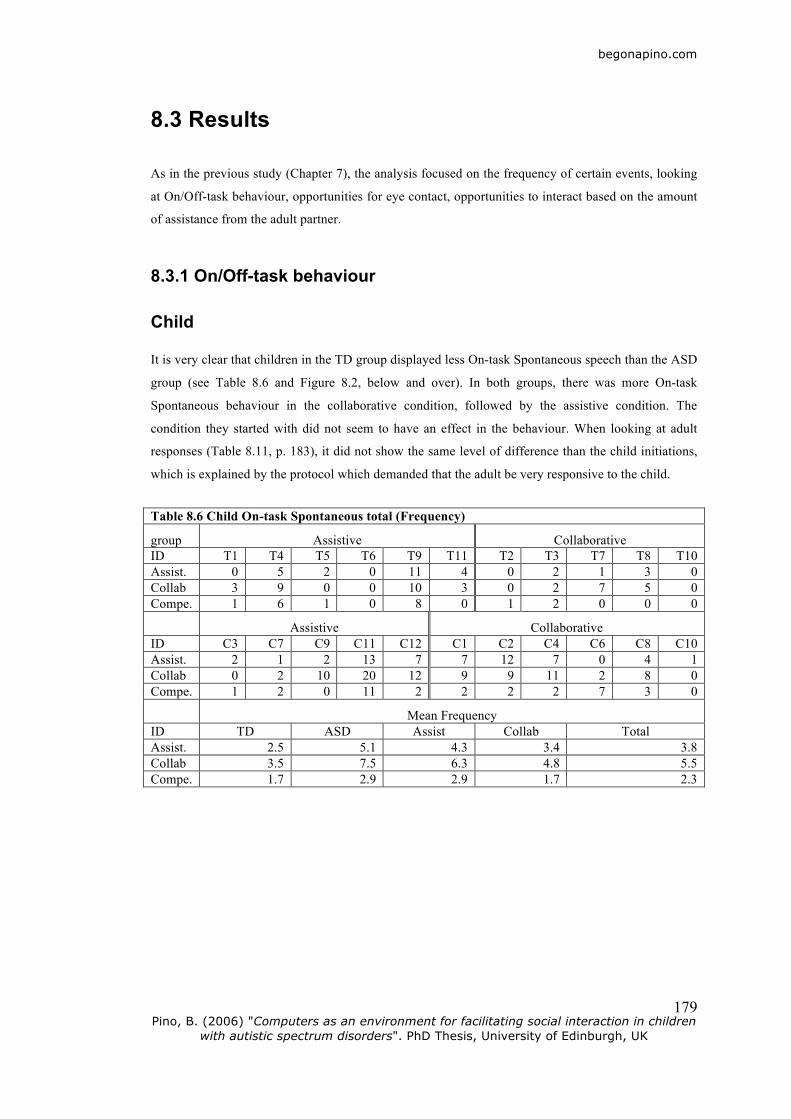
It is very clear that children in the TD group displayed less On-task Spontaneous speech than the ASD
group (see Table 8.6 and Figure 8.2, below and over). In both groups, there was more On-task
Spontaneous behaviour in the collaborative condition, followed by the assistive condition. The
condition they started with did not seem to have an effect in the behaviour. When looking at adult
responses (Table 8.11, p. 183), it did not show the same level of difference than the child initiations,
which is explained by the protocol which demanded that the adult be very responsive to the child.
Table 8.6 Child On-task Spontaneous total (Frequency) group Assistive Collaborative ID T1 T4 T5 T6 T9 T11 T2 T3 T7 T8 T10 Assist. 0 5 2 0 11 4 0 2 1 3 0 Collab 3 9 0 0 10 3 0 2 7 5 0 Compe. 1 6 1 0 8 0 1 2 0 0 0
Assistive Collaborative ID C3 C7 C9 C11 C12 C1 C2 C4 C6 C8 C10 Assist. 2 1 2 13 7 7 12 7 0 4 1 Collab 0 2 10 20 12 9 9 11 2 8 0 Compe. 1 2 0 11 2 2 2 2 7 3 0 Mean Frequency ID TD ASD Assist Collab Total Assist. 2.5 5.1 4.3 3.4 3.8 Collab 3.5 7.5 6.3 4.8 5.5 Compe. 1.7 2.9 2.9 1.7 2.3

begonapino.com
Pino, B. (2006) "Computers as an environment for facilitating social interaction in children with autistic spectrum disorders". PhD Thesis, University of Edinburgh, UK
180
Figure 8.2 Child On-task Spontaneous total.
The responses of the children depended on the spontaneous behaviour of the adult, which was
prescribed by the protocol to be as homogeneous as possible in both groups and through the different
conditions. In contrast, the pattern of children’s responses was different (see Table 8.7 and Figure 8.3,
below and over). In the TD group there was less On-task responses than in the other group, being
most noticeable in the collaborative condition, with only 4 children responding at all while there were
7 that responded in the ASD group. Only 2 of 22 children did not respond at all in the assistive
condition, 5 in the competitive and 11 in the collaborative.
Table 8.7 Child On-task Response total (Frequency) group Assistive Collaborative ID T1 T4 T5 T6 T9 T11 T2 T3 T7 T8 T10 Assist. 2 2 3 1 2 3 1 3 0 1 2 Collab 0 1 0 0 1 0 1 1 0 0 0 Compe. 0 5 5 2 0 4 1 0 2 2 2
Assistive Collaborative
ID C3 C7 C9 C11 C12 C1 C2 C4 C6 C8 C10 Assist. 3 2 2 1 1 1 8 4 0 1 1 Collab 2 4 1 0 0 0 4 1 2 1 0 Compe. 4 1 1 0 9 4 5 3 2 6 0 Mean Frequency ID TD ASD Assist Collab Total Assist. 1.8 2.2 2.0 2.0 2.0 Collab 0.4 1.4 0.8 0.9 0.9 Compe. 2.1 3.2 2.8 2.5 2.6

begonapino.com
Pino, B. (2006) "Computers as an environment for facilitating social interaction in children with autistic spectrum disorders". PhD Thesis, University of Edinburgh, UK
181
Figure 8.3 Child On-task Response total.
Table 8.8 (below) shows that only 2 children of the TD group initiated Off-task speech, whereas in the
ASD group there were 8 children, of which 3 actually showed this behaviour in two conditions. There
was less Off-task speech in the collaborative condition, 0 in the TD group and 2 children in the ASD,
with three cases in the assistive condition and 6 in the competitive condition of this group.
Table 8.8 Child Off-task Spontaneous total. (Frequency) group Assistive Collaborative ID T1 T4 T5 T6 T9 T11 T2 T3 T7 T8 T10 Assist. 0 0 0 0 0 1 0 0 0 0 0 Collab 0 0 0 0 0 0 0 0 0 0 0 Compe. 0 0 0 0 2 0 0 0 0 0 0
Assistive Collaborative ID C3 C7 C9 C11 C12 C1 C2 C4 C6 C8 C10 Assist. 2 0 0 0 0 0 1 5 0 0 0 Collab 0 0 0 0 1 0 0 0 1 0 0 Compe. 0 2 0 1 0 3 2 4 2 0 0 The Off-task responses were fewer than the Off-task adult initiations (see Table 8.9, over). They also
appear not to be direct consequence of an adult Off-task behaviour, which may be due to them being
an Off-task response to an adult behaviour not coded as Off-task.

begonapino.com
Pino, B. (2006) "Computers as an environment for facilitating social interaction in children with autistic spectrum disorders". PhD Thesis, University of Edinburgh, UK
182
Table 8.9 Child Off-task Response total. (Frequency) group Assistive Collaborative ID T1 T4 T5 T6 T9 T11 T2 T3 T7 T8 T10 Assist. 0 0 0 0 0 0 0 0 0 0 0 Collab 0 0 0 0 0 0 0 0 0 0 1 Compe. 0 0 0 0 0 0 0 0 0 0 0
Assistive Collaborative ID C3 C7 C9 C11 C12 C1 C2 C4 C6 C8 C10 Assist. 0 0 0 0 0 0 0 1 0 0 0 Collab 0 0 0 0 3 0 0 1 0 0 0 Compe. 0 0 0 0 0 0 0 0 0 0 0
Adult
In general terms, adult On-task behaviour was consistent through the conditions, so each child
received a similar amount of On-task speech in the three conditions, even if different children
received a different amount, although there seems to be a slightly more variability in the TD group.
There were two exceptions to this as child C7 had a lot more adult On-task Spontaneous speech in the
collaborative condition and child T1 had more in the competitive condition (see Table 8.10 and Figure
8.4, below and over). In the case of child C7, the adult felt that she needed to remind him of his turn
more frequently than the rest of the children, which means that she may have deviated from the
desired homogeneous behaviour. On the other hand, child T1 did have some difficulties with the
puzzles in the competitive condition, which lead the adult to offer help several times, according to the
protocol, increasing her number of Spontaneous behaviours.
Table 8.10 Adult On-task Spontaneous total. (Frequency) group Assistive Collaborative ID T1 T4 T5 T6 T9 T11 T2 T3 T7 T8 T10 Assist. 11 14 11 13 13 11 16 21 10 12 13 Collab 10 13 9 12 7 14 14 14 11 17 13 Compe. 27 17 10 21 10 15 18 16 10 9 16
Assistive Collaborative
ID C3 C7 C9 C11 C12 C1 C2 C4 C6 C8 C10 Assist. 13 12 16 10 23 15 12 9 10 16 18 Collab 13 38 16 15 20 14 9 10 13 20 14 Compe. 15 14 18 19 18 13 10 14 14 12 19 Mean Frequency ID TD ASD Assist Collab Total Assist. 13.2 14.0 13.4 13.8 13.6 Collab 12.2 16.5 15.2 13.5 14.4 Compe. 15.4 15.1 16.7 13.7 15.2
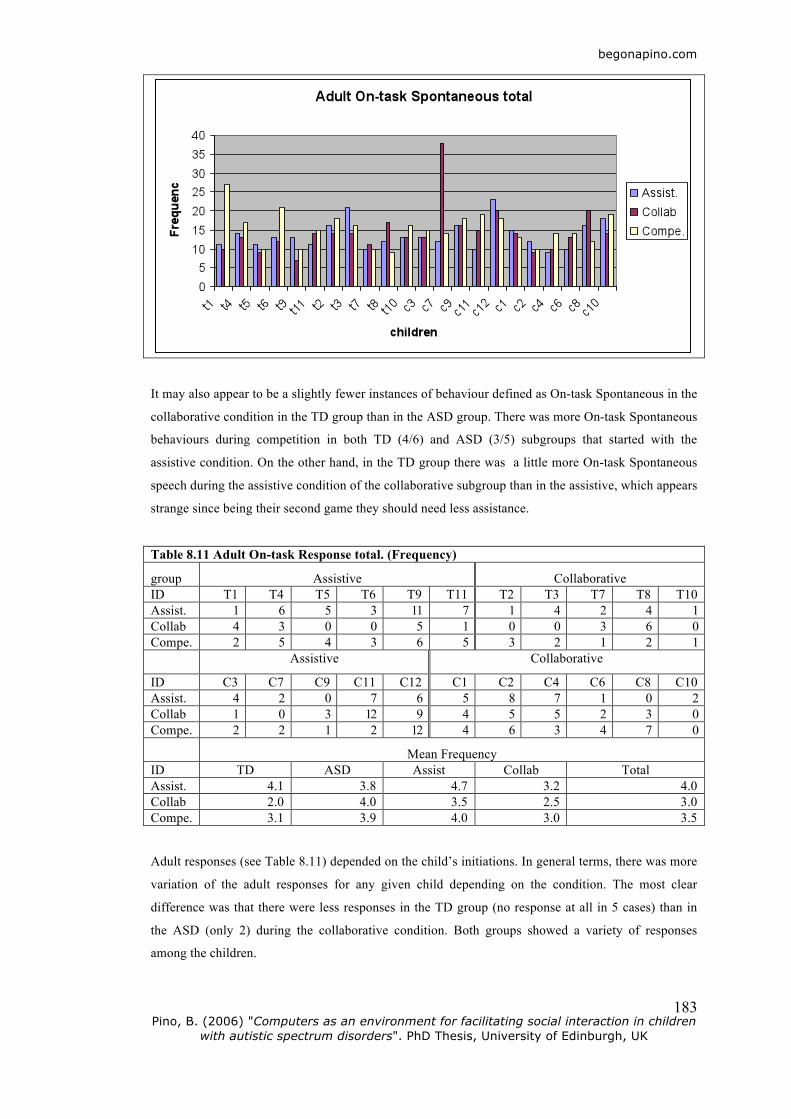
Figure 8.4 Adult On-task Spontaneous total.
begonapino.com
Pino, B. (2006) "Computers as an environment for facilitating social interaction in children with autistic spectrum disorders". PhD Thesis, University of Edinburgh, UK
183
It may also appear to be a slightly fewer instances of behaviour defined as On-task Spontaneous in the
collaborative condition in the TD group than in the ASD group. There was more On-task Spontaneous
behaviours during competition in both TD (4/6) and ASD (3/5) subgroups that started with the
assistive condition. On the other hand, in the TD group there was a little more On-task Spontaneous
speech during the assistive condition of the collaborative subgroup than in the assistive, which appears
strange since being their second game they should need less assistance.
Table 8.11 Adult On-task Response total. (Frequency) group Assistive Collaborative ID T1 T4 T5 T6 T9 T11 T2 T3 T7 T8 T10 Assist. 1 6 5 3 11 7 1 4 2 4 1 Collab 4 3 0 0 5 1 0 0 3 6 0 Compe. 2 5 4 3 6 5 3 2 1 2 1
Assistive Collaborative
ID C3 C7 C9 C11 C12 C1 C2 C4 C6 C8 C10 Assist. 4 2 0 7 6 5 8 7 1 0 2 Collab 1 0 3 12 9 4 5 5 2 3 0 Compe. 2 2 1 2 12 4 6 3 4 7 0 Mean Frequency ID TD ASD Assist Collab Total Assist. 4.1 3.8 4.7 3.2 4.0 Collab 2.0 4.0 3.5 2.5 3.0 Compe. 3.1 3.9 4.0 3.0 3.5 Adult responses (see Table 8.11) depended on the child’s initiations. In general terms, there was more
variation of the adult responses for any given child depending on the condition. The most clear
difference was that there were less responses in the TD group (no response at all in 5 cases) than in
the ASD (only 2) during the collaborative condition. Both groups showed a variety of responses
among the children.

begonapino.com
Pino, B. (2006) "Computers as an environment for facilitating social interaction in children with autistic spectrum disorders". PhD Thesis, University of Edinburgh, UK
184
Off-task behaviour was very limited, happening spontaneously with 4 children of the TD group and 2
of the ASD group. Interestingly, the adult responses to Off-task behaviour took place with 2 children
of the TD group and 7 of the ASD group, which indicates more spontaneous Off-task behaviour from
the children in the last group.
8.3.2 Assistance
Not all children asked for help when they clearly needed it. Five asked for help during their first game
(4 in assistive and 1 in collaborative) and three during competition, with only one asking for help
during assistive and competitive conditions (see Table 8.12). These data could be analysed looking at
the number of games played, to see whether those who asked for help the most were the ones who
actually needed it the most. Asking for help during the competitive condition was allowed and would
have given an advantage to the child who did it, but the majority did not.
Table 8.12 Child Asked for Help Spontaneously. (Frequency) group Assistive Collaborative ID T1 T4 T5 T6 T9 T11 T2 T3 T7 T8 T10 Assist. 0 0 2 0 0 2 0 0 0 0 0 Collab 0 0 0 0 1 0 0 0 0 4 0 Compe. 0 0 1 0 0 0 1 0 0 0 0
Assistive Collaborative
ID C3 C7 C9 C11 C12 C1 C2 C4 C6 C8 C10 Assist. 0 1 0 4 0 4 0 0 0 0 1 Collab 0 0 0 0 0 0 0 0 0 0 0 Compe. 0 0 0 0 1 0 2 0 0 0 0 Mean Frequency ID TD ASD Assist Collab Total Assist. 0.4 0.9 0.8 0.5 0.6 Collab 0.5 0.0 0.1 0.4 0.2 Compe. 0.2 0.3 0.2 0.3 0.2 Table 8.13 (over) shows that children in both groups seemed to accept help when prompted in the
assistive condition. The little appearance of accepted help during collaboration is probably due to a
lesser need cause by adult intervention through playing together. There were 8 children in the TD
group who accepted help during the competitive condition whereas there were only 4 in the ASD
group who did the same.

begonapino.com
Pino, B. (2006) "Computers as an environment for facilitating social interaction in children with autistic spectrum disorders". PhD Thesis, University of Edinburgh, UK
185
Table 8.13 Child Asked Help Prompted. (Frequency) group Assistive Collaborative ID T1 T4 T5 T6 T9 T11 T2 T3 T7 T8 T10 Assist. 0 0 1 1 0 0 1 3 0 1 1 Collab 0 0 0 0 0 0 0 0 0 0 0 Compe. 0 1 2 2 0 3 1 0 1 2 1
Assistive Collaborative ID C3 C7 C9 C11 C12 C1 C2 C4 C6 C8 C10 Assist. 2 1 0 0 1 1 2 4 0 0 1 Collab 0 0 0 0 0 0 0 1 0 0 0 Compe. 1 1 0 0 0 2 0 3 0 3 0
Table 8.14 Adult Offered Help. (Frequency) group Assistive Collaborative ID T1 T4 T5 T6 T9 T11 T2 T3 T7 T8 T10 Assist. 0 6 5 4 9 4 2 7 4 6 1 Collab 0 0 0 0 0 0 0 0 0 0 0 Compe. 6 5 3 7 5 8 6 0 4 6 3
Assistive Collaborative ID C3 C7 C9 C11 C12 C1 C2 C4 C6 C8 C10 Assist. 7 3 2 1 9 4 3 4 1 5 9 Collab 0 0 0 0 1 2 0 2 0 0 1 Compe. 4 3 2 5 11 5 1 3 1 10 8 The adult offered help spontaneously when needed, according to protocol (Table 8.14). The behaviour
was consistent for any given child, in general terms, for both groups, which means that some children
appeared to need more help than others, with more variation among the ASD group. It was also in this
group that some help was offered during the collaborative condition. The fact that the adult
participated in the game providing solutions made it less necessary to help verbally, as indicated in the
previous study.
Table 8.15 Adult Gave Help Spontaneously. (Frequency) group Assistive Collaborative ID T1 T4 T5 T6 T9 T11 T2 T3 T7 T8 T10 Assist. 0 4 3 1 1 1 1 0 2 1 0 Collab 0 2 2 0 1 0 0 1 0 4 0 Compe. 3 0 0 0 0 0 0 0 0 0 0
Assistive Collaborative ID C3 C7 C9 C11 C12 C1 C2 C4 C6 C8 C10 Assist. 1 1 1 3 5 0 0 0 0 2 3 Collab 1 0 0 0 0 0 1 0 2 1 2 Compe. 1 0 0 0 1 3 1 0 0 0 0 There were cases when the adult provided help spontaneously, as shown in Table 8.15. It was
expected to happen more often in the first game of each child, in order to help the child learn the rules
and maximize his motivation. The ASD group shows exactly that, with more adult help being given

begonapino.com
Pino, B. (2006) "Computers as an environment for facilitating social interaction in children with autistic spectrum disorders". PhD Thesis, University of Edinburgh, UK
186
during the assistive condition of the assistive subgroup, and more help given during collaboration in
the collaborative subgroup. On the other hand, the TD is slightly different, there is more help in the
assistive condition in the assistive subgroup, but there is also more help in the collaborative condition.
However, the number of occurrences is small, so there are no conclusions to be drawn from this.
8.3.3 Eye contact
Table 8.16 (below) shows that the adult looked at the child more or less the same number of times in
both groups during the assisted and competitive conditions, with some more looking in two cases of
the TD group, one for each condition (T9, T1). It is striking that there were also two cases (T10 and
T4) when the adult did not look at the child, which is not to say that she did not interact (many times,
she talked to the child while looking at the screen). In the collaborative condition, the adult appears to
have looked more at children in the ASD group. In any case, the difference between conditions was
significant, (F(2,63) = 19.993, p<.05), probably driven by the Adult Look Spontaneous (F(2,63) =
17.047 , p=.000).
Table 8.16 Adult Look total. (Frequency) group Assistive Collaborative ID T1 T4 T5 T6 T9 T11 T2 T3 T7 T8 T10 Assist. 9 7 6 8 22 6 7 10 7 7 0 Collab 8 8 2 5 8 6 4 5 5 5 4 Compe. 20 0 8 14 14 7 11 8 5 7 9
Assistive Collaborative ID C3 C7 C9 C11 C12 C1 C2 C4 C6 C8 C10 Assist. 3 3 6 6 12 10 4 13 5 3 7 Collab 6 6 10 7 8 13 8 13 9 6 8 Compe. 10 5 9 4 8 11 3 6 9 10 12 Table 8.17 Child Look total. (Frequency) group Assistive Collaborative ID T1 T4 T5 T6 T9 T11 T2 T3 T7 T8 T10 Assist. 1 1 0 2 0 0 0 2 0 0 0 Collab 1 1 1 4 5 0 2 7 0 1 4 Compe. 0 2 2 7 3 0 1 6 1 1 5
Assistive Collaborative
ID C3 C7 C9 C11 C12 C1 C2 C4 C6 C8 C10 Assist. 0 0 0 1 0 0 1 0 2 1 1 Collab 1 0 4 0 1 0 0 0 2 0 0 Compe. 0 0 3 0 0 2 2 0 8 3 0 Mean Frequency ID TD ASD Assist Collab Total Assist. 0.5 0.5 0.5 0.6 0.5 Collab 2.4 0.7 1.6 1.5 1.5 Compe. 2.5 1.6 1.5 2.6 2.1

begonapino.com
Pino, B. (2006) "Computers as an environment for facilitating social interaction in children with autistic spectrum disorders". PhD Thesis, University of Edinburgh, UK
187
Figure 8.5 Child Look total.
On the other hand, children looked at the adult very few times in comparison, especially in the
assisted version (see Table 8.17 and Figure 8.5). In the collaborative and competitive conditions, 9
children from the TD group looked at the adult, with only 4 and 5 children from the ASD group did it
in each condition respectively. Interestingly, the differences between conditions were also significant
(F(2,63) = 6.524, p=.005).
8.3.4 Waiting
During the competitive condition children waited for the adult to complete her puzzle and their
behaviour was coded. In the TD group 7 children were distracted (looked away or displayed other
Off-task behaviours), and in the ASD group 10 children were distracted (see Table 8.18).
Table 8.18 Child waiting in Competitive. (Frequency) group Assistive Collaborative ID T1 T4 T5 T6 T9 T11 T2 T3 T7 T8 T10 Assist. 1 0 9 0 1 0 0 0 1 2 0 Collab 4 4 3 0 5 1 0 0 0 0 1 Compe. 1 0 0 0 1 1 0 0 1 0 1
Assistive Collaborative ID C3 C7 C9 C11 C12 C1 C2 C4 C6 C8 C10 Assist. 0 0 0 0 0 0 1 11 8 2 0 Collab 0 4 2 12 7 2 0 3 4 7 0 Compe. 0 1 1 1 0 0 0 1 0 0 0 In both groups, the majority remained involved in the game, either by paying attention but also those
who were distracted did show more On-task Spontaneous speech. There were children who displayed

begonapino.com
Pino, B. (2006) "Computers as an environment for facilitating social interaction in children with autistic spectrum disorders". PhD Thesis, University of Edinburgh, UK
188
Off-task Spontaneous speech in both groups, 5 in the TD and 4 in the ASD. But it was the ASD group
where there was more On-task Spontaneous speech, with 8 children with higher values than the 6
children of the TD group.
Another behaviour that took place was the children providing help to the adult. There were 5 from the
TD group and 4 from the ASD, three of each happening in the assistive subgroups, which means that
6 children had just done the collaborative condition.
8.3.5 Correlations
There were some correlations of interest, apart from the most obvious ones such as that between the
child’s On-task look spontaneous and On-task look response (r=.308, p=.014), since it would seem
logical that those who look more spontaneously also look as a response. For example, both the child’s
On-task look spontaneous (r=.353, p=.005), and On-task look response behaviours (r=.272, p=.002)
were correlated with Adult look total, which implies that when the child looked more, so did the adult
and vice versa, with the child’s Look Total being correlated to the Adult Look Total (r=.39, p=.002).
It is not possible to know whether this was due to the Adult’s role as being responsive to the child, or
the influence of her spontaneous eye contact on the child.
Also interesting was the correlation found between the child’s On-task social spontaneous behaviour
and the Adult look total (r=.305, p=.015). The most likely interpretation is that the adult looked at the
child if he was talking to her. It could be added, from direct observation of the videotapes, that the
adult looking at the child did not prompt his speech.
Social age was correlated with Off-task social spontaneous (r=-.273, p=.031), Off-task social Total
(r=-.280, p=.026), Social Total (r=-.254, p=.044), Prompted Help (r=-.341, p=.006) and Adult Look
Total (r=-.295, p=.019). It might be the case that the Off-task social behaviour influenced the Social
Total, but it seems that the better the social skills the less Off-task behaviour is seen. On the other
hand, there were some correlations between Social age and other variables that were expected but not
found On-task social Spontaneous, On-task social response, Look spontaneous, Look response.
8.4 Discussion
8.4.1 On/Off-task behaviour
The adult seems to have maintained a more or less consistent behaviour, apart from some exceptional
instances, in both the On-task and Off-task Spontaneous behaviour. There were some differences
between the adult behaviour in the two groups, but those were small. It is only when looking at the

begonapino.com
Pino, B. (2006) "Computers as an environment for facilitating social interaction in children with autistic spectrum disorders". PhD Thesis, University of Edinburgh, UK
189
children’s behaviour that differences between the groups appear, and these are not necessarily what
one would expect.
The fact that in the TD group there was a little more On-task Spontaneous speech during the assistive
condition on the collaborative subgroup, cannot be explained without further analysis of data, since
that was the second condition and should have required less assistance. It could be due to more
positive feedback rather than assistance.
The adult responses were more varied because they depended on the children’s initiations, and those
were also heterogeneous. The adult was less responsive in the TD group, but children in that group
also initiated less, so the adult behaviour was coherent. The TD group also initiated less Off-task
speech, and as a consequence, the adult responded more to the ASD children’s Off-task speech.
Children in the TD group showed less On-task spontaneous speech than those in the ASD group,
which was surprising. It may be explained as the TD group trying to solve the puzzles by themselves,
with more confidence in their own skills to do it, therefore not asking for help, which is a major
component of the On-task Spontaneous speech. But more analysis is required to understand this, if at
all possible.
What was expected and found, was more of the On-task Spontaneous category of behaviour in the
collaborative condition, regardless of what condition they started with, in both groups (TD and ASD).
This is an interesting outcome when looking at levels of help offered and requested by the child in the
collaborative condition. What makes this On-task speech of a different nature needs more analysis.
The TD group was less verbally responsive to adult On-task speech than the ASD group, and this was
most clear in the collaborative condition. This behaviour is consistent with the previous spontaneous
behaviour, and it reinforces the idea that the TD group was less verbal than the ASD group or put in
different words, that the ASD group was more verbal.
The assistive condition generated more responses and the collaborative condition generated the least.
The first might be explained by assuming that children were aware of the assistive role of the adult
and responded to her for that reason, however, there is not enough data to support this argument. It is
not strange there was less response in the collaborative condition because there was less adult On-task
Spontaneous speech. Accepting that the adult was providing help through playing, thus making the
interaction less verbal during the collaborative condition, then the other learning situation was the
assistive condition, which was more verbally based, thus generating then more verbal responses.
It was clear from the Off-task Spontaneous speech results that children in the ASD group were more
distracted than in the TD. This may be explained by a shorter attention span or difficulty in

begonapino.com
Pino, B. (2006) "Computers as an environment for facilitating social interaction in children with autistic spectrum disorders". PhD Thesis, University of Edinburgh, UK
190
concentrating in children with ASD. However, it may also be the fact the ASD group was more verbal
in general, including this behaviour, which is consistent with the previous behaviours. Similarly, there
was less Off-task speech in the collaborative condition, probably because of generating less speech in
general. But there was more Off-task speech in the competitive condition, which was always the last
one and the children may have been tired or bored by then, getting more easily distracted.
8.4.2 Assistance
The adult offered help consistently, and data shows that some children appeared to need more help
than others with the ASD presenting a wider range. A detailed analysis of the profiles may clarify
whether this wider range has some explanation in terms of variability within the group (e.g. more
extreme values in IQ or social skills). There was minimal help offered during collaboration, probably
due to the scaffolding role of the adult playing with the child and therefore facilitating the game.
Considering that the adult showed as much On-task Spontaneous speech in the collaborative
condition, and that the number of games played was similar, generating the same amount of praise and
feedback as in the other condition, then it can be assumed that the nature of the speech was more
focused upon turn taking.
The results also showed that the adult provided help directly in several occasions, against the protocol
instructions of offering help first. This tended to happen in the first game of the child, showing that
the adult adapted the general rules to maximize child’s motivation, as instructed in the protocol.
All children were reluctant to ask for help. Only 7 children did actually ask for help, and further
analysis is required to know if those were the children that needed it the most. They were more likely
to accept it in the assistive condition, where the role of the adult as assistant was emphasized.
However, TD children seemed to be more willing to accept help when prompted to do so in the
competitive condition than the ASD group. This can be interpreted in two ways: first, the TD children
noticed that it would be advantageous to use help to speed their solutions, and second, the ASD
children preferred the challenge of solving things on their own. A third possibility is the combination
of both interpretations, but there is not enough data to choose one over the others.
8.4.3 Eye contact
The protocol required the adult to look at the child every time she spoke to him. There was not a
major difference between the groups, except in the collaborative condition where the adult looked
more at the ASD children. Having played a similar number of games in both groups, and not needing
verbal help as much in this condition, it can be assumed that the adult looks were related to turn taking
calls. This does not necessarily mean that children needed to be reminded of their turn, but that the
begonapino.com
Pino, B. (2006) "Computers as an environment for facilitating social interaction in children with autistic spectrum disorders". PhD Thesis, University of Edinburgh, UK
191
adult decided to make those calls. It may have been that the adult acted based on previous knowledge
and not reacting to what was actually happening. Further analysis should clarify this aspect.
In general terms, children did not look too much at the adult. This may have been a consequence of
their engagement with the game, or even the hypnotic qualities of the screen which make it easier to
remain looking at it than to look elsewhere. There were more children from the TD group who looked
at the adult in the collaborative and competitive version. This would be consistent with the autistic
features that refer to avoidance of eye contact, but the cases are too few to assume that this difference
of significance.
Interestingly, both groups of children looked the least in the assistive condition. An interpretation
could be that the adult provided verbal explanations about what was happening on the screen, and this
required the child to be looking at it in order to understand, and the rest of the time was concentrating
on playing. A feature of the game is that time is ticking unless you have just finished a game, at the
moment the ´next´ button is clicked, timer starts again, so children probably feel they have to focus on
the game to do their best, leaving little time to waste.
8.4.4 Waiting
The time spent by children waiting for their turn in the competitive condition generated a variety of
behaviours. The ASD group appeared to be more distracted than the TD group, which is consistent
with expectations relating to a shorter attention span within the autistic population. However, both
groups displayed a similar number of Off-task Spontaneous speech. Considering that the TD group
has been less verbal in general, it is surprising that they should have shown a proportionally higher
level of ‘verbal’ distraction (Off-task speech). To add to the confusion, those children who appeared
more distracted also displayed more On-task Spontaneous speech. As the competitive condition was
the last one to be played, it is likely that the children were tired and more prone to distraction, but at
the same time, the outcome of the adult’s game was important for their own victory, which may have
kept them engaged throughout the waiting period. This was the intention when designing the game
and experimental protocol.
Finally, a few of the children in both groups provided help to the adult, despite knowing that they
were competing. Whether the reason was boredom or a helpful nature prompted by adult example in
the collaborative versions, the fact is that there was a similar number in each group, 5 in the TD and 4
in the ASD.

begonapino.com
Pino, B. (2006) "Computers as an environment for facilitating social interaction in children with autistic spectrum disorders". PhD Thesis, University of Edinburgh, UK
192
8.5 Summary
This chapter presented the findings of a study of social interaction patterns in typically developing
children and children with autism when playing a jigsaw puzzle game on a computer whilst being
assisted, collaborating and competing. Twenty two children of 6 to 11 years old participated in the
study. The main findings were:
• The adult was consistent with her On/Off-task Spontaneous speech through the conditions
and across the groups.
• The adult provided more help without offering first in the first game.
• The adult provided little help in the collaborative condition.
• The adult looked more at children from the ASD group during the collaborative condition.
• Children showed more On-task Spontaneous speech in the collaborative condition, and least
in the competitive.
• Children with ASD showed more On-task Spontaneous speech than the TD group.
• Children were more responsive to On-task adult speech in the assistive condition.
• Children in the TD group were less responsive to On and Off-task adult speech.
• Children showed less Off-task Spontaneous speech in the collaborative condition, and more
in the competitive.
• Children in the ASD group showed more Off-task speech, and were in general more verbal
than the children in the TD group.
• Children were reluctant to ask for and receive help.
• Children in the TD group accepted more help during the competitive condition.
• Children looked less at the adult in the assistive condition.
• Children in the TD group looked at the adult more than the ASD group in the collaborative
and competitive condition.
• Nine children provided help to the adult during their waiting time in the competitive
condition.
• Children in the ASD group appeared more distracted but also displayed more On-task
Spontaneous speech during their waiting time in the competitive condition.
There are three main issues in these findings. First, all children seemed to enjoy the game and were
fully engaged throughout the session, and those who appeared more distracted were also the most
participative during their waiting time. Second, all children seemed reluctant to ask for and receive
help, despite of being reminded several times that this would not affect their score. These are
consistent with the literature that states that computers are engaging, motivational and provide an
opportunity to develop a sense of mastery (Murray, 1997).
begonapino.com
Pino, B. (2006) "Computers as an environment for facilitating social interaction in children with autistic spectrum disorders". PhD Thesis, University of Edinburgh, UK
193
Finally, children in the TD group appeared to look at the adult a little more than those in the ASD
group. Although this would be expected because people with autism tend to avoid eye contact, the
number of occurrences was small in both groups, because the nature of the game kept children
engaged with what was happening on the screen, and this tends to be true for computer games in
general. In contrast, the TD group appeared to be less verbal, which goes against expectations. This
may show that even typically developing children speak little when at the computer. However, these
could be a consequence of the nature of the game, and both groups playing with a different game will
show different patterns of speech frequency and eye contact. In the meantime, these findings suggest
that we should not assume that, when playing computer games, the speech and eye contact displayed
by a child with ASD is caused by the autism and not by the environment.
8.6 Game Summative Evaluation
An evaluation is called summative when it is carried out after the product has been developed (Preece
et al., 1994). The results in performance by the real users in the real context of use provide an insight
in the effects of the design. The performance measures gathered in this case were the speed at which
children solved the jigsaw puzzles and how many of them they managed to solve in each of the
conditions. If the results were similar in the pilot group and ASD group, then it would be possible to
conclude that the game did not make demands which children with ASD cannot meet. This would
have to be interpreted with care because the protocols used have been slightly different.
The main aspect of the protocol that could have an impact on the performance of the children was the
level of assistance. With the pilot group, assistance was offered at the beginning of each condition,
whereas in the study described in Chapter 7, assistance was offered after every three errors. This effect
may have been reduced by the fact that not all the children in the ASD group needed help, and from
those who needed it, only a few accepted it on some occasions. However, comparing the performance
of a typically developing group under the same conditions of the ASD group would allow one to rule
out the protocol as a cause of differences in performance. Before discussing the findings it is
important to point out that statistical analysis (one-way ANOVA) showed no significant differences
between the groups, thus the present analysis focused on descriptive aspects of the results.
8.8.1 Group speed
First of all, it needs to be clarified that the number of puzzles solved depended not only on the speed
of the child but also on the amount of time given to do it. Since these performance observations are
interlinked with the studies reported earlier (see also Chapter 7) which required at least five minutes
of play in each of the three conditions, children were allowed to finish the puzzle they were solving by
the time the five minutes were up. This meant that if a child was slow in solving a puzzle, but had just
begonapino.com
Pino, B. (2006) "Computers as an environment for facilitating social interaction in children with autistic spectrum disorders". PhD Thesis, University of Edinburgh, UK
194
started solving one a few seconds before time was up, he may have been given a lot more time than a
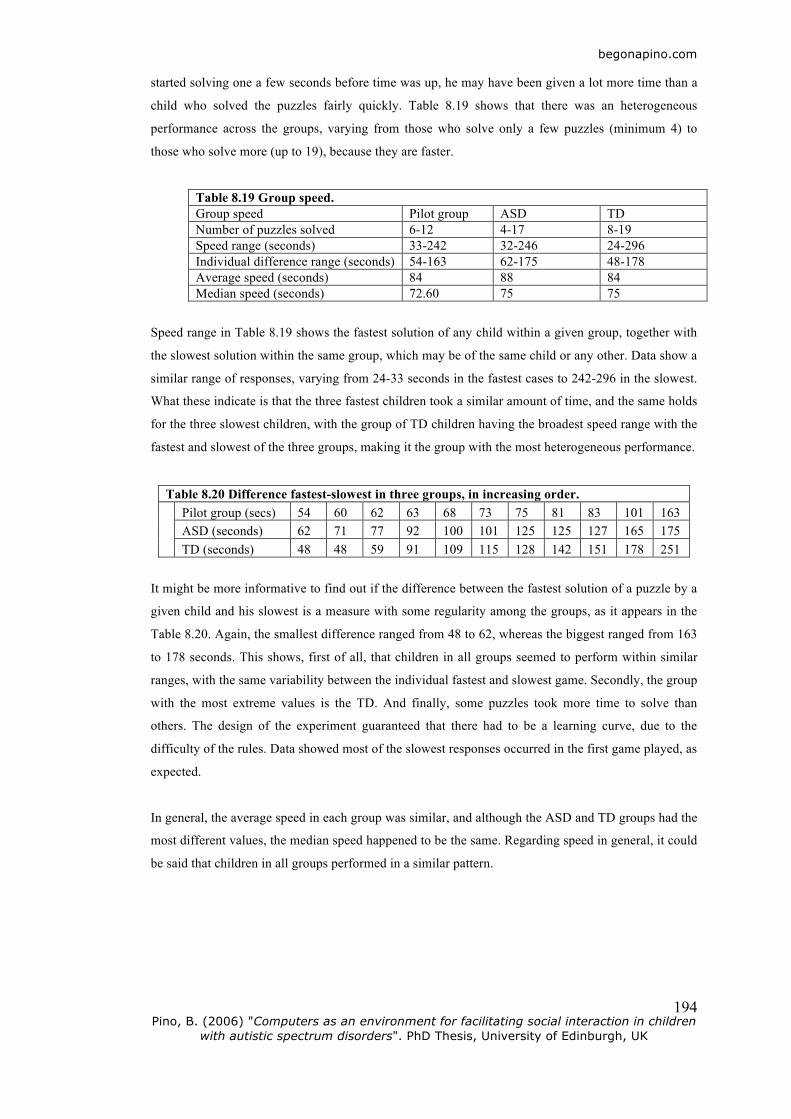
child who solved the puzzles fairly quickly. Table 8.19 shows that there was an heterogeneous
performance across the groups, varying from those who solve only a few puzzles (minimum 4) to
those who solve more (up to 19), because they are faster.
Table 8.19 Group speed. Group speed Pilot group ASD TD Number of puzzles solved 6-12 4-17 8-19 Speed range (seconds) 33-242 32-246 24-296 Individual difference range (seconds) 54-163 62-175 48-178 Average speed (seconds) 84 88 84 Median speed (seconds) 72.60 75 75
Speed range in Table 8.19 shows the fastest solution of any child within a given group, together with
the slowest solution within the same group, which may be of the same child or any other. Data show a
similar range of responses, varying from 24-33 seconds in the fastest cases to 242-296 in the slowest.
What these indicate is that the three fastest children took a similar amount of time, and the same holds
for the three slowest children, with the group of TD children having the broadest speed range with the
fastest and slowest of the three groups, making it the group with the most heterogeneous performance.
Table 8.20 Difference fastest-slowest in three groups, in increasing order. Pilot group (secs) 54 60 62 63 68 73 75 81 83 101 163 ASD (seconds) 62 71 77 92 100 101 125 125 127 165 175 TD (seconds) 48 48 59 91 109 115 128 142 151 178 251
It might be more informative to find out if the difference between the fastest solution of a puzzle by a
given child and his slowest is a measure with some regularity among the groups, as it appears in the
Table 8.20. Again, the smallest difference ranged from 48 to 62, whereas the biggest ranged from 163
to 178 seconds. This shows, first of all, that children in all groups seemed to perform within similar
ranges, with the same variability between the individual fastest and slowest game. Secondly, the group
with the most extreme values is the TD. And finally, some puzzles took more time to solve than
others. The design of the experiment guaranteed that there had to be a learning curve, due to the
difficulty of the rules. Data showed most of the slowest responses occurred in the first game played, as
expected.
In general, the average speed in each group was similar, and although the ASD and TD groups had the
most different values, the median speed happened to be the same. Regarding speed in general, it could
be said that children in all groups performed in a similar pattern.
begonapino.com
Pino, B. (2006) "Computers as an environment for facilitating social interaction in children with autistic spectrum disorders". PhD Thesis, University of Edinburgh, UK
195
8.8.2 Fastest
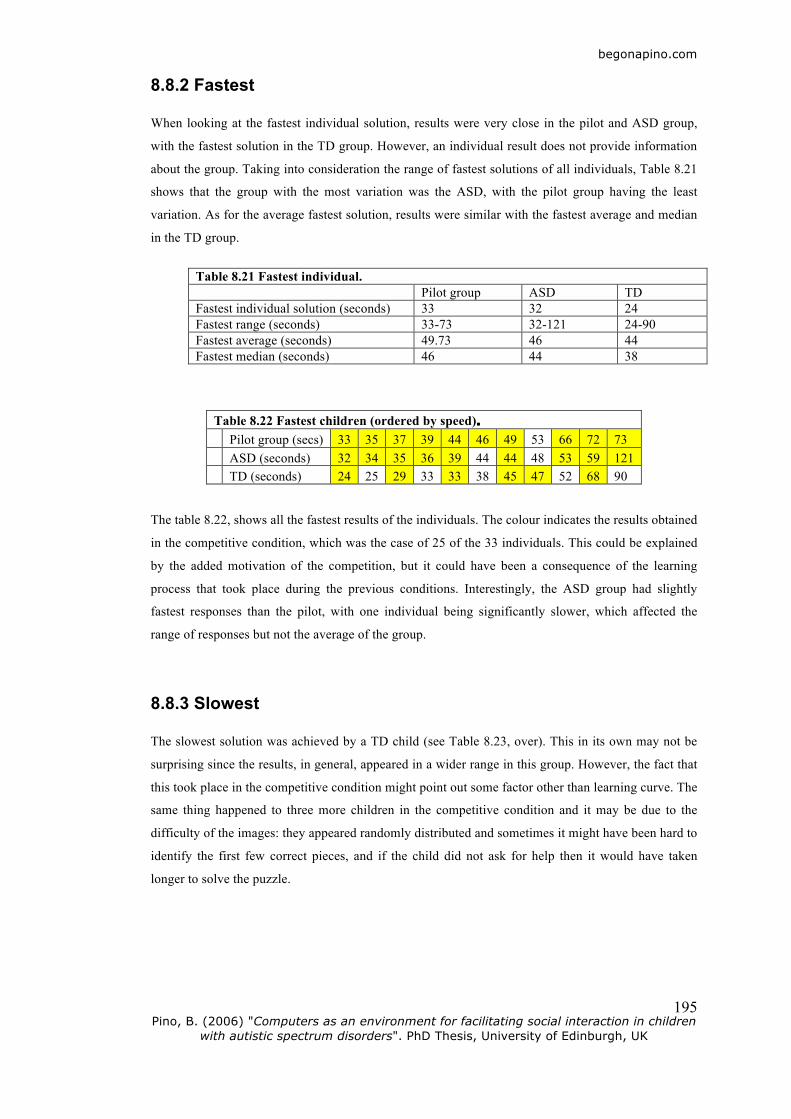
When looking at the fastest individual solution, results were very close in the pilot and ASD group,
with the fastest solution in the TD group. However, an individual result does not provide information
about the group. Taking into consideration the range of fastest solutions of all individuals, Table 8.21
shows that the group with the most variation was the ASD, with the pilot group having the least
variation. As for the average fastest solution, results were similar with the fastest average and median
in the TD group.
Table 8.21 Fastest individual. Pilot group ASD TD Fastest individual solution (seconds) 33 32 24 Fastest range (seconds) 33-73 32-121 24-90 Fastest average (seconds) 49.73 46 44 Fastest median (seconds) 46 44 38
Table 8.22 Fastest children (ordered by speed). Pilot group (secs) 33 35 37 39 44 46 49 53 66 72 73 ASD (seconds) 32 34 35 36 39 44 44 48 53 59 121 TD (seconds) 24 25 29 33 33 38 45 47 52 68 90
The table 8.22, shows all the fastest results of the individuals. The colour indicates the results obtained
in the competitive condition, which was the case of 25 of the 33 individuals. This could be explained
by the added motivation of the competition, but it could have been a consequence of the learning
process that took place during the previous conditions. Interestingly, the ASD group had slightly
fastest responses than the pilot, with one individual being significantly slower, which affected the
range of responses but not the average of the group.
8.8.3 Slowest
The slowest solution was achieved by a TD child (see Table 8.23, over). This in its own may not be
surprising since the results, in general, appeared in a wider range in this group. However, the fact that
this took place in the competitive condition might point out some factor other than learning curve. The
same thing happened to three more children in the competitive condition and it may be due to the
difficulty of the images: they appeared randomly distributed and sometimes it might have been hard to
identify the first few correct pieces, and if the child did not ask for help then it would have taken
longer to solve the puzzle.

begonapino.com
Pino, B. (2006) "Computers as an environment for facilitating social interaction in children with autistic spectrum disorders". PhD Thesis, University of Edinburgh, UK
196
In any case, the observation of when this ‘slowest’ solutions took place is more enlightening. As it can
be seen in Table 8.24 (below), the grey colour represents the first game played in the session,
regardless the condition. darker grey represents the first game of the second condition (regardless
which one they started with, assistive or collaborative), and white represents any game during the
competitive condition. Interestingly enough, none of the slowest marks obtained by the four children
during the competitive condition actually happened in the first game of that condition. What the table
shows is that the slowest speeds happened in 23 out of 33 cases during the first game. This can be
explained by the fact that during the first few games children were learning the rules of the game.
Table 8.24 Slowest game. Pilot group (secs) 93 99 103 107 109 116 126 145 147 156 229 ASD (seconds) 94 105 112 131 148 160 169 171 201 228 246 TD (seconds) 72 86 88 116 148 177 180 198 211 232 296
8.8.4 Assisted vs. Collaborative
The analysis of the slowest game required the analysis of the first game of all children in detail. In the
table 8.25 results are presented in increasing order, the grey colour represents those who did the
assistive condition first, whereas the white represents those who did the collaboration first. A glance at
the fastest side of the table shows a bias towards the collaborative condition, which is to say, those
who did the collaborative condition first were a little faster than those who did the assistive condition
first. This can be due to the scaffolding role of the experimenter, who acted as a partner in the
collaborative condition and may have been able to place pieces a little faster than the child.
Table 8.25 Speed in the first game. average median Pilot (secs) 75 93 99 103 107 114 116 145 147 156 229 125 114 ASD (secs) 69 79 94 105 112 137 148 157 201 228 246 143 137 TD (seconds) 47 72 73 81 107 116 177 180 198 211 232 136 116
When comparing the three groups, the average speed of the pilot group was the fastest, followed by
the TD and then the ASD group, with similar values. The difference between the ASD group and the
other two appears to be greater when looking at the median. However, data show a similar pattern
within each of the groups, which is consistent with the previous results.
Table 8.23 Slowest individual. Pilot group ASD TD Slowest individual solution (seconds) 242 246 296 232 Slowest average (seconds) 137.8 148.5 178 150.8 Slowest median (seconds) 116 164.5 164.1 162.5 Slowest range (seconds) 93-242 94-246 72-296 72-232

begonapino.com
Pino, B. (2006) "Computers as an environment for facilitating social interaction in children with autistic spectrum disorders". PhD Thesis, University of Edinburgh, UK
197
Table 8.26 Average speed in first game. Pilot group ASD TD Assisted (seconds) 144.2 183.4 153.3 Collaborative (seconds) 111 102 115
If data were broken down into assisted and collaborative conditions (see Table 8.26), then it would
appear that the ASD group was distinctively slower than the other two groups in the first game of the
assistive condition and slightly faster than the other two in the collaborative condition. In fact, all
groups were faster in the collaborative condition, which may be due to the experimenter’s scaffolding
mentioned before. The most extreme values in the ASD condition could be due to the higher difficulty
of some individuals in understanding and, therefore, applying the rules, since they were delivered
verbally. However, it could have been due to just a couple of children being a little unlucky with their
first game.
8.8.5 Conclusion
The TD group seemed to have a slight broader range of performance, in general, but the pattern of
performance in the three groups was similar. The slowest games tended to occur in the first game of
all, regardless the condition, as it could be expected when learning a new game, although those who
did the collaboration took a little less time, maybe due to the contribution of the experimenter. These
results, together with the lack of statistically significant differences, seem to point out that the
performance of the three groups was similar, despite the differences in design and type of children.