ch07 - the normal distribution - rick jerz homepage · · 2018-04-30goals • understand the...
TRANSCRIPT

TheNormalProbabilityDistribution
Chapter7Dr.RichardJerz
1 © 2016 rjerz.com

Goals
• Understandthedifferencebetweendiscreteandcontinuous distributions.
• Computethemean,standarddeviation,andprobabilitiesforauniformdistribution.
• Listthecharacteristicsofthenormalprobabilitydistribution.
• Defineandcalculatezvalues.• Determinetheprobabilityanobservationisabove orbelow apoint,orisbetween twopointsonanormalprobabilitydistribution.
2 © 2016 rjerz.com

Adistribution
10
9 9
6
012345678910
1 2 3 4 5 6
Coun
t
#inBag
#ofGreenM&M'sinBag
3 © 2016 rjerz.com

ADiscreteProbabilityDistribution
4 © 2016 rjerz.com

ResultsofTossingTwoDice
5 © 2016 rjerz.com

Probabilitiesinvolve…
• Areasofinterestunderaprobabilitydistribution
• “Areaunderthecurve”• Totalarea=1• Wecanmakethewidthofeachbar=1
• Area=lengthxwidth• Exactlythesameasaddinguptheheights
• Example:.167x1=.167
6 © 2016 rjerz.com

BinomialDistribution:n,x,π
7 © 2016 rjerz.com

ExcelModel
8 © 2016 rjerz.com

A“Continuous”ProbabilityDistribution(weights)
Brown M&M's
0.000.050.100.150.200.250.300.350.400.45
0 1 2 3 4 5 6 7 8 9 10
Per Bag
Perc
ent
a
9 © 2016 rjerz.com

ANY“continuous”probabilitydistribution
• Centraltendency• Dispersion• Probabilityquestions
• “Areaundercurve”
Brown M&M's
0.000.050.100.150.200.250.300.350.400.45
0 1 2 3 4 5 6 7 8 9 10
Per BagPe
rcen
t
a
10 © 2016 rjerz.com

SimpleContinuousDistributionTheUniformDistribution
• Theuniformprobabilitydistributionisperhapsthesimplestdistributionforacontinuousrandomvariable.
• Thisdistributionisrectangularinshapeandisdefinedbyminimumandmaximumvalues.
• Totalarea=1(LxH=1)• (b-a)*(1/(b-a))=1
11 © 2016 rjerz.com

TheUniformDistribution:MeanandStandardDeviation
12 © 2016 rjerz.com

Example:UniformDistribution
SouthwestArizonaStateUniversityprovidesbusservicetostudentswhiletheyareoncampus.AbusarrivesattheNorthMainStreetandCollegeDrivestopevery30minutesbetween6A.M.and11P.M.duringweekdays.Studentsarriveatthebusstopatrandomtimes.Thetimethatastudentwaitsisuniformlydistributedfrom0to30minutes.
• Drawagraphofthisdistribution.• Howlongwillastudent“typically”havetowaitforabus?In
otherwordswhatisthemeanwaitingtime?Whatisthestandarddeviationofthewaitingtimes?
• Whatistheprobabilityastudentwillwaitmorethan25minutes?
• Whatistheprobabilityastudentwillwaitbetween10and20minutes?
13 © 2016 rjerz.com

TheUniformDistributionExample
• Draw a graph of this distribution.
• Area = 1, L=30-0, H=1/(30-0) = .0333
14 © 2016 rjerz.com

TheUniformDistribution–Example
• Howlongwillastudent“typically”havetowaitforabus?Inotherwordswhatisthemeanwaitingtime?Whatisthestandarddeviationofthewaitingtimes?
15 © 2016 rjerz.com
TheUniformDistributionExample
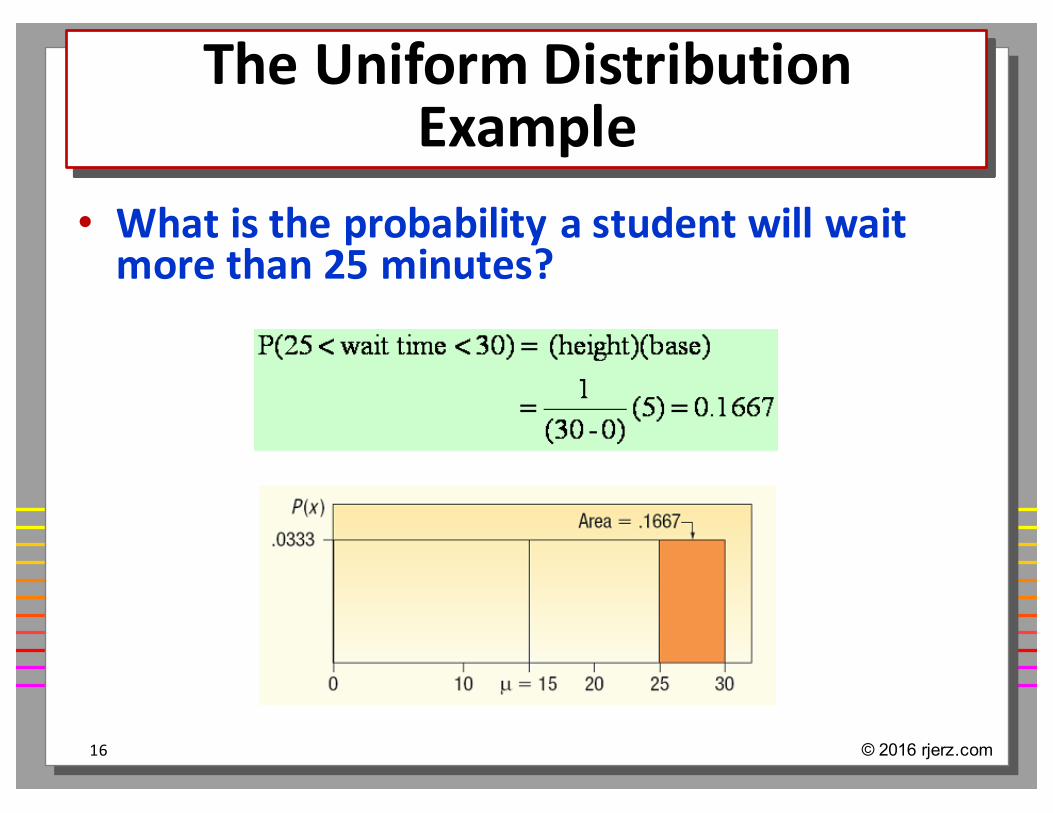
• Whatistheprobabilityastudentwillwaitmorethan25minutes?
16 © 2016 rjerz.com

TheUniformDistributionExample
• Whatistheprobabilityastudentwillwaitbetween10and20minutes?
17 © 2016 rjerz.com

TheNormalProbabilityDistribution
18 © 2016 rjerz.com

TheNormalDistribution–Graphically
19 © 2016 rjerz.com

CharacteristicsofaNormalProbabilityDistribution
• Itisbell-shaped andhasasinglepeakatthecenterofthedistribution.
• Thearithmeticmean,median,andmode areequal• Thetotalareaunderthecurveis1.00;halftheareaunderthenormalcurveistotherightofthiscenterpointandtheotherhalftotheleftofit.
• Itissymmetrical aboutthemean.• Itisasymptotic:ThecurvegetscloserandclosertotheX-axisbutneveractuallytouchesit.Toputitanotherway,thetailsofthecurveextendindefinitelyinbothdirections.
• Thelocation ofanormaldistributionisdeterminedbythemean,µ, thedispersionorspreadofthedistributionisdeterminedbythestandarddeviation,σ .
20 © 2016 rjerz.com

Whatdataisnormallydistributed?
• Examscores• Height• Weight• Amountofcoffeedispensed
• Manysituations!
21 © 2016 rjerz.com

“Bell”shape
22 © 2016 rjerz.com

TheNormalDistribution–Families
23 © 2016 rjerz.com

TheEmpiricalRule
• About68percentoftheareaunderthenormalcurveiswithinonestandarddeviationofthemean.
• About95percentiswithintwostandarddeviationsofthemean.
• Practicallyalliswithinthreestandarddeviationsofthemean.
24 © 2016 rjerz.com

TheEmpiricalRule- Example
Aspartofitsquality assuranceprogram, theAutoliteBatteryCompanyconducts testsonbattery life.ForaparticularD-cellalkalinebattery, themeanlifeis19hours.Theusefullifeofthebatteryfollowsanormal distributionwithastandard deviation of1.2hours.
Answerthefollowingquestions.• About68percentofthe
batteries failedbetweenwhattwovalues?
• About95percentofthebatteries failedbetweenwhattwovalues?
• Virtually allofthebatteriesfailedbetweenwhattwovalues?
25 © 2016 rjerz.com

NormalDistributionandStandard NormalDistribution
26 © 2016 rjerz.com

TheStandardNormalProbabilityDistribution
• Thestandardnormalprobabilitydistributionisanormalprobabilitydistributionwithameanof0andastandarddeviationof1.
• Itisalsocalledthezdistribution.• Az-valueisthedistancebetweenaselectedvalue,designatedX,andthepopulationmeanµ,dividedbythepopulationstandarddeviation,σ.
• Theformulais:
27 © 2016 rjerz.com

AreasUndertheNormalCurve
28 © 2016 rjerz.com

Usingtablefrombackoftextbook
29 © 2016 rjerz.com

TheNormalDistribution–Example
Theweeklyincomesofshiftforemenintheglassindustryfollowthenormalprobabilitydistributionwithameanof$1,000andastandarddeviationof$100.Whatisthezvaluefortheincome,let’scallitX,ofaforemanwhoearns$1,100perweek?Foraforemanwhoearns$900perweek?
30 © 2016 rjerz.com
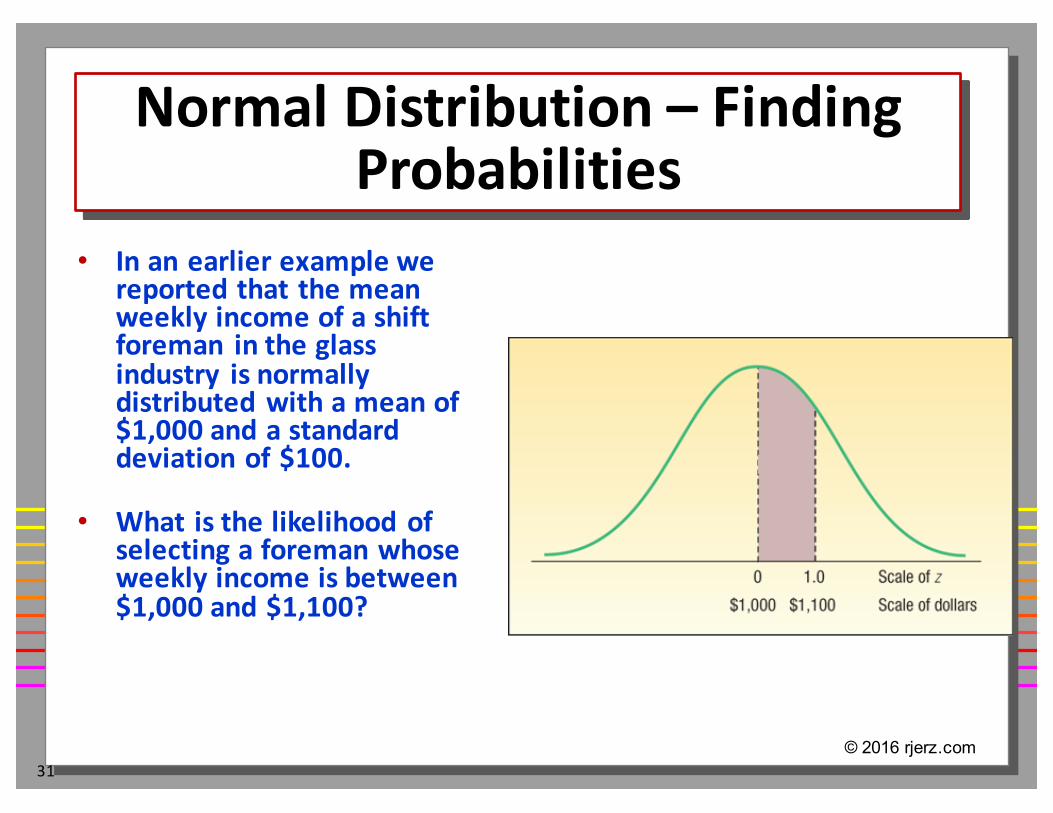
NormalDistribution– FindingProbabilities
• Inanearlierexamplewereportedthatthemeanweeklyincomeofashiftforeman intheglassindustry isnormallydistributedwithameanof$1,000andastandarddeviationof$100.
• Whatisthelikelihoodofselectingaforemanwhoseweeklyincomeisbetween$1,000and$1,100?
31© 2016 rjerz.com

NormalDistributionFindingProbabilities
32 © 2016 rjerz.com

FindingAreasforZUsingExcel
The Excel function=NORMDIST(x,Mean,Standard_dev,Cumu)=NORMDIST(1100,1000,100,true)generates area (probability) fromZ=1 and below
33 © 2016 rjerz.com

FindingProbabilities(Example2)
• Refertotheinformationregarding theweeklyincomeofshiftforemenintheglassindustry.Thedistribution ofweeklyincomes followsthenormal probabilitydistribution withameanof$1,000andastandarddeviationof$100.
• Whatistheprobability ofselectingashiftforemanintheglass industrywhoseincomeis:
• Between$790and$1,000?
34© 2016 rjerz.com

FindingProbabilities(Example3)
Refertotheinformationregardingtheweeklyincomeofshiftforemenintheglassindustry.Thedistributionofweeklyincomesfollowsthenormalprobabilitydistributionwithameanof$1,000andastandarddeviationof$100.
Whatistheprobabilityofselectingashiftforemanintheglassindustrywhoseincomeis:
Lessthan$790?
35 © 2016 rjerz.com