ch01 im for prod · preface ©2015 pearson education, inc. viii new digital features located in...
TRANSCRIPT

©2015 Pearson Education, Inc.
Contents
Part 1: Introduction Chapter 1 Economics: Foundations and Models 1
Appendix: Using Graphs and Formulas 11
Chapter 2 Trade-offs, Comparative Advantage, and the Market System 25
Chapter 3 Where Prices Come From: The Interaction of Demand and Supply 43
Chapter 4 Economic Efficiency, Government Price Setting, and Taxes 69
Appendix: Quantitative Demand and Supply Analysis 76
Part 2: Markets in Action: Policy and Applications Chapter 5 Externalities, Environmental Policy, and Public Goods 97
Chapter 6 Elasticity: The Responsiveness of Demand and Supply 121
Chapter 7 The Economics of Health Care 147
Part 3: Firms in the Domestic and International Economies Chapter 8 Firms, the Stock Market, and Corporate Governance 165
Appendix: Tools to Analyze Firms’ Financial Information 175
Chapter 9 Comparative Advantage and the Gains from International Trade 189
Part 4: Microeconomic Foundations: Consumers and Firms Chapter 10 Consumer Choice and Behavioral Economics 209
Appendix: Using Indifference Curves and Budget Lines to Understand Consumer Behavior 217
Chapter 11 Technology, Production, and Costs 233
Appendix: Using Isoquants and Isocost Lines to Understand Production and Cost 244

Contents
©2015 Pearson Education, Inc.
iv
Part 5: Market Structure and Firm Strategy Chapter 12 Firms in Perfectly Competitive Markets 267
Chapter 13 Monopolistic Competition: The Competitive Model in a More Realistic Setting 293
Chapter 14 Oligopoly: Firms in Less Competitive Markets 313
Chapter 15 Monopoly and Antitrust Policy 335
Chapter 16 Pricing Strategy 359
Part 6: Labor Markets, Public Choice, and the Distribution of Income Chapter 17 The Markets for Labor and Other Factors of Production 373
Chapter 18 Public Choice, Taxes, and the Distribution of Income 401
Part 7: Macroeconomic Foundations and Long-Run Growth Chapter 19 GDP: Measuring Total Production and Income 421
Chapter 20 Unemployment and Inflation 441
Chapter 21 Economic Growth, the Financial System, and Business Cycles 469
Chapter 22 Long-Run Economic Growth: Sources and Policies 489
Part 8: Short-Run Fluctuations Chapter 23 Aggregate Expenditure and Output in the Short Run 511
Appendix: The Algebra of Macroeconomic Equilibrium 524
Chapter 24 Aggregate Demand and Aggregate Supply Analysis 537
Appendix: Macroeconomic Schools of Thought 548
Part 9: Monetary and Fiscal Policy Chapter 25 Money, Banks, and the Federal Reserve System 561
Chapter 26 Monetary Policy 585
Chapter 27 Fiscal Policy 613
Appendix: A Closer Look at the Multiplier 620
Chapter 28 Inflation, Unemployment, and Federal Reserve Policy 645

Contents
©2015 Pearson Education, Inc.
v
Part 10: The International Economy Chapter 29 Macroeconomics in an Open Economy 667
Chapter 30 The International Financial System 691
Appendix: The Gold Standard and the Bretton Woods System 697


©2015 Pearson Education, Inc.
Preface Features of this Instructor’s Manual
Each chapter of this Instructor’s Manual contains the following elements:
Chapter Summary: An overview of the main economic concepts covered.
Learning Objectives: A list of the student learning goals listed at the beginning of each text chapter.
Chapter Outline with Teaching Tips: Detailed descriptions of the economic concepts in the book, key term definitions, and teaching tip boxes. The teaching tip boxes include recommendations on how to integrate key figures.
Extra Solved Problems: Each chapter of the main text has a Solved Problem to support two of the chapter’s learning objectives. This Instructor’s Manual includes Solved Problems for the remaining learning objectives. You can assign these extra Solved Problems as homework or present them during classroom lectures.
Extra Economics in Your Life: Each chapter of the book opens and closes with a special feature entitled Economics in Your Life that emphasizes the connection between the material and the students’ personal experiences and questions. This Instructor’s Manual includes an extra Economics in Your Life for each chapter to present in class.
Extra Making the Connection: Each chapter of the main text has two or more Making the Connection features to provide real-world reinforcement of key concepts. This Instructor’s Manual includes extra Making the Connections to present in class.
Solutions to Review Questions and Problems and Applications: Each chapter of this Instructor’s Manual includes solutions to all questions and problems in the main text:
Solutions to the two Thinking Critically questions that accompany the An Inside Look newspaper feature located at the end of each chapter
Solutions to the end-of-chapter Review Questions Solutions to the end-of-chapter Problems and Applications
Revisions to the Digital Assets and to the Main Text
If you used Hubbard/O’Brien, Economics, fourth edition, here are a summary of the new digital assets available and a Transition Guide, with page numbers, that shows the changes the authors made to the main text. Knowing about these changes will help you revise your current teaching notes and class presentations.

Preface
©2015 Pearson Education, Inc.
viii
New digital features located in MyEconLab MyEconLab is a unique online course management, testing, and tutorial resource. It is included with the e-text version of the book or as a supplement to the print book. Students and instructors will find the following new online resources to accompany the fifth edition:
Videos: There are approximately 100 Making the Connection features in the book that provide real-world reinforcement of key concepts. Each feature is now accompanied by a short video of the author explaining the key point of that Making the Connection. Each video is approximately two minutes long and includes visuals, such as new photos or graphs, that are not in the main book. The goal of these videos is to summarize key content and bring the applications to life. Our experience is that many students benefit from this type of online learning.
Concept Checks: Each section of every chapter concludes with an online Concept Check that contains one or two multiple choice, true/false, or fill-in questions. These checks act as “speed bumps” that encourage students to stop and check their understanding of fundamental terms and concepts before moving on to the next section. The goal of this digital resource is to help students assess their progress on a section-by-section basis, so they can be better prepared for homework, quizzes, and exams.
Animations: Graphs are the backbone of introductory economics, but many students struggle to understand and work with them. Each numbered figure in the text has a supporting animated version online. The goal of this digital resource is to help students understand shifts in curves, movements along curves, and changes in equilibrium values. Having an animated version of a graph helps students who have difficulty interpreting the static version found in the printed text.
Interactive Solved Problems: Many students have difficulty applying economic concepts to solving problems. The goal of this digital resource is to help students overcome this hurdle by giving them a model of how to solve an economic problem by breaking it down step by step. Each Solved Problem is accompanied by a similar problem online, so students can have more practice and build their problem-solving skills. These interactive tutorials help students learn to think like economists and apply basic problem-solving skills to homework, quizzes, and exams. The goal is for students to build skills they can use to analyze real-world economic issues they hear and read about in the news.
Graphs Updated with Real-Time Data from FRED: Figure 7.5, “Spending on Health Care around the World,” Figure 8.2, “Movements in Stock Market Indexes,” and Figures 9.1 and 9.3, both on international trade, are continuously updated online with the latest available data from FRED (Federal Reserve of Economic Data), which is a comprehensive, up-to-date data set maintained by the Federal Reserve Bank of St. Louis. Students can display a pop-up graph that shows new data plotted in the graph. The goal of this digital feature is to help students understand how to work with data and understand how including new data affects graphs.
Interactive Problems and Exercises Updated with Real-Time Data from FRED: Chapter 8, “Firms, the Stock Market, and Corporate Governance,” includes two real-time data exercises that use the latest data from FRED. The goal of this digital feature is to help students become familiar with this key data source, learn how to locate data, and develop skills in interpreting data.

Preface
©2015 Pearson Education, Inc.
ix
Transition Guide: Hubbard/O’Brien 4th Edition versus the New 5th Edition
Chapter 1: Economics: Foundations and Models 4e page 4e Content 5e page 5e Content 3 Why Are Some Doctors Leaving
Private Practice? 3 NEW: Is the Private Doctor’s Office Going to
Disappear? 20–21 Inside Look: Doctors Moving Less,
Retiring Later 18–19 NEW Inside Look: Look into Your Smartphone
and say “Ahh”
Chapter 2: Trade-offs, Comparative Advantage, and the Market System 4e page 4e Content 5e page 5e Content 39 Managers Making Choices at BMW 37 NEW Managers at Tesla Motors Face Trade-offs 42 Solved Problem 2.1: Drawing a
Production Possibilities Frontier for Rosie’s Boston Bakery
40 Solved Problem 2.1: Drawing a Production Possibilities Frontier for Tesla Motors
43 Making the Connection: Facing Trade-offs in Health Care Spending
n/a Moved to 5e IM
49 NEW Making the Connection: Comparative Advantage, Opportunity Cost, and Housework
57 NEW Making the Connection: Who Owns The Wizard of Oz?
60–61 Inside Look: Managers at General Motors Approve Production of a Plug-in Cadillac
60–61 NEW Inside Look: What’s on the Horizon at Mercedes-Benz
Chapter 3: Where Prices Come From: The Interaction of Demand and Supply 4e page 4e Content 5e page 5e Content 69 The Tablet Computer Revolution 69 NEW: Smartphones: The Indispensible Product? 73 Making the Connection: Are Quiznos
Sandwiches Normal Goods and Subway Sandwiches Interior Goods?
n/a Moved to 5e IM
73 NEW Making the Connection: Are Tablet Computers Substitutes for E-Readers?
74 Making the Connection: The Aging of the Baby Boom Generation
Moved to 5e IM
74 NEW Making the Connection: Coke and Pepsi Are Hit by U.S. Demographics
77 Making the Connection: Forecasting the Demand for iPads
Moved to 5e IM
77 NEW Making the Connection: Forecasting the Demand for iPhones
88 Solved Problem 3.4: High Demand and Low Prices in the Lobster Market?
Moved to 5e IM
88–89 NEW Solved Problem 3.4: What Has Caused the Decline in Beef Consumption?
92–93 Inside Look: Will Shortage of Display Screens Derail Computer Tablet Sales?
92–93 New Inside Look: Google and Apple Face Demand and Supply Concerns in the Smartphone Market

Preface
©2015 Pearson Education, Inc.
x
Chapter 4: Economic Efficiency, Government Price Setting, and Taxes 4e page 4e Content 5e page 5e Content 101 Should the Government Control
Apartment Rents? 101 NEW: The Sharing Economy, Phone Apps, and
Rent Control 122–123 Inside Look: .and the Rent-
Controlled Apartment Goes to…Actress Faye Dunaway!
122–123 NEW Inside Look: Does the Sharing Economy Increase Efficiency?
Chapter 5: Externalities, Environmental Policy, and Public Goods 4e page 4e Content 5e page 5e Content 148 Solved Problem 5.3 Moved to 5e IM 150–151 NEW Solved Problem 5.3: Dealing with the
Externalities of Car Driving 152 NEW section: The End of the Sulfur Dioxide
Cap-and-Trade System 162–163 Inside Look: Pros and Cons of
Tougher Air Pollution Regulation n/a See MyEconLab for current news articles,
summaries, and questions for Chapter 5 onward.
Chapter 6: Elasticity: The Responsiveness of Demand and Supply 4e page 4e Content 5e page 5e Content 184–185 Making the Connection: Determining
the Price Elasticity of Demand through Market Experiments
n/a Moved to 5e IM
187 Price Elasticity, Cross-Price Elasticity, and Income Elasticity in the Market for Alcoholic Beverages
186 Heavily revised
196–197 Inside Look: Gasoline Price Increases Change Consumer Spending Patterns, May Stall Recovery
n/a See MyEconLab for current news articles, summaries, and questions.
Chapter 7: The Economics of Health Care 4e page 4e Content 5e page 5e Content 205 Small Businesses Feel the Pinch of
Escalating Health Care Costs 205 NEW: How Much Will You Pay for Health
Insurance? 205 Why is it difficult for people who are
seriously ill to buy health insurance? 205 NEW: Is Your Take-Home Pay Affected by What
Your Employer Spends on Your Health Insurance?
208 Figure 7.1: The Average Height of Adult Males
n/a Cut
209 Figure 7.3, Sources of Health Insurance
209 Now Figure 7.2. Figure converted from a pie chart to bar graphs.
216–217 NEW Solved Problem 7.3: If You Are Young and Healthy, Should You Buy Health Insurance?
217 Solved Problem 7.3: Dealing with Adverse Selection
n/a Moved to 5e IM
218 NEW Figure 7.4, “The Effect of a Positive Externality on the Market for Vaccinations” plus analysis.
222 NEW Making the Connection: Are U.S. Firms Handicapped by Paying for Their Employees’ Health Insurance (previously in Chapter 17). Includes a demand and supply graph.

Preface
©2015 Pearson Education, Inc.
xi
4e page 4e Content 5e page 5e Content 225 NEW Figure 7.8, “The Effect of the Third-Party
Payer System on the Demand for Medical Services” plus analysis.
227 Making the Connection: Health Exchanges, Small Businesses, and Rising Medical Costs
n/a Moved to 5e IM
230–231 Inside Look: Health Care Spending Expected to Increase 70 Percent by End of Decade
n/a See MyEconLab for current news articles, summaries, and questions.
Chapter 8: Firms, the Stock Market, and Corporate Governance
Chapter 9: Comparative Advantage and the Gains from International Trade 4e page 4e Content 5e page 5e Content 273 Does the Federal Government’s ‘Buy
American’ Policy Help U.S. Firms? 271 NEW: Saving Jobs in the U.S. Tire Industry?
273 Have You Heard of the ‘buy American’ provision?
271 Have You Heard of the Tariff on Chinese Tires?
276 Making the Connection: How Caterpillar Depends on International trade
n/a Moved to 5e IM
273 NEW Making the Connection: Goodyear and the Tire Tariff
291 Making the Connection: Save Jobs Making Hangers…and Lose Jobs in Dry Cleaning
Moved to 5e IM
289 NEW Making the Connection: The Effect on the Economy of the Tariff on Chinese Tires
298–299 Inside Look: Did Home Depot Knowingly Defy the “Buy American” Policy?
n/a See MyEconLab for current news articles, summaries, and questions.
4e page 4e Content 5e page 5e Content 237 How Can You Buy a Piece of
Facebook? 237 NEW: Facebook Learns the Benefits and Costs of
Becoming a Publicly Owned Firm 240 Making the Connection: How
Important Are Small Businesses to the U.S. Economy
240 NEW graph added to this Making the Connection
242 Solved Problem 8.2: Does the Principal-Agent Problem Apply to the Relationship between Managers and Employees?
n/a Moved to the 5e IM
242 NEW Solved Problem 8.2: Should a Firm’s CEO Also Be the Chairman of the Board?
253 Making the Connection: Are Buyers of Facebook Stock Getting a Fair Deal?
CUT.
254 NEW Making the Connection: The Ups and Downs of Investing in Facebook
256–257 Inside Look: Shares of Private Companies Available to Qualified Investors
n/a See MyEconLab for current news articles, summaries, and questions.

Preface
©2015 Pearson Education, Inc.
xii
Chapter 10: Consumer Choice and Behavioral Economics 4e page 4e Content 5e page 5e Content 309 Can Justin Bieber and Ozzy
Osbourne Get you to Shop at Best Buy?
305 NEW: J.C. Penney Learns That Simplifying Prices Isn’t Simple
321–322 Making the Connection: Why Do Firms Pay Tom Brady to Endorse Their Products?
317–318 This content is integrated into a paragraph.
326 NEW section on The Behavioral Economics of Shopping
327 NEW Making the Connection: J.C. Penney Meets Behavioral Economics
330 Solved Problem 10.4: How Do You Get People to Save More of Their Income?
Moved to 5e IM
332–333 Inside Look: Findings Are Mixed on the Success of Celebrity Endorsements
See MyEconLab for current news articles, summaries, and questions.
Chapter 11: Technology, Production, and Costs 4e page 4e Content 5e page 5e Content 353 Sony Uses a Cost Curve to
Determine the Prices of Radios 351 NEW: Fracking, Marginal Costs, and Energy
Prices 369 Long-Run Average Cost Curves for
Bookstores 367 Revised to Long-Run Average Cost Curves for
Automobile Factories 374–375 Inside Look: New Technology Could
Lower the Cost of Solar Panels See MyEconLab for current news articles,
summaries, and questions.
Chapter 12: Firms in Perfectly Competitive Markets 4e page 4e Content 5e page 5e Content 407 Making the Connection Losing
Money in the Medical Screening Industry
Moved to 5e IM
402–403 NEW Making the Connection: Losing Money in the Solar Panel Industry
408–409 Solved Problem 12.4: When to Pull the Plug on a Movie
404–405 NEW Solved Problem 12.4: When to Pull the Plug on a Movie
422–423 Inside Look: Organic Farming on the Decline in the United Kingdom
See MyEconLab for current news articles, summaries, and questions.
Chapter 13: Monopolistic Competition: The Competitive Model in a More Realistic Setting 4e page 4e Content 5e page 5eContent 444–445 Making the Connection: Netflix:
Differentiated Enough to Survive? Moved to 5e IM
438 NEW Making the Connection: Peter Theil, e-Cigarettes, and the Monopoly in Monopolistic Comeptition
450–451 Inside Look: Starbucks Expands Into Juice Business
See MyEconLab for current news articles, summaries, and questions.

Preface
©2015 Pearson Education, Inc.
xiii
Chapter 14: Oligopoly: Firms in Less Competitive Markets 4e page 4e Content 5e page 5e Content 459 Competition in the Computer Market 451 NEW: Competition in the Video Game Console
Market
465 Solved Problem 14.2: Is Advertising a Prisoner’s Dilemma for Coca-Cola and Pepsi?
Moved to 5e IM
447–458 NEW Solved Problem 14.2: Is Same-Day Delivery a Prisoner’s Dilemma for Wal-Mart and Amazon?
475 Figure 14.8: Five Competitive Forces Model
CUT
478–479 Inside Look: Can Intel’s “Ultrabook” Compete with Apple’s MacBook Air?
See MyEconLab for current news articles, summaries, and questions.
Chapter 15: Monopoly and Antitrust Policy 4e page 4e Content 5e page 5e Content 487 Is Cable Television a Monopoly? 477 NEW A Monopoly on Lobster Dinners in Maine? 487 Why Can’t I Watch the NFL
Network? 477 Is There a Monopoly in Your Dorm?
490 Making the Connection: The End of the Christmas Plant Monopoly
Moved to 5e IM
480–481 NEW Making the Connection: Does Hasbro Have a Monopoly on Monopoly?
494 Solved Problem 15.2: Is the OpenTable Web Site a Natural Monopoly?
Moved to 5e IM
484–485 NEW Solved Problem 15.2: Can a Restaurant Be a Natural Monopoly?
507 Making the Connection: Should AT&T Have Been Allowed to Merge with T-Mobile?
Moved to IM
494–495 NEW Making the Connection: Did Apple Violate the Law in Pricing e-Books?
510–511 Inside Look: The End of the Cable TV Monopoly?
See MyEconLab for current news articles, summaries, and questions.
Chapter 16: Pricing Strategy 4e page 4e Content 5e page 5e Content 530 Making the Connection: Price
Discrimination with a Twist at Netflix
Moved to 5e IM
518–519 NEW Making the Connection: The Internet Leaves You Open to Price Discrimination
538–539 Inside Look: Paying for the Right to Pay to See the Kansas Jayhawks Play Football
See MyEconLab for current news articles, summaries, and questions.
Preface
©2015 Pearson Education, Inc.
xiv
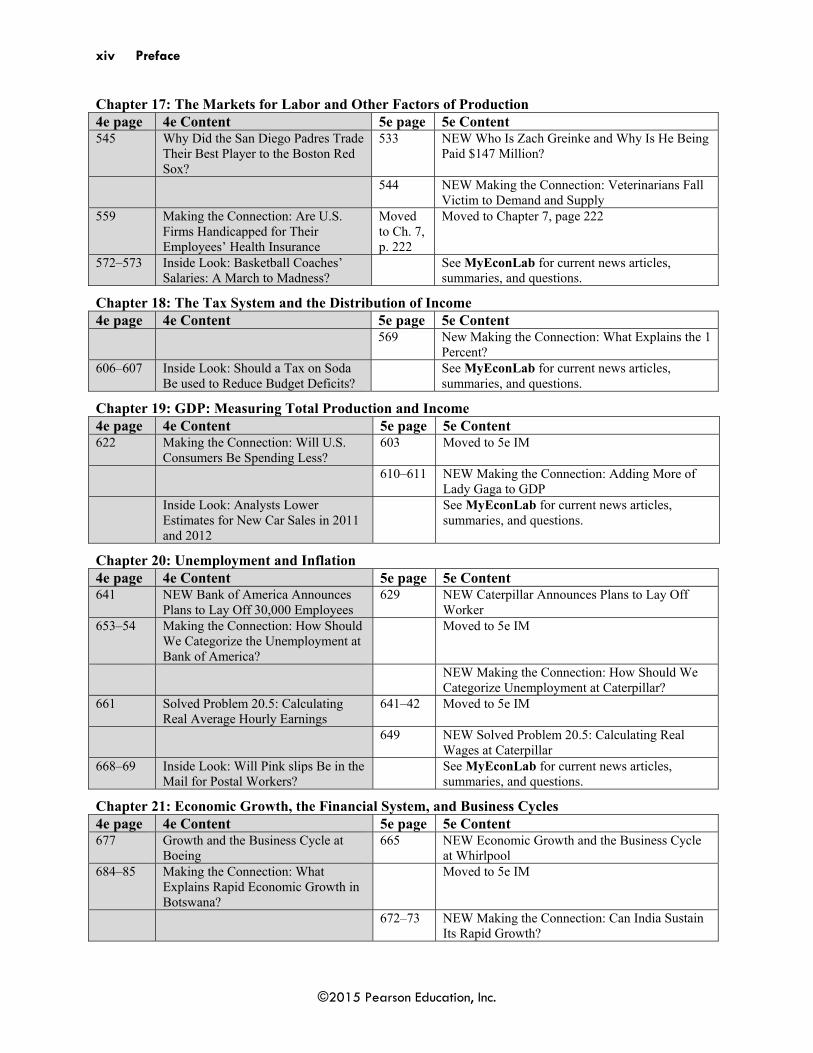
Chapter 17: The Markets for Labor and Other Factors of Production 4e page 4e Content 5e page 5e Content 545 Why Did the San Diego Padres Trade
Their Best Player to the Boston Red Sox?
533 NEW Who Is Zach Greinke and Why Is He Being Paid $147 Million?
544 NEW Making the Connection: Veterinarians Fall Victim to Demand and Supply
559 Making the Connection: Are U.S. Firms Handicapped for Their Employees’ Health Insurance
Moved to Ch. 7, p. 222
Moved to Chapter 7, page 222
572–573 Inside Look: Basketball Coaches’ Salaries: A March to Madness?
See MyEconLab for current news articles, summaries, and questions.
Chapter 18: The Tax System and the Distribution of Income 4e page 4e Content 5e page 5e Content 569 New Making the Connection: What Explains the 1
Percent? 606–607 Inside Look: Should a Tax on Soda
Be used to Reduce Budget Deficits? See MyEconLab for current news articles,
summaries, and questions.
Chapter 19: GDP: Measuring Total Production and Income
Chapter 20: Unemployment and Inflation
Chapter 21: Economic Growth, the Financial System, and Business Cycles 4e page 4e Content 5e page 5e Content 677 Growth and the Business Cycle at
Boeing 665 NEW Economic Growth and the Business Cycle
at Whirlpool 684–85 Making the Connection: What
Explains Rapid Economic Growth in Botswana?
Moved to 5e IM
672–73 NEW Making the Connection: Can India Sustain Its Rapid Growth?
4e page 4e Content 5e page 5e Content 622 Making the Connection: Will U.S.
Consumers Be Spending Less? 603 Moved to 5e IM
610–611 NEW Making the Connection: Adding More of Lady Gaga to GDP
Inside Look: Analysts Lower Estimates for New Car Sales in 2011 and 2012
See MyEconLab for current news articles, summaries, and questions.
4e page 4e Content 5e page 5e Content 641 NEW Bank of America Announces
Plans to Lay Off 30,000 Employees 629 NEW Caterpillar Announces Plans to Lay Off
Worker 653–54 Making the Connection: How Should
We Categorize the Unemployment at Bank of America?
Moved to 5e IM
NEW Making the Connection: How Should We Categorize Unemployment at Caterpillar?
661 Solved Problem 20.5: Calculating Real Average Hourly Earnings
641–42 Moved to 5e IM
649 NEW Solved Problem 20.5: Calculating Real Wages at Caterpillar
668–69 Inside Look: Will Pink slips Be in the Mail for Postal Workers?
See MyEconLab for current news articles, summaries, and questions.

Preface
©2015 Pearson Education, Inc.
xv
4e page 4e Content 5e page 5e Content 697 Section on “The Effect of the
Business Cycle on Boeing” 686 Replaced with “The Effect of the Business Cycle
on Whirlpool” 704–705 Inside Look: Airlines Face the
Business Cycle See MyEconLab for current news articles,
summaries, and questions.
Chapter 22: Long-Run Economic Growth: Sources and Policies 4e page 4e Content 5e page 5e Content 711 Google’s Dilemma in China 699 NEW Can China Save General Motors 725 Section, “Can the United States
Maintain High Rates of Productivity Growth”
713 Heavily revised and expanded and significantly expanded discussion of the debate over future U.S. growth. Section renamed to “Is the United States Headed for Another Productivity Slowdown?”
735 Figure 22.10, “Globalization and Growth”
Moved to 5e IM
740–741 Inside Look: Despite a Plan for Change, Investment Still Spurs China’s Growth
See MyEconLab for current news articles, summaries, and questions.
Chapter 23: Aggregate Expenditure and Output in the Short Run 4e page 4e Content 5e page 5e Content 755 Making the Connection: Do Changes
in Housing Wealth Affect Consumption Spending
737 Moved to 5e IM
762–63 Making the Connection: Intel Tries to Jump Off the Roller Coaster of IT Spending
Moved to 5e IM
749–50 NEW Making the Connection: Intel Moves into Tablets and Perceptual Computing
753 NEW Making the Connection: The iPhone Is Made in China … or Is It?
782–83 Inside Look: turnaround Projected for the Restaurant Industry
See MyEconLab for current news articles, summaries, and questions.
Chapter 24: Aggregate Demand and Aggregate Supply Analysis 4e page 4e Content 5e page 5e Content 789–90 NEW Making the Connection: How Sticky Are
Wages? 811 Making the Connection: How Long
Does It Take to Return to Potential GDP? Economic Forecasts Following the Recession of 2007–2009
Extensively revised and includes a new table showing the errors in government forecasts.
818–819 Inside Look: Smaller Freight Volumes Signal continued Economic Troubles (2011 article)
See MyEconLab for current news articles, summaries, and questions.
826 Appendix on Macroeconomics Schools of Thought
814–815 Revised to include a new section on the Austrian model.
Chapter 25: Money, Banks, and the Federal Reserve System 4e page 4e Content 5e page 5e Content 829 Coca-Cola Dries Up as Money
Floods Zimbabwe 819 NEW Washing Dollar Bills to Save the Economy
of Zimbabwe 835 Making the Connection: Do We Still
Need the Penny? Moved to 5e IM

Preface
©2015 Pearson Education, Inc.
xvi
4e page 4e Content 5e page 5e Content 826–27 NEW Making the Connection: Are Bitcoins
Money? 837–38 NEW T-accounts added to section on “Open
Market Operations” 856–57 Inside Look: Increased Lending
Boosts Money Supply Growth See MyEconLab for current news articles,
summaries, and questions.
Chapter 26: Monetary Policy 4e page 4e Content 5e page 5e Content 865 Monetary Policy, Toll Brothers, and
the Housing Market 853 NEW Why Do Businesses Care What the Federal
Reserve Does? 866–67 NEW Section of “Fed Forecasts” that includes
NEW Table 26.1: Fed Forecasts of Real GDP Growth during 2007 and 2008
NEW Figure 26.12: Housing Prices and Housing Rents
896–97 Inside Look: Fed Attempts to Stimulate Housing Market….Again
See MyEconLab for current news articles, summaries, and questions.
Chapter 27: Fiscal Policy 4e page 4e Content 5e page 5e Content 909–910 Making the Connection: Is Spending
on Social Security and Medicare a Fiscal Time Bomb
897–98 NEW graph added to this feature that distinguishes growth in spending on Social Security from growth in spending on Medicare/Medicaid.
904 Revised for clarity: key Figure 27.9, “The Multiplier Effect of an Increase in Government Purchases”
912 NEW Figure 27.14: The Effect of the Stimulus Package on Federal Expenditures and Revenue
936–37 Inside Look: Obama Proposes Additional Spending to Stimulate the Economy
See MyEconLab for current news articles, summaries, and questions.
Chapter 28: Inflation, Unemployment, and Federal Reserve Policy 4e page 4e Content 5e page 5e Content 951 Why Does CarMax Worry about
Monetary Policy? 937 NEW Why Does Parker Hannifin Worry about
Monetary Policy? 957 NEW Making the Connection: The Debate over
Quantitative Easing with photo of Janet Yellen 974–75 Inside Look: Can the Fed Balance the
Trade-off between Unemployment and Inflation?
See MyEconLab for current news articles, summaries, and questions.
Chapter 29: Macroeconomics in an Open Economy 4e page 4e Content 5e page 5e Content 933 Making the Connection: What
Explains the Fall and Rise and Fall of the Dollar
Moved to 5e IM
977–78 NEW Making the Connection: Japanese Firms Ride the Yen Roller Coaster
1004–5 Inside Look: Struggling Economy Contributes to a Weak Dollar
See MyEconLab for current news articles, summaries, and questions.

Preface
©2015 Pearson Education, Inc.
xvii
Chapter 30: The International Financial System 4e page 4e Content 5e page 5e Content 1013 Airbus Deals with Fluctuating
Exchange Rates 995 NEW Volkswagen Deals with Fluctuating
Exchange Rates 1016 Making the Connection: The
Canadian Province of…Arizona Moved to the 5e IM
1007 NEW Figure 30.5 The Yuan-Dollar Exchange Rate
1026–27 Making the Connection: Crisis and Recovery in South Korea
Moved to the 5e IM
1008–9 NEW Making the Connection: Why Did Iceland Recover So Quickly from the Financial Crisis?
1030–31 Inside Look: Can Tariffs Offset the Effect of Overvaluation? (October 2011 article)
See MyEconLab for current news articles, summaries, and questions.
Organizing Your Syllabus
The Instructor’s Manual can be a valuable resource for both experienced and first-time instructors. Both the textbook and Instructor’s Manual provide comprehensive coverage of economic theory, monetary policy, fiscal policy, and real-world applications.
Microeconomic Chapters
The microeconomics chapters cover relatively new developments in the field, such as the economics of information (Chapter 7, “The Economics of Health Care”) and personnel economics (Chapter 17, “The Markets for Labor and Other Factors of Production”). The authors include business applications in each chapter and have a dedicated chapter on firms, the stock market, and corporate governance (Chapter 8, “Firms, the Stock Market, and Corporate Governance”). The comprehensive coverage of microeconomics and business topics allows instructors to select chapters for diverse groups of students.
Most instructors will not want to cover indifference curve analysis or isoquant and isocost curves, but those who wish to will find these topics covered in the appendices to Chapter 10, “Consumer Choice and Behavioral Economics,” and Chapter 11, “Technology, Production, and Costs,” respectively. Chapter 14 of this instructor’s manual, “Oligopoly: Firms in Less Competitive Markets,” includes coverage of the kinked demand curve that does not appear in the main book.
First-time users of the textbook should be aware that some topics introduced in one chapter are applied in a later chapter. Chapter 4, “Economic Efficiency, Government Price Setting, and Taxes,” introduces consumer, producer, and economic surplus to describe the impact of government-imposed price controls. The appendix to Chapter 4, “Quantitative Demand and Supply Analysis,” explains in detail how consumer and producer surplus are calculated using linear demand and supply curves. Chapter 9, “Comparative Advantage and the Gains from International Trade,” uses the same tools to measure the effect of tariffs and quotas on international trade.
Macroeconomic Chapters
Chapter 19, “GDP: Measuring Total Production and Income,” and Chapter 20, “Unemployment and Inflation” carefully provide definitions of macroeconomic statistics such as GDP, CPI, and payroll employment, that dominate news headlines.

Preface
©2015 Pearson Education, Inc.
xviii
The comprehensive coverage of macroeconomic models and policy issues allows instructors with somewhat different course objectives the flexibility to choose different chapter sequences. The authors provide an overview of issues of long-run growth, business cycles, and the financial system in Chapter 21, “Economic Growth, the Financial System, and Business Cycles.” Instructors who wish to explore more deeply the sources of long-run growth and government policies toward growth can also assign Chapter 22, “Long-Run Economic Growth: Sources and Policies.” Monetary policy has a central role in the economy, so the book includes two chapters on monetary policy: Chapter 26, “Monetary Policy,” and Chapter 28, “Inflation, Unemployment, and Federal Reserve Policy.” Chapter 28 discusses the role of the Fed and inflation targeting with an insider’s perspective.
Chapter 23, “Aggregate Expenditure and Output in the Short Run,” contains a thorough discussion of the traditional Keynesian 45º-line aggregate expenditure model. Many instructors find this model useful in introducing students to the short-run relationship between spending and production. However, instructors may also safely omit Chapter 23 and proceed directly to Chapter 24, “Aggregate Demand and Aggregate Supply Analysis.”
Chapter 24 carefully develops the AD-AS model and then makes the model dynamic in an optional section to account better for actual movements in real GDP and the price level. Chapter 24 includes a three-layer, full-color acetate for the key introductory dynamic AD-AS graph (Figure 24.8, “A Dynamic Aggregate Demand and Aggregate Supply Model” on page 801.) We created this acetate to help students see how the graph builds step by step and to help make the graph easier for instructors to present. The acetate will help instructors who want to use dynamic AD-AS in class but believe the model needs to be developed carefully. Instructors may safely omit the sections on the dynamic AD-AS model in Chapter 26, “Monetary Policy” and in Chapter 27, “Fiscal Policy,” without any loss in continuity to the discussion of macroeconomic theory and policy.

Preface
©2015 Pearson Education, Inc.
xix
The following chart helps you organize your syllabus based on your teaching preferences and objectives:
CORE POLICY OPTIONAL
Chapter 1: Economics: Foundations and Models
Chapter 2: Trade-offs, Comparative Advantage, and the Market System
Chapter 3: Where Prices Come From: The Interaction of Demand and Supply
Chapter 6: Elasticity: The Responsiveness of Demand and Supply
Chapter 9: Comparative Advantage and the Gains from International Trade
May be delayed until after Ch. 28.
Chapter 11: Technology, Production, and Costs
Chapter 12: Firms in Perfectly Competitive Markets
Chapter 13: Monopolistic Competition: The Competitive Model in a More Realistic Setting
Chapter 14: Oligopoly: Firms in Less Competitive Markets
Chapter 15: Monopoly and Antitrust Policy
May be covered after Ch. 12.
Chapter 17: The Markets for Labor and Other Factors of Production
Chapter 19: GDP: Measuring Total Production and Income
Chapter 20: Unemployment and Inflation
Chapter 21: Economic Growth, the Financial System, and Business Cycles
Chapter 22: Long-Run Economic Growth: Sources and Policies
Chapter 24: Aggregate Demand and Aggregate Supply Analysis
Chapter 4: Economic Efficiency, Government Price Setting, and Taxes
Chapter 5: Externalities, Environmental Policy, and Public Goods
This chapter may be delayed until after Ch. 15.
Chapter 7: The Economics of Health Care
Chapter 18: Public Choice, Taxes, and the Distribution of Income
Chapter 26: Monetary Policy
Chapter 27: Fiscal Policy
Chapter 28: Inflation, Unemployment, and Federal Reserve Policy
Chapter 1 Appendix: Using Graphs and Formulas
Chapter 4 Appendix: Quantitative Demand and Supply Analysis
Chapter 8: Firms, the Stock Market, and Corporate Governance
Chapter 8 Appendix: Tools to Analyze Firms’ Financial Information
Chapter 10: Consumer Choice and Behavioral Economics
Chapter 10 Appendix: Using Indifference Curves and Budget Lines to Understand Consumer Behavior
Chapter 11 Appendix: Using Isoquants and Isocost Lines to Understand Production and Cost
Chapter 16: Pricing Strategy
Chapter 23: Aggregate Expenditure and Output in the Short Run
Chapter 23 Appendix: The Algebra of Macroeconomic Equilibrium
Chapter 24 Appendix: Macroeconomic Schools of Thought
Chapter 27 Appendix: A Closer Look at the Multiplier
Chapter 29: Macroeconomics in an Open Economy
Chapter 30: The International Financial System
Chapter 30 Appendix: The Gold Standard and the Bretton Woods System

Preface
©2015 Pearson Education, Inc.
xx
CORE POLICY OPTIONAL
This chapter carefully develops the AD-AS model and then makes the model dynamic to better account for actual movements in real GDP and the price level. The dynamic AD-AS model is covered in an optional section, which instructors can omit without loss of continuity.
Chapter 25: Money, Banks, and the Federal Reserve System
MyEconLab for Instructors & Students
MyEconLab is a unique online course management, testing, and tutorial resource.
MyEconLab for the Professor Instructors can choose how much or how little time to spend setting up and using MyEconLab.
Each chapter contains two preloaded homework exercise sets that can be used to build an individualized study plan for each student. These study plan exercises contain tutorial resources, including instant feedback, links to the appropriate learning objective in the eText, pop-up definitions from the text, and step-by-step guided solutions, where appropriate. After the initial setup of the course by the instructor, student use of these materials requires no further instructor setup. The online grade book records each student’s performance and time spent on the tests and study plan and generates reports by student or chapter. Alternatively, instructors can fully customize MyEconLab to match their course exactly, including reading assignments, homework assignments, video assignments, current news assignments, and quizzes and tests. Assignable resources include: Preloaded exercise assignments sets for each chapter that include the student tutorial resources
mentioned earlier Preloaded quizzes for each chapter that are unique to the text and not repeated in the study plan or
homework exercise sets Study plan problems that are similar to the end-of-chapter problems and numbered exactly like the
book to make assigning homework easier Real-Time-Data Analysis Exercises, marked with a red circle icon, allow students and instructors to
use the very latest data from FRED. By completing the exercises, students become familiar with a key data source, learn how to locate data, and develop skills in interpreting data.
Preface
©2015 Pearson Education, Inc.
xxi
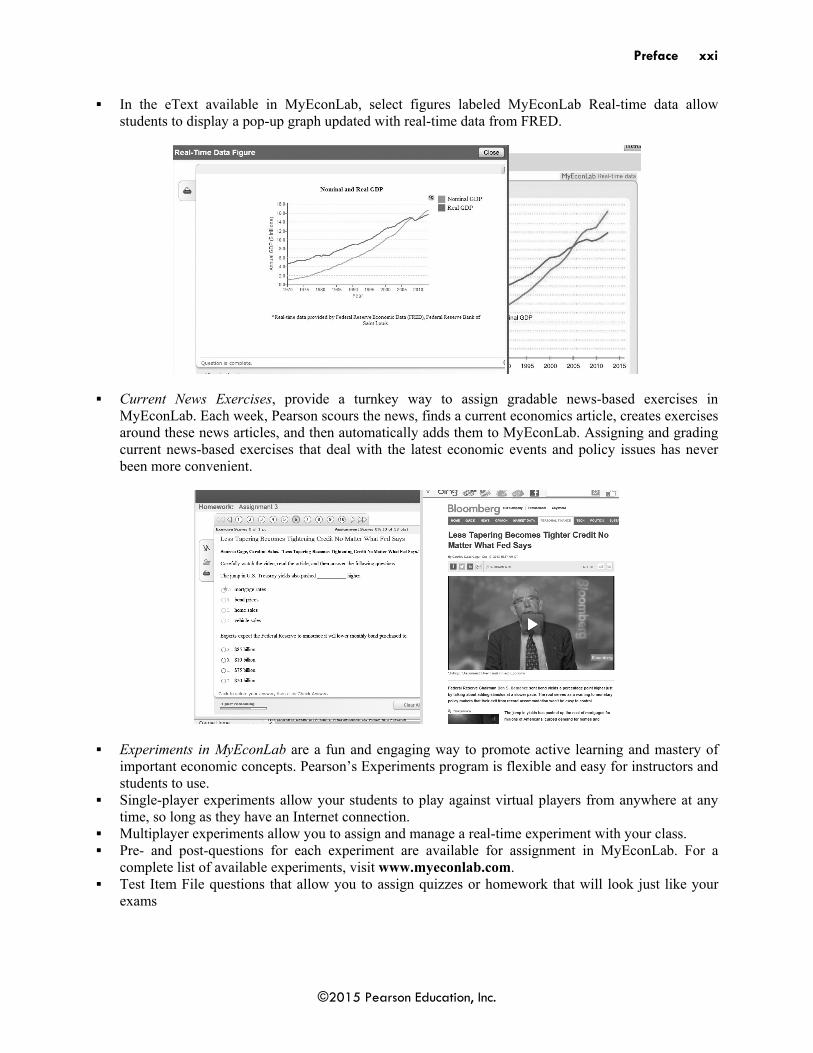
In the eText available in MyEconLab, select figures labeled MyEconLab Real-time data allow students to display a pop-up graph updated with real-time data from FRED.
Current News Exercises, provide a turnkey way to assign gradable news-based exercises in MyEconLab. Each week, Pearson scours the news, finds a current economics article, creates exercises around these news articles, and then automatically adds them to MyEconLab. Assigning and grading current news-based exercises that deal with the latest economic events and policy issues has never been more convenient.
Experiments in MyEconLab are a fun and engaging way to promote active learning and mastery of important economic concepts. Pearson’s Experiments program is flexible and easy for instructors and students to use.
Single-player experiments allow your students to play against virtual players from anywhere at any time, so long as they have an Internet connection.
Multiplayer experiments allow you to assign and manage a real-time experiment with your class. Pre- and post-questions for each experiment are available for assignment in MyEconLab. For a
complete list of available experiments, visit www.myeconlab.com. Test Item File questions that allow you to assign quizzes or homework that will look just like your
exams

Preface
©2015 Pearson Education, Inc.
xxii
Econ Exercise Builder, which allows you to build customized exercises. Exercises include multiple-choice, graph drawing, and free-response items, many of which are generated algorithmically so that each time a student works them, a different variation is presented.
MyEconLab grades every problem type except essays, even problems with graphs. When working homework exercises, students receive immediate feedback with links to additional learning tools.
Customization and Communication MyEconLab in MyLab/Mastering provides additional optional customization and communication tools. Instructors who teach distance-learning courses or very large lecture sections find the MyLab/Mastering format useful because they can upload course documents and assignments, customize the order of chapters, and use communication features such as Document Sharing, Chat, ClassLive, and Discussion Board.
MyEconLab: Moving to a New Edition When a new edition of your textbook publishes, you do not have to recreate all your assignments. You can import assignments from a previous edition of the same book.
Not every exercise from the previous edition is included in the new edition. Once your assignments have been imported, a list of any exercises that did not convert will be displayed as well as emailed to you. Please use this list to help you find suitable replacement exercises in the new edition. You must first allow assignments from old edition to be imported.
In the old edition course:
1. Click on Homework Manager.
2. Click Show All to see all assignments (HW, Quizzes, Tests).
3. Choose Change Assignment Settings from Drop down menu.

Preface
©2015 Pearson Education, Inc.
xxiii
4. Check box for Allow Import.
5. Click Update.
Import Assignments into New Edition Course 1. Create course based on new edition of the book.
2. Click on Homework Manager.
3. Under Create Assignment, choose Import/Copy Assignments from another course.

Preface
©2015 Pearson Education, Inc.
xxiv
4. Choose Convert and import assignments from courses using a previous edition of this book or related books with similar coverage.
5. Click Next.
6. Choose if you wish to convert from one of your courses or one from another instructor at your
institution.
7. Click Next.

Preface
©2015 Pearson Education, Inc.
xxv
8. Click Next.
9. Select all the assignments you wish to import.
10. Click Import
You will then see a summary screen detailing which exercises were not converted, so you can find replacements. This same information will be sent to your MyEconLab registered email address.

Preface
©2015 Pearson Education, Inc.
xxvi
MyEconLab for the Student MyEconLab puts students in control of their learning through a collection of testing, practice, and study tools tied to the online, interactive version of the textbook and other media resources. Students can study on their own, or they can complete assignments created by their instructor. Within MyEconLab’s structured environment, students practice what they learn, test their understanding, and pursue a personalized study plan generated from their performance on sample tests and from quizzes created by their instructors. In Homework or Study Plan mode, students have access to a wealth of tutorial features, including: Instant feedback on exercises that helps students understand and apply the concepts; Links to the eText to promote reading of the text just when the student needs to revisit a concept or
explanation Step-by-step guided solutions that force students to break down a problem in much the same way an
instructor would do during office hours Pop-up summaries of the appropriate learning objective to remind students of key ideas while
studying Pop-up key term definitions from the eText to help students master the vocabulary of economics Links to the important features of the eText, such as Solved Problems, Making the Connection, An
Inside Look, and Don’t Let This Happen to You A graphing tool that is integrated into the various exercises to enable students to build and manipulate
graphs so that students better understand how concepts, numbers, and graphs connect
Preface
©2015 Pearson Education, Inc.
xxvii
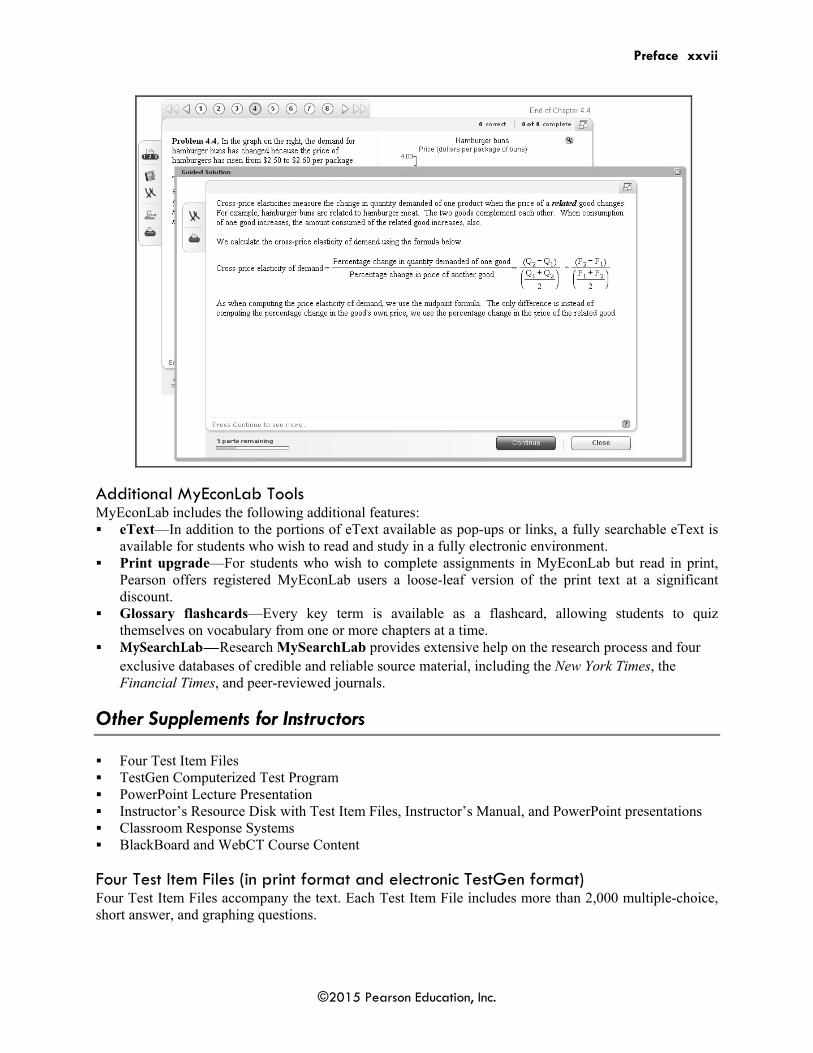
Additional MyEconLab Tools MyEconLab includes the following additional features: eText—In addition to the portions of eText available as pop-ups or links, a fully searchable eText is
available for students who wish to read and study in a fully electronic environment. Print upgrade—For students who wish to complete assignments in MyEconLab but read in print,
Pearson offers registered MyEconLab users a loose-leaf version of the print text at a significant discount.
Glossary flashcards—Every key term is available as a flashcard, allowing students to quiz themselves on vocabulary from one or more chapters at a time.
MySearchLab-----Research MySearchLab provides extensive help on the research process and four exclusive databases of credible and reliable source material, including the New York Times, the Financial Times, and peer-reviewed journals.
Other Supplements for Instructors
Four Test Item Files TestGen Computerized Test Program PowerPoint Lecture Presentation Instructor’s Resource Disk with Test Item Files, Instructor’s Manual, and PowerPoint presentations Classroom Response Systems BlackBoard and WebCT Course Content
Four Test Item Files (in print format and electronic TestGen format) Four Test Item Files accompany the text. Each Test Item File includes more than 2,000 multiple-choice, short answer, and graphing questions.

Preface
©2015 Pearson Education, Inc.
xxviii
Test questions are annotated with the following information:
Difficulty: 1 for straight recall, 2 for some analysis, 3 for complex analysis
Type: multiple-choice, true/false, short-answer, essay
Topic: the term or concept the question supports
Learning outcome
AACSB (see description that follows)
Page number
Special feature in the main book: chapter-opening business example, Economics in YOUR Life!, Solved Problem, Making the Connection, Don’t Let this Happen to You! and An Inside Look.
The Association to Advance Collegiate Schools of Business (AACSB) The test bank authors have connected select test bank questions to the general knowledge and skill guidelines found in the AACSB standards.
What Is the AACSB? AACSB is a not-for-profit corporation of educational institutions, corporations, and other organizations devoted to the promotion and improvement of higher education in business administration and accounting. A collegiate institution offering degrees in business administration or accounting may volunteer for AACSB accreditation review. The AACSB makes initial accreditation decisions and conducts periodic reviews to promote continuous quality improvement in management education. Pearson Education is a proud member of the AACSB and is pleased to provide advice to help you apply AACSB Learning Standards.
What Are AACSB Learning Standards? One of the criteria for AACSB accreditation is the quality of the curricula. Although no specific courses are required, the AACSB expects a curriculum to include learning experiences in such areas as: Communication Ethical Reasoning Analytic Skills Use of Information Technology Multicultural and Diversity Reflective Thinking
These six categories are AACSB Learning Standards. Questions that test skills relevant to these standards are tagged with the appropriate standard. For example, a question testing the moral questions associated with externalities would receive the Ethical Reasoning tag.
How Can Instructors Use the AACSB Tags? Tagged questions help you measure whether students are grasping the course content that aligns with the AACSB guidelines noted above. In addition, the tagged questions may help instructors identify potential applications of these skills. This in turn may suggest enrichment activities or other educational experiences to help students achieve these skills.
TestGen The computerized TestGen package allows instructors to customize, save, and generate classroom tests. The test program permits instructors to edit, add, or delete questions from the test banks; edit existing graphics and create new graphics; analyze test results; and organize a database of tests and student results.

Preface
©2015 Pearson Education, Inc.
xxix
This software allows for extensive flexibility and ease of use. It provides many options for organizing and displaying tests, along with search and sort features. The software and the test banks can be downloaded from the Instructor’s Resource Center (www.pearsonhighered.com/hubbard).
PowerPoint Slides (Three Sets) Three sets of PowerPoint slides are available: 1. A comprehensive set of PowerPoint slides can be used by instructors for class presentations or by
students for lecture preview or review. These slides include all the graphs, tables, and equations in the textbook. Two versions are available—step-by-step mode, in which you can build graphs as you would on a blackboard, and automated mode, in which you use a single click per slide.
2. A comprehensive set of PowerPoint slides have Classroom Response Systems (CRS) questions built in so that instructors can incorporate CRS “clickers” into their classroom lectures. For more information on Pearson Education’s partnership with CRS, see the description that follows. Instructors can download these PowerPoint presentations from the Instructor’s Resource Center (www.pearsonhighered.com/hubbard).
3. A student version of the PowerPoint slides is available as .pdf files. This version allows students to print the slides and bring them to class for note taking. Instructors can download these PowerPoint presentations from the Instructor’s Resource Center (www.pearsonhighered.com/hubbard).
Instructor’s Resource Disk The Instructor’s Resource Disk contains all the faculty and student resources that support this text. Instructors have the ability to access and edit the Instructor’s Manual Test Item Files PowerPoint presentations
By simply clicking on a chapter or searching for a keyword, faculty can access an interactive library of resources. Faculty can pick and choose from the various supplements and export them to their hard drives.
Blackboard and WebCT Course Content Pearson Education offers fully customizable course content for the Blackboard and WebCT Course Management Systems.
Classroom Response Systems Classroom Response Systems (CRS) is an exciting new wireless polling technology that makes large and small classrooms even more interactive because it enables instructors to pose questions to their students, record results, and display the results instantly. Students can answer questions easily, using compact remote-control transmitters. Pearson has partnerships with leading classroom response systems providers and can show you everything you need to know about setting up and using a CRS system. We’ll provide the classroom hardware, text-specific PowerPoint slides, software, and support, and we’ll also show you how your students can benefit! See your Pearson Education sales representative for more information.
CourseSmart CourseSmart goes beyond traditional expectations providing instant, online access to the textbooks and course materials you need at a lower cost to students. And even as students save money, you can save time and hassle with a digital textbook that allows you to search the most relevant content at the very moment you need it. Whether it’s evaluating textbooks or creating lecture notes to help students with difficult concepts, CourseSmart can make life a little easier. See how when you visit www.coursesmart.com.

Preface
©2015 Pearson Education, Inc.
xxx
Other Supplements for Students
Two Study Guides: One for Microeconomics and One for Macroeconomics The study guides contains the following features: Chapter summary Discussion of each learning objective Section-by-section review of the concepts presented Helpful study hints Additional Solved Problems to supplement those in the text Key terms with definitions A self-test, including 40 multiple-choice questions, plus a number of short-answer and true/false
questions, with accompanying answers and explanations
PowerPoint Slides For student use as a study aide or note-taking guide, PowerPoint slides may be downloaded from the companion Web site, at www.pearsonhighered.com/hubbard. The slides include: All graphs, tables, and equations in the text Figures in step-by-step, automated mode, using a single click per graph curve End-of-chapter key terms with hyperlinks to relevant slides
CourseSmart CourseSmart goes beyond traditional expectations providing instant, online access to the textbooks and course materials students need at lower cost. They can also search, highlight, and take notes anywhere at anytime. See all the benefits to students at www.coursesmart.com.

©2015 Pearson Education, Inc.
CHAPTER 1 | Economics: Foundations and Models
Brief Chapter Summary and Learning Objectives
1.1 Three Key Economic Ideas (pages 4–8) Explain these three key economic ideas: People are rational; people respond to economic incentives; and optimal decisions are made at the margin.
People must make choices as they try to attain their goals. People make choices because resources are scarce.
1.2 The Economic Problem That Every Society Must Solve (pages 8–11) Discuss how an economy answers these questions: What goods and services will be produced? How will the goods and services be produced? Who will receive the goods and services produced?
A limited amount of resources will produce a limited amount of goods and services. The cost of producing more of one good is the value of what must be given up to produce
it.
1.3 Economic Models (pages 11–15) Understand the role of models in economic analysis.
Economists use models—simplified versions of reality—to analyze real-world issues.
1.4 Microeconomics and Macroeconomics (pages 15–16) Distinguish between microeconomics and macroeconomics.
1.5 A Preview of Important Economic Terms (pages16–17) Define important economic terms.
Appendix: Using Graphs and Formulas (pages 24–35) Review the use of graphs and formulas.
Key Terms
Allocative efficiency, p. 11. A state of the economy in which production is in accordance with consumer preferences; in particular, every good or service is produced up to the point where the last unit provides a marginal benefit to society equal to the marginal cost of producing it.
Centrally planned economy, p. 9. An economy in which the government decides how economic resources will be allocated.
Economic model, p. 4. A simplified version of reality used to analyze real-world economic situations.

CHAPTER 1 | Economics: Foundations and Models
©2015 Pearson Education, Inc.
2
Economic variable, p. 12. Something measurable that can have different values, such as the incomes of doctors.
Economics, p. 4. The study of the choices people make to attain their goals, given their scarce resources.
Equity, p. 11. The fair distribution of economic benefits.
Macroeconomics, p. 16. The study of the economy as a whole, including topics such as inflation, unemployment, and economic growth.
Marginal analysis, p. 7. Analysis that involves comparing marginal benefits and marginal costs.
Market, p. 4. A group of buyers and sellers of a good or service and the institution or arrangement by which they come together to trade.
Market economy, p. 9. An economy in which the decisions of households and firms interacting in markets allocate economic resources.
Microeconomics, p. 16. The study of how households and firms make choices, how they interact in markets, and how the government attempts to influence their choices.
Mixed economy, p. 10. An economy in which most economic decisions result from the interaction of buyers and sellers in markets but in which the government plays a significant role in the allocation of resources.
Normative analysis, p. 13. Analysis concerned with what ought to be.
Opportunity cost, p. 8. The highest-valued alternative that must be given up to engage in an activity.
Positive analysis, p. 13. Analysis concerned with what is.
Productive efficiency, p. 11. A situation in which a good or service is produced at the lowest possible cost.
Scarcity, p. 4. A situation in which unlimited wants exceed the limited resources available to fulfill those wants.
Trade-off, p. 8. The idea that, because of scarcity, producing more of one good or service means producing less of another good or service.
Voluntary exchange, p. 11. A situation that occurs in markets when both the buyer and the seller of a product are made better off by the transaction.
Chapter Outline
Is the Private Doctor’s Office Going to Disappear?
Traditionally, most doctors in the United States have worked in private practices that they own by themselves or with other doctors. But lately, an increasing number of doctors have chosen to be salaried employees of hospitals. Soaring health care costs have led many insurance companies and the state and federal governments to reduce the payments they make to doctors in return for treating patients. Doctors in private practice have found their incomes fluctuating, which makes a steady income from a hospital salary more attractive. One rule from the healthcare changes passed by Congress in 2010 requires doctors and hospitals receiving payments from Medicare to convert to electronic record keeping. Doctors can avoid the cost of acquiring computer systems, and the paperwork necessitated by other new rules, by choosing hospital employment.

CHAPTER 1 | Economics: Foundations and Models
©2015 Pearson Education, Inc.
3
Teaching Tips There are special features in the textbook:
1. The introduction, or chapter opener, uses a real-world business example to preview the economic issues discussed in the chapter.
2. A feature titled An Inside Look appears at the end of textbook Chapters 1, 2, 3, and 4. This feature consists of a recent news article plus analysis and questions. The article links back to a topic discussed in the chapter opener. Visit www.myeconlab.com for additional current news articles and analyses.
3. A boxed feature titled Economics in Your Life complements the business example that opens the chapter. Economics in Your Life poses questions that help students make a personal connection with the chapter theme. At the end of the chapter, the authors use the concepts described in the chapter to answer these questions. Additional Economics in Your Life features are included in this Instructor’s Manual.
4. Don’t Let This Happen to You is a box feature that alerts students to common pitfalls covered in that chapter.
5. There are between two and four Making the Connection features in each chapter that provide real world reinforcement of key concepts by citing news stories that focus on business and policy issues. Additional Making the Connection features appear in this Instructor’s Manual.
6. Solved Problems use a step-by-step process for solving an economic problem related to one of the chapter’s learning objectives. Additional Solved Problems are included in this Instructor’s Manual.
7. Real-Time Data Analysis (RTDA) exercises are included with the problems at the end of macroeconomics chapters. These problems refer to data and graphs that students will find housed on the Web site of the Federal Reserve Bank of St. Louis (FRED). Many RTDA require more elaborate calculations than other problems and the use of Excel spreadsheets.
8. Graphs Updated with Real-Time Data from FRED: Select graphs, primarily in the macroeconomics volume, are continuously updated online with the latest available data from FRED (Federal Reserve Economic Data), which is a comprehensive, up-to-date data set maintained by the Federal Reserve Bank of St. Louis. Students can display a pop-up graph that shows new data plotted in the graph. The goal of this digital feature is to help students understand how to work with data and understand how including new data affects graphs.
You can use these features as the basis for classroom discussion, homework assignments, and examination questions.
People must make choices as they try to attain their goals. The choices people make represent the trade-offs made necessary by scarcity. Scarcity is a situation in which unlimited wants exceed the limited resources available to fulfill those wants. Economics is the study of the choices people make to attain their goals, given their scarce resources. An economic model is a simplified version of reality used to analyze real-world economic situations.
Teaching Tips Students will better understand what scarcity means if you give them examples of things that are not scarce. Suggest examples of “free” resources—sand on a beach, fresh air, and so one—and ask your students to contribute their own examples; they will soon learn that the list of free resources is much shorter than the list of scarce resources.

CHAPTER 1 | Economics: Foundations and Models
©2015 Pearson Education, Inc.
4
1.1 Three Key Economic Ideas (pages 4–8) Learning Objective: Explain these three key economic ideas: People are rational; people respond to economic incentives; and optimal decisions are made at the margin.
A market is a group of buyers and sellers of a good or service and the institution or arrangement by which they come together to trade.
A. People Are Rational Rational individuals weigh the benefits and costs of each action and choose an action if the benefits outweigh the costs.
B. People Respond to Economic Incentives Economists emphasize that consumers and firms consistently respond to economic incentives.
C. Optimal Decisions Are Made at the Margin Economists use the word “marginal” to mean an extra or additional benefit or cost from making a decision. The optimal decision is to continue any activity to the point where the marginal benefit equals the marginal cost. Marginal analysis is analysis that involves comparing marginal benefits and marginal costs.
Teaching Tips You don’t need to spend a lot of class time with explanations of the material in this section; subsequent chapters will reinforce students’ understanding of markets and the “three key economic ideas.”
1.2 The Economic Problem That Every Society Must Solve (pages 8–11) Learning Objective: Discuss how an economy answers these questions: What goods and services will be produced? How will the goods and services be produced? Who will receive the goods and services produced?
Every society faces the economic problem that it has only a limited amount of economic resources, so it can produce only a limited amount of goods and services. Society faces trade-offs. A trade-off is the idea that, because of scarcity, producing more of one good or service means producing less of another good or service. Every activity has an opportunity cost: the highest-valued alternative that must be given up to engage in an activity. Trade-offs force society to answer three fundamental questions:
1. What goods and services will be produced? 2. How will the goods and services be produced? 3. Who will receive the goods and services produced?
A. What Goods and Services Will Be Produced? The answer to this question is determined by the choices consumers, firms, and the government make. Each choice made comes with an opportunity cost.
B. How Will the Goods and Services Be Produced? Firms choose how to produce the goods and services they sell. For example, firms often face trade-offs between using more workers or more machines.

CHAPTER 1 | Economics: Foundations and Models
©2015 Pearson Education, Inc.
5
C. Who Will Receive the Goods and Services Produced? In the United States, who receives the goods and services produced depends largely on how income is distributed. An important policy question is whether the government should intervene to make the distribution of income more equal.
D. Centrally Planned Economies versus Market Economies Societies organize their economies in two main ways. A centrally planned economy is an economy in which the government decides how economic resources will be allocated. A market economy is an economy in which the decisions of households and firms interacting in markets allocate economic resources. Today, only a few small countries, such as Cuba and North Korea, still have completely centrally planned economies. In a market economy, the income of an individual is determined by the payments he receives for what he sells. Generally, the more extensive the training a person has received and the longer the hours the person works, the higher his income will be.
E. The Modern “Mixed” Economy The high rates of unemployment and business bankruptcies during the Great Depression of the 1930s caused a dramatic increase in government intervention in the economy in the United States and other market economies. Some government intervention is designed to raise the incomes of the elderly, the sick, and people with limited skills. In recent years, government intervention has expanded to meet goals such as the protection of the environment, the promotion of civil rights, and the provision of medical care to low-income people and the elderly. Some economists argue that the extent of government intervention makes it more accurate to refer to the economies of the United States, Canada, and Western Europe as mixed economies rather than pure market economies. A mixed economy is an economy in which most economic decisions result from the interaction of buyers and sellers in markets but in which the government plays a significant role in the allocation of resources.
F. Efficiency and Equity Market economies tend to be more efficient than centrally planned economies. There are two types of efficiency. Productive efficiency is a situation in which a good or service is produced at the lowest possible cost. Allocative efficiency is a state of the economy in which production is in accordance with consumer preferences; in particular, every good or service is produced up to the point where the last unit provides a marginal benefit to society equal to the marginal cost of producing it. Voluntary exchange is a situation that occurs in markets when both the buyer and the seller of a product are made better off by the transaction.
Inefficiency arises from various sources. Sometimes governments reduce efficiency by interfering with voluntary exchange in markets. The production of some goods damages the environment when firms ignore the costs of environmental damage. In this case, government intervention can increase efficiency.
Society may not find an efficient economic outcome to be desirable. Many people prefer economic outcomes that they consider fair or equitable even if these outcomes are less efficient. Equity is the fair distribution of economic benefits. Programs designed to increase equity may reduce efficiency.

CHAPTER 1 | Economics: Foundations and Models
©2015 Pearson Education, Inc.
6
Teaching Tips Ask students for examples of government regulation of private markets in the United States. Responses may include: making the sale of cocaine and other addictive drugs illegal; minimum age requirements for the purchase of alcoholic beverages and cigarettes; the prohibition of the sale of new drugs before their effectiveness is demonstrated through government-supervised tests. Ask students whether one of these examples of government regulation promotes equity or fairness. The difficulty in defining equity will be apparent. To show how students may value equity less than they claim, an economics teacher at a college in Western New York once told her students at the beginning of her course that their grades would be auctioned to the highest bidders. Because grades are typically normally distributed, she offered to sell a few A grades, a few more B grades, and so on. Although the announcement produced shock and grumbling, the auction proceeded, with frenzied bidding for A grades. As prices for A grades rose, bidding switched to B grades. Because few students bothered to bid for C grades, one enterprising student bid on several such grades in the belief that those who lost out on getting an A or B would have to buy their C grades from him—for a higher price than he paid! After about a week, the instructor informed the class the auction was intended only as an economics lesson; they would have to earn their grades the old-fashioned way.
Extra Solved Problem 1.2 Advising New Government Leaders
Suppose that a low-income country experiences a change in government leadership. Prior to this change, the country had a centrally planned economy. The new leaders are willing to try a different system if they can be can be convinced that it will result in higher rates of economic growth. They hire an economist from a country with a market economy to advise them and will order their citizens to follow the economist’s recommendations for change. The economist suggests that a market economy replace central planning to answer the nation’s economic questions (what, how, and who?).
What will the economist suggest the leaders order their citizens to do in order to change from a centrally planned economy to a market economy?
Are there reasons why the leaders of this country might not accept the economist’s suggestions? Briefly explain.
Solving the Problem Step 1: Review the chapter material. The problem is about different types of economic systems, so you may want to review the section
“Centrally Planned Economies versus Market Economies” on page 9 of the textbook. Step 2: What will the economist suggest the leaders order their citizens to do? Market economies allow members of households to select occupations and purchase goods
and services based on self-interest and allow privately owned firms to produce goods and services based on their self-interest. Therefore, the economist would advise the leaders of the country to eliminate existing laws and regulations that restrict the economic activities that households and firms can engage in. Government officials should have no influence over individual decisions made in markets.
Step 3: Are there reasons why the leaders of this country might not accept the economist’s suggestions?
Even democratically elected leaders, especially those with significant involvement in the country’s resource allocation, will find it difficult to accept the new system. They may wonder how self-interested individuals will produce and distribute goods and services so as to promote

CHAPTER 1 | Economics: Foundations and Models
©2015 Pearson Education, Inc.
7
the welfare of the entire country. This new system requires a significant reduction in the government’s influence on people’s lives, but history has shown that most government officials are reluctant to give up this influence. Acceptance is most likely when the leaders have some knowledge and experience with the successful operation of a market economy in other countries. Ordinary citizens are more likely to accept the economist’s suggestions because they would have more freedom to pursue their own economic goals.
1.3 Economic Models (pages 11–15) Learning Objective: Understand the role of models in economic analysis.
Models are simplified versions of reality used to analyze real-world situations. To develop a model, economists generally follow five steps.
1. Decide on the assumptions to use in developing the model. 2. Formulate a testable hypothesis. 3. Use economic data to test the hypothesis. 4. Revise the model if it fails to explain the economic data well. 5. Retain the revised model to help answer similar economic questions in the future.
A. The Role of Assumptions in Economic Models Models are based on making assumptions because models must be simplified to be useful. When using models, economists make behavioral assumptions about the motives of consumers and firms. Economists assume that consumers will buy goods and services that will maximize their satisfaction and firms will act to maximize their profits.
B. Forming and Testing Hypotheses in Economic Models An economic variable is something measurable that can have different values, such as the incomes of doctors. A hypothesis in an economic model is a statement that may be correct or incorrect about an economic variable. To test a hypothesis, we analyze statistics on the relevant economic variables. Economists accept and use an economic model if it leads to hypotheses that are confirmed by statistical analysis.
C. Positive and Normative Analysis Positive analysis is analysis concerned with what is. Normative analysis is analysis concerned with what ought to be.
D. Economics as a Social Science Because economics studies the actions of individuals, it is a social science. Economics considers human behavior in every context, not just in the context of business. Economists have played an important role in formulating government policies in areas such as the environment, health care, and poverty.
Extra Solved Problem 1.3 Sunspot Activity and the Market for Natural Gas
Sunspots are sites of strong magnetic fields that appear as dark regions on the surface of the sun. The number of sunspots varies over an 11-year cycle. Scientists have found that the earth’s temperature declines when the number of sunspots decreases, so when the number of sunspots declined in 2013, there

CHAPTER 1 | Economics: Foundations and Models
©2015 Pearson Education, Inc.
8
was an expectation that a period of lower temperatures could follow. British economist William Stanley Jevons (1835–1882) developed a model of economic growth based on the occurrence of sunspots. Jevons hypothesized that when the earth’s temperature varied throughout the sunspot cycle, agricultural output would change, too. Today, most economists attribute changes in economic growth to factors other than sunspots. But some analysts believe that changes in sunspot activity could result in changes in the demand for natural gas in the United States and, therefore, in its price. The development of new technology has resulted in a large increase in the production of natural gas in the United States in the twenty-first century. As a result, natural gas has replaced other sources of energy for businesses and households, and lower temperatures could lead to an increase in the demand for natural gas.
How can we develop a model that would test the relationship between sunspot activity and the market for natural gas?
Source: Simon Constable, “As ‘Sun Spots’ Cool Down, Natural-Gas Market Heats Up,” Wall Street Journal, July 1, 2013.
Solving the Problem Step 1: Review the chapter material. This problem is about how to use models to analyze
economic issues, so you may want to review the section “Economic Models,” which begins on page 11 of the textbook.
Step 2: To develop and test a model of the relationship between sunspot activity and the market for natural gas, follow these steps: 1. Decide on the assumptions to use in developing the model. Two assumptions of the
model are: (a) Changes in the earth’s temperature are related to changes in the amount of sunspot activity, and (b) changes in the earth’s temperature cause variations in the demand for natural gas, which is an energy source for homes and businesses.
2. Formulate a testable hypothesis. Given these assumptions, all else equal, the demand for natural gas and the price of natural gas will be higher in years when there is lower than average sunspot activity. All else equal, the demand for natural gas and the price of natural gas will be lower in years when there is higher than average sunspot activity.
3. Use economic data to test the hypothesis. Compare changes in sunspot activity with changes in the price of natural gas and the quantity of natural gas sold. Because sunspot activity varies in 11-year cycles, data should cover at least one of these cycles. For the United States, years of greater-than-average sunspot activity should be years of relatively low sales and prices for natural gas, while years of lower-than-average sunspot activity should be years of higher sales and prices for natural gas.
4. Revise the model if it fails to explain the economic data well. The model could fail if factors other than sunspot activity have a significant effect on the market for natural gas. These factors include: changes in the prices of other energy sources; changes in the cost of production for natural gas; and changes in government policies toward energy markets. A revised model would examine the separate influence of sunspots and these other factors. The model could also fail if factors other than sunspot activity, such as an increase in the amount of “greenhouse gases” in the atmosphere, affect the earth’s temperature.
5. Retain the revised model to help answer similar economic questions in the future. If the data support the model, one can assume that there is a relationship between sunspot activity and the market for natural gas. We need to keep in mind, though, that tests of the model with data from different time periods could either support or contradict these results. Acceptance of a model is always tentative pending the acquisition of new data or additional statistical analysis.

CHAPTER 1 | Economics: Foundations and Models
©2015 Pearson Education, Inc.
9
1.4 Microeconomics and Macroeconomics (pages 15–16) Learning Objective: Distinguish between microeconomics and macroeconomics.
Microeconomics is the study of how households and firms make choices, how they interact in markets, and how the government attempts to influence their choices.
Macroeconomics is the study of the economy as a whole, including topics such as inflation, unemployment, and economic growth.
Extra Solved Problem 1.4 Microeconomic and Macroeconomic Views
Sports fans are used to seeing game action on television from different camera angles. For popular events such as the Olympics, the World Series, and the Super Bowl, network coverage captures action from ground level as well as from higher locations. At many events, there is a camera located in a blimp that circles above the stadium where the event is held. The aerial view of the blimp’s camera is often visually appealing but never is broadcast for very long because the athletes are barely visible. Coverage of the events often includes a view from a mobile or “sideline” camera that can zoom in on individual players or fans sitting in the stands, a degree of detail much greater than that provided by the aerial view.
How do the different camera angles help to explain the difference between microeconomics and macroeconomics?
Solving the Problem Step 1: Review the chapter material. This problem is about the differences between
microeconomics and macroeconomics, so you may want to review the section “Microeconomics and Macroeconomics,” which begins on page 15 of the textbook.
Step 2: Compare the focus of microeconomics with the television coverage of a sports event. Microeconomics focuses on how individual households and firms make choices, how they interact in markets, and how the government attempts to influence their choices. This focus is similar to that of a sideline camera at a football game. The camera can focus in on an individual player or fan.
Step 3: Compare the focus of macroeconomics with the television coverage of a sports event. Macroeconomics is the study of the economy as a whole, including topics such as inflation, unemployment, and economic growth. Macroeconomics does not study the decisions made by individuals but the consequences of the actions of all decision makers in an economy. This is similar to the blimp’s aerial view of the venue where a sports event occurs. One can see the entire venue, but the blimp’s point of view is too far away to see any individual player or fan.
CHAPTER 1 | Economics: Foundations and Models
©2015 Pearson Education, Inc.
10
Extra Making
the Connection
Macroeconomic and Microeconomic Analysis
Economists separate the study of how households and firms make choices and interact in markets (microeconomics) from the study of the economy as a whole (macroeconomics). But some issues can be viewed from both perspectives. Labor productivity is one such issue.
Labor productivity—the quantity of goods and services that can be produced by one worker or by one hour of work—is a microeconomic topic. Labor productivity increases when a firm invests in capital or when a firm’s technology improves. Increased labor productivity allows a firm to earn higher profits and to pay its workers higher wages. But macroeconomists also study labor productivity because it determines the standard of living a country can achieve for its citizens. An increase in productivity is beneficial in the long run, but it can slow the growth of jobs in the short run. Following the recessions of 2001 and 2007–2009, many economists were concerned that the unemployment rate did not decrease as quickly as it did following previous recessions. One reason for this was an increase in productivity. In 2009, for example, labor productivity increased by about 2.5 percent. Because workers were more productive, firms could hire fewer additional workers to produce an increase in the quantity of goods and services. But productivity growth slowed to less than 1 percent in 2012 and 2013. Economists at J.P. Morgan attributed the slowdown in productivity growth to decisions by U.S. firms to reduce their investment in research. After 1995, firms had invested in computer-related applications, which had helped increase productivity growth. The productivity slowdown led economist Robert Gordon of Northwestern University to comment that firms had “already picked the low-hanging fruit.”
Sources: “Slash and Earn,” Economist, March 18, 2010; Alex Tanzi, “U.S. Second Quarter Productivity and Cost Report,” Bloomberg.com, September 1, 2011; and Jonathan House, “Productivity Advanced in the Second Quarter,” Wall Street Journal, August 16, 2013.
1.5 A Preview of Important Economic Terms (pages 16–17) Learning Objective: Define important economic terms.
This section provides a brief definition and preview of terms students will see throughout the book: firm (company or business), entrepreneur, innovation, technology, goods, services, revenue, profit, household, factors of production (economic resources or inputs), capital, and human capital.
Extra Economics in Your Life: Is Cheating a Rational Decision?
In their best-selling book Freakonomics, Steven D. Levitt and Stephen J. Dubner argue that cheating is part of human behavior. Evidence that some people cheat surfaced in the summer of 2011 when the superintendent of the board of the Atlanta school district resigned after a report documented widespread cheating on standardized tests that implicated officials from about 80 percent of Atlanta’s elementary and middle schools. Following an investigation of the scandal, three dozen teachers and administrators were due to stand trial in 2013 for coaching students and changing their answers in order to improve test results.

CHAPTER 1 | Economics: Foundations and Models
©2015 Pearson Education, Inc.
11
Steven Levitt and other economists assume that decision makers—students and nonstudents alike—are rational. They compare the benefits and costs of their options and make choices for which the expected benefits exceed the expected costs. The benefits of (successful) cheating may be monetary; for example, K–12 teachers in some states are eligible for bonus payments of up to $25,000 if their students perform well on standardized tests. New technology has made it easier for high school and college students to cheat. The widespread use of cell phones and Internet access makes it easier (less costly) to share exam answers and buy term papers. Of course, cheating is also a moral matter for many people. For these people, one of the costs of cheating is the guilt they will feel for violating the rules governing the activity they are engaged in. Sources: Steven D. Levitt and Stephen J. Dubner, Freakonomics, New York: HarperCollins, 2005, pp. 24–25; Patrik Jonsson, “America’s Biggest Teacher and Principal Cheating Scandal Unfolds in Atlanta,” Christian Science Monitor, July 5, 2011; and Mary Beth McCauley, “Atlanta School Cheating: When Teachers Cheat, What Do You Tell the Kids?” Christian Science Monitor, September 5, 2013.
Question: For the sake of argument, let’s assume that you would never cheat. Under what circumstances are students in general more or less likely to cheat on an economics examination?
Answer: Your economics instructor will be pleased if you would never cheat under any circumstances. But cheating is more likely when: (1) the positive consequences of receiving a high grade are great (for example, a high grade is necessary to maintain a scholarship, gain admittance to medical school, or get a good job offer), or (2) the probability of getting caught is low (the instructor gives the same multiple-choice exam to all students in a large classroom with no supervision). Reducing the benefit and increasing the cost of getting caught will reduce the incidence of cheating. If appeals to personal integrity are not enough to convince students not to cheat, a more effective deterrent may be for potential employers to let students know that they fire dishonest employees.
Extra AN INSIDE LOOK News Article to Use in Class Visit www.myeconlab.com for current An Inside Look news articles.
Appendix Using Graphs and Formulas (pages 24–35) Learning Objective: Review the use of graphs and formulas. Graphs simplify economic ideas and make the ideas more concrete so they can be applied to real-world problems.
Graphs of One Variable Figure 1A.1 in the textbook displays examples of two common types of graphs: bar graphs and pie charts. The height of the bars in the bar graph represents the market shares of automobile firms. The pie chart shows the same information with the market shares of each group of firms represented by the size of its slice of the pie. Information on economic variables can also be displayed in time-series graphs. These graphs are displayed on a coordinate grid. The vertical axis (y-axis) of a coordinate grid measures the value of one variable. The point where the vertical axis intersects the horizontal axis is the origin. The horizontal axis of a coordinate grid measures the value of another variable. The points in a coordinate grid represent the values of the two variables. Figure 1A.2 illustrates examples of time-series graphs.

CHAPTER 1 | Economics: Foundations and Models
©2015 Pearson Education, Inc.
12
Graphs of Two Variables We often use graphs to show the relationship between two variables. Figure 1A.3 illustrates the graph of a linear or straight-line demand curve where price is measured along the vertical axis and quantity is measured along the horizontal axis.
A. Slopes of Lines The slope of a straight line indicates how much the variable measured along the y-axis changes as the variable measured along the x-axis changes. Slope can be measured between any two points on the line because the slope of a straight line has a constant value. The slope can be expressed as the change in the value measured on the vertical axis divided by the change in the value measured on the horizontal axis; slope can also be expressed using the Greek letter delta (Δ) to stand for the change in a variable (slope = Δy /Δx). The slope is also referred to as the rise over the run.
Change in value on the vertical axis RiseSlope Change in the value on the horizontal axis Run
yx
Δ= = =
Δ
B. Taking into Account More Than Two Variables on a Graph The demand curve in Figure 1A.4 shows the relationship between the price of pizza and the quantity of pizza sold, but the quantity of any good sold depends on more than just the price of the good. Allowing other variables to change will cause the position of the demand curve in the graph to change. The table in Figure 1A.5 shows the effect of a change in the price of hamburgers on the quantity of pizza demanded. By shifting the demand curve we take into account the effect of changes in a third variable.
C. Positive and Negative Relationships Sometimes the relationship between two variables is negative, as in the case with the price of pizza and the quantity of pizza demanded. The relationship between two variables can be positive, as in Figure 1A.6 which shows values for disposable personal income and consumption spending in the United States for 2009–2012.
D. Determining Cause and Effect Inferring cause-and-effect relationships by observing graphs can lead to incorrect conclusions. One reason for this is that there may be an omitted variable that is not accounted for in the graph. A related problem in determining cause and effect is reverse causality; this occurs when we conclude that changes in variable X cause changes in variable Y, when actually changes in variable Y cause changes in variable X.
E. Are Graphs of Economic Relationships Always Straight Lines? The relationship between two variables is linear when it can be represented by a straight line. Few economic relationships are actually linear. However, it is often useful to approximate a nonlinear relationship with a linear relationship.
F. Slopes of Nonlinear Curves To measure the slope of a nonlinear curve at a particular point, we must measure the slope of a tangent to the curve at that point. A tangent line touches the curve at only one point. The slope of a tangent is measured in the same way as the slope of any straight line.

CHAPTER 1 | Economics: Foundations and Models
©2015 Pearson Education, Inc.
13
Formulas This section reviews several useful formulas and shows how to use them.
A. Formula for a Percentage Change The formula for a percentage change between two variables for any two periods is:
Percentage change Value in the second period Value in the first period 100Value in the first period
−= ×
B. Formulas for the Areas of a Rectangle and a Triangle The formula for the area of a rectangle is Base × Height. The formula for the area of a triangle is ½ × Base × Height.
C. Summary of Using Formulas Follow these steps when using a formula:
1. Make sure you understand the economic concept the formula represents. 2. Make sure you are using the correct formula for the problem you are solving. 3. Make sure the number you calculate using the formula is economically reasonable.
Teaching Tips You can assign the appendix as “on your own” reading. But don’t assume students will understand the formulas for computing a slope or a percentage change. Reviewing these formulas in class will be time well spent, either at this point in the course or when these formulas are first applied. Unlike bar charts and pie charts, students will need to use graphs of two variables and percentage changes often throughout the remainder of the text.
Solutions to End-of-Chapter Exercises
Answers to Thinking Critically Questions 1. The technology discussed in the article will no doubt come with significant monetary costs,
especially in maintaining current databases of medical information. These costs could be prohibitive for a doctor operating a private practice, whereas hospitals would be in a better position to assume such costs. Should the technology discussed in the article actually become a reality, doctors who are not in a financial position to use the technology could find themselves losing patients and, therefore, losing revenue. The increase in the demand for health care could result in doctors working longer hours, especially those in private practice. Doctors who are employed by hospitals often are able to work fewer hours than are doctors in private practice—and working fewer and more regular hours would be an economic incentive to many doctors to become hospital employees.
2. In developing an economic model, economists generally follow these five steps:
1. Decide on the assumptions to use in developing the model. 2. Formulate a testable hypothesis

CHAPTER 1 | Economics: Foundations and Models
©2015 Pearson Education, Inc.
14
3. Use economic data to test the hypothesis. 4. Revise the model if it fails to explain the economic data well. 5. Retain the revised model to help answer similar economic questions in the future.
The primary assumption you would probably make is that increased efficiency will have a positive effect on the level of patient care. The article states that improvements in technology are increasing efficiency, so your hypothesis might be that the increased efficiency is directly related to the level of care received by medical patients. In order to gauge improved efficiency, you would need to:
Collect data on specific cost savings that have resulted from the advancements in technology as well as any increases in costs that are due to the implementation of the technology.
Collect data from patients as to any changes in the level of care they have received following the implementation of the technology.
Look at additional information, such as regulatory changes and potential changes in the industry due to health care reform, and use this information to revise your model if the original model fails to explain well the relationship between your original data.
Once you have a model that does explain your economic data, you would retain that model and use it to help answer similar questions in the future.
1.1 Three Key Economic Ideas Learning Objective: Explain these three key economic ideas: People are rational; people respond to incentives; and optimal decisions are made at the margin.
Review Questions
1.1 “People are rational” is the assumption that decision makers explicitly or implicitly weigh the benefits and costs of each action and then choose an action only if the benefits are expected to outweigh the costs. “People respond to incentives” by changing their behavior in response to an economic incentive. For example, if health insurance reduces an individual’s medical costs from being obese, it may give people an incentive to gain weight. “Optimal decisions are made at the margin” means that most decisions are not “all or nothing” but involve doing a little more or a little less of an activity. Therefore, the optimal decision is to continue any activity up to the point where the marginal benefit equals the marginal cost.
1.2 Scarcity is the situation in which unlimited wants exceed the limited resources available to fulfill those wants. Economics is the study of the choices consumers, business managers, and government officials make to attain their goals. Scarcity is central to economics because scarcity requires people to make choices about how to use their resources to best fulfill their wants. In making choices we must give up other opportunities that we value. What we give up (our second-best choice) is called the opportunity cost of our choice.
Problems and Applications
1.3 Economists assume that people are rational in the sense that they use all available information as they act to achieve their goals. Rational individuals weigh the benefits and costs of each action, and they choose an action only if the benefits outweigh the costs. Economists do not assume everyone is a genius or always makes the “right” decision in every circumstance; rather,

CHAPTER 1 | Economics: Foundations and Models
©2015 Pearson Education, Inc.
15
economists assume that the actions of consumers and businesses reflect their attempts to achieve their goals.
1.4 As noted in the chapter, the economic incentive to banks is clear—it is less costly to put up with bank robberies than to take these additional security measures. The marginal cost of adding the additional security is greater than the expected marginal benefit.
1.5 a. Students face scarcity of time, like everyone else, and respond to the incentives of the teacher’s grading system. Students have more incentive to put their efforts into the parts of the course that have the most weight in the grading system.
b. Putting too little weight on outside readings, or similar assignments, gives students little incentive to read and master the material. Students will put less effort in the parts of the course that have little effect on their grades.
c. Quizzes on assigned readings would give students an incentive to come to class having read the upcoming material. Some teachers give preparation assignments where students have to read and answer questions about the upcoming material, and over the course of the semester students have to successfully complete a certain percentage of the preparation assignments to qualify for an A, B, or other grade in the course.
1.6 Universities and corporations might pay employees to take care of themselves because healthy employees are often more productive and lose fewer workdays due to illness and other health-related issues. Health insurance lessens the incentive for employees to improve or maintain their health, which increases medical expenses and, therefore, the health insurance premiums corporations and universities pay to insurance companies. The wellness programs corporations and universities use give employees an additional incentive to stay healthy, which reduces medical expenses and ultimately health insurance premiums.
1.7 a. Obese workers tend to suffer more medical problems than do people who are not overweight and so incur higher medical costs. The higher medical costs increase the health insurance premiums that firms must pay for employer-provided health insurance, which raises the firms’ costs. Obese workers raise a firm’s costs compared with the costs of workers who are not obese and are paid the same wage. Paying lower wages to obese workers helps firms to offset these higher costs.
b. Bhattacharya and Bundorf found that firms that provide health insurance pay lower wages to obese workers than to workers who are not overweight but that firms that do not provide health insurance pay obese workers the same as workers who are not overweight. These findings imply that obese workers incur higher medical costs, pushing up health insurance premiums, and would be consistent with the idea that health insurance provides people with an incentive to become obese.
1.8 You would want to compare the expected additional revenue with the expected additional cost of serving breakfast all day. Your revenue calculations should include the effect of some customers buying breakfast instead of the more expensive lunch or dinner meals, and your cost calculations should include any extra employees or grills needed to prepare breakfast and lunch or dinner meals at the same time. The decision would not have to be all or nothing. Depending on the effect on additional revenue and additional cost, McDonald’s could decide how long to extend the breakfast hours and which breakfast items to include.

CHAPTER 1 | Economics: Foundations and Models
©2015 Pearson Education, Inc.
16
1.9 Jill is correct because profit equals revenue minus cost, so the additional revenue minus the additional cost will equal the additional profit.
1.10 Your friend is failing to think at the margin. It doesn’t matter how much time your friend has already spent studying psychology. What matters is the marginal benefit to be received from studying psychology relative to the marginal cost, where cost is measured as the opportunity cost of lower grades in other subjects. If the course is required, that may raise the marginal benefit.
1.11 A complete explanation for the connection between majoring in economics and success in business would involve many factors. But we can say that economics teaches us how to look at the trade-offs involved in every decision we make. Those who do not make decisions by weighing the costs of an action and against its benefits are unlikely to make good decisions. Climbing the corporate or governmental ladder requires making a wider and wider array of decisions.
1.2 The Economic Problem That Every Society Must Solve Learning Objective: Discuss how an economy answers these questions: What goods and services will be produced? How will the goods and services be produced? Who will receive the goods and services produced?
Review Questions
2.1 Scarcity implies that every society and every individual faces trade-offs because wants are unlimited but the ability to satisfy those wants is limited. Societies and individuals cannot have everything they want, so they have to make choices of what to have and what not to have.
2.2 The three economic questions that every society must answer are: (1) What goods and services will be produced? (2) How will the goods and services be produced? (3) Who will receive the goods and services? In a centrally planned economy, the government makes most of these decisions. In a pure market economy, almost all of these decisions are made by the decentralized interaction of households and firms in markets. In a mixed economy, most economic decisions result from the interaction of buyers and sellers in markets, but government may play a significant role in the allocation of resources.
2.3 Productive efficiency occurs when a good or service is produced at the lowest possible cost. Allocative efficiency means that what is produced reflects consumer preferences—every good or service is produced up to the point at which the last unit provides a marginal benefit to consumers equal to the marginal cost of producing it.
2.4 Efficiency is concerned with producing the goods and services that people want at the lowest cost. Equity is “fairness,” a concept that can differ dramatically from person to person. Government policymakers often want to make economic outcomes “fairer,” but doing so usually involves redistributing income from one group to another. Redistributing income usually (but not always) hampers efficiency because it reduces incentives to produce and drives up production costs.

CHAPTER 1 | Economics: Foundations and Models
©2015 Pearson Education, Inc.
17
Problems and Applications
2.5 Yes, even Bill Gates faces scarcity because his wants exceed his resources. Gates has established a foundation with billions of dollars to spend on worthy causes like eradicating malaria and reducing homelessness. However, there are an unlimited number of worthy causes that Gates desires to fund, so even he faces scarcity. Secondly, even Gates has only 24 hours in a day, so he must make choices about how to spend his scarce time. Everyone faces scarcity, because human desires are virtually unlimited. Because the world’s resources are limited, the only way not to face scarcity would be to reduce your wants to be less than your resources.
2.6 Spending resources in a way that helps only one poor person is likely to be an ineffective way of helping poor people. How many poor people could be helped by using another method of helping the poor? The opportunity cost of using one method is the number of poor people that could be helped by using the best available alternative method.
2.7 The incentive for a firm in a market economy to be allocatively efficient—producing goods and services that consumers demand—and productively efficient—producing those goods and services at the lowest cost—is profit. If a firm is not allocatively efficient and productively efficient, then it will eventually suffer losses and go out of business.
2.8 Managers in a market system generally have an economic incentive to adopt better machinery and equipment whenever the benefits to their firms exceed the costs. Managers in centrally planned economies rarely are rewarded as directly for such decisions, and they rarely are given the authority to carefully weigh costs versus benefits in making decisions.
2.9 a. It is doubtful that centrally planned economies have been less efficient purely by chance. The underlying reason seems to be that centrally planned economies don’t provide as strong incentives for hard work and innovation as market economies do. In addition, the people running centrally planned economies cannot make the most efficient decisions because they don’t have the information that all the decentralized decision makers possess in a market economy.
b. You might still prefer having a centrally planned economy if you considered it to be more equitable. (Also, you might prefer a centrally planned economy if you were in charge.)
2.10 Answers can vary, but it seems that it would be harder for the centrally planned economy to determine the various goods and services that consumers desire than to determine the cost-minimizing production process. Therefore, centrally planned economies are likely to be better at productive efficiency than allocative efficiency.
2.11 If all of an economic system’s resources were devoted to health care provision, then there would be other important goods and services, such as food, housing, clothing, and education that would not be provided. An economic system that provided its citizens state-of-the-art health care but so little food that most were on the verge of starvation and no housing so that many were sleeping in streets and fields and no schooling so most were illiterate, would generally be regarded as inefficient and treating the population unfairly by depriving them of such important goods and services. A market economy restricts access to health care, just as it restricts access to all goods and services, by charging a price at which less than an unlimited quantity of health care is demanded.
CHAPTER 1 | Economics: Foundations and Models
©2015 Pearson Education, Inc.
18
2.12 a. The groups that are most likely to get the tickets will be those for whom the expected marginal benefit of going to City Hall on Monday morning is greater than the expected marginal cost. These might include people who have a very low opportunity cost of traveling to City Hall and standing in line, such as people who don’t work during the morning and those who live or work very close by. These might also include people who see a large benefit from going to get the tickets, such as die-hard NASCAR fans or professional ticket resellers (“scalpers”).
b. The major opportunity cost of distributing the tickets this way is the cost to the people who attempt to get the tickets—the cost of travel to City Hall, the activities that cannot be done (such as earning money at work) while standing in line, and the costs to all those people who try to get tickets but don’t get there soon enough. There’s also the cost of people blocking traffic in and around City Hall and the lost revenue to the city from giving away the tickets instead of selling them.
c. This isn’t an efficient way to distribute the tickets because it wastes so much time. Auctioning off the tickets to the highest bidder would ensure that those who were willing to pay the highest price would obtain the tickets.
d. Equity is hard to define. Some people will see this way of distributing the tickets as equitable because only the deserving, true fan will put up with the hassle of getting the tickets. Some people might also argue that this system is equitable because the tickets are being distributed for free, making it possible for people with very low incomes to obtain them. Others will disagree, saying that people with a strong desire to obtain the tickets, but who are unable to be at City Hall at the designated time, would have no chance to get the tickets. Other people might argue that the system was not equitable because no money was raised for the taxpayers of the city, who deserve to get the benefits of selling the tickets because they fund the police department.
1.3 Economic Models Learning Objective: Understand the role of models in economic analysis.
Review Questions
3.1 Economists use models for the same reason that other scientists do—to make a complicated world simple enough that problems can be understood and analyzed, and questions can be accurately answered. Useful models will generate testable predictions. If these predictions are consistent with economic data, then the model isn’t rejected and can be used to understand the economy. Testing models with data can be very difficult, however, because the economy is always changing, and it is difficult to conduct controlled economic experiments.
3.2 In arriving at a useful economic model, these five steps are followed: (1) decide the assumptions to be used; (2) formulate a testable hypothesis; (3) use economic data to test the hypothesis; (4) revise the model if it fails to explain the economic data well; and (5) retain the revised model to help answer similar economic questions in the future.
3.3 Positive economic analysis concerns what is; that is, it deals with how the economy actually behaves. Normative economic analysis concerns what ought to be. Economics is mainly concerned with positive analysis—conceptualizing and measuring the costs and benefits of different courses of action. Decision makers (including voters and government officials) can use
CHAPTER 1 | Economics: Foundations and Models
©2015 Pearson Education, Inc.
19
the trade-offs and costs and benefits identified by positive economic analysis in normatively deciding what course of action they should take.
Problems and Applications
3.4 The economist should revise the model in light of its failure to explain or predict real world events.
3.5 The problem with Dr. Strangelove’s theory is that it cannot be tested unless we can devise a way to measure the emission of these subatomic particles, which seems to be impossible because they don’t exist in our universe. Because we cannot test the model’s predictions, it is not very useful to us; even though it might be true, we have no way of knowing.
3.6 It would be helpful to know what role tuition plays in a student’s decision about whether to attend medical school. Have tuition increases had a large effect or a small effect on the number of applications to medical school, particularly for students interested in primary care? How much would paying $50,000 per year during residency affect whether medical students become primary-care physicians or specialists? These economic statistics would help inform the debate but would not resolve it due to the many normative issues, such as whether people who will eventually earn annual incomes that average $200,000 to $350,000 should be receiving reductions in their medical school tuition.
3.7 a. Consumers pay restaurants and hardware stores directly for the goods and services they sell, but doctors’ practices usually get paid indirectly, in many cases by private health care insurers or the government’s Medicare and Medicaid programs. Private health insurers as well as the federal and state governments set the amount that doctors receive for certain medical treatments. The amount of paperwork that doctors must complete in order to be paid for treating patients has increased in recent years.
b. The costs of running a private practice have increased because of increased paperwork and for other reasons, while the revenue received has often declined as health insurers and the government have reduced the amounts they will reimburse doctors for some procedures. So, the economic incentives have increased for doctors in private practice to switch to being salaried employees of a hospital.
3.8 In a private practice, doctors will earn profits (if their revenue is greater than their costs) or losses (if their revenue is less than their costs). A doctor in private practice knows that he or she will receive any additional revenue that results from working harder by, for example, seeing more patients per hour or being available to patients for longer hours. As salaried employees of hospitals, doctors do not share in the profits and losses of the hospitals, as they did in their own private practices. Some doctors may decide to work only as hard as needed to avoid being fired because they know they will not receive a share of the additional revenue the hospital will earn if they were to work harder.
3.9. a. and c. are positive statements because they are “what is” statements; b. and d. are normative statements because they are “what ought to be” statements.
3.10 a. The system helps protect consumers by providing high-quality training for physicians.

CHAPTER 1 | Economics: Foundations and Models
©2015 Pearson Education, Inc.
20
b. This system allows physicians in a specialty to limit the number of physicians in that specialty. Increasing the number of physicians in a specialty is likely to reduce the incomes physicians earn.
c. Occupational licensing is a major topic in economics. While the licensing requirements—in this case the control of the size of residency programs—help ensure high-quality training for physicians, they also are in the self-interest of physicians because the requirements help maintain physicians’ salaries. Given this trade-off, whether the system is a good one is a normative question.
1.4 Microeconomics and Macroeconomics Learning Objective: Distinguish between microeconomics and macroeconomics.
Review Question
4.1 Microeconomics is the study of how households and firms make choices, how they interact in specific markets, and how the government influences their choices. “Micro” means small, and microeconomics deals with individual decision makers. Macroeconomics is the study of the economy as a whole. “Macro” means large, and macroeconomics deals with economy-wide outcomes, such as the inflation rate, the unemployment rate, and the economic growth rate.
4.2 No, because many economic situations have both a microeconomic and a macroeconomic aspect. For example, the level of total consumption spending by households helps to determine how fast the economy grows—which is a macroeconomic issue. But to understand the amount of consumption spending by households, we have to analyze the incentives and constraints individual households face—which is a microeconomic issue.
Problems and Applications
4.3 a. and d. are microeconomic questions because they relate to specific industries; b. and c. are macroeconomic questions because they relate to economy-wide issues.
4.4 You should disagree with the assertion. Microeconomics deals with individual decision makers; because the unemployment rate in any one city would be an issue for the economy of the entire city and not an individual, it is a macroeconomic issue rather than a microeconomic issue. Macroeconomics deals with economy-wide outcomes, so the effect on teen smoking of an increase in the tax on cigarettes is better thought of as a microeconomic issue.

CHAPTER 1 | Economics: Foundations and Models
©2015 Pearson Education, Inc.
21
Solutions to Chapter 1 Appendix
1A.1 a. The relationship is negative because as price decreases, the quantity of pies purchased increases.
b.
c. The slope = ∆y/∆x = rise/run = −1/1 = –1.
1A. 2

CHAPTER 1 | Economics: Foundations and Models
©2015 Pearson Education, Inc.
22
1A.3 Answers will vary somewhat depending on the values determined from the time-series graph. The calculations below use Ford sales rounded to the nearest millions as shown in the table below.
Year Ford’s Auto Sales 2001 7.0 2002 7.0 2003 6.7 2004 6.8 2005 6.8 2006 6.6 2007 6.6 2008 5.4 2009 4.9 2010 5.5 2011 5.7 2012 5.7
Period Percentage Change 2001 to 2002 [(7.0 – 7.0)/7.0] × 100 = 0.0% 2002 to 2003 [(6.7 – 7.0)/7.0] × 100 = –4.3% 2003 to 2004 [(6.8 – 6.7)/6.7] × 100 = 1.5% 2004 to 2005 [(6.8 – 6.8)/6.8] × 100 = 0.0% 2005 to 2006 [(6.6 – 6.8)/6.8] × 100 = −2.9% 2006 to 2007 [(6.6 – 6.6)/6.6] × 100 = 0.0% 2007 to 2008 [(5.4 – 6.6)/6.6] × 100 = −18.2 2008 to 2009 [(4.9 – 5.4)/5.4] × 100 = −9.3% 2009 to 2010 [(5.5 – 4.9)/4.9] × 100 = 12.2% 2010 to 2011 [(5.7 – 5.5)/5.5] × 100 = 3.6% 2011 to 2012 [(5.7 – 5.7)/5.7] × 100 = 0.0% We can conclude that sales fell at the fastest rate between 2007 and 2008.
1A.4 [($14,418 − $14,834)/$14,834] × 100 = −2.8%
The percentage change in real GDP from one year to the next is the economy’s growth rate.

CHAPTER 1 | Economics: Foundations and Models
©2015 Pearson Education, Inc.
23
1A.5 a.
b. At $2.50, the total revenue equals rectangles A + B = $250,000 (because $2.50 × 100,000 = $250,000). At $1.25, the total revenue equals rectangles B + C = $250,000 (because $1.25 × 200,000 = $250,000).
1A.6 The triangle’s area = (0.5) × (175,000 – 115,000) × ($2.25 − $1.50) = 0.5 × 60,000 × $0.75 = $22,500.
1A.7 The slope is calculated using the formula:
Change in value on the vertical axis RiseSlope .Change in value on the horizontal axis Run
Δ= = =
Δyx
At point A: rise = 300 − 175 = 125, run = 7 − 5 = 2. Therefore, the slope = 125/2 = 62.5.
At point B: rise = 900 − 700 = 200, run = 14 – 12 = 2. Therefore, the slope = 200/2 = 100.

©2015 Pearson Education, Inc.
CHAPTER 2 | Trade-offs, Comparative Advantage, and the Market System
Brief Chapter Summary and Learning Objectives
2.1 Production Possibilities Frontiers and Opportunity Costs (pages 38–43) Use a production possibilities frontier to analyze opportunity costs and trade-offs.
The model of the production possibilities frontier is used to analyze the opportunity costs and trade-offs that individuals, firms, or countries face.
2.2 Comparative Advantage and Trade (pages 43–49) Describe comparative advantage and explain how it serves as the basis for trade.
Comparative advantage is the ability of an individual, firm, or country to produce a good or service at a lower opportunity cost than other producers.
2.3 The Market System (pages 50–58) Explain the basic idea of how a market system works.
Markets enable buyers and sellers of goods and services to come together to trade.
Key Terms
Absolute advantage, p. 45. The ability of an individual, a firm, or a country to produce more of a good or service than competitors, using the same amount of resources.
Circular-flow diagram, p. 51. A model that illustrates how participants in markets are linked.
Comparative advantage, p. 46. The ability of an individual, a firm, or a country to produce a good or service at a lower opportunity cost than competitors.
Economic growth, p. 43. The ability of the economy to increase the production of goods and services.
Entrepreneur, p. 54. Someone who operates a business, bringing together the factors of production—labor, capital, and natural resources—to produce goods and services.
Factor market, p. 50. A market for the factors of production, such as labor, capital, natural resources, and entrepreneurial ability.
Factors of production, p. 50. The inputs used to make goods and services.
Free Market, p. 52. A market with few government restrictions on how a good or service can be produced or sold or on how a factor of production can be employed.
Market, p. 50. A group of buyers and sellers of a good or service and the institution or arrangement by which they come together to trade.
Opportunity cost, p. 39. The highest-valued alternative that must be given up to engage in an activity.