ch. 8 vietnam a widening poverty gap for ethnic...
TRANSCRIPT
Indigenous Peoples, Poverty and Development
Ch. 8 Vietnam
A Widening Poverty Gap for Ethnic Minorities
Hai-Anh Dang World Bank
Revised November 2009; revised January 2010
This is not a formal publication of the World Bank. It is circulated to encourage thought
and discussion. The use and citation of this paper should take this into account. The
views expressed are those of the authors and should not be attributed to the World Bank.
1
1. Introduction
Vietnam is a tropical country in Southeast Asia, bordered by China to the north, Lao
PDR to the northwest, and Cambodia to the southwest. The population in Vietnam is
approximately 85 million in 2007, ranking it among the countries with the highest
population densities in the world. Income per capita is estimated at US$ 836 in 2007; the
value-added shares of GDP for agriculture, industry and services in 2006 are respectively
20 percent, 42 percent, and 38 percent (World Bank 2008a.)
Vietnam has 54 ethnic groups. Almost all their languages belong to the five language
families of Southeast Asia and they can be considered as sharing ―the same historical and
cultural horizon of the past which spread from south of the Yangtze River to the Islands of
Southeast Asia‖ (Dang et al. 2000.) Some of these groups have been in Vietnam since the
earliest times (for example, the Viet, the Tay-Thai groups), while some arrived as recently
as around the 17th
to 19th
centuries (for example, the Hanhi, the Lahu, the Lolo groups)
and some came to Vietnam throughout different periods, but mostly in the last millennium
(for example, the Hoa, the Nung, the Vankieu groups) (Dang et al., 2000.) The Kinh or
Viet (ethnic Vietnamese) is the largest group, accounting for 86 percent of the population.
The next largest groups are the Tay, the Thai, the Muong, the Khmer (ethnic Cambodian),
the Hoa (ethnic Chinese), and the Hmong, which together represent 10 percent of the
population, and the remaining ethnic groups make up 4 percent of the population (GSO
2001a).
While terms such as ―indigenous people‖ have been used to refer to ethnic groups of
smaller size than the majority group in certain countries (see, for example, United Nations
Development Group 2008), the preferred terminology in this chapter is ―ethnic minority
groups‖. This term is considered to be the closest translation for the Vietnamese term
―dân tộc thiểu số‖ that is widely used in both official documents and popular speech.1
This chapter defines the ethnic majority group as consisting of the Kinh and Hoa ethnic
groups and ethnic minority groups as the remaining ethnic groups.2
Despite government assistance efforts, these groups still lag behind in living standards
(Swinkels and Turk 2006, World Bank 2008b). Worse still, concerns were voiced that
ethnic minority groups are subject to stereotypes that portray them as negatively as
backward, superstitious, and conservative (Asian Development Bank 2002, Jamieson et al.
1998). The World Bank, in its Country Social Analysis report (World Bank 2009),
identifies six areas where ethnic minorities have a disadvantage compared with ethnic
majorities
1 The term ―dân tộc thiểu số‖ is usually shortened to ―dân tộc” in everyday spoken Vietnamese. This
practice of categorizing ethnic groups into minority or majority groups rather than indigenous or non-
indigenous people can perhaps be traced back to the origin of most major ethnic groups in Vietnam, which
were considered to come as branches of the common ―Bách Việt‖ (multi- ethnic Viet) race from 5000 B.C.
to around A.D. 700-800 (Tran 2001). In addition, the closest terms to ―indigenous people‖ are ―người bản
địa‖ or ―người bản xứ‖ in Vietnamese and these terms in current usage usually refer to people that have
already been living in a certain place before anyone else arrives, for example, the Indian natives in America. 2 By definition, except for the Kinh group, all ethnic groups can be considered ethnic minority groups
because of their small size. However, the Hoa ethnic group is not usually considered an ethnic minority in
Vietnam because of their high cultural assimilation with the majority ethnic Kinh group, and they are also
one of the wealthiest ethnic groups in Vietnam. This approach is also used in earlier studies such as van de
Walle and Gunewardena (2001).
2
Ethnic minorities have less access to education, higher dropout rates, and later
school enrolment. There is lack of ethnic minority teachers and bilingual education
for ethnic minorities. School fees also represent a burden for ethnic minorities.
Ethnic minorities have less mobility, with Kinh migrant households enjoying
better benefits from government programs and their social networks. Kinh
migration even has had negative effects on local minorities in certain places.
Ethnic minorities have less access to formal financial services.
Ethnic minorities have less productive land, while they are more dependent on
swidden agriculture and have less off-farm employment.
Ethnic minorities have lower market access and poorer returns from markets.
While this varies among ethnic groups, ethnic minorities engage in trading
activities less than the Kinh group.
Ethnic minorities are subject to stereotyping and misconceptions, not just among
Kinh households but even among ethnic minorities themselves, which can much
hinder participation by ethnic minorities in their own development.
However, while these results are well-illustrated through a mix of research methods
including literature reviews, focus group discussions, and household surveys, they may
not be nationally representative because this report focuses on three provinces in Vietnam
with the highest ethnic minority poverty (World Bank 2008b).
This chapter further investigates the welfare of ethnic groups, using several nationally
representative surveys. For policies to be efficiently implemented, this chapter aims to
identify the areas with the largest disparities between the ethnic groups. This chapter
begins by reviewing the demographics of ethnic groups in Vietnam and major government
programs for ethnic minority groups. The subsequent sections provide a mostly
quantitative analysis of the welfare outcomes between Vietnamese ethnic groups in
poverty, education, labor market participation, earnings, child labor, health, nutrition and
social protection.3 The final section summarizes the main findings and offers policy
recommendations.
2. Background on Country’s Economic History
Starting with the ―doi moi‖ (renovation) process in 1986, Vietnam’s economy has
made remarkable progress in recent years. Figure 1 shows that it took Vietnam just four
years after 1986 to catch up with and grow faster than most countries in the world.
Between 1986 and 2007, the average growth rate per capita for Vietnam is 5.2 percent,
which is almost double the rate of 2.7 percent for low and middle-income countries and
more than two and a half times higher than the rate of 2.0 percent for high-income
countries. While these steady growth rates have considerably increased living standards in
Vietnam and have been found to benefit the poor more in the 1990s (Glewwe and Dang,
forthcoming), a question can be raised on whether the benefits are shared equally between
ethnic groups.
3. Government Policies and Programs for Ethnic Minorities
3 For a more detailed coverage of these issues (not just for ethnic groups) for Vietnam in the 1990s see, for
example, Glewwe, Agrawal and Dollar (2004); for the welfare impacts of land reforms see Ravallion and
van de Walle (2008).

3
The Government of Vietnam (GOV) has paid much attention to the welfare of ethnic
minority groups. There is a ministerial-level government body, the Committee for Ethnic
Minority and Mountainous Area Affairs (CEMA), which is in charge of management
functions for ethnic minorities and mountainous areas. In geographically strategic areas or
areas with an ethnic minority population of 5000 or more, CEMA has its own
representative agency down to the district-level (GOV 2004a).
Programs that specially target ethnic minority groups are numerous and diverse. These
programs are diverse and cover a wide range of issues including poverty reduction,
resettlement and sedentarization, forest land allocation, education, health and
communication. They benefit those minority groups through several channels such as: i)
their ethnic identity, ii) their (usually mountainous or remote) residence areas, iii) their
(usually poor) economic status, and iv) general social programs for households with war
martyrs, war invalids or recognized as having contributed to the government.
Programs that target ethnic minority groups through ethnic identity include such
activities as cash subsidies on land reclamation, house construction, and drinking water
improvement (GOV 2004b), cash grants on food, production tools and seedlings (GOV
1995), and interest-free loans for poor households (GOV 2007a). Programs that target
ethnic minority groups through their residence areas include such activities as improving
commune and village infrastructure, developing communal centers, planning residential
areas, providing agricultural extension services, and training commune level cadres (GOV
1998a and 2007b). Programs that target ethnic minority groups through their poor
economic status include activities such as reducing poverty rates and creating jobs (GOV
1998b and 2001).4 And programs that target ethnic minority groups through their
contribution to the wars or the government can be provided either especially for ethnic
minority groups (see for example, GOV 2005a) or generally in a variety of legal
documents that include preferential treatment clauses for those with such contribution.
This is a rough categorization since there are often no such clear-cut targeting in
government programs. Major programs such as Program 135 (GOV 1998a and 2007b)
target all the poor communes in ethnic, mountainous and remote areas, and legal
documents such as the 2005 Education Law (NA 2005) stipulates the beneficiaries under
all the four different channels discussed above. More remarkably, the Government of
Vietnam also gives preferential treatment such as price and transportation subsidies to
businesses that operate in mountainous and ethnic areas (GOV 1998c and 2002). Teachers
working in these areas can be entitled to 70% salary increments (GOV 2006a), and
government officials assigned to these areas can be promoted one year earlier (GOV
2006b).
However, concerns have been expressed that these numerous programs may be
overlapping, and may not be very efficiently and adequately supervised in their
implementation (Asian Development Bank 2002, GOV 2005b, World Bank 2008b). In
addition, while these programs clearly contribute to the welfare of ethnic minority groups,
to our knowledge, their costs and benefits have not been evaluated.
4. Data and Methodology
Data for analysis are nationally representative and include two rounds of the Vietnam
Living Standards surveys (VLSSs) (World Bank 2000, 2001) and two rounds of the
4 A detailed review of these programs is provided by Phuong and Baulch (2007).
4
Vietnam Household Living Standards Surveys (VHLSSs) (GSO 2001b, 2004, 2006)
between 1992 and 2006,5 and the 2002 Vietnam Demographic and Health Survey (VDHS)
(CPFC and ORC Macro 2003). However, to keep a reasonable sample size and time span
for analysis, the main data are from the 1997-1998 VLSS and 2006 VHLSS. Other
sources of data include a smaller but nationally representative survey on testing scores6
and the World Development Indicators Online database (World Bank 2008).
Both descriptive statistics and multivariate regression methods are used. As shown
later, ethnic minority groups usually reside in more remote areas. Thus to reduce the
heterogeneity caused by differences in ethnic residence areas, most of the regressions
control for this heterogeneity at the commune level either through commune fixed-effects
or random-effects models. The choice of fixed-effects or random-effects models is mainly
determined by currently available computing software and sample sizes.7 For random-
effects models, commune-level variables are also used to further reduce this
heterogeneity, and these variables include commune poverty status (i.e. the share of poor
households in the commune), commune topography (i.e. whether the commune is in a
lowland or midland area versus mountainous areas), and the distance from the commune
to the nearest town. However, since there are a number of households missing
observations for these commune-level variables, while estimation results using these
variables are also shown, the main models for interpretation are the models without these
variables.
The following sections offer a quantitative analysis of the welfare for different ethnic
groups in Vietnam.
5. Demographics
On average, ethnic minority groups have a similar gender ratio to that of ethnic
majority groups, but they are younger and more likely to be married and living in larger
households (Table 1). Ethnic minority groups live predominantly in rural areas, although
more of them are living in urban areas in 2006 compared to 1998. However, in 2006,
while around 71 percent of ethnic minority groups live in the mainly mountainous North
East, North West and Central Highlands, around 64 percent of the ethnic majority groups
live in the mainly lowland South East and the two deltas: Red River and Mekong River.
Overall, these mountainous and lowland regions account for 21 and 58 percent of the total
population (VHLSS 2006).8
5 In this chapter, sometimes the author’s calculations from the 2006 VHLSS are cited in the text and not
shown in a table. Such cases are noted by (VHLSS 2006), and full tables are available from the author upon
request. 6 This survey collects data on reading and mathematics scores for young students and adults in about 1,350
households across Vietnam, which are a subsample of the 2006 VHLSS. See Dang and Glewwe (2008) for
more details on this survey. 7 While it is straightforward to compute linear fixed-effects models, it is not the case with non-linear fixed-
effects models such as probit models with fixed-effects (see, for example, StataCorp, 2009). And sample
sizes would be reduced in fixed-effects models since communes with only one ethnic group would be left
out in these models. 8 There are currently 64 provinces in Vietnam. According to GSO classification (GSO 2007), these 8 regions
house the following cities and provinces: 1) Red River Delta: Ha Noi, Hai Phong, Vinh Phuc, Ha Tay, Bac
Ninh, Hai Duong, Hung Yen, Ha Nam, Nam Dinh, Thai Binh, Ninh Binh, 2) North East: Ha Giang, Cao
Bang, Lao Cai, Bac Kan, Lang Son, Tuyen Quang, Yen Bai, Thai Nguyen, Phu Tho, Bac Giang, Quang
Ninh, 3) North West: Lai Chau, Dien Bien, Son La, Hoa Binh, 4) North Central: Thanh Hoa, Nghe An, Ha
5
6. Income and Poverty
Income
Ethnic minority groups are overrepresented in the lower tail of the consumption
distribution and underrepresented in the upper tail of the consumption distribution. As
much as 72 percent of the population of ethnic minority groups fall into the poorest three
consumption deciles, and 88 percent of ethnic minority groups fall in the lower half (50
percent) of the population consumption distribution (VHLSS 2006).
Did this situation improve or worsen over time? Figures 2 and 3 compare the
expenditure distributions of ethnic minority groups with those of the ethnic majority
groups in 1998 and 2006. Over this time span, the consumption distributions for ethnic
minority and majority groups in Vietnam shifted to the right, indicating an overall
increase in living standards for all the groups. However, a closer visual inspection
suggests that the two distributions seem to be further apart in this same period. Indeed,
while consumption levels doubled for all ethnic groups from 1998 to 2006, the gap in
average consumption levels between ethnic minority group and the ethnic majority group
actually widened from D 1,500,000 to D 3,100,0009 in the same period. Thus, these
graphs indicate that although all ethnic groups appear to enjoy similar economic growth
rates in Vietnam in recent years, ethnic minority groups are actually falling behind in
terms of relative consumption levels.
In fact, ethnic minority people seem to continue to fall behind ethnic majority groups.
In the period 1992-1998, Glewwe, Gragnolati and Zaman (2002) find that ethnic minority
people have a lower probability of escaping poverty than ethnic majority people.
Then what caused this disparity in living standards between ethnic groups? This
disparity has been decomposed using earlier rounds of the VLSSs into differences due to
endowments and the returns to these endowments. Van de Walle and Gunewardana (2001)
and Baulch et al. (2004, 2007) find that a major share of this gap is due to the returns to
endowments for Vietnam in the 1990s. Baulch et al. (2007) also find that ethnic minority
groups that assimilated most with the ethnic majority (Kinh) society enjoy improved
living standards, while the less assimilated groups have been left behind.10
Poverty
As a result of the recent economic growth, poverty rates have been steadily decreasing
over time in Vietnam. Poverty numbers—both general poverty and extreme (food)
poverty—are shown in Table 2 for the different ethnic groups and the whole population.
(See also Box 1.) The general poverty rates have decreased from around 58 percent in
1993 to 16 percent in 2006; the corresponding figures in the same period for the extreme
Tinh, Quang Binh, Quang Tri, Thua Thien- Hue, 5) South Central Coast: Da Nang, Quang Nam, Quang
Ngai, Binh Dinh, Phu Yen, Khanh Hoa, 6) Central Highlands: Kon Tum, Gia Lai, Dak Lak, Dak Nong, Lam
Dong, 7) South East: Ho Chi Minh city, Ninh Thuan, Binh Phuoc, Tay Ninh, Binh Duong, Dong Nai, Binh
Thuan, Ba Ria- Vung Tau and 8) Mekong River Delta: Long An, Dong Thap, An Giang, Tien Giang, Vinh
Long, Ben Tre, Kien Giang, Can Tho, Hau Giang, Tra Vinh, Soc Trang, Bac Lieu, Ca Mau. 9 The exchange rates in 1998 and 2006 were around US$ 1 for D 14,000 and D 16,000 respectively (IMF,
2006 and 2007). 10
In a similar vein, Nguyen et al. (2007) also find that the gap in living standards between urban and rural
areas in Vietnam in 1992-1993 is mostly due to differences in endowments, but the gap in 1997-1998 is
mainly caused by differences in the returns to endowments.

6
poverty rates are 25 percent and 6 percent. Thus, from 1993 to 2006, every year sees an
average reduction rate of 3.2 percent and 1.5 percent in general and extreme poverty in
Vietnam.
However, not all ethnic groups enjoy the same decreases in poverty rates. Table 2 also
shows that ethnic minority groups lag behind the ethnic majority groups in their struggle
against poverty. While the general poverty rate for the ethnic majority group went down
by 71 percent [(54-10)/54 = .71] from 1993 to 2006, the general poverty rate for ethnic
minority groups declined by only 42 percent in the same period. Similarly, the extreme
poverty rates decreased by 85 percent for the ethnic majority group but decreased by only
48 percent for ethnic minority groups from 1993 to 2006. Consequently, poverty rates for
ethnic minority groups over those of ethnic majority groups actually diverged over time,
and the ratios of poverty rates for ethnic minority groups over those of the ethnic majority
groups are estimated to increase by around three times or more from 1993 to 2006 (last
column).11
The determinants of household poverty status are examined in two models in Table 3,
which have the same explanatory variables except that Model 2 further control for the
commune topography and the distance to the nearest town. Estimation results are very
similar across the two models. Factors that increase the probability that a household is
poor include ethnicity, numbers of young or old household members, and the household’s
residence area (compared to the South East region—the reference region); factors that
decrease the probability that a household is poor include the number of working age
members, the household head’s age and years of schooling completed, and whether the
household lives in urban areas. And according to Model 2, households living in
communes that are more isolated and that are located in mountainous areas are more
likely to be poor. However, as discussed above, the main model for interpretation is
Model 1 since there are quite a number of missing observations for the commune-level
variables.
Table 3 also shows the marginal effects for each independent variable which are
calculated at the mean of these variables, keeping other characteristics constant.
Households belonging to ethnic minority groups are 14 percent more likely to be poor
than household in ethnic majority groups, controlling for other factors. The usual positive
impact of working age members on household living standards is clearly seen: while one
more member in the age group 0 to 6 (or 60 and higher) increases the probability of
household being poor by 6 percent (or 2 percent), one more member in the age group 25
to 59 reduces this probability by 1 percent.
Households living in urban areas are 4 percent less likely to be poor (but this urban-
rural divide seems to be mainly caused by the distance to the nearest town or the
commune topography according to Model 2). Households living in all regions except for
the Mekong Delta are more likely to fall into poverty status than households living in the
South East region—where Ho Chi Minh city, the economic capital of the country, is
placed. Compared to the South East region, households living in the North East, North
11
During this same period, both the depth and severity of poverty—as measured by the poverty gap index
and the Foster-Greer-Thorbecke (FGT) index respectively—are reduced at a faster rate for the ethnic
majority group than those of ethnic majority groups (70 percent versus 40 percent). In 2006, ethnic minority
groups’ poverty gap index and the FGT index are 7 to 8 times higher than those for the ethnic majority
groups (VHLSS 2006).
7
West and North Central regions are 12 percent to 27 percent more likely to be poor.
Notably, ethnic minority groups are heavily concentrated in these three regions: while
these regions house 64 percent of the ethnic minority population, they make up only
around 29 percent of the total population (VHLSS 2006).
The role of the household head is important in poverty reduction. One additional years
of schooling for the head would decrease the probability of households being poor by 2
percent. Compared to household heads working in more than one sectors, those who work
in the agriculture sector only are 2 percent less likely to live in a poor household, those
working in the service sector only are 5 percent less likely to be poor. However, to the
extent that household heads can choose their occupation, household heads’ occupation
should be considered as a correlate rather than a determinant of household poverty status.
But this shows that poverty can be reduced through restructuring the economy perhaps
toward service-oriented industries.
The probabilities of the household falling into poverty given the household head’s
characteristics are calculated in Table 4. A household where the head has zero years of
schooling has a 52 percent chance of being poor, but has only 2 percent chance of being
poor if the head has 12 years of schooling, and almost 0 percent chance of being poor if
the head has 16 years of schooling (equivalent to a university degree). A household where
the head works in agriculture has a 19 percent chance of being poor, but has only 2
percent chance of being poor if the head works in service. However, given the same
household head’s years of schooling or work sector, ethnic minority households are much
more likely to fall into poverty than ethnic majority households. The probabilities range
from 9 percent to 52 percent higher for heads with 12 and 0 years of schooling
respectively.
7. Employment
Together with the strong performance in recent years, Vietnam’s economy has
undergone a restructuring as shown in Table 5. This includes the downsizing of the
agricultural sector and the increase in the wage work sector: the share of employment in
agriculture decreased from 44 percent in 1996 to 34 percent in 2006, while the share of
wage work increased from 12 percent to 23 percent in this same period. While there was a
decrease in the combined agriculture and service sector, there was a slight increase in the
service sector and the combined wage work and service sector from 1998 to 2006. At the
same time, the share of self-employed workers decreased from 81 percent to 67 percent,
and the share of the private sector increased almost three times from 7 percent to 20
percent. There can be several reasons for this restructuring of the economy. The first
reason is that economic growth rate per capita for Vietnam averaged 5.2 percent in this
period, ranking the country among the fastest growing economies in the world (Figure 1).
The second reason can be due to trade liberalization. Edmonds and Pavnick (2006) shows
that trade liberalization helped reallocate labor between the households and the market in
the period 1992-1998. It is possible that the same mechanism was at work in the
subsequent period.
Although there was a similar change in the occupation redistribution ethnic minority
people—ethnic minority groups in fact have higher growth rates in the wage work sector
and private sector—ethnic minority groups still appear to lag behind ethnic majority
groups in all modern sectors. In 2006, while agriculture accounts for only 30 percent of
8
ethnic majority employment, it makes up 55 percent of ethnic minority employment. The
wage work sector for ethnic minority people is around 8 percent, less than one-third of
that of ethnic majority people, and the service sector is around 2 percent, less than one-
seventh of that of ethnic majority groups. A disproportionate share of ethnic minority
people are self-employed (85 percent) and this share is around 20 percent higher than that
of ethnic majority people. Similarly, the shares of ethnic minority people working in the
private sector or the public sector are less than half of those of ethnic majority people.
The determinants of earnings are examined in Table 6. Controlling for other factors,
the average ethnic minority worker earns 15 percent less than the average ethnic majority
worker, while the average female worker earns 21 percent less than the average male
worker. (One more year of schooling will bring a 4 percent increase in earnings while the
corresponding figure for one more year of experience is 3 percent.) Workers employed in
the private sector, public sectors or foreign-invested sector earn from 108 percent to 134
percent more than workers employed in the agricultural sector. While the rate of returns to
education for ethnic majority workers is around 2 percent higher than ethnic minority
workers, their rate of returns to the number of hours worked is around 6 percent less than
ethnic minority workers. However, given that ethnic majority people have on average 2.5
more years of schooling than ethnic minority people (as shown later in Table 10), the
former can suggest either lower quality of education or less access to better employment
or more discrimination towards ethnic minority workers in the market or any combination
of these factors.12
Perhaps the latter can be partly explained by the law of diminishing
returns because ethnic minority people work 2 hours fewer per week than ethnic majority
people (VHLSS 2006).
In fact, the earnings differential in Table 6 between the ethnic minority group and
majority groups can be decomposed into two parts, one due to the differential in
endowment and the other due to the differential in returns to endowments or wage
structure. The latter part is also known to be caused by unobserved factors such as ethnic
differentials in the quality of schooling, individual ability, culture or labor market
discrimination. These differentials are considered in 2006 and in 1998 as well in Table 7
using three methods of decomposition: Oaxaca-Blinder, Cotton, and Oaxaca and
Ransom.13
According to Table 7, differences in endowments explain from 66 percent to 74
percent of the earnings differential between the ethnic groups, while differences in the
wage structure explain from 26 percent to 34 percent of the earning differential. The range
of the earnings differential due to endowments decreased (or the range of the earnings
12
These results are qualitatively similar in the basic Mincerian earnings function where log of earnings is
regressed on only ethnicity, gender, years of schooling and work experience. 13
The Oaxaca-Blinder decomposition method (Oaxaca 1973; Blinder 1973) decomposes the ethnic
differentials assuming either the ethnic minority or majority wage structure will prevail in the absence of
discrimination. Thus, depending on which assumption that is used, this method will provide a range of
estimates. The Cotton decomposition method (1988) uses the employed population shares of different ethnic
groups to weight the coefficients in Table 34 to obtain the non-discriminatory wage structure. Thus, by
construction, the wage structure using the Cotton method will be somewhere between the range of estimates
using the Oaxaca-Blinder method (and is closer to the ethnic majority wage structure the larger the
employed population share the ethnic majority group have). The Oaxaca and Ransom (1989, 1994) method
calculates the non-discriminatory wage structure by combining the Cotton wage structure with a common
wage structure derived by an OLS regression using a pooled sample of both ethnic minority and majority
groups.
9
differentials due to the wage structure increased) from 1998, reflecting a wider gap in the
unobserved factors between ethnic groups. One such increasing factor can be increasing
rates of returns to education for ethnic majority groups as shown in Table 6.
The contribution of each of the explanatory variables in Table 6 to the earnings
differential between ethnic groups is further considered in Table 8, with absolute amount
shown in the first two columns and relative amount (percentage) shown in the last two
columns; and a positive coefficient indicates impacts in favor of ethnic majority groups
and a negative coefficient indicates impacts in favor of ethnic minority groups.
Table 8 shows that the higher share of ethnic majority people working in the private
sector can explain up to 26 percent of the ethnic earnings differential. And the higher
mean years of schooling completed by ethnic majority groups can explain 14 percent of
the ethnic earnings differential. Ethnic majority people also have higher returns to
education as discussed above, and these higher return rates alone account for 13 percent of
the ethnic earnings differential. However, the returns to the hours worked are higher for
ethnic minority people than ethnic majority people, thus help reducing the ethnic earnings
differential by 44 percent. It should also be noted that the constant term (the last column in
Table 8 explains the most—as much as 55 percent—of the earnings differential due to
different returns to endowments. This implies that regardless of all factors considered such
as gender, education, working experience or work sectors, there are unobserved factors
that are in favor of ethnic majority earnings. As discussed earlier in Table 6, such factors
can include labor market discrimination against ethnic minority groups or differentials in
the quality of schooling.
Child Labor
For children age 6-18, around 14 percent of ethnic minority children go to school and
work at the same time, while the corresponding figure for ethnic majority children is more
than three times lower at 4 percent (VHLSS 2006). The disparity in child labor between
ethnic groups is illustrated in Figure 4, which plots the incidence of child labor for a wider
age range 6 to 25. A wedge can be seen between ethnic minority children and ethnic
majority children, with the incidence of child labor for the former always higher than that
for the latter. This wedge is largest at more than 25 percent around age 15, the legal
working age in Vietnam.
The probability of child work is further considered in Table 9, which shows that
controlling for other factors, ethnic minority children are 3 percent more likely to work
than ethnic majority children. Among the working children, ethnic minority children are
16 percent more likely to work and go to school at the same time, and 26 percent more
likely to work for wage.14
However, the fact that ethnic minority children are more likely
to work at home rather than for wage does not necessarily reflect their better welfare
levels. On the contrary, it can also indicate that the labor market is not well-developed and
wage work is not readily accessible for ethnic minority children (even if they wanted to
work for wage.)
Not surprisingly, both the household head’s educational level and household
consumption level have a negative impact on the probability that children work or work
14
Estimation results using commune characteristics are very similar but not shown here to save space.

10
for wage. Larger household sizes are correlated with lower probabilities that children can
spend all their time attending school.15
Clearly, child work should be reduced as much as possible. Child work can have
undesirable effects on children’s well-being in several ways such as loss of schooling and
reduced health. In an earlier study for Vietnam that uses the VLSSs 1992-1993 and 1997-
1998, O’Donnell, Rosati and van Doorslaer (2005) find that work undertaken during
childhood can have a lasting negative impact on children’s health up to five years later.
Using the same survey data, Beegle, Dehejia and Gatti (2009) found that child labor has
significant negative impacts on school participation and educational attainment, but is
associated with an increased likelihood of wage work. However the authors also
acknowledged that they could not estimate the impact of child labor on future earnings in
the absence of more precise wage and labor productivity data.
8. Education
Illiteracy rates have been steadily decreasing in Vietnam, although at a faster rates for
ethnic majority groups. From 1993 to 2006, illiteracy rates were reduced by half from 24
percent to 12 percent for ethnic majority groups, but were reduced from 50 percent to 29
percent for ethnic minority groups (VHLSS 2006). It is worrisome that the illiteracy rate
for ethnic minority groups in Vietnam in 2006 was even higher than that for ethnic
majority groups in 1993. However, the gap in literacy rates between ethnic groups seems
to be narrowing over time.
The general educational achievement for different ethnic groups is shown in Table 10.
Ethnic minority groups can almost catch up with ethnic majority groups in the share of
people age 15 and over who are still in school. However, these numbers can be misleading
due to several reasons. First, ethnic minority people can start school later than their ethnic
majority peers. Second, ethnic minority groups can repeat or drop out of classes more
often. Third, the quality of education may not be the same between the different ethnic
groups. These issues will be discussed in more detail.
For people who are out of school, Table 10 shows the highest educational achievement
that they obtain. In general, educational achievement for ethnic majority groups is similar
to that of the total population and appears to follow a roughly bell-shaped distribution. In
this distribution, the share of people with a completed primary degree is highest at 26
percent, followed by the share of people with a completed lower secondary degree (25
percent), followed by the share of people with incomplete primary education (20 percent),
and the share of people with a completed upper secondary degree (14 percent). The share
of people with a tertiary degree is somewhat similar to the share of people with a
vocational education, at 5 percent.
However, the distribution of educational achievement for ethnic minority groups is
strongly skewed (right-skewed) towards higher school levels. In this distribution, the share
of people with a completed primary degree is highest at 26 percent, followed by the share
of people with an incomplete primary education (25 percent), the share of people with no
15
Macro-economic factors such as the economy being more open to international trade can also help reduce
child labor. Using data from the VLSSs 1992-1993 and 1997-1998, Edmonds and Pavcnik (2005) find that
trade liberalization, in particular higher rice prices, are associated with declines in child labor for households
that are net rice producers.

11
education (24 percent), and the share of people with a completed lower secondary degree
(17 percent). Around 8 percent of ethnic minority people have a completed upper
secondary degree, and less than 1 percent of them have a tertiary degree; these numbers
are respectively around one half and one fifth those of the ethnic majority groups.
The pattern of lower educational achievement for ethnic minority groups is confirmed
in Figure 5, which looks at the mean years of schooling attained for different birth cohorts
from 1945 to 1985. (The year 1985 is chosen as the last year to allow for the fact that the
majority of people may not finish schooling until 20 years old or so.) There is a consistent
gap of around 3 years of schooling between the ethnic groups across the different birth
cohorts. It should be noted that this gap widens around the period 1966-1975, which
coincides with the Vietnam war. However, the gap seems to be narrow for recent birth
cohorts. In particular, women in birth cohorts further away from the war have higher
educational achievement. Further analysis shows that the differences range from 0.5 to
more than 1 years of schooling for women in different birth cohorts, when controlling for
other factors (Dang and Patrinos 2008).
Age-grade distortion, which is defined as the percentage of students who are more
than one year behind the age that is appropriate for their grade, is considered in Table 11.
For example, the age-grade distortion for grade 3 in all Vietnam is 19 percent, indicating
that 19 percent of students studying in grade 3 are older than age 8, which is the
appropriate age for this grade level. Age-grade distortion is a particularly serious problem
for ethnic minority people, with a rate higher than 30 percent at all primary grades except
for grade 1. Table 11 shows that there is a large disparity in the age-grade distortion rates
between ethnic minority groups and ethnic majority groups. This disparity ranges from
around 3 percent for the first grade to more than 20 percent for the second grades and
higher.
While age-grade distortion is a useful indicator of educational achievement, its large
scope of definition can include several different problems such as late enrolment, class
repetition, and school discontinuation (that is, dropping out of school and then
reenrolling). Thus the factors determining school enrolment for young people age 7-14 are
considered in more detail in two models in Table 12. The second model adds to the list of
explanatory variables in the first model the numbers of household members of different
age groups and commune characteristics. While results are rather similar across the two
models, the main model for interpretation is Model 1 because of the sharp reduction in the
number of observations and the endogeneity of family size in Model 2. In addition, the
coefficients on the numbers of household members and commune characteristics are
statistically insignificant, suggesting that these variables can be left out.
Factors that increase the probability of school enrolment are an individual’s age
(although age-squared has a negative impact), the household head’s education, the
household expenditure level, and residence areas. The positive impact of age may be
caused by late enrolment for some people, as can be seen in the high percentage of age-
grade distortion in Table 11. Controlling for other factors, one more year of schooling for
the household increases the probability of school enrolment by 0.2 percent, and people
living in all geographic regions except for the Mekong Delta are 1-2 percent more likely
to enroll in school than people living in the South East region. Keeping other factors fixed
at the mean, ethnic minority people are 0.6 percent less likely to enroll in school than
ethnic majority people.
12
The finding that household expenditure level increases the probability of school
enrolment concurs with an earlier study for Vietnam by Glewwe and Jacoby (2004).
Using panel data from the VLSSs 1992-1993, and 1997-1998, Glewwe and Jacoby (2004)
find that child enrolment increased faster in households that gained greater increases in
wealth and grade attainment increased by 0.25 for these households.
The probabilities of being enrolled in school for those aged 7 to 14 are calculated in
Table 13. Keeping other characteristics fixed at the means, the probability that a child age
7 to 14 enrolling in school is 88 percent in a household where the head has 0 years of
schooling. But this probability increases to 97 percent or 100 percent if the head has 6 or
12 years of schooling respectively. At the same time, the probability that a child is
enrolled in school is 92 percent for a poor household, and 98 percent for a non-poor
household. Thus, the impact of a household head with 12 years of schooling on school
enrolment rates is very similar to (although slightly higher than) that of a non-poor
household. Depending on the relevant cost-benefit scenarios, this would clearly suggest
alternatives in improving school enrolment to policy makers.
Quality of Education
Table 14 investigates the determinants of reading and mathematics on standardized
test scores for individuals with 3 to 12 years of schooling. Due to the design of this survey
data, 16
Models 1 and 2 consider those with 3 to 7 years of schooling aged 9-15, Models 3
and 4 consider those with 8 to 12 years of schooling aged 14-20, and finally Models 5 and
6 consider those with 3 to 12 years of schooling aged 9-20.
Factors that significantly affect test scores include an individual’s years of schooling,
age (and age-squared), ethnicity, household consumption, and household heads’
education. Estimation results are qualitatively rather similarly across the models.
However, the magnitude of the coefficients on Models 5 and 6 is usually smaller than
those in other models, perhaps due to either a larger sample size or a wider age range or
both.
Controlling for other characteristics, while one more years of education for the
household head can raise test scores by less than 0.1 standard deviations, one more years
of schooling for the individual can raise test scores from 0.1 to 0.3 standard deviations. A
270 percent increase in the per capita expenditure can increase test scores by 0.2 to 0.3
standard deviations. Ethnic minority individuals score from 0.2 to 0.5 standard deviations
lower than ethnic majority individuals.17
This suggests that even if ethnic minority
individuals have the same years of schooling as their ethnic majority peers, the quality of
their education is lower. This concurs with an earlier World Bank study on Grade 5
students in Vietnam, which finds that students who always spoke Vietnamese outside
school or belonged to the ethnic majority Kinh group were likely to have higher test
scores than students who never speak Vietnamese outside school or belong to the ethnic
minority groups (World Bank 2004).
16
See Dang and Glewwe (2008) for more details on this survey and the test scores. 17
When commune characteristics are added to Models 5 and 6, the coefficients on the ethnic variables are
still negative but are significant only at the 10% level for reading scores and insignificant for math scores.
However, estimation samples are reduced by around 30% in these models, and the commune variables either
statistically insignificant or marginally significant at the 10% level.
13
There can be several reasons for lower education quality for ethnic minority groups.
First, as discussed earlier, ethnic minority groups have a lower consumption level than
ethnic majority groups, thus ethnic minority students may not have the same learning
materials or opportunities (for example, books or computers) as ethnic majority students.
Second, ethnic minority students are more likely to drop out of school and have higher
age-grade distortion rates (Table 11). Third, the general educational achievement levels
for ethnic minority groups are lower than those of ethnic majority groups, implying that
ethnic minority parents may not be able to help with their children’s studies as much as
ethnic majority parents do. Fourth, as shown later in Table 21, ethnic minority students
have to travel longer distances to get to school, which can reduce their time and energy for
studies.
An important difference in learning opportunities between the ethnic groups is extra
classes or private tutoring, which is a popular phenomenon in Vietnam and can have a
strong impact on student learning outcomes (Dang 2007 and 2008). It can be calculated
from the 2006 VHLSS that ethnic majority students are from 33 percent to 43 percent
more likely to attend extra classes than ethnic minority students.
9. Health
There is a large improvement in health for the total population from 1998 to 2006,
with the share of the total population who are sick or injured in the past four weeks
decreased from 41 percent in 1998 to around 23 percent in 2006 (VHLSS 2006).
However, Table 15 shows that the both the infant mortality rate and under-five
mortality rate for ethnic minority groups are higher than those for ethnic majority groups.
The infant mortality rate for ethnic minority groups is 30 per 1000 live births, but the
corresponding figure for ethnic majority groups is 23 per 1000 live births (but note the
large standard error of the estimate for ethnic minority groups). And the under-five
mortality rate for ethnic minority groups is much higher at 41 per 1000 live births, while
the corresponding figure for ethnic majority groups is 28 per 1000 live births. These
differences suggest that ethnic minority groups have yet to enjoy the same health
conditions level that ethnic majority groups have. But these differences also appear to be
strongly correlated with (the remoteness of) the residence area for ethnic minority groups.
Table 15 also shows that the mortality rates in rural areas are more than twice higher than
in urban areas in Vietnam.
The vaccination rates for children age 12-23 months are shown in Table 16. A child is
considered to be fully vaccinated if the child has received a Bacillus Calmette-Guerin
(BCG) vaccination against tuberculosis, three doses of diphtheria, pertussis and tetanus
(DPT) vaccine, at least three doses of polio vaccine, and one dose of measles vaccine
(WHO, 2005.) The age range is limited to children age 12-23 months because a child
should have received these vaccinations at these ages. Children in Vietnam are most likely
to be vaccinated against BCG (93 percent), followed by measles (83 percent), polio (76
percent) and DPT (72 percent). The same trend holds for children belonging to different
ethnic groups and living in urban and rural areas (but the vaccination rates for measles and
polio are almost equal for urban area.) The vaccination rate for Vietnam stands at 67
percent; however, the rate for ethnic minority children is much lower at 38 percent, almost
half that of 73 percent for ethnic majority children.

14
However, most of this gap in health care can be attributed to other factors such as the
differences in living standards or residence areas. It was estimated that, controlling for
other factors, poor ethnic minority children age 11-23 months living in rural areas are 15
percent less likely to be fully vaccinated than their ethnic majority peers (Thang et al.
2007).
Table 17 shows that health care appears to have improved for ethnic minority groups
in recent years. From 1998 to 2006, health care has improved for the whole population,
but at a faster rate for ethnic minority groups compared to ethnic majority groups. The
share of the total population without any medical insurance decreased by almost half from
86 percent in 1998 to 46 percent in 2006, but the share of ethnic minority groups fell by
more than 4 times from 91 percent to 21 percent in this same period. In particular, in 2006
the share of ethnic minority groups with free medical insurance is 44 percent, more than 5
times higher than that of ethnic majority groups. (Unfortunately, there were no
disaggregated data on free medical insurance in the 1998 VLSS, thus we cannot examine
any difference in this category between the ethnic groups in this year).
This is perhaps due to a number of preferential government policies during this period
targeted at ethnic minority groups, notably among them Program 139 established in 2002.
After two years of implementation, 4.15 million poor people were issued free health care
certificates under this program (Phuong and Baulch 2007). As discussed in the section
above, since ethnic minority groups represent a larger share of the poor in Vietnam, they
understandably account for a proportionately larger share of people who are granted free
health care certificates. However, having a free healthcare certificate does not necessarily
mean better quality health care for ethnic minority groups. It has been noted that the
treatment readily accessible to poor ethnic minority people at the commune health centers
are deficient and constrained by expenditure ceilings (Phuong and Baulch 2007).
Furthermore, as shown later in Table 21, ethnic minority groups live in communities with
much less access to health facilities than ethnic majority groups.
In absolute terms, ethnic minority groups also have lower health care expenditure. An
average ethnic minority outpatient spend only D 493,000, and an average ethnic minority
inpatient spend only D 3,038,000, which are 18 percent and 34 percent those for the
average ethnic majority patients (VHLSS 2006).
Is it possible that this lower healthcare expenditure is due to a higher proportion of
health insurance usage among ethnic minority people? The answer appears to be no.
While a recent study using earlier rounds of the VLSS shows that health insurance can
reduce health expenditure by as much as 35 percent (Sepehri, Sarma and Simpson 2006),
even if this is taken into account, ethnic minority people still have much lower health
expenditure than ethnic majority people.
Since the number of visits to hospital can be considered a count variable, Table 18
estimate the number of visits to hospital for ethnic groups using the fixed-effects Poisson
model. Controlling for age, gender, log of per capita expenditure, marital status and years
of schooling, ethnic minority people are 16 percent (100 – 84) less likely to visit hospital
when they are ill compared to ethnic majority people. However, there is no statistical
difference between the incidences of inpatient treatment for the different ethnic groups.
Not surprisingly, Table 18 also shows that richer and more educated households visit
hospital more often, both as outpatients and inpatients.

15
As shown in Table 19, knowledge about AIDS is rather good in Vietnam for women
who are ever-married and in the age group 15 to 49, with 95 percent of these women ever
hearing about AIDS. However, out of those who ever heard about AIDS, only 78 percent
have the correct perception about AIDS (that is, a healthy person can contract AIDS), and
93 percent knows of a way to avoid AIDS.
There is a difference in knowledge about AIDS for different ethnic groups. Compared
to women belonging to ethnic majority groups, women belonging to ethnic minority
groups are 12 percent less likely to ever hear about AIDS, 18 percent less likely to have
the correct perception about AIDS, and 8 percent less likely to know ways to avoid AIDS.
This difference is much larger than the urban-rural divide in knowledge about AIDS,
which only ranges from 2 percent to 8 percent. This implies that there is still room for
improvement in promoting awareness of AIDS among ethnic minority women.
10. Household/ Community Services and Social Protection
Overall, ethnic minority people have higher access to social programs such as
preferential credit, free health care, tuition exemption or reduction and agricultural
promotion activities (VHLSS 2006). However, they appear to have lower access to
community services.
Utility access and household assets are considered for ethnic groups and urban-rural
areas in Table 20. For all life utilities including potable water, electricity, sanitary
conditions, Internet connection, housing, and garbage collection, ethnic minority people
have lower access than ethnic majority people. The same situation is true for people living
in rural areas compared to people living in urban areas. The gap in utility access can range
from 4 percent to as much as 50 percent in favor of ethnic majority groups, and from 5
percent to 39 percent in favor of people in urban areas. For example, only 57 percent of
ethnic minority people have potable water, while 90 percent of ethnic majority people
have potable water. The corresponding numbers for people living in rural and urban areas
are respectively 82 percent and 96 percent.
A similar pattern can be seen with household assets including radio, television set,
video recorder/ stereo system, refrigerator, washing machine, motorbike, bicycle, air-
conditioner, desk telephone, mobile telephone and computer, where ethnic minority
people have less than ethnic majority people and people living in rural areas have less than
people living in urban areas. Again, the gap can range from 4 percent to 30 percent in
favor of ethnic majority people and from 5 percent to 46 percent in favor of people living
in urban areas. The two exceptions are home ownership and bicycle ownership. Ethnic
minority people are 2 percent more likely to own a home and people in rural areas 3
percent more likely to own a home than people in urban areas. People in rural areas are 9
percent more likely to own a bicycle than people living in urban areas.
However, these exceptions do not necessarily imply that ethnic minority people or
people in rural areas are better off in these respects. Table 20 also shows that ethnic
minority people and people in rural areas are more likely to have housing of lower quality,
and less likely to own a motorbike, which is fast becoming a popular means of transports
in Vietnam nowadays. Table 20 also shows that ethnic minority groups are the most

16
disadvantaged groups in the country. Except for home ownership, ethnic minority people
have lower utility access and less household assets than people in rural areas.18
Access to community facilities for communes with only ethnic minority groups, mixed
ethnic groups, and only ethnic majority are depicted in Table 21. Generally, ethnic
minority communes are least served by or farthest away from the available community
facilities, followed by mixed ethnicity communes, and ethnic majority communes. For
example, 31 percent of ethnic minority communes have a radio station, while the
corresponding figure is 75 percent for mixed ethnicity communes and 93 percent for
ethnic majority communes. While the provincial hospital is 86 kilometers away for ethnic
minority communes, it is around half nearer at 46 kilometers for mixed ethnicity
communes, and around two-third nearer at 30 kilometers for ethnic majority communes.
And the average distance to a paved road is around 1 kilometer for ethnic minority
commune and mixed ethnicity communes, which is 5 to 6 times larger than that for ethnic
majority communes. However, there are also some exceptions such as the distances to
primary schools or commune health centers are almost equal for the different communes.
11. Conclusions
Despite much progress in living standards, health, and education in recent years,
ethnic minority groups still lag behind ethnic majority groups in Vietnam. In 2006, the
general poverty rate for ethnic minority groups is 52 percent, more than five times that of
ethnic majority groups; the extreme poverty rates for ethnic minority groups is 29 percent,
more than nine times that of ethnic majority groups. Ethnic minority people have lower
quality health care than ethnic majority groups, and they are 16 percent less likely to visit
hospital when they are ill. Ethnic minority infant and under-five mortality rates are higher
those of ethnic majority groups, and ethnic minority women are less like to know or have
the correct perception about AIDS. The illiteracy rates for ethnic minority groups are 29
percent, more than twice that of ethnic majority people; the mean years of schooling
attained is 5.6 for ethnic minority groups, 2.5 years less than that of ethnic majority
groups.
While there has been a restructuring for the Vietnamese economy in recent years,
more than half (55 percent) of ethnic minority groups still work in agriculture; the
corresponding number for ethnic majority groups is less than one third (30 percent).
About two thirds of the earnings differentials between ethnic groups can be attributed to
differences in endowments, and one third due to differences to the returns to endowments.
Ethnic minority children are more likely to drop out of school and work than ethnic
majority children.
Despite various government assistance programs that are specially targeted at ethnic
minority groups, ethnic minority people still suffer from lower utility access and
household assets than ethnic majority people. Ethnic minority groups’ utility access and
household assets are also lower than those for people living in rural areas, placing them as
the most disadvantaged groups in the country.
18
In Table 20, Internet connection rates are only calculated for households with computers. Thus among
households with computers Internet connection rate for ethnic minority groups appears to be close to that for
ethnic majority groups, but among all households, Internet connection rate would be much lower for ethnic
minority groups.

17
Policies to level the disparities between ethnic minority groups can be roughly divided
into either a short-term approach or a longer term approach. Short-term policies arguably
would take less efforts to implement and can be targeted at urgent issues, while long-term
policies may take longer and more resources to come into effect. Clearly, the criteria to
categorize policies are highly context-specific and can be subjective, but we believe that
this division may help to focus ideas and stimulate more discussion.
In that respect, short-term policies can include such measures as
i) building more roads for ethnic minority communes. Table 21 shows that ethnic
minority groups are much farther way from commune facilities than ethnic
majority groups. Thus one way to reduce this distance and to immediately improve
the welfare of ethnic minority groups is to provide them with easier access to the
economic, political and cultural centers such as schools, hospitals, markets, post
offices and town centers. One recent study also shows that building roads has
significant and robust impacts on primary school completion rates in Vietnam and
poorer communes tend to benefit more (Mu and van de Walle 2007).
However, it also argued that building roads is not always the best solution because
it can bring negative impacts on the environment as well as ethnic minority
communities’ lifestyle. Obviously, there is some tradeoff that needs to be carefully
considered with this policy.
ii) increasing knowledge about AIDS among ethnic minority women and vaccination
for ethnic minority children. Perhaps few will disagree that vaccination for
children is a rather cost-effective measure against diseases. In addition, since the
vaccination rate (for all four diseases) for ethnic minority children is so low, their
welfare can be significantly improved with more vaccination.
However, improving the well-being for ethnic minority groups would require more
and sustained efforts in the long term. Several main policies can be considered such as
i) emphasizing the importance of improving educational outcomes for ethnic
minority groups in all development plans or government campaigns. This chapter
has shown that educational achievements take an important part in reducing
poverty, increasing cognitive skills and earnings, increasing the use of
contraceptive methods among married women, reducing child labor. Furthermore,
education also has strong intergenerational impacts on increasing educational
accomplishments for future generations. There seems to be no overemphasizing
the role of education in improving welfare and reducing the disparities between
ethnic groups, and this is true not just for Vietnam but for other countries as well
(see also other chapters in this book and Hall and Patrinos 2006).
ii) diversifying employment opportunities for ethnic minority groups. While their
occupation is becoming more diversified, ethnic minority groups are still mostly
occupied in agriculture. While it may not be easy to map out good strategies to
change the occupation for these groups, it is important that the government include
the economic development of ethnic minority groups among the top priorities in
development plans. For example, tax incentives or preferential loans can be given
to enterprises employing more ethnic minority people. Or special job training
centers can be established in ethnic minority communes.
iii) applying lessons with social safety net or transfer programs from other countries to
Vietnam. For example, welfare-improving programs specially targeted at poor and
18
disadvantaged groups called Conditional Cash Transfer program have been
extensively used in a number of countries (see, for example, Das, Do and Ozler
2005.) Vietnam can perhaps experiment with such programs to increase school
attendance rates and reduce child labor for disadvantaged groups, including but not
limited to, ethnic minority groups.
iv) using more quantitative methods to better evaluate the different government
programs for ethnic minority groups. The Government can make use of technical
assistance from international organizations and/ or involve the local researchers
more in designing these programs.
v) better monitoring the welfare for ethnic minority groups through implementing,
perhaps special, nationally representative surveys that can provide detailed
analysis for each ethnic group.

19
References
Asian Development Bank. (2002). Indigenous peoples/ethnic minorities and poverty
reduction Vietnam. Manila: Philippines. Environment and Social Safeguard Division,
Regional and Sustainable Development Department.
Baulch, Bob, Truong Thi Kim Chuyen, Dominique Haughton and Jonathan Haughton
(2007). ―Ethnic Minority Development in Vietnam‖. Journal of Development Studies
43(7): 1151-1176.
Beegle, Kathleen, Rajeev Dehejia and Roberta Gatti. (2009) ―Why Should We Care about
Child Labor? The Education, Labor Market, and Health Consequences of Child
Labor‖. Journal of Human Resources, 44(4): 871-889.
Blinder (1973). ―Wage Discrimination: Reduced Form and Structural Estimates‖. Journal
of Human Resources 8(4): 436-465.
Committee for Population, Family and Children (Vietnam) and ORC Macro (CPFC and
ORC Macro). (2003). ―Vietnam Demographic and Health Survey 2002‖. Calverton,
Maryland, USA: Committee for Population, Family and Children (Vietnam) and ORC
Macro.
Cotton, Jeremiah. (1988). ―On the Decomposition of Wage Differentials‖. Review of
Economics and Statistics, 70 (2): 236–243.
Dang, Nghiem Van, Chu Thai Son and Le Hung (2000). Ethnic Minorities in Vietnam.
Hanoi, Vietnam: The Gioi Publishers.
Dang, Hai-Anh. (2007). ―The Determinants and Impact of Private Tutoring Classes in
Vietnam‖. Economics of Education Review 26(6): 684-699.
---. (2008). ―Private Tutoring in Vietnam: An Investigation of Its Causes and Impacts with
Policy Implications‖. VDM Verlag Dr. Mueller Publishing House.
Dang, Hai-Anh and Harry Patrinos. (2008). ―The Impacts of War on Gender Differences
in Educational Achievements and Labor Market Outcomes: The Case of Vietnam‖.
Paper presented at the IZA/ World Bank Conference on Employment and
Development. Rabat, Morocco.
Dang, Hai-Anh and Paul Glewwe. (2008). ―An Analysis of Learning Outcomes for
Vietnam‖. Working paper.
Das, Jishnu, Quy-Toan Do and Berk Ozler. (2005). ―Reassessing Conditional Cash
Transfer Programs‖. World Bank Research Observer, 20: 57-80.
Edmonds, Eric V. and Nina Pavcnik. (2005) ―The Effect of Trade Liberalization on Child
Labor‖. Journal of International Economics 65: 401– 419.
---. (2006). ―Trade Liberalization and the Allocation of Labor between Households and
Markets in a Poor Country‖. Journal of International Economics 69: 272– 295.
Evans, Grant (1992). ―Internal Colonialism in the Central Highlands of Vietnam.‖
Sojourn, 7(2): 274-304.
General Statistical Office (GSO). (2001a). Population and Housing Census Vietnam 1999.
Hanoi: Statistical Publishing House.
---. (2001b). ―So Tay Huong Dan Nghiep Vu Dieu Tra Muc Song Ho Gia Dinh 2002‖.
(Interview Guidebook for the Vietnam Household Living Standards Survey 2002).
Hanoi: Vietnam.
---. (2004). ―Khao Sat Muc Song Ho Gia Dinh 2004: So Tay Huong Dan Nghiep Vu‖.
(Interview Guidebook for the Vietnam Household Living Standards Survey 2004).
Hanoi: Vietnam.

20
---. (2006). ―So Tay Khao Sat Muc Song Ho Gia Dinh 2006‖. (Interview Guidebook for
the Vietnam Household Living Standards Survey 2006). Hanoi: Vietnam.
---. (2007). Statistical Yearbook of Vietnam 2006. Hanoi: Statistical Publishing House.
Glewwe, Paul. (2008). ―Mission Report for Trip to Vietnam October 2007‖. Report
submitted to the World Bank.
Glewwe, Paul, Michele Gragnolati and Hassan Zaman. (2002). ―Who Gained from
Vietnam’s Boom in the 1990s?‖ Economic Development and Cultural Change
50:773–792
Glewwe, Paul and Hanan Jacoby. (2004). ―Economic Growth and the Demand for
Education: Is There a Wealth Effect?‖ Journal of Development Economics 74(1): 33-
51.
Glewwe, Paul, Nisha Agrawal, and David Dollar. (Eds.) (2004). ―Economic Growth,
Poverty, and Household Welfare in Vietnam‖. Washington DC: World Bank.
Glewwe, Paul and Hai-Anh Dang. (forthcoming). ―Was Vietnam’s Economic Growth in
the 1990’s Pro-Poor? An Analysis of Panel Data from Vietnam‖. Economic
Development and Cultural Change.
Government of Vietnam (GOV). (1995). ―Quyết định số 862/QĐ-TTg ngày 30/12/1995‖.
(Decision 862/QĐ-TTg on 30/12/1995).
---. (1998a). ―Quyết Định Số 135/1998/QĐ-TTg ngày 31/7/1998‖. (Decision
135/1998/QĐ-TTg on 31/7/1998).
---. (1998b). ―Quyết Định Số 133/1998/QĐ-TTg ngày 23-7-1998‖. (Decision
133/1998/QĐ-TTg on 23-7-1998).
---. (1998c). Nghị Định số 20/1998/NĐ-CP ngày 31/3/1998. (Decree 20/1998/NĐ-CP
ngày 31/3/1998).
---. (1999). ―Quyết Định Số 188/1999 /QĐ-TTg Ngày 17-9-1999‖. (Decision 188/1999
/QĐ-TTg on 17-09-1999).
---. (2001). ―Quyết Định Số: 143/2001/QĐ-TTg Ngày 27-9-2001‖. (Decision
143/2001/QĐ-TTg on 27-9-2001).
---. (2002). Nghị Định số 02/2002/NĐ-CP ngày 3/1/2002. (Decree 02/2002/NĐ-CP ngày
3/1/2002).
---. (2004a). Nghị Định số 53/2004/NĐ-CP ngày 18/2/2004. (Decree 53/2004/NĐ-CP
ngày 18/2/2004).
---. (2004b). Quyết định số 134/2004/ QĐ-TTg ngày 20/7/2004. (Decision 134/2004/CP
on 20/7/2004).
---. (2005a). ―Quyết Định Số 92/2005/QĐ-TTg ngày 29/4/2005‖. (Decision 92/2005/QĐ-
TTg on 29/4/2005).
---. (2005b). ―Quyết Định Số 1277/QĐ-TTg ngày 07/12/2005‖. (Decision 1277/QĐ-TTg
on 07/12/2005).
---. (2005c). ―Quyết Định Số 170/2005/QĐ-TTg ngày 8/7/2005‖. (Decision 170/2005/QĐ-
TTg on 8/7/2005).
---. (2006a). Nghị Định số 61/2006/NĐ-CP ngày 20/6/2006. (Decree 61/2006/NĐ-CP
ngày 20/6/2006).
---. (2006b). ―Quyết Định Số 56/2006/QĐ-TTg ngày 13/3/2006‖. (Decision 56/2006/QĐ-
TTg ngày 13/3/2006).
---. (2007a). ―Quyết Định Số 32/2007/QĐ-TTg ngày 05/3/2007‖. (Decision 32/2007/QĐ-
TTg on 05/3/2007).
21
---. (2007b). ―Quyết Định Số 113/2007/QĐ-TTg ngày 20/7/2007‖. (Decision
113/2007/QĐ-TTg on 20/7/2007).
Hall, Gillette and Harry Patrinos. (Eds.) (2006). ―Indigenous Peoples, Poverty and Human
Development in Latin America‖. London: Palgrave Macmillan.
International Monetary Fund (IMF). (2006 and 2007). International Financial Statistics.
Washington, DC: International Monetary Fund.
Jamieson, Neil L., Le Trong Cuc, Terry A. Rambo (1998). ―The Development Crisis in
Vietnam’s Mountains.‖ Special report #6. Honolulu: East-West Center.
Mu, Ren and Dominique van de Walle. (2007). ―Rural Roads and Poor Area Development
in Vietnam‖. World Bank Policy Research Working Paper 4340.
National Assembly, Government of Vietnam (NA). (2005). ―Luat Giao Duc‖. (Law on
Education).
Nguyen, Thi Thu Phuong and Bob Baulch. (2007). ―A Review of Ethnic Minority Policies
and Programs in Vietnam‖. Working paper.
Nguyen, Nga Nguyet and Martin Rama. (2007). ―A Comparison of Quantitative and
Qualitative Poverty Targeting Methods in Vietnam‖. Q-Squared Working Paper No.
32.
Nguyen, Binh T., James W. Albretch, Susan B. Vroman and M. Daniel Westbrook.
(2007). ―A Quantile Regression Decomposition of Urban–Rural Inequality in
Vietnam‖. Journal of Development Economics. 83: 466-490.
O’Donnell, Owen, Furio C. Rosati, and Eddy van Doorslaer. (2005). ―Health Effects of
Child Work: Evidence from Rural Vietnam‖. Journal of Population Economics
18:437–467.
Oaxaca, Ronald. (1973). ―Male-Female Wage Differentials in Urban Labour Markets‖.
International Economic Review, 14(1): 693-709.
Oaxaca, Ronald L. and Michael R. Ransom. (1989). ―Overpaid Men and Underpaid
Women: A Tale of the Gender Specific Wage Effects of Labor Market
Discrimination‖. Paper presented at the International Economic Association World
Congress, Athens, 28 August–1 September.
---. (1994). ―On Discrimination and the Decomposition of Wage Differentials‖. Journal of
Econometrics, 61:5–21.
Ravallion, Martin and Dominque van de Walle. (2008). ―Land in Transition: Reform and
Poverty in Vietnam‖. New York, USA: Palgrave Macmillan and World Bank.
Ravallion, Martin, Shaohua Chen and Prem Sangraula. (2008). ―Dollar a Day Revisited‖.
World Bank Policy Research Working Paper 4620.
Sepehri, Ardeshir, Sisira Sarmab and Wayne Simpson. (2006). ―Does Non-Profit Health
Insurance Reduce Financial Burden? Evidence from the Vietnam Living Standards
Survey Panel‖. Health Economics 15: 603–616.
StataCorp. (2009). ―Stata: Release 11. Statistical Software”. College Station, TX:
StataCorp LP.
Swinkels, R.ob, and Carolyn Turk. (2006). "Explaining Ethnic Minority Poverty in
Vietnam: a summary of recent trends and current challenges." Draft Background paper
for CEM/ MPI meeting on Ethnic Minority Poverty, September 28. Hanoi: World
Bank.

22
Thang, Nguyen Minh, Indu Bhushan, Erik Bloom, and Sekhar Bonu. (2007). ―Child
Immunization in Vietnam: Situation and Barriers to Coverage‖. Journal of Biosocial
Science 39, 41–58.
Tran, Ngoc Them. (2001). ―Tim ve Ban Sac Van Hoa Viet Nam‖ (Discovering the Identity
of Vietnamese Culture.) Ho Chi Minh City, Vietnam: Ho Chi Minh City Publishing
House.
United Nations Development Group. (2008). "United Nations Development Group
Guidelines on Indigenous Peoples' Issues." Accessed November 2009 at
http://www2.ohchr.org/english/issues/indigenous/docs/guidelines.pdf
van de Walle, Dominique and Dileni Gunewardena (2001). ―Sources of Ethnic Inequality
in Vietnam.‖ Journal of Development Economics. 65: 177-207.
World Bank. (1999). ―Vietnam Developmen Report 2000: Attacking Poverty.‖ Poverty
Reduction and Economic Management Unit, East Asia and Pacific Region.
Washington DC.
---. (2000). ―Viet Nam Living Standards Survey (VNLSS), 1992-93. Basic Information‖.
Poverty and Human Resources Division. Washington DC.
---. (2001). ―Viet Nam Living Standards Survey (VLSS), 1997-98. Basic Information‖.
Poverty and Human Resources Division. Washington DC.
---. (2004). Vietnam: Reading and Mathematics Assessment Study. Volumes 1, 2 and 3.
Human Development Sector Reports.
---. (2006). ―Vietnam Development Report 2007: Aiming High‖. Joint Donor Report to
the Vietnam Consultative Group Meeting. Hanoi, December 14-15, 2006.
---. (2007). ―Vietnam Development Report 2008: Social Protection‖. Joint Donor Report
to the Vietnam Consultative Group Meeting. Hanoi, December 6-7, 2007.
---. (2008a). World Development Indicators Online.
---. (2008c). ―Global Purchasing Power Parities and Real Expenditures: 2005 International
Comparison Program‖. Washington DC.
---. (2009). ―Country Social Analysis: Ethnicity and Development in Vietnam. Volumes 1
and 2‖. Social Development Unit, East Asia and Pacific Region. Washington DC.
World Health Organization (WHO). (2005). ―Users’ Guide on How to Use and Adapt an
Excel Workbook for Conducting Immunization Coverage Cluster Survey, Based on a
Standard Template‖. Geneva: Switzerland.
23
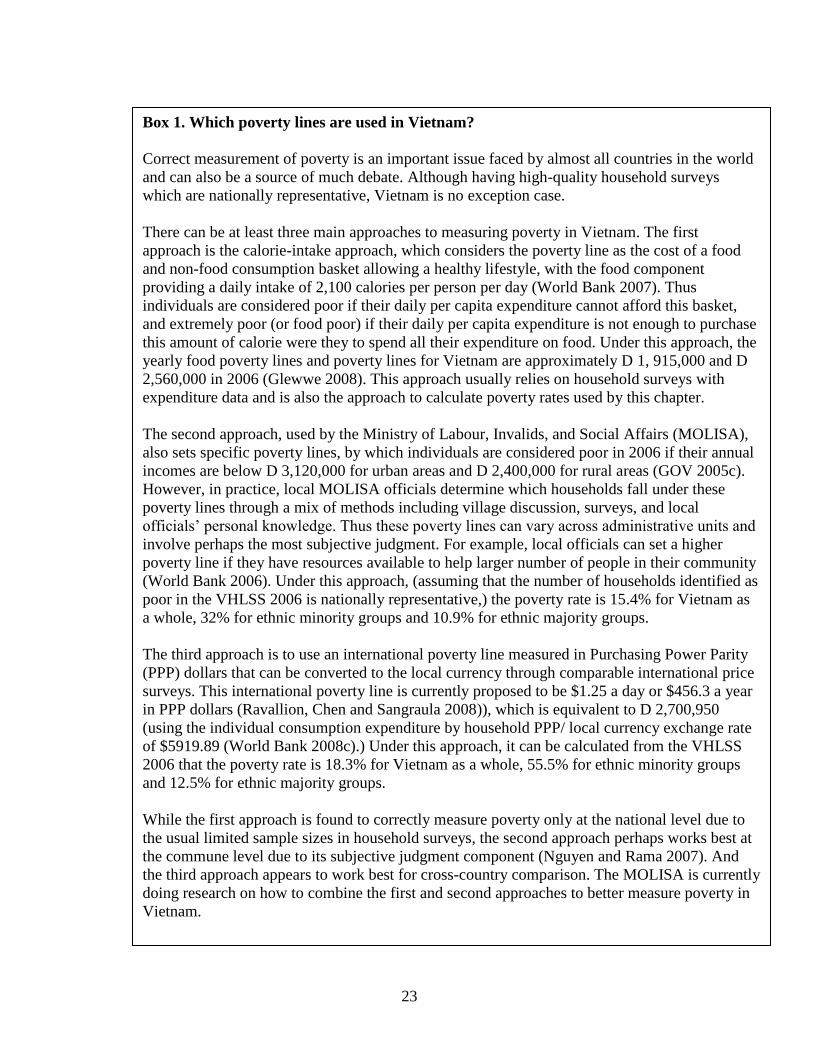
Box 1. Which poverty lines are used in Vietnam?
Correct measurement of poverty is an important issue faced by almost all countries in the world
and can also be a source of much debate. Although having high-quality household surveys
which are nationally representative, Vietnam is no exception case.
There can be at least three main approaches to measuring poverty in Vietnam. The first
approach is the calorie-intake approach, which considers the poverty line as the cost of a food
and non-food consumption basket allowing a healthy lifestyle, with the food component
providing a daily intake of 2,100 calories per person per day (World Bank 2007). Thus
individuals are considered poor if their daily per capita expenditure cannot afford this basket,
and extremely poor (or food poor) if their daily per capita expenditure is not enough to purchase
this amount of calorie were they to spend all their expenditure on food. Under this approach, the
yearly food poverty lines and poverty lines for Vietnam are approximately D 1, 915,000 and D
2,560,000 in 2006 (Glewwe 2008). This approach usually relies on household surveys with
expenditure data and is also the approach to calculate poverty rates used by this chapter.
The second approach, used by the Ministry of Labour, Invalids, and Social Affairs (MOLISA),
also sets specific poverty lines, by which individuals are considered poor in 2006 if their annual
incomes are below D 3,120,000 for urban areas and D 2,400,000 for rural areas (GOV 2005c).
However, in practice, local MOLISA officials determine which households fall under these
poverty lines through a mix of methods including village discussion, surveys, and local
officials’ personal knowledge. Thus these poverty lines can vary across administrative units and
involve perhaps the most subjective judgment. For example, local officials can set a higher
poverty line if they have resources available to help larger number of people in their community
(World Bank 2006). Under this approach, (assuming that the number of households identified as
poor in the VHLSS 2006 is nationally representative,) the poverty rate is 15.4% for Vietnam as
a whole, 32% for ethnic minority groups and 10.9% for ethnic majority groups.
The third approach is to use an international poverty line measured in Purchasing Power Parity
(PPP) dollars that can be converted to the local currency through comparable international price
surveys. This international poverty line is currently proposed to be $1.25 a day or $456.3 a year
in PPP dollars (Ravallion, Chen and Sangraula 2008)), which is equivalent to D 2,700,950
(using the individual consumption expenditure by household PPP/ local currency exchange rate
of $5919.89 (World Bank 2008c).) Under this approach, it can be calculated from the VHLSS
2006 that the poverty rate is 18.3% for Vietnam as a whole, 55.5% for ethnic minority groups
and 12.5% for ethnic majority groups.
While the first approach is found to correctly measure poverty only at the national level due to
the usual limited sample sizes in household surveys, the second approach perhaps works best at
the commune level due to its subjective judgment component (Nguyen and Rama 2007). And
the third approach appears to work best for cross-country comparison. The MOLISA is currently
doing research on how to combine the first and second approaches to better measure poverty in
Vietnam.
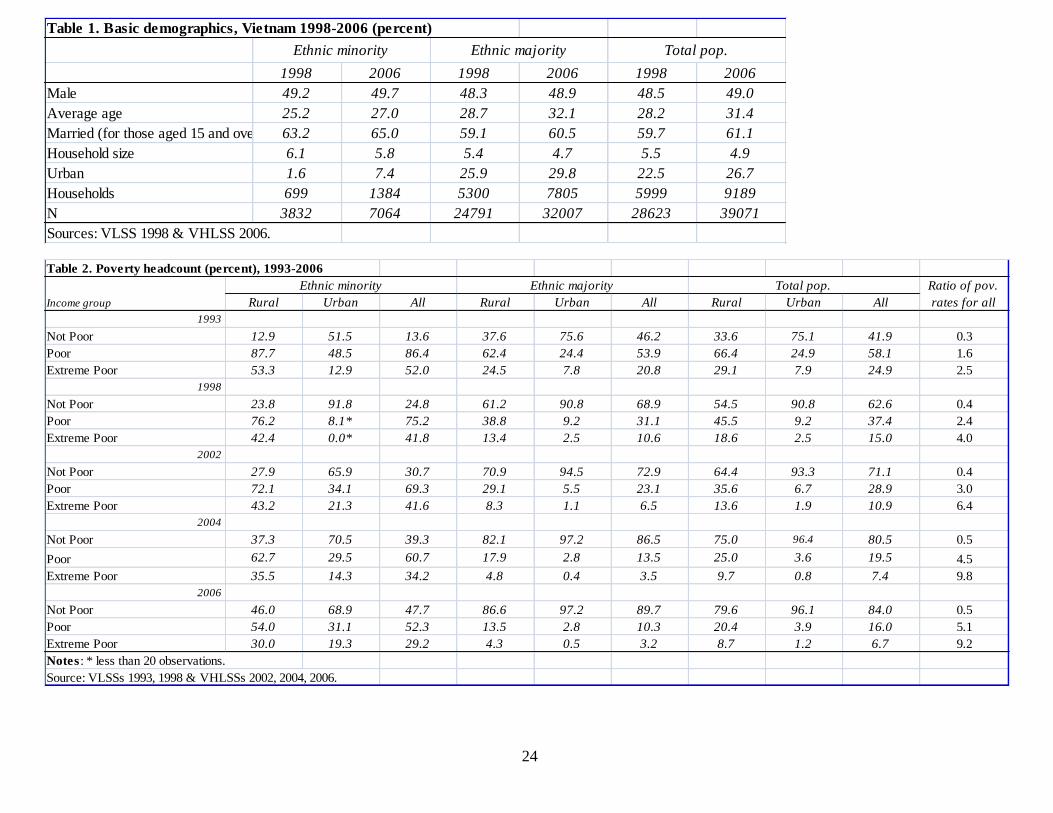
24
Table 1. Basic demographics, Vietnam 1998-2006 (percent)
1998 2006 1998 2006 1998 2006
Male 49.2 49.7 48.3 48.9 48.5 49.0
Average age 25.2 27.0 28.7 32.1 28.2 31.4
Married (for those aged 15 and over) 63.2 65.0 59.1 60.5 59.7 61.1
Household size 6.1 5.8 5.4 4.7 5.5 4.9
Urban 1.6 7.4 25.9 29.8 22.5 26.7
Households 699 1384 5300 7805 5999 9189
N 3832 7064 24791 32007 28623 39071
Sources: VLSS 1998 & VHLSS 2006.
Ethnic minority Ethnic majority Total pop.
Table 2. Poverty headcount (percent), 1993-2006
Rural Urban All Rural Urban All Rural Urban All
1993
Not Poor 12.9 51.5 13.6 37.6 75.6 46.2 33.6 75.1 41.9 0.3
Poor 87.7 48.5 86.4 62.4 24.4 53.9 66.4 24.9 58.1 1.6
Extreme Poor 53.3 12.9 52.0 24.5 7.8 20.8 29.1 7.9 24.9 2.5
1998
Not Poor 23.8 91.8 24.8 61.2 90.8 68.9 54.5 90.8 62.6 0.4
Poor 76.2 8.1* 75.2 38.8 9.2 31.1 45.5 9.2 37.4 2.4
Extreme Poor 42.4 0.0* 41.8 13.4 2.5 10.6 18.6 2.5 15.0 4.0
2002
Not Poor 27.9 65.9 30.7 70.9 94.5 72.9 64.4 93.3 71.1 0.4
Poor 72.1 34.1 69.3 29.1 5.5 23.1 35.6 6.7 28.9 3.0
Extreme Poor 43.2 21.3 41.6 8.3 1.1 6.5 13.6 1.9 10.9 6.4
2004
Not Poor 37.3 70.5 39.3 82.1 97.2 86.5 75.0 96.4 80.5 0.5
Poor 62.7 29.5 60.7 17.9 2.8 13.5 25.0 3.6 19.5 4.5
Extreme Poor 35.5 14.3 34.2 4.8 0.4 3.5 9.7 0.8 7.4 9.8
2006
Not Poor 46.0 68.9 47.7 86.6 97.2 89.7 79.6 96.1 84.0 0.5
Poor 54.0 31.1 52.3 13.5 2.8 10.3 20.4 3.9 16.0 5.1
Extreme Poor 30.0 19.3 29.2 4.3 0.5 3.2 8.7 1.2 6.7 9.2
Notes: * less than 20 observations.
Source: VLSSs 1993, 1998 & VHLSSs 2002, 2004, 2006.
Ratio of pov.
rates for all
Ethnic majority
Income group
Ethnic minority Total pop.

25
Table 3. Determinants of household poverty (Random-effect Probits), 2006
Model 2
Coef. Mean Mar. Effect Coef.
Ethnic minority 0.846*** 0.162 0.135*** 0.725***
# residents 0 to 6 years 0.609*** 0.377 0.061*** 0.603***
# residents 0 to 6 years squared -0.005 0.562 -0.001 -0.003
# residents 7 to 24 years 0.198*** 1.705 0.020*** 0.205***
# residents 7 to 24 years squared 0.005 4.486 0.001 -0.001
# residents 25 to 59 -0.110** 1.890 -0.011** -0.159***
# residents 60+ years 0.175*** 0.322 0.018*** 0.140***
Head's age -0.006* 46.646 -0.001* -0.004
Female household head -0.004 0.211 -0.000 -0.014
Head's yrs of schooling -0.153*** 7.375 -0.015*** -0.143***
Disabled head 0.273 0.024 0.034 0.208
Head's work sector
Wage-work only -0.142 0.147 -0.013 -0.050
Agriculture only -0.185** 0.346 -0.018** -0.197***
Service only -0.854*** 0.131 -0.053*** -0.735***
Red River Delta 0.633*** 0.205 0.087*** 0.849***
North East 0.770*** 0.151 0.119*** 0.780***
North West 0.991*** 0.052 0.192*** 1.141***
North Central 1.289*** 0.112 0.268*** 1.461***
South Central Coast 0.437** 0.095 0.059* 0.701***
Central Highlands 0.577*** 0.068 0.086** 0.599***
Mekong River Delta 0.154 0.196 0.017 0.400**
Urban -0.487*** 0.228 -0.040*** -4.583
Distance to nearest town 0.010***
Lowland area -0.238**
Midland area -0.048
Constant -1.070*** -1.209***
Mean of Dependent Variable 0.165 0.200
Log Likelihood -2403 -2026
ρ 0.364 0.320
N 7984 5726
Note: Dependent variable is a dummy variable for whether household is poor.
* p<0.1, ** p<0.05, *** p<0.01
Sources: VHLSS 2006
Model 1
Table 4. Calculated Probabilities of Household Being Poor, 2006 (percent)
Ethnic
minority
Ethnic
majority Total pop.
HH Head's Years of Schooling
0 76.8 24.4 52.2
6 44.8 9.3 15.7
12 10.3 1.6 2.2
16 1.6* 0.1 0.2
HH head work sector
Agri. only 52.8 8.8 18.6
Service only 15.1 1.2 1.7
Notes: Computed from Table 6.
* less than 20 observations.
Table 5. Employment sector for people age 15 and over, 1998-2006 (percent)
1998 2006 1998 2006 1998 2006
Work sector
Wage work only 3.0 7.6 13.2 25.3 11.8 22.9
Agriculture only 67.3 55.2 40.2 30.2 44.0 33.6
Services only 1.4 2.3 13.8 15.2 12.1 13.4
Wage work & Agriculture 18.4 25.0 15.0 16.6 15.5 17.8
Wage work & Services 0.6 0.3* 1.6 1.7 1.4 1.5
Agriculture & Services 8.3 8.3 14.3 10.0 13.5 9.7
Wage work, Agriculture, and Services 1.1 1.3 1.8 1.0 1.7 1.0
Total 100 100 100 100 100 100
Work type
Self-employed 92.3 84.7 79.4 63.8 81.2 66.6
Work for other households or in
private sector2.3 10.0 8.2 21.8 7.4 20.2
State-owned or collective sector 2.2 5.0 8.9 12.2 8.0 11.2
Foreign-invested sector 0.3 0.3* 1.3 2.2 1.1 1.9
Other sector 2.9 n.a. 2.0 n.a. 2.1 n.a.
Total 100 100 100 100 100 100
Number of observations 2063 13663 15726
Note: * fewer than 20 observations
Sources: VLSS 1998 & VHLSS 2006
Ethnic minority Ethnic majority All
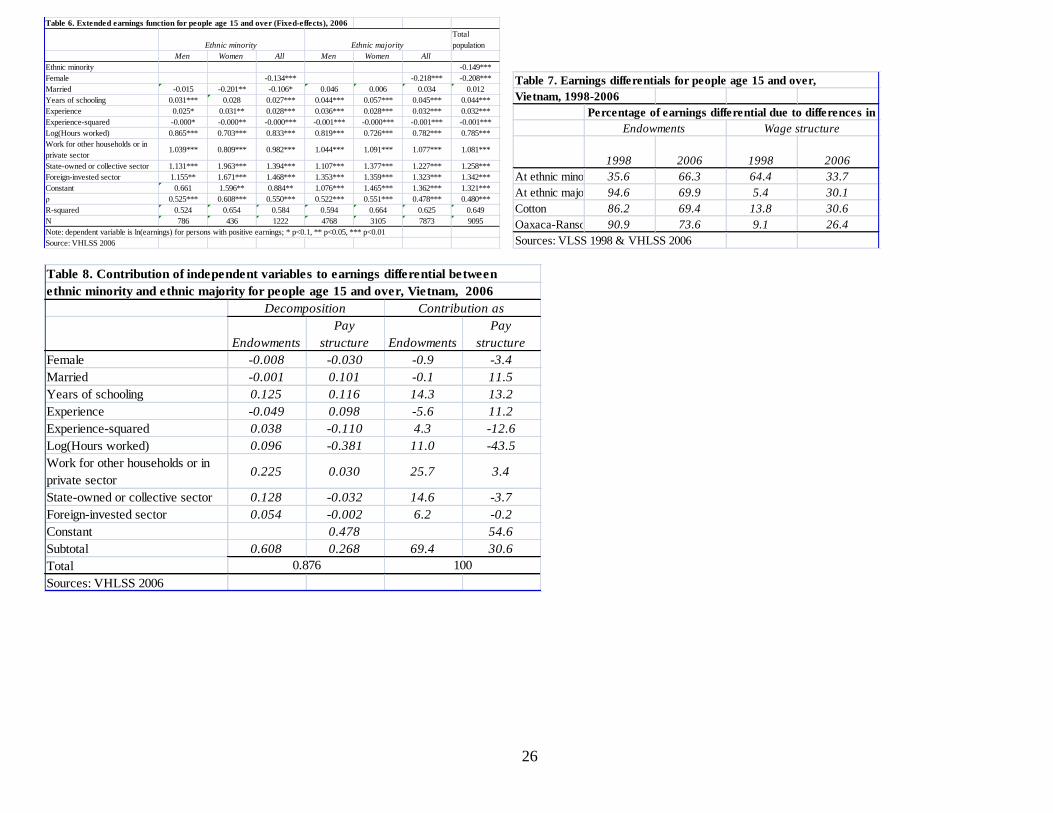
26
Table 6. Extended earnings function for people age 15 and over (Fixed-effects), 2006
Total
population
Men Women All Men Women All
Ethnic minority -0.149***
Female -0.134*** -0.218*** -0.208***
Married -0.015 -0.201** -0.106* 0.046 0.006 0.034 0.012
Years of schooling 0.031*** 0.028 0.027*** 0.044*** 0.057*** 0.045*** 0.044***
Experience 0.025* 0.031** 0.028*** 0.036*** 0.028*** 0.032*** 0.032***
Experience-squared -0.000* -0.000** -0.000*** -0.001*** -0.000*** -0.001*** -0.001***
Log(Hours worked) 0.865*** 0.703*** 0.833*** 0.819*** 0.726*** 0.782*** 0.785***
Work for other households or in
private sector1.039*** 0.809*** 0.982*** 1.044*** 1.091*** 1.077*** 1.081***
State-owned or collective sector 1.131*** 1.963*** 1.394*** 1.107*** 1.377*** 1.227*** 1.258***
Foreign-invested sector 1.155** 1.671*** 1.468*** 1.353*** 1.359*** 1.323*** 1.342***
Constant 0.661 1.596** 0.884** 1.076*** 1.465*** 1.362*** 1.321***
ρ 0.525*** 0.608*** 0.550*** 0.522*** 0.551*** 0.478*** 0.480***
R-squared 0.524 0.654 0.584 0.594 0.664 0.625 0.649
N 786 436 1222 4768 3105 7873 9095
Note: dependent variable is ln(earnings) for persons with positive earnings; * p<0.1, ** p<0.05, *** p<0.01
Source: VHLSS 2006
Ethnic minority Ethnic majority
Table 7. Earnings differentials for people age 15 and over,
Vietnam, 1998-2006
1998 2006 1998 2006
At ethnic minority mean35.6 66.3 64.4 33.7
At ethnic majority mean94.6 69.9 5.4 30.1
Cotton 86.2 69.4 13.8 30.6
Oaxaca-Ransom 90.9 73.6 9.1 26.4
Sources: VLSS 1998 & VHLSS 2006
Percentage of earnings differential due to differences in
Endowments Wage structure
Table 8. Contribution of independent variables to earnings differential between
ethnic minority and ethnic majority for people age 15 and over, Vietnam, 2006
Endowments
Pay
structure Endowments
Pay
structure
Female -0.008 -0.030 -0.9 -3.4
Married -0.001 0.101 -0.1 11.5
Years of schooling 0.125 0.116 14.3 13.2
Experience -0.049 0.098 -5.6 11.2
Experience-squared 0.038 -0.110 4.3 -12.6
Log(Hours worked) 0.096 -0.381 11.0 -43.5
Work for other households or in
private sector0.225 0.030 25.7 3.4
State-owned or collective sector 0.128 -0.032 14.6 -3.7
Foreign-invested sector 0.054 -0.002 6.2 -0.2
Constant 0.478 54.6
Subtotal 0.608 0.268 69.4 30.6
Total
Sources: VHLSS 2006
0.876 100
Decomposition Contribution as
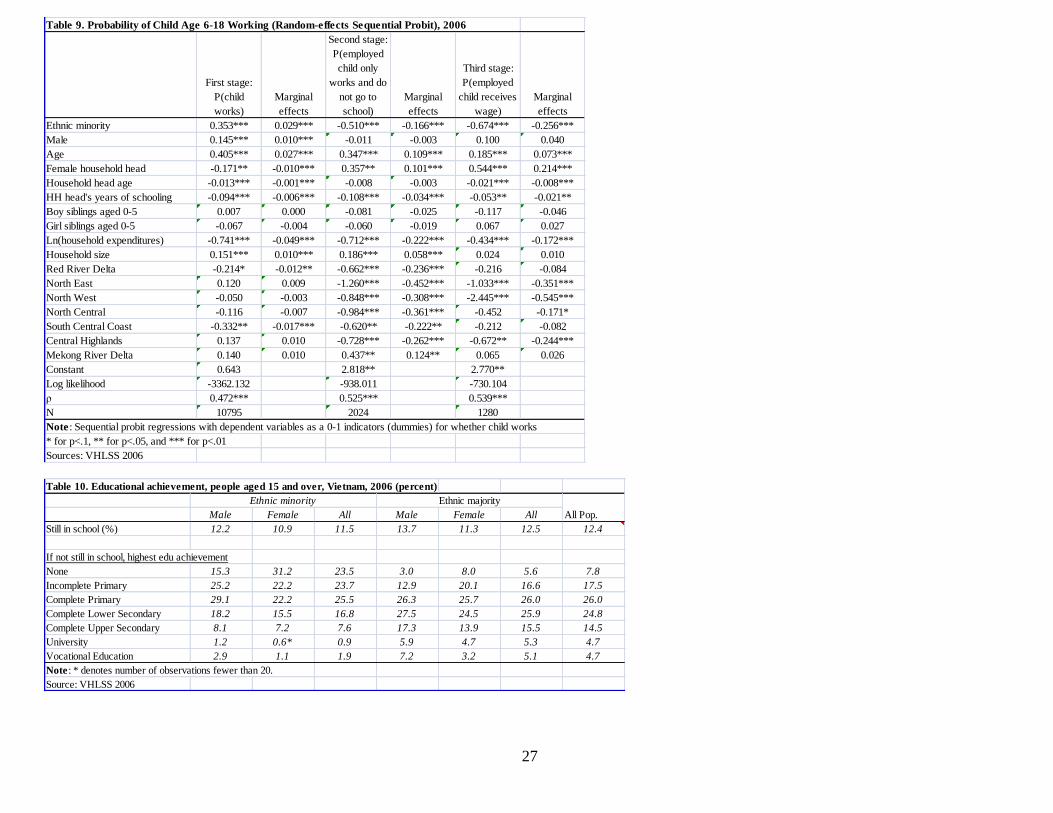
27
Table 9. Probability of Child Age 6-18 Working (Random-effects Sequential Probit), 2006
First stage:
P(child
works)
Marginal
effects
Second stage:
P(employed
child only
works and do
not go to
school)
Marginal
effects
Third stage:
P(employed
child receives
wage)
Marginal
effects
Ethnic minority 0.353*** 0.029*** -0.510*** -0.166*** -0.674*** -0.256***
Male 0.145*** 0.010*** -0.011 -0.003 0.100 0.040
Age 0.405*** 0.027*** 0.347*** 0.109*** 0.185*** 0.073***
Female household head -0.171** -0.010*** 0.357** 0.101*** 0.544*** 0.214***
Household head age -0.013*** -0.001*** -0.008 -0.003 -0.021*** -0.008***
HH head's years of schooling -0.094*** -0.006*** -0.108*** -0.034*** -0.053** -0.021**
Boy siblings aged 0-5 0.007 0.000 -0.081 -0.025 -0.117 -0.046
Girl siblings aged 0-5 -0.067 -0.004 -0.060 -0.019 0.067 0.027
Ln(household expenditures) -0.741*** -0.049*** -0.712*** -0.222*** -0.434*** -0.172***
Household size 0.151*** 0.010*** 0.186*** 0.058*** 0.024 0.010
Red River Delta -0.214* -0.012** -0.662*** -0.236*** -0.216 -0.084
North East 0.120 0.009 -1.260*** -0.452*** -1.033*** -0.351***
North West -0.050 -0.003 -0.848*** -0.308*** -2.445*** -0.545***
North Central -0.116 -0.007 -0.984*** -0.361*** -0.452 -0.171*
South Central Coast -0.332** -0.017*** -0.620** -0.222** -0.212 -0.082
Central Highlands 0.137 0.010 -0.728*** -0.262*** -0.672** -0.244***
Mekong River Delta 0.140 0.010 0.437** 0.124** 0.065 0.026
Constant 0.643 2.818** 2.770**
Log likelihood -3362.132 -938.011 -730.104
ρ 0.472*** 0.525*** 0.539***
N 10795 2024 1280
Note : Sequential probit regressions with dependent variables as a 0-1 indicators (dummies) for whether child works
* for p<.1, ** for p<.05, and *** for p<.01
Sources: VHLSS 2006
Table 10. Educational achievement, people aged 15 and over, Vietnam, 2006 (percent)
Male Female All Male Female All
Still in school (%) 12.2 10.9 11.5 13.7 11.3 12.5 12.4
If not still in school, highest edu achievement
None 15.3 31.2 23.5 3.0 8.0 5.6 7.8
Incomplete Primary 25.2 22.2 23.7 12.9 20.1 16.6 17.5
Complete Primary 29.1 22.2 25.5 26.3 25.7 26.0 26.0
Complete Lower Secondary 18.2 15.5 16.8 27.5 24.5 25.9 24.8
Complete Upper Secondary 8.1 7.2 7.6 17.3 13.9 15.5 14.5
University 1.2 0.6* 0.9 5.9 4.7 5.3 4.7
Vocational Education 2.9 1.1 1.9 7.2 3.2 5.1 4.7
Note : * denotes number of observations fewer than 20.
Source: VHLSS 2006
Ethnic minority Ethnic majority
All Pop.
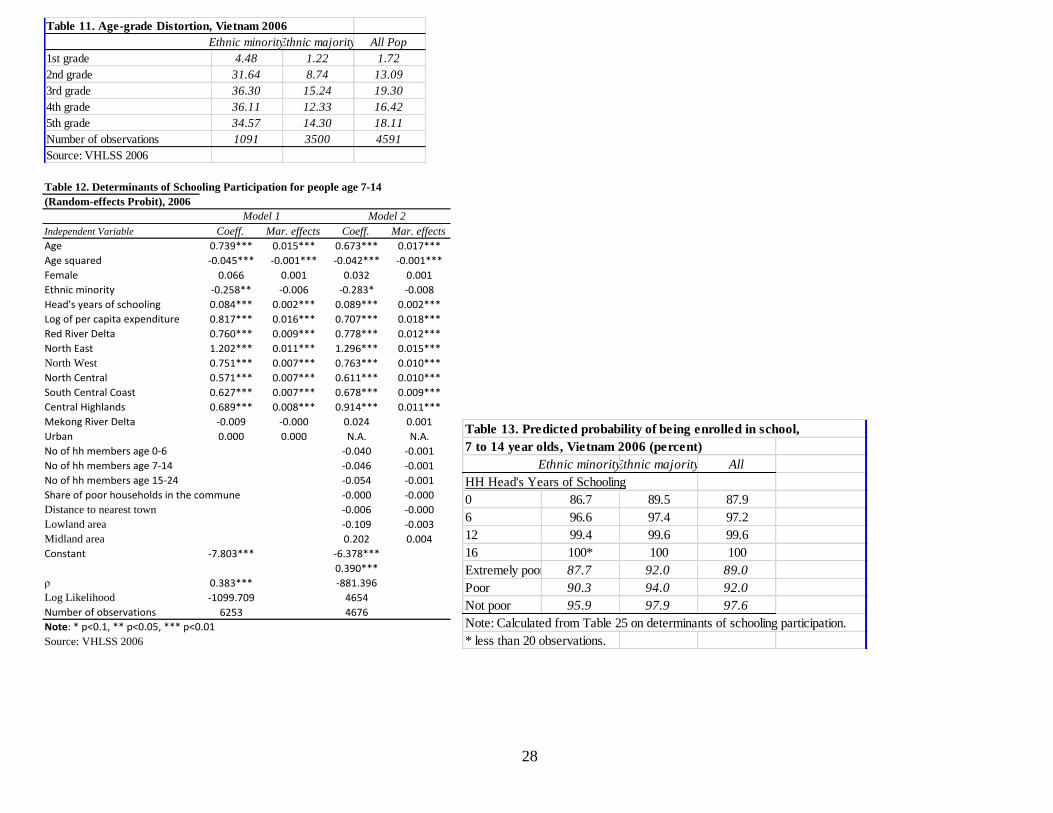
28
Table 12. Determinants of Schooling Participation for people age 7-14
(Random-effects Probit), 2006
Independent Variable Coeff. Mar. effects Coeff. Mar. effects
Age 0.739*** 0.015*** 0.673*** 0.017***
Age squared -0.045*** -0.001*** -0.042*** -0.001***
Female 0.066 0.001 0.032 0.001
Ethnic minority -0.258** -0.006 -0.283* -0.008
Head's years of schooling 0.084*** 0.002*** 0.089*** 0.002***
Log of per capita expenditure 0.817*** 0.016*** 0.707*** 0.018***
Red River Delta 0.760*** 0.009*** 0.778*** 0.012***
North East 1.202*** 0.011*** 1.296*** 0.015***
North West 0.751*** 0.007*** 0.763*** 0.010***
North Central 0.571*** 0.007*** 0.611*** 0.010***
South Central Coast 0.627*** 0.007*** 0.678*** 0.009***
Central Highlands 0.689*** 0.008*** 0.914*** 0.011***
Mekong River Delta -0.009 -0.000 0.024 0.001
Urban 0.000 0.000 N.A. N.A.
No of hh members age 0-6 -0.040 -0.001
No of hh members age 7-14 -0.046 -0.001
No of hh members age 15-24 -0.054 -0.001
Share of poor households in the commune -0.000 -0.000
Distance to nearest town -0.006 -0.000
Lowland area -0.109 -0.003
Midland area 0.202 0.004
Constant -7.803*** -6.378***
0.390***
ρ 0.383*** -881.396
Log Likelihood -1099.709 4654
Number of observations 6253 4676
Note: * p<0.1, ** p<0.05, *** p<0.01
Source: VHLSS 2006
Model 1 Model 2
Table 11. Age-grade Distortion, Vietnam 2006
Ethnic minorityEthnic majority All Pop
1st grade 4.48 1.22 1.72
2nd grade 31.64 8.74 13.09
3rd grade 36.30 15.24 19.30
4th grade 36.11 12.33 16.42
5th grade 34.57 14.30 18.11
Number of observations 1091 3500 4591
Source: VHLSS 2006
Table 13. Predicted probability of being enrolled in school,
7 to 14 year olds, Vietnam 2006 (percent)
Ethnic minorityEthnic majority All
HH Head's Years of Schooling
0 86.7 89.5 87.9
6 96.6 97.4 97.2
12 99.4 99.6 99.6
16 100* 100 100
Extremely poor 87.7 92.0 89.0
Poor 90.3 94.0 92.0
Not poor 95.9 97.9 97.6
Note: Calculated from Table 25 on determinants of schooling participation.
* less than 20 observations.
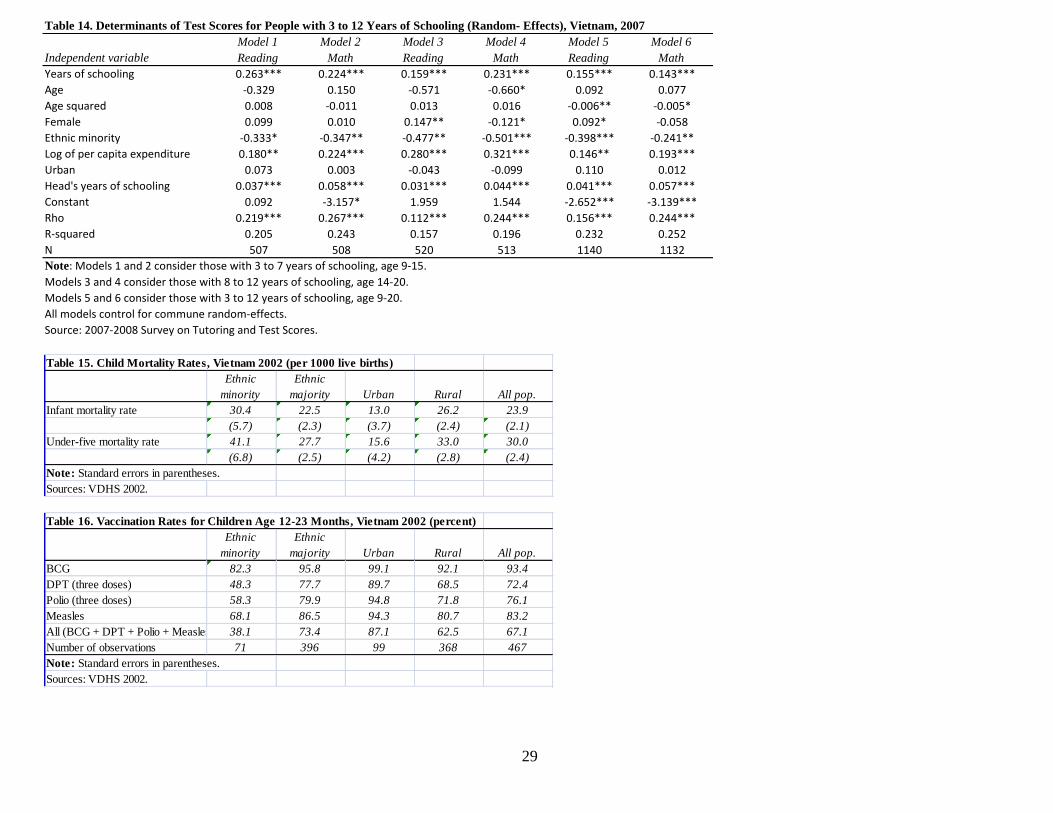
29
Table 14. Determinants of Test Scores for People with 3 to 12 Years of Schooling (Random- Effects), Vietnam, 2007
Model 1 Model 2 Model 3 Model 4 Model 5 Model 6
Independent variable Reading Math Reading Math Reading Math
Years of schooling 0.263*** 0.224*** 0.159*** 0.231*** 0.155*** 0.143***
Age -0.329 0.150 -0.571 -0.660* 0.092 0.077
Age squared 0.008 -0.011 0.013 0.016 -0.006** -0.005*
Female 0.099 0.010 0.147** -0.121* 0.092* -0.058
Ethnic minority -0.333* -0.347** -0.477** -0.501*** -0.398*** -0.241**
Log of per capita expenditure 0.180** 0.224*** 0.280*** 0.321*** 0.146** 0.193***
Urban 0.073 0.003 -0.043 -0.099 0.110 0.012
Head's years of schooling 0.037*** 0.058*** 0.031*** 0.044*** 0.041*** 0.057***
Constant 0.092 -3.157* 1.959 1.544 -2.652*** -3.139***
Rho 0.219*** 0.267*** 0.112*** 0.244*** 0.156*** 0.244***
R-squared 0.205 0.243 0.157 0.196 0.232 0.252
N 507 508 520 513 1140 1132
Note: Models 1 and 2 consider those with 3 to 7 years of schooling, age 9-15.
Models 3 and 4 consider those with 8 to 12 years of schooling, age 14-20.
Models 5 and 6 consider those with 3 to 12 years of schooling, age 9-20.
All models control for commune random-effects.
Source: 2007-2008 Survey on Tutoring and Test Scores.
Table 15. Child Mortality Rates, Vietnam 2002 (per 1000 live births)
Ethnic
minority
Ethnic
majority Urban Rural All pop.
Infant mortality rate 30.4 22.5 13.0 26.2 23.9
(5.7) (2.3) (3.7) (2.4) (2.1)
Under-five mortality rate 41.1 27.7 15.6 33.0 30.0
(6.8) (2.5) (4.2) (2.8) (2.4)
Note: Standard errors in parentheses.
Sources: VDHS 2002.
Table 16. Vaccination Rates for Children Age 12-23 Months, Vietnam 2002 (percent)
Ethnic
minority
Ethnic
majority Urban Rural All pop.
BCG 82.3 95.8 99.1 92.1 93.4
DPT (three doses) 48.3 77.7 89.7 68.5 72.4
Polio (three doses) 58.3 79.9 94.8 71.8 76.1
Measles 68.1 86.5 94.3 80.7 83.2
All (BCG + DPT + Polio + Measles) 38.1 73.4 87.1 62.5 67.1
Number of observations 71 396 99 368 467
Note: Standard errors in parentheses.
Sources: VDHS 2002.

30
Table 17. Medical Insurance, 1998-2006
Ethnic
minority
Ethnic
majority All pop.
Ethnic
minority
Ethnic
majority All pop.
Have medical insurance 33.45 41.74 40.61
Have free medical insurance 44.36 7.66 12.63
Have no medical insurance 91.82 83.02 84.27 22.19 50.60 46.75
Total 100 100 100 100 100 100
Number of observations 3817 24687 28504 7064 32007 39071
Sources: VDHS 2002.
8.18 16.98 15.73
20061998
Table 18. Determinants of number of hospital visits for people age 18 or higher (Fixed-effects Poisson), 2006
Incidence
rate ratio Mean
Incidence
rate ratio Mean
Ethnic minority 0.840** 0.134 0.859 0.142
Age 1.014*** 46.372 1.006*** 46.817
Log of per capita expenditure 1.111*** 8.527 1.253*** 8.539
Married 1.027* 0.731 0.993 0.734
Years of schooling 0.996* 6.880 0.986* 6.956
Male 0.935*** 0.410 1.054 0.411
Log Likelihood -18100.237 -2989.411
Number of observations 10005 5505
Note : * p<0.1, ** p<0.05, *** p<0.01
Sources: VHLSS 2006
Outpatient medical facility Hospital admission
Table 19. Knoledge about AIDS for Ever-Married Women Age 15-49, Vietnam 2002 (percent)
Ethnic
minority
Ethnic
majority Urban Rural All pop.
No. of
observations
Ever heard about AIDS 85.5 97.1 98.8 94.6 95.4 5660
Perception about AIDS 62.5 80.2 84.5 76.2 77.8 5397
Know ways to avoid AIDS 85.7 93.6 93.8 92.2 92.5 5397
Note: Standard errors in parentheses.
Sources: VDHS 2002.
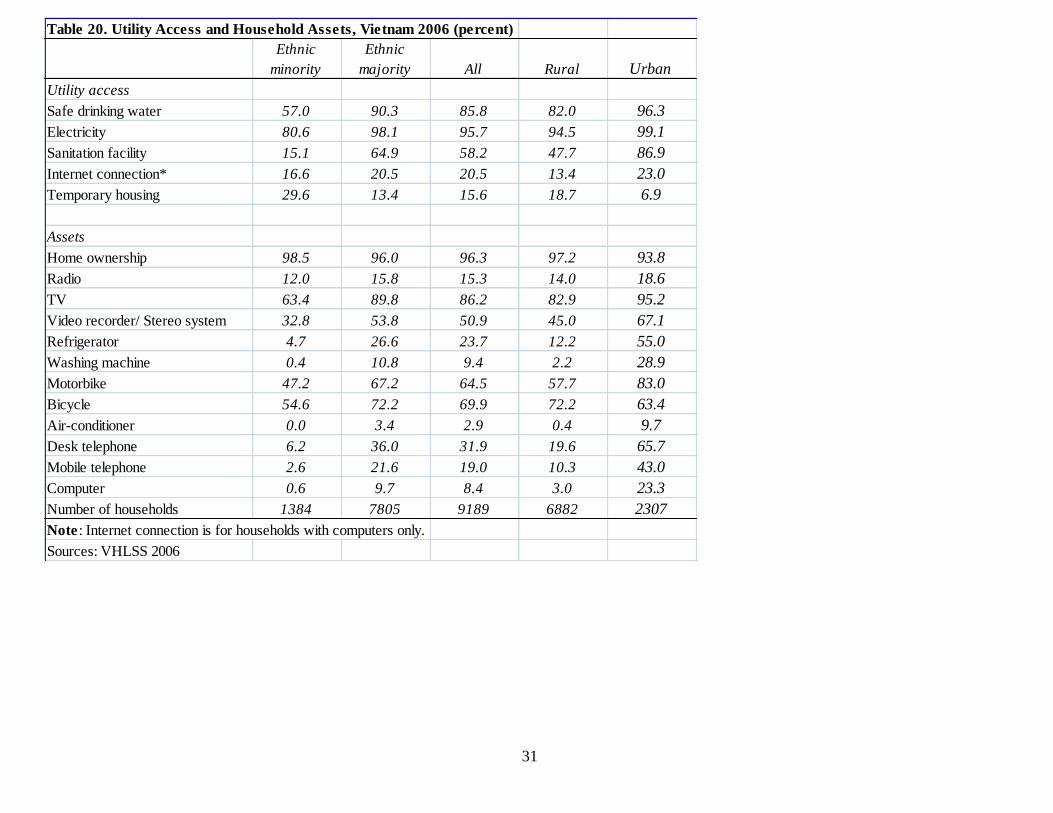
31
Table 20. Utility Access and Household Assets, Vietnam 2006 (percent)
Ethnic
minority
Ethnic
majority All Rural Urban
Utility access
Safe drinking water 57.0 90.3 85.8 82.0 96.3
Electricity 80.6 98.1 95.7 94.5 99.1
Sanitation facility 15.1 64.9 58.2 47.7 86.9
Internet connection* 16.6 20.5 20.5 13.4 23.0
Temporary housing 29.6 13.4 15.6 18.7 6.9
Assets
Home ownership 98.5 96.0 96.3 97.2 93.8
Radio 12.0 15.8 15.3 14.0 18.6
TV 63.4 89.8 86.2 82.9 95.2
Video recorder/ Stereo system 32.8 53.8 50.9 45.0 67.1
Refrigerator 4.7 26.6 23.7 12.2 55.0
Washing machine 0.4 10.8 9.4 2.2 28.9
Motorbike 47.2 67.2 64.5 57.7 83.0
Bicycle 54.6 72.2 69.9 72.2 63.4
Air-conditioner 0.0 3.4 2.9 0.4 9.7
Desk telephone 6.2 36.0 31.9 19.6 65.7
Mobile telephone 2.6 21.6 19.0 10.3 43.0
Computer 0.6 9.7 8.4 3.0 23.3
Number of households 1384 7805 9189 6882 2307
Note : Internet connection is for households with computers only.
Sources: VHLSS 2006

32
Table 21. Availability/ Distance to community facilities, Vietnam 2006 (km)
Ethnic
minority
Mixed ethnic
groups
Ethnic
majority All
Proportion of communes that
Cultural house 29.6 30.5 40.9 35.2
Radio station 30.6 74.9 92.5 80.8
Distance to school
Primary school 0.8 0.9 0.7 0.8
Lower secondary school 2.2 1.9 1.2 1.6
Upper secondary school 14.8 6.6 4.5 5.6
Distance to health facilities
Commune health center 0.0 0.1 0.0 0.1
Polyclinic 15.5 10.9 7.6 9.6
District hospital 21.6 13.4 9.4 11.9
Provincial hospital 86.0 46.3 29.9 40.6
State pharmacy 17.4 9.3 6.6 8.4
Private pharmarcy 22.0 3.6 1.9 3.4
Distance to other community
Paved road 1.2 1.0 0.2 0.6
Public transportation 8.4 3.1 1.9 2.8
Agricultural extension center 20.1 12.1 8.5 10.9
Daily market 18.1 3.8 1.9 3.5
Periodic market 10.1 6.1 3.0 4.6
Wholesale market 37.0 17.1 9.9 14.3
Commune's people committee 3.1 1.9 1.1 1.6
Post office 8.7 2.6 1.6 2.4
Bank/ bank branch 18.4 8.7 5.3 7.6
Town 23.0 12.9 9.0 11.5
Provincial/ City capital 88.0 48.1 31.3 42.0
Major cities 385.6 188.1 135.2 170.0
Note : Major cities include Hanoi, Hai Phong, Da Nang, Can Tho, and Hochiminh city.
Source: VHLSS 2006

33
Figure 1: GDP per capita growth rate for Vietnam versus other countries, 1986-2007
02
46
8
GD
P p
er ca
pita
gro
wth
ra
te
1986 1988 1990 1992 1994 1996 1998 2000 2002 2004 2006 2008year
Vietnam Low and middle-income countries
High-income countries

34
Figure 2: Income distribution for ethnic majority and ethnic minority groups, Vietnam, 1998
Figure 3: Income distribution for ethnic majority and ethnic minority groups, Vietnam, 2006
Ethnic majority expenditures
Ethnic minority expenditures0
.2.4
.6.8
1
Kern
el D
en
sity
6 7 8 9 10 11Ln(expenditure)
kernel = epanechnikov, bandwidth = .09
Expenditure distribution, Vietnam, 1998
Ethnic majority expenditure
Ethnic minority expenditure
0.2
.4.6
.8
Kern
el D
en
sity
6 8 10 12Ln(expenditure)
kernel = epanechnikov, bandwidth = .09
Expenditure distribution, Vietnam, 2006

35
Figure 4: Incidence of child labor for age 6-25, Vietnam, 2006
Figure 5: Years of schooling, by year of birth, Vietnam, 2006
Ethnic minority male
Ethnic minority female
Ethnic majority male
Ethnic majority female
0
10
20
30
40
50
60
70
80
90
100
6 7 8 9 10 11 12 13 14 15 16 17 18 19 20 21 22 23 24 25Age
Ethnic majority
Ethnic minority
4
6
8
10
1945 1950 1955 1960 1965 1970 1975 1980 1985Year of birth