ch 14 part iii. 2 cost-effective policies for fund pollutants defining a cost-effective allocation
TRANSCRIPT

Ch 14
Part III

2
Cost-Effective Policies for Fund Pollutants
• Defining a Cost-Effective Allocation
3
• The damage caused by these pollutants depends on the amount entering the atmosphere
4
• Ex: two emissions sources are currently emitting 15 units each for a total 30 units.
• Assume further that the control authority determines that the environment can assimilate 15 units in total, so that a reduction of 15 units is necessary.
• How should this 15-unit reduction be allocated between the two sources in order to minimize the total cost of the reduction?

5
• The graph measuring the MC of control for the first source from the left-hand axis (MC1) and the MC of control for the second source from the right-hand axis (MC2).

6
• Note that a total 15-unit reduction is achieved for every point on this graph
• Each point represents some different combination of reduction by the two sources.
• Drawn in this manner, the diagram represents all possible allocations of the 15-unit reduction between the two sources.
7
• The left-hand axis represents an allocation of the entire reduction to the second source, while the righthand axis represents a situation in which the first source bears the entire responsibility.
• All points in between represent different degrees of shared responsibility. What allocation minimizes the cost of control?
8
• In the cost-effective allocation, the first source cleans up ten units, while the second source cleans up five units.
• The total variable cost of control for this particular assignment of the responsibility for the reduction is represented by area A plus area B.
9
• Area A is the cost of control for the first source; area B is the cost of control for the second.
• Any other allocation would result in a higher total control cost. (Convince yourself that this is true!
10
• The figure also demonstrates that the cost of achieving a given reduction in emissions will be minimized iff the MCs of control are equalized for all emitters.
• This is demonstrated by the fact that the MC curves cross at the cost-effective allocation.


12
Cost-Effective Pollution-Control Policies
• The cheapest method of control will differ among industries and among plants in the same industry.
• The selection of the cheapest method requires detailed information on the possible control techniques and their associated costs.
13
• The government authorities responsible for meeting pollution targets are not likely to have this information (cheapest method)
• Regulation depends on cost • Those who have the information (the
plant managers) are not inclined to share it.
• Can the cost-effective allocation be found? The answer depends on the approach taken by the control authority.

14
1. Emissions Standards
• A traditional legal approach by imposing a separate emissions limit on each source
• Its called “command-and-control” approach

15
• An emissions standard is a legal limit on the amount of the pollutant an individual source is allowed to emit

16
2. Emissions Charges• A fee, collected by the
government, levied on each unit of pollutant emitted into the air or water.
• The total payment any source would make to the government could be found by(fee x the amount of pollution emitted)
17
• Emissions charges reduce pollution because paying the fees costs the firm money.
• To save money, the source seeks ways to reduce its pollution.

18
• How much pollution control would the firm choose?
• A profit-maximizing firm would control, rather than emit, pollution whenever it proved cheaper to do so.

19
• Ex: The level of uncontrolled emission is 15 units and the emissions charge is T.
• If the firm were to decide against controlling any emissions, it would have to pay T times 15, represented by area 0TBC.
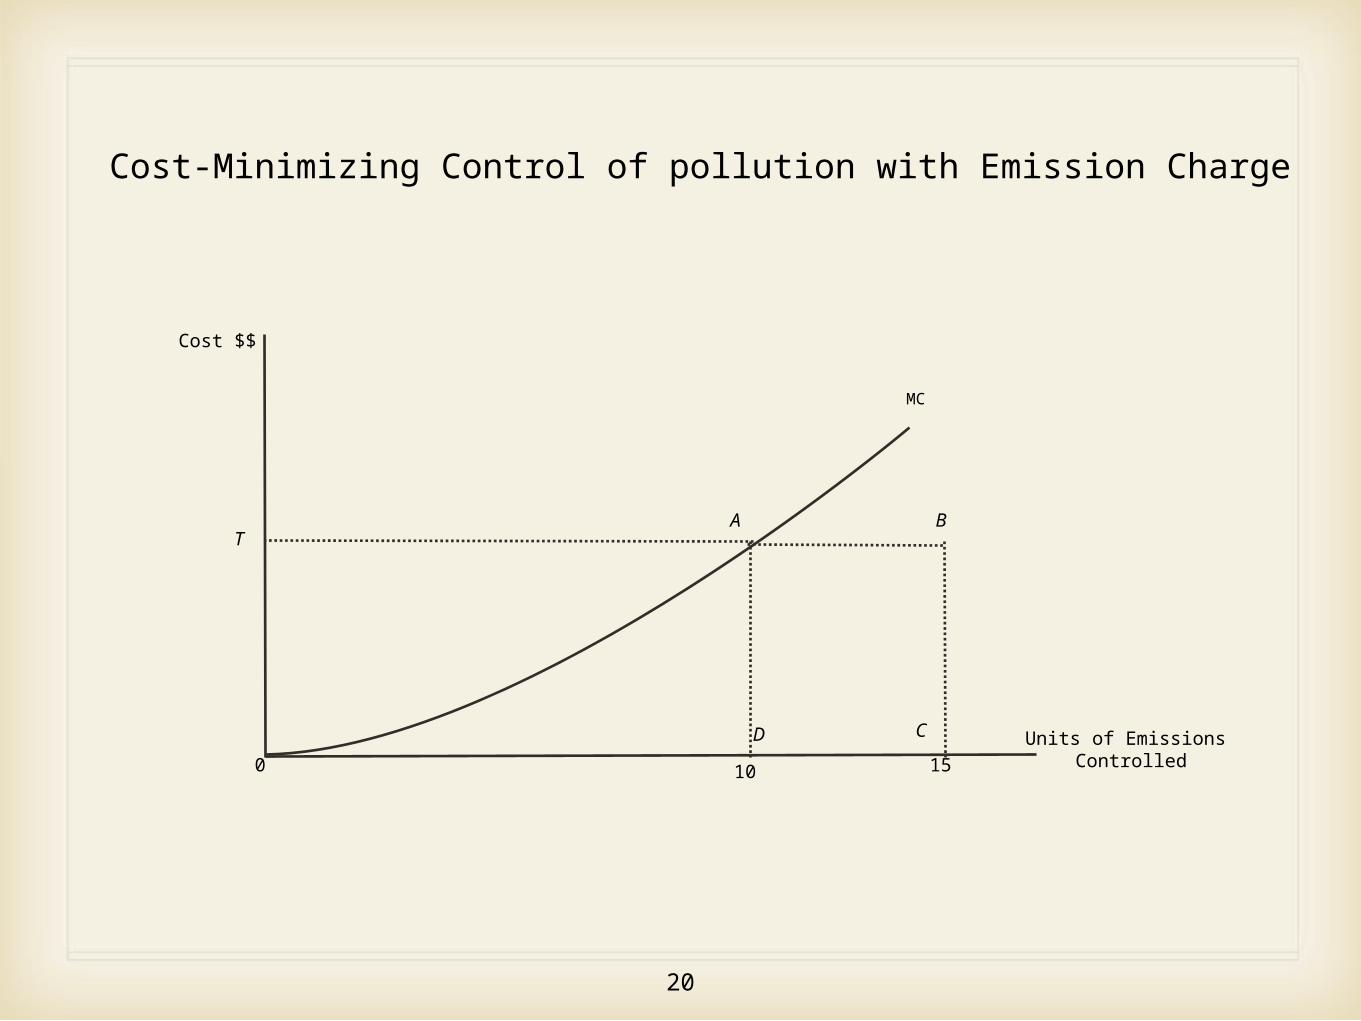
20
MC
Cost $$
Units of Emissions Controlled
TA B
D C
0 10 15
Cost-Minimizing Control of pollution with Emission Charge

21
• Is this the best the firm can do? • No, since it can control some
pollution at a lower cost than paying the emissions charge.
• It would pay the firm to reduce emissions until the marginal cost of reduction is equal to the emissions charge

22
• The firm would minimize its cost by choosing to clean up ten units of pollution and to emit five units.
• At this allocation the firm would pay control costs equal to area 0AD and total emissions charge payments equal to area ABCD for a total cost of 0ABC
• This is clearly less than 0TBC (the amount the firm would pay if it chose not to clean up any pollution)

23
3. Cap-and-Trade
• To find the cost-minimizing allocation without going through a trial-and-error process
• In this system: all sources face a limit on their emissions and they are allocated (or sold) allowances to emit.

24
• These can be distributed among the firms either by auctioning them off or by granting them directly to firms (an allocation referred to as “gifting”).
• the allowances are transferable; they can be bought and sold (permits more emissions)
25
• Read Debate 14.1 p. 375
• END of CH 14