ch 10 ppt ipm
DESCRIPTION
Ch 10 ppt ipmTRANSCRIPT
Chapter 10Charles P. Jones, Investments: Principles and Concepts,
Twelfth Edition, John Wiley & Sons
10-1
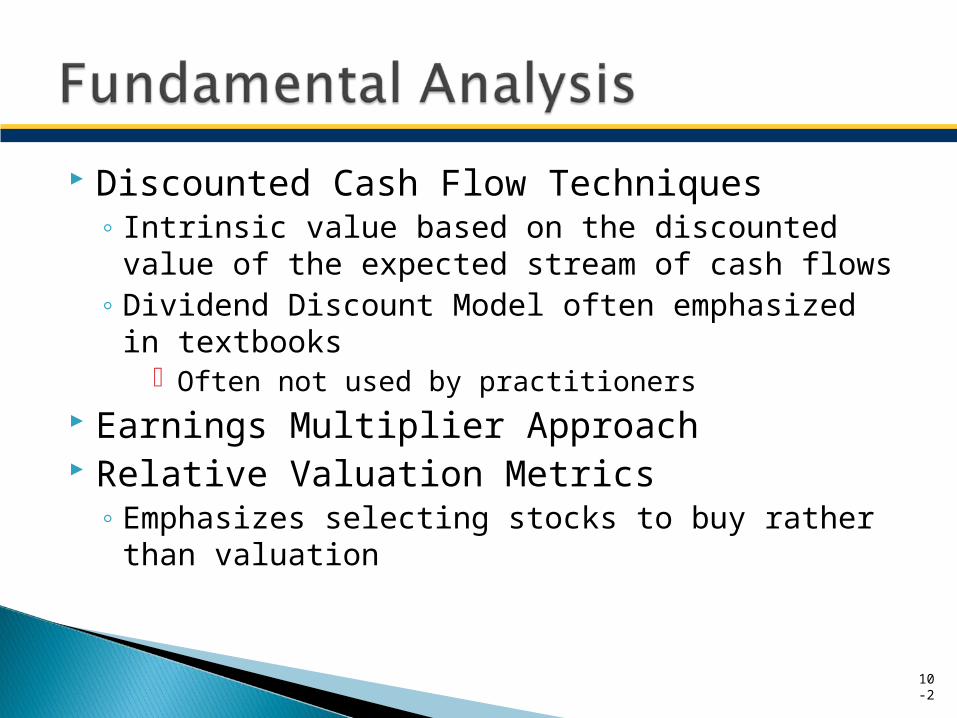
Discounted Cash Flow Techniques◦ Intrinsic value based on the discounted value of
the expected stream of cash flows◦ Dividend Discount Model often emphasized in
textbooks Often not used by practitioners
Earnings Multiplier Approach Relative Valuation Metrics
◦ Emphasizes selecting stocks to buy rather than valuation
10-2
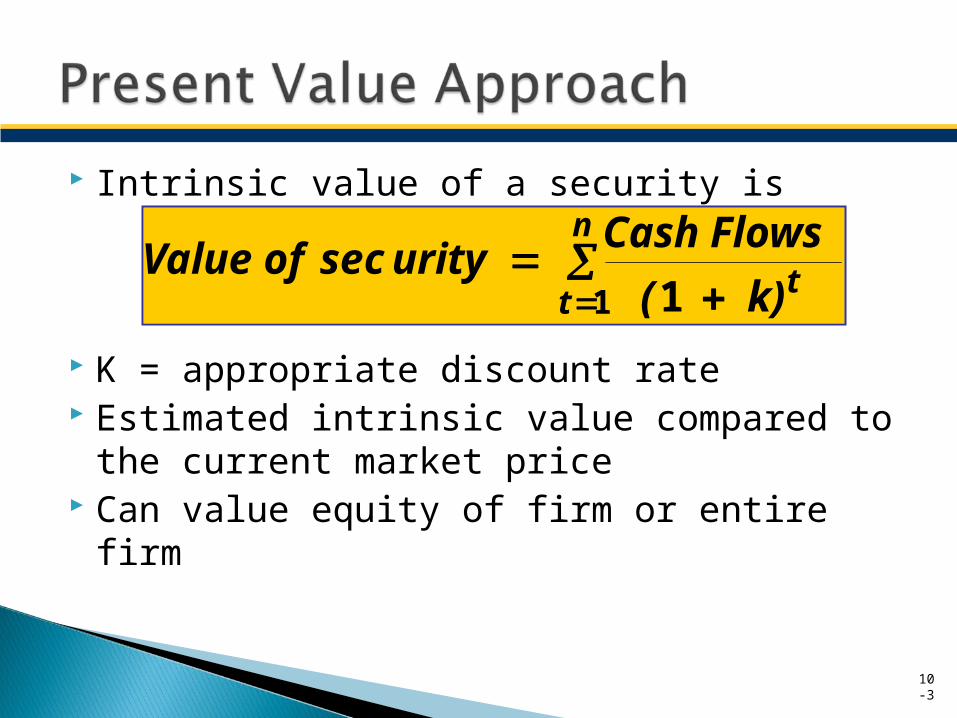
Intrinsic value of a security is
K = appropriate discount rate Estimated intrinsic value compared to the
current market price Can value equity of firm or entire firm
10-3
n
tt k) (
Cash Flows urity secValue of 1 1
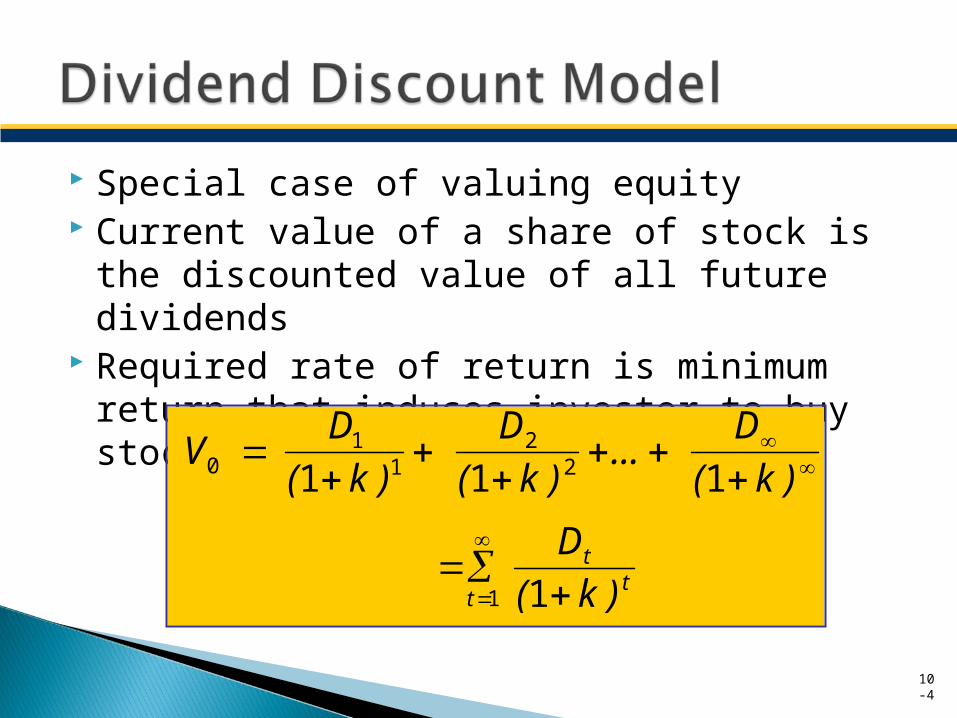
Special case of valuing equity Current value of a share of stock is the
discounted value of all future dividends Required rate of return is minimum return
that induces investor to buy stock
10-4
V0 D1
(1 k )1
D2
(1 k )2...
D
(1 k )
Dt
(1 k )tt1
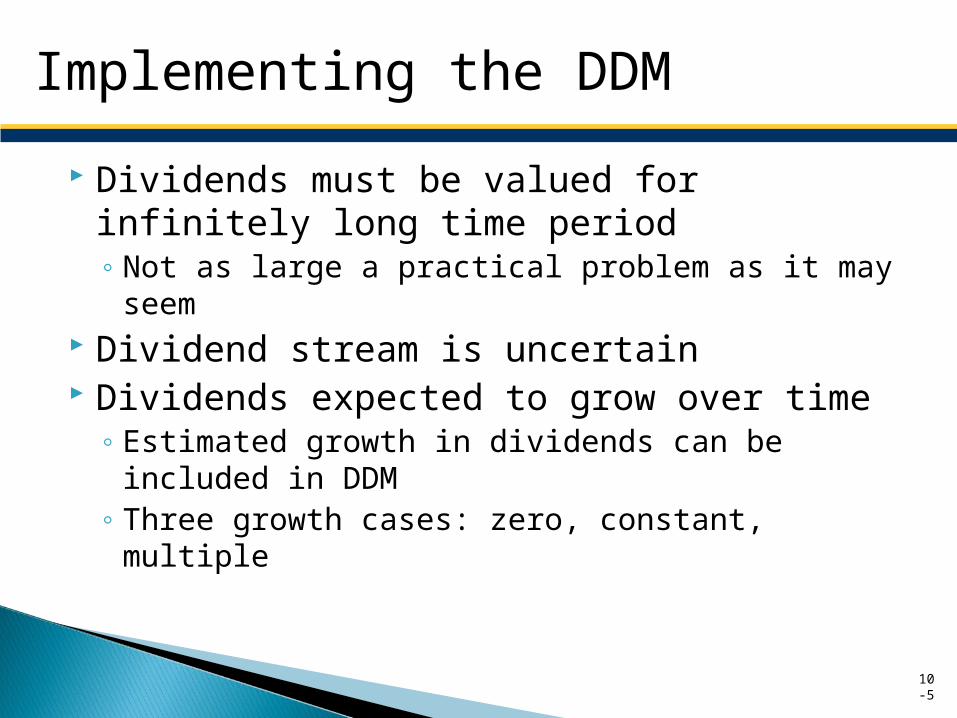
Dividends must be valued for infinitely long time period◦ Not as large a practical problem as it may seem
Dividend stream is uncertain Dividends expected to grow over time
◦ Estimated growth in dividends can be included in DDM
◦ Three growth cases: zero, constant, multiple
10-5
Implementing the DDM
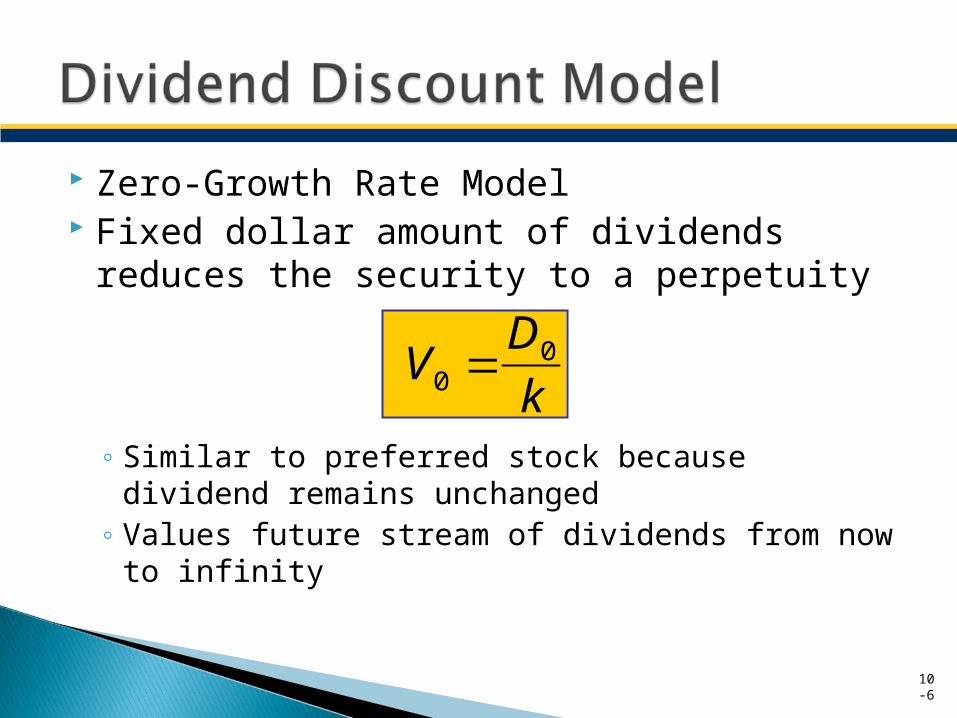
Zero-Growth Rate Model Fixed dollar amount of dividends reduces
the security to a perpetuity
◦ Similar to preferred stock because dividend remains unchanged
◦ Values future stream of dividends from now to infinity
10-6
V0 D0
k
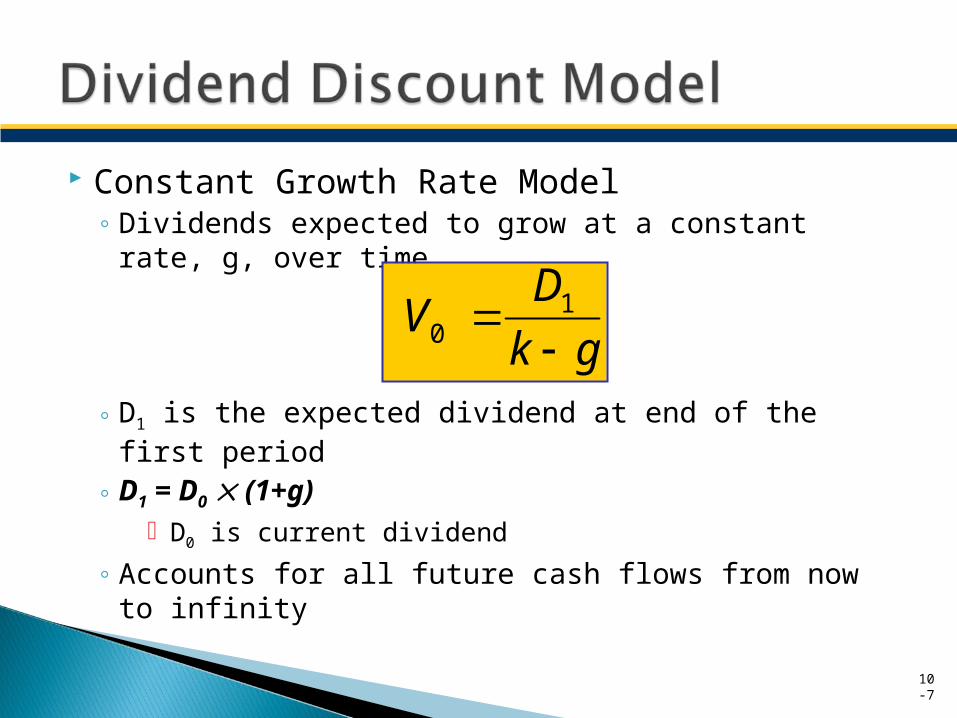
Constant Growth Rate Model◦ Dividends expected to grow at a constant rate, g,
over time
◦ D1 is the expected dividend at end of the first period
◦ D1 = D0 (1+g) D0 is current dividend
◦ Accounts for all future cash flows from now to infinity
10-7
V0 D1
k g

Implications of constant growth◦ Stock prices grow at the same rate as the
dividends◦ Stock total returns grow at the required rate of
return Growth rate in price plus growth rate in dividends
equals k, the required rate of return◦ A lower required return or a higher expected
growth in dividends raises prices Model is very sensitive to small variations in
inputs
10-8
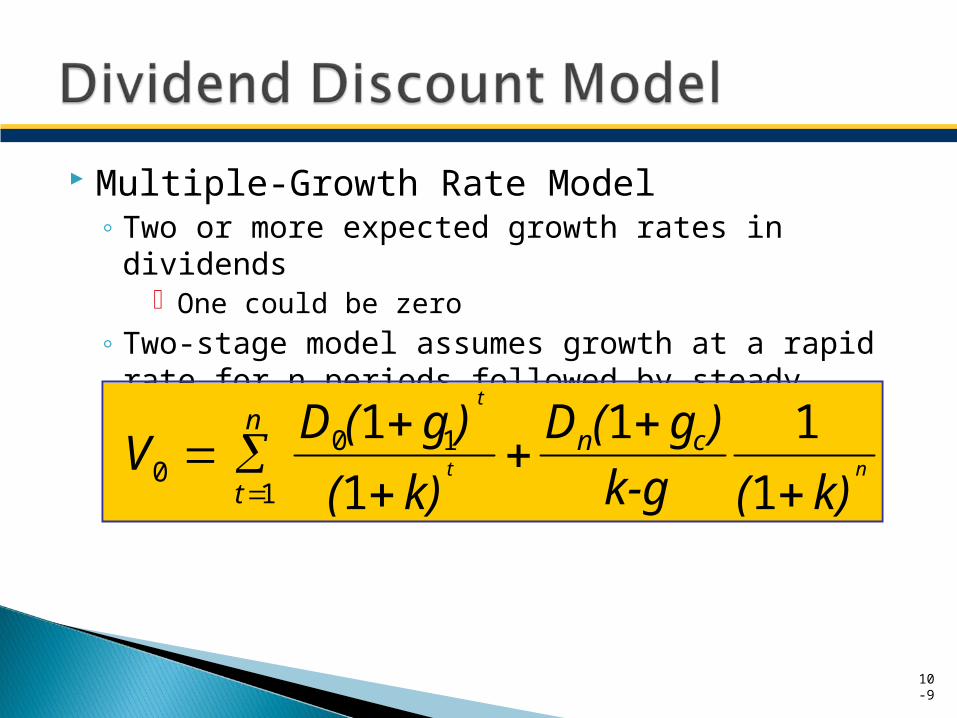
Multiple-Growth Rate Model◦ Two or more expected growth rates in dividends
One could be zero◦ Two-stage model assumes growth at a rapid rate
for n periods followed by steady growth
10-9
V0 D0(1 g1)
t
(1 k)t
t1
n
Dn(1 gc)
k-g
1
(1 k)n
Multiple growth rates◦ First present value covers the period of abnormal
growth◦ Second present value covers the period of stable
growth Limitations
◦ Very sensitive to inputs◦ Difficult to determine how long abnormal growth
will last◦ Assumes immediate transition to constant growth
10-
10
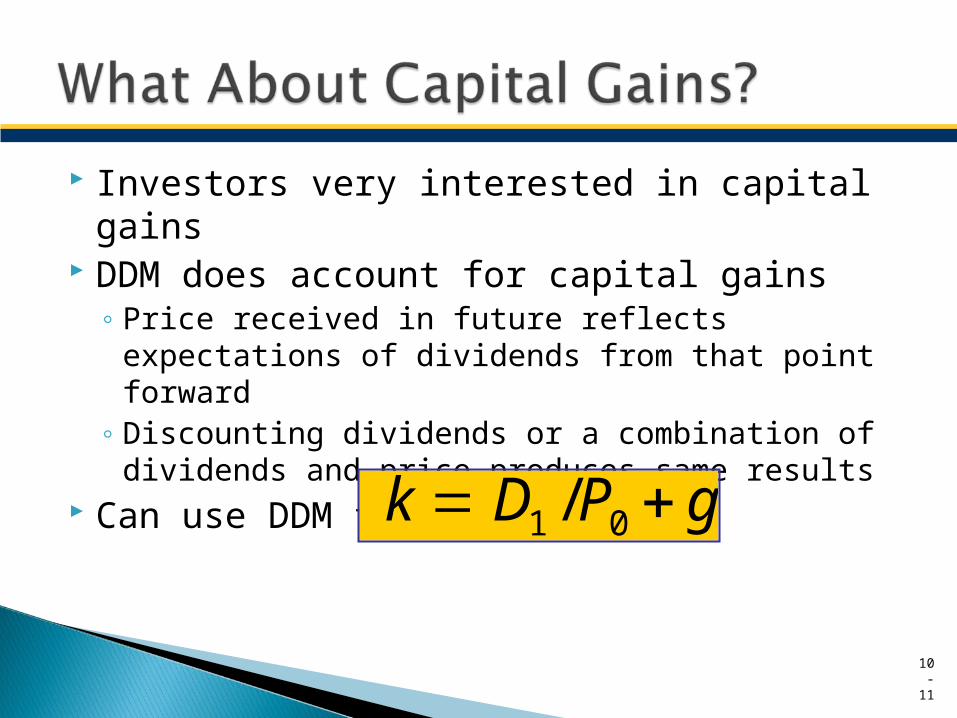
Investors very interested in capital gains DDM does account for capital gains
◦ Price received in future reflects expectations of dividends from that point forward
◦ Discounting dividends or a combination of dividends and price produces same results
Can use DDM to select stocks
10-
11
k D1 /P0 g

Free Cash Flow to Equity (FCFE): What could firm pay in dividends?◦ FCFE = Net Inc. + Deprec. – Debt Repayments –
Capital Expend. – Change in Working Cap. + Debt Issuance
Free Cash Flow to the Firm (FCFF): What cash is available before any financing considerations?◦ FCFF = FCFE + Interest Exp. (1-tax rate) + Principal
Repayments – Debt Issuance – Preferred Dividends10
-12
V0 Expected FCFE
k-g
Estimated value of stock today◦ Derived from estimating and discounting future
cash flows If intrinsic value >(<) current market price,
hold or purchase (avoid or sell) because the asset is undervalued (overvalued)◦ Decision will always involve estimates, be subject
to error◦ Some analysts use 15% rule
10-
13
Alternative approach often used by security analysts
P/E ratio is the strength with which investors value earnings as expressed in stock price◦ Divide the current market price of the stock by
the latest 12-month earnings◦ Price paid for each $1 of earnings◦ One of the most widely discussed variable of a
stock
10-
14
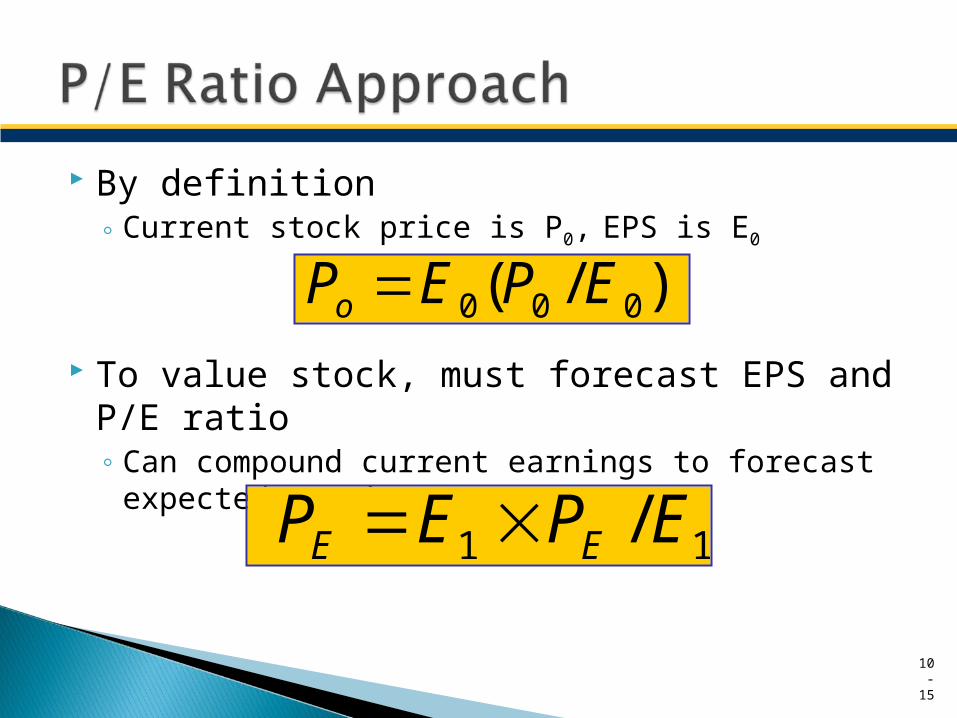
By definition◦ Current stock price is P0, EPS is E0
To value stock, must forecast EPS and P/E ratio◦ Can compound current earnings to forecast
expected earnings
10-
15
Po E0(P0 /E0)
PE E1 PE /E1
Compare company relative to peers, the market
P/E ratios◦ High P/E ratios can result from several factors, not
all equally desirable for investor◦ Best used to make specific comparisons
Price/Book value◦ Price/Stockholders’ Equity◦ Best suited for companies with hard assets
10-
16
Relative Valuation
Price/Sales Ratio (PSR)◦ Can be used to value companies without earnings◦ Price/Revenues per share over four most recent
quarters◦ Important to interpret within industry norms
Economic Value Added (EVA)◦ Difference between operating profits and
company’s capital cost◦ Emphasizes return on capital
10-
17
Relative Valuation
Discounted cash flow theoretically best◦ May be unrealistic because accurate estimates
difficult P/E multiplier serves dual role
◦ Estimating intrinsic value of stock◦ Relative valuation
All methods subject to estimation error Traditional methods do apply to “new
economy” stocks: revenues and profits matter
10-
18

Copyright 2013 John Wiley & Sons, Inc.All rights reserved. Reproduction or translation of this
work beyond that permitted in section 117 of the 1976 United States Copyright Act without express permission of the copyright owner is unlawful. Request for further information should be addressed to the Permissions Department, John Wiley & Sons, Inc. The purchaser may make back-up copies for his/her own use only and not for distribution or resale. The Publisher assumes no responsibility for errors, omissions, or damages caused by the use of these programs or from the use of the information herein.
10-
19