cgis research a4 - set.or.th · ftse/asean index series research report ... industry classification...
TRANSCRIPT

FTSE/ASEAN IndicesNew Tradable and Benchmark Indices forSouth East Asia
Report highlights• New set of indices to allow investors to gain exposure to the fast growing
ASEAN economy
• ETFs, Index Linked Funds and OTC Products will allow a wide range of funds to
be developed
• Low volatility compared to other emerging market indices in the region and a
very high degree of correlation between tradable and benchmark indices and
broader FTSE All-World Asia Pacific ex Japan Index

PAGE 2FTSE/ASEAN INDEX SERIES RESEARCH REPORT – SEPTEMBER 2005
FTSE Research
Carl Beckley Gareth Parker
Director, Research & Development Head of Index Design
[email protected] [email protected]
+44 20 7866 1820 +44 20 7866 1805
Andy Harvell* Jamie Perrett
Head of Research Senior Index Design Executive
[email protected] [email protected]
+44 20 7866 1804 +44 20 7866 1817
Andreas Elia* Tasos Kontos
Research Analyst Index Design Executive
[email protected] [email protected]
+44 20 7866 8013 +44 20 7866 1887
*Key contributors
For information on purchasing data or licensing please contact FTSE Client Services:
US: [email protected] +(1) 212 641 6165
Europe: [email protected] +44 (0) 20 7866 1800
Asia: [email protected] +852 2230 5800

Contents
FTSE Research Team...................................................................................................................................................................................................... 2Executive Summary....................................................................................................................................................................................................... 4Overview....................................................................................................................................................................................................................... 4The Indices.................................................................................................................................................................................................................... 4Using the Indices .......................................................................................................................................................................................................... 4Why you should invest in ASEAN.................................................................................................................................................................................. 41. Overview ................................................................................................................................................................................................................. 5
1.1 Population breakdown within ASEAN.............................................................................................................................................................. 51.2 ASEAN Free Trade Area (AFTA) ........................................................................................................................................................................ 51.3 ASEAN 5 .......................................................................................................................................................................................................... 5
1.4 Economic Statistics .......................................................................................................................................................................................... 71.4.1 Gross Domestic Product (GDP) Nominal and Per Capita ....................................................................................................................... 71.4.2 Real GDP Growth (%, y-o-y) .................................................................................................................................................................. 71.4.3 ASEAN’s trade with the world ............................................................................................................................................................... 8
1.5 About ASEAN Exchanges ................................................................................................................................................................................. 91.5.1 Bursa Malaysia Berhad .......................................................................................................................................................................... 91.5.2 PT Bursa Efek Jakarta (Jakarta Stock Exchange).................................................................................................................................... 91.5.3 The Philippine Stock Exchange .............................................................................................................................................................. 91.5.4 Singapore Exchange ............................................................................................................................................................................. 91.5.5 The Stock Exchange of Thailand ............................................................................................................................................................ 9
1.6 Exchange Statistics .......................................................................................................................................................................................... 102. Introducing the FTSE/ASEAN Indices ...................................................................................................................................................................... 11
2.1 The Indices....................................................................................................................................................................................................... 112.1.1 The FTSE/ASEAN Index .......................................................................................................................................................................... 112.1.2 The FTSE/ASEAN 40 Index ..................................................................................................................................................................... 112.1.3 Country representation in the indices.................................................................................................................................................... 12
2.2 Index and Market Opening and Closing Times, Pricing and Exchange Rates................................................................................................... 132.2.1 Hours of calculation............................................................................................................................................................................... 132.2.2 Constituent Pricing ................................................................................................................................................................................ 132.2.3 Foreign Exchange Rates......................................................................................................................................................................... 13
3. Performance, Volatility, Correlations and Tracking Error........................................................................................................................................... 143.1 Performance..................................................................................................................................................................................................... 14
3.1.1 Performance of FTSE/ASEAN 40 Index and FTSE/ASEAN Index relative to the FTSE All-World Asia Pacific ex Japan Index .................. 143.1.2 Performance of FTSE/ASEAN 40 Index and FTSE/ASEAN Index relative to the FTSE All-World Asia Pacific ex Japan Index, FTSE
All-World India Index and FTSE All-World China Index Performance – Year-on-Year (Price Index and Total Returns) ........................... 143.1.3 Performance over last 5 years (Price Index and Total Returns) .............................................................................................................. 15
3.2 Volatility .......................................................................................................................................................................................................... 163.3 Correlations ..................................................................................................................................................................................................... 173.4 Tracking Error................................................................................................................................................................................................... 173.5 Risk Ratios ....................................................................................................................................................................................................... 17
4. Industry Classification Benchmark (ICB) .................................................................................................................................................................. 184.1 Introduction to the Industry Classification Benchmark (ICB) .......................................................................................................................... 184.2 Industry Group Analysis ................................................................................................................................................................................... 18
4.2.1 Comparison of Industry Group weightings between the FTSE/ASEAN 40 and FTSE/ASEAN Indices and AW Asia Pacific ex Japan Index . 194.2.2 Comparison of the Over/Underweight Industry Groups compared to the FTSE All-World Asia Pacific ex Japan Index.......................... 194.2.3 ICB Industry Group Breakdown of the FTSE/ASEAN 40, FTSE/ASEAN and FTSE All-World Asia Ex Japan Indices ................................. 20
5. Constituent Data ..................................................................................................................................................................................................... 215.1 Top 10 Securities.............................................................................................................................................................................................. 21
5.1.1 FTSE/ASEAN 40 Index ............................................................................................................................................................................ 215.1.2 FTSE/ASEAN Index ................................................................................................................................................................................. 21
5.2 FTSE/ASEAN 40 Index Constituents ................................................................................................................................................................. 226. Using the FTSE/ASEAN Indices ................................................................................................................................................................................ 23
6.1 Index Values .................................................................................................................................................................................................... 236.2 Exchange Traded Funds (ETF) .......................................................................................................................................................................... 236.3 Index Linked Funds and OTC Products............................................................................................................................................................. 236.4 Data Products .................................................................................................................................................................................................. 23
PAGE 3FTSE/ASEAN INDEX SERIES RESEARCH REPORT – SEPTEMBER 2005

EXECUTIVE SUMMARY
OverviewTwo new indices are launched by FTSE in conjunction with five of the exchanges in the ASEAN (Association of South East Asian Nations) Region. The
five exchanges are from the ASEAN 5 countries (Indonesia, Malaysia, the Philippines, Singapore and Thailand). Current exchanges are PT Bursa Efek
Jakarta (Jakarta Stock Exchange), Bursa Malaysia Berhad, The Philippine Stock Exchange, Inc., Singapore Exchange and The Stock Exchange of
Thailand.
The IndicesFTSE/ASEAN 40 Index is a tradable index consisting of 40 securities; FTSE/ASEAN Index is a benchmark index consisting currently of 180 securities,
based on the FTSE All-World ASEAN Index. The indices have lower volatility compared to other indices in the region and high degree of correlation
between the tradable and benchmark indices.
Using the IndicesThe index provides tools that could be used to give investors exposure to the growing emerging market economies of the ASEAN region.
Exchange Traded Funds and other index-linked products on the FTSE/ASEAN 40 Index will provide investors with additional choice of investment
options for the ASEAN region.
Why you should invest in ASEANThe ASEAN region accounted for 1.89% of global GDP in 2003 with GDP growth of 5.01% for the ASEAN region and 4.80% for the ASEAN 5. In 2004,
the ASEAN 5 had a GDP growth of 5.93%, far outstripping that of the USA and EU-25. ASEAN is the USA’s third largest two-way overseas market and
China’s fifth largest trading partner with trade worth over USD100bn in 2004. ASEAN can be viewed as a region with strong economic growth fuelled
by demand from China and western markets. Its aim is to be one of the foremost economic regions of the world and the FTSE/ASEAN 40 and
FTSE/ASEAN Indices will allow investors to participate in this expected growth.
PAGE 4FTSE/ASEAN INDEX SERIES RESEARCH REPORT – SEPTEMBER 2005

1. OverviewThe Association of South East Asian Nations (ASEAN) was established on 8 Aug 1967 in Bangkok by five original member countries: Indonesia,
Malaysia, Philippines, Singapore and Thailand. Brunei Darussalam joined on 8 January 1984, Vietnam on 28 July 1995, Laos and Myanmar (Burma) on
23 July 1997, and Cambodia on 30 April 1999.
The ASEAN region had a population, in 1999, of 500 million (8% of the World’s population and larger than the European Union), a total area of 4.5m
sq. km (3.3% of the total surface area of the world), a combined GDP in 2003 of USD700bn (growing 5% per annum) and a total trade of USD720bn.
The economies of member countries of ASEAN are diverse, although its major products include Electronics, Oil, and Wood.
Figure 1: Map of ASEAN RegionThe aims of the Association are to accelerate the economic growth,
social progress and cultural development of the region. This is
achieved through joint endeavours in the spirit of equality and partnership
in order to strengthen the foundation for a prosperous and peaceful
community on Southern Asian nations. ASEAN also look to promote regional
peace and stability through abiding respect for justice and the rule of law in
the relationship among countries in the region and adherence to the
principles of the UN Charter. The countries meet annually in November for
summits.
ASEAN regularly conducts dialogue meetings with other countries and an
organization, collectively known as the ASEAN dialogue partners. The
members of this are Australia, Canada, the People’s Republic of China, North
Korea, South Korea, the United States, India, Japan, Mongolia, New Zealand,
Russia, and the European Union. ASEAN Headquarters are located in Jakarta,
Indonesia.
Currencies: Philippine peso (PHP), Malaysian ringgit (MYR), Myanmar kyat
(MMK), Laos kip (LAK), Thai baht (BHT), Cambodian riel (KHR), Singapore
dollar (SGD), Brunei dollar (BND), Indonesian rupiah (IDR) and Vietnamese
dong (VND).
PAGE 5FTSE/ASEAN INDEX SERIES RESEARCH REPORT – SEPTEMBER 2005
Source: FTSE, ASEAN Secretariat

1.1 Population breakdown within ASEANThe ASEAN population is 4.2 times the size of Japan, 1.2 times that of the EU-25 and 1.8 times that of the USA.
ASEAN population by country (2003)Country Population Pct Pct Population breakdown
(m) ASEAN World
Brunei 0.36 0.07 0.01Cambodia 13.4 2.49 0.21Indonesia 214.47 39.93 3.42Laos 5.66 1.05 0.09Malaysia 24.77 4.61 0.39Myanmar 49.36 9.19 0.79Philippines 81.50 15.17 1.30Singapore 4.25 0.79 0.07Thailand 62.01 11.55 0.99Vietnam 81.31 15.14 1.30ASEAN 537.11 100.00 8.56ASEAN 5 387.00 72.05 6.17Japan 127.21 2.03China 1288.40 20.54S Korea 47.91 0.76Hong Kong SAR 6.82 0.11Taiwan 22.52 0.36USA 291.04 4.64EU 25 453.9 7.24Rest of World 3950.71 55.76
World Total 6271.7 100.00
Source: ASEAN Secretariat
1.2 ASEAN Free Trade Area (AFTA)The AFTA is an agreement by ASEAN of local manufacturing in all ASEAN countries. Its aim is to increase ASEAN’s competitive edge as a production
base in the world markets, through the elimination of tariff and non-tariff barriers within ASEAN and to attract more inward foreign direct investment
to the region.
China and ASEAN are already committed to creating a free trade area by 2010, which would make the region the world's most populous market, with
1.7 billion consumers.
1.3 ASEAN 5The ASEAN 5 is a subset of countries within the ASEAN region. It is made up of Indonesia, Malaysia, the Philippines, Singapore and Thailand, the five
founder members of ASEAN. It accounts for 72% of the ASEAN population and 6.17% of the world population. The ASEAN 5 accounts for 91% of
ASEAN GDP, equivalent to 1.72% of global GDP and had GDP growth of 5.93% in fiscal year 2004.
The FTSE/ASEAN indices are produced in conjunction with the exchanges of the ASEAN 5 countries.
PAGE 6FTSE/ASEAN INDEX SERIES RESEARCH REPORT – SEPTEMBER 2005
Brunei0% Cambodia
2%
Indonesia40%
Laos1%Malaysia
5%Myanmar
9%
Brunei
Philippines15%
Singapore1%
Thailand12%
Vietnam15%
Cambodia Indonesia
Myanmar
Philippines Singapore
Laos
Thailand
Malaysia
Vietnam

1.4 Economic Statistics
1.4.1 Gross Domestic Product (GDP) Nominal and Per Capita
GDP Nominal & Per Capita (2003)
Country Actual figure ASEAN World GDP per Capita World Ave Ratio(GDPbn) Ratio (%) Ratio (%) (USD) (%)
Brunei 4.7 0.68 0.01 13,056 225.22Cambodia 4.2 0.61 0.01 313 5.41Indonesia 208.5 30.38 0.57 972 16.77Laos 2.0 0.29 0.01 353 6.10Malaysia 103.2 15.04 0.28 4,166 71.87Myanmar 9.6 1.40 0.03 194 3.36Philippines 80.4 11.71 0.22 987 17.02Singapore 91.4 13.32 0.25 21,506 370.99Thailand 143.3 20.88 0.39 2,311 39.86Vietnam 39.0 5.68 0.11 480 8.27ASEAN 686.3 100.00 1.89 1,278 22.04ASEAN 5 626.8 91.33 1.72 1,620 27.94Japan 4,326.4 11.90 34.010 586.69China 1,409.9 3.88 1,094 18.88S Korea 605.3 1.66 12,634 217.95Hong Kong SAR 158.6 0.44 23,255 401.17Taiwan 281.5 0.77 12,500 215.63USA 10,881.6 29.93 37,389 644.98EU 25 10,970.2 30.17 24,169 416.93Rest of World 7,036.4 19.35 2,012 34.71
World Total 36,356.2 100.00 5,797 100.00
Source: Facts about ASEAN
1.4.2 Real GDP Growth (%, y-o-y)
Real GDP Growth (%, y-o-y) 1996 – 2004
Country 1996 1997 1998 1999 2000 2001 2002 2003 2004
Brunei 1.01 3.60 -3.99 2.56 2.82 3.05 2.83 3.20Cambodia 4.60 6.82 3.70 10.78 7.03 5.67 5.48 5.00Indonesia 7.82 4.70 -13.13 0.79 4.92 3.45 3.69 4.10 4.32Laos 6.89 6.91 3.99 7.28 5.81 5.76 5.70 5.90Malaysia 10.00 7.32 -7.36 6.14 8.86 0.32 4.15 5.31 8.01Myanmar 6.44 5.74 5.77 10.92 13.70 10.50 5.00 5.10Philippines 5.85 5.19 -0.59 3.41 4.38 4.52 3.12 4.70 6.15Singapore 7.71 8.51 -0.86 6.42 9.41 -2.37 3.29 1.09 12.55Thailand 5.90 -1.37 -10.51 4.45 4.76 2.14 5.41 6.75Vietnam 9.33 8.15 5.83 4.71 6.76 6.93 7.04 7.24 6.29
ASEAN 7.30 4.16 -7.14 3.58 5.91 3.26 4.33 5.01ASEAN 5 7.23 3.76 -8.93 3.11 5.54 2.59 4.04 4.80 5.93BCLMV 7.85 7.23 5.21 6.71 8.36 7.57 6.20 6.34
Japan 3.62 1.72 -1.11 -0.03 2.39 0.16 -0.29 1.41 2.64China 9.60 8.80 7.80 7.10 8.00 7.50 8.00 9.30 9.50S Korea 6.92 4.63 -6.73 9.45 8.48 3.8 6.97 3.11 4.66Hong Kong SARTaiwanUSA 3.7 4.5 4.2 4.5 3.7 0.8 1.6 2.7 4.2EU 15 2.00 3.00 3.00 3.00 4.00 2.00 1.00 1.00 2.00
Source: ASEAN Statistics Unit, Thomson Financial DatastreamASEAN 5: Indonesia, Malaysia, Philippines, Singapore and ThailandBCLMV: Brunei Darussalam, Cambodia, Laos, Myanmar and Vietnam
PAGE 7FTSE/ASEAN INDEX SERIES RESEARCH REPORT – SEPTEMBER 2005

1.4.3 ASEAN’s trade with the world• Approximately 24% of total trade value (both import and export) is intra-regional
• Exports have risen by 25% over the last nine years.
• The value of the ASEAN trade is larger than that of the MERCOSUR region.
ASEAN Trade Value (2003)
Exports ImportsCountry/Region Trade Value (%Total) Trade Value (%Total)
(GDPmn) (GDPmn)
Intra-Regional 95,641 23.7 97,658 24.2
USA 71,831 17.8 52,865 13.1
EU 56,497 14.0 43,987 10.9
Japan 50,847 12.6 66,182 16.4
China 21,388 5.3 30,670 7.6
Others 107,344 26.6 112,186 27.8
Total 403,547 100.0 355,164 100.0
Source Facts about ASEAN
Comparison with other trading regions (Imports and Exports 2003)Country/Region Members Nominal GDP Trade Value
(USDbn) (GDPbn)
ASEAN 10 countries 686.3 758.7European Union 15 15 countries 10,482.7 4,752.1
European Union 25 25 countries (2004/05) 10,970.2 5,090.3North American Free Trade Agreement (NAFTA) 3 countries
(USA, Canada, Mexico) 12,342.1 2,698.9Mercado Comun del Sur (MERCOSUR) 4 countries
(Argentina, Brazil, Paraguay, Uraguay) 639.1 150.0
Source Facts about ASEANEuropean Union 15 – Austria, Belgium, Denmark, Finland, France, Germany, Greece, Ireland, Italy, Luxembourg, Netherlands, Portugal, Spain, Sweden, UK.European Union 25 – EU-15 plus Cyprus, Czech Republic, Estonia, Hungary, Latvia, Lithuania, Malta, Poland, Slovak Republic and Slovenia.
PAGE 8FTSE/ASEAN INDEX SERIES RESEARCH REPORT – SEPTEMBER 2005

1.5 About ASEAN ExchangesThe FTSE/ASEAN indices are a joint collaboration between FTSE and the exchanges of the ASEAN 5 countries. This initiative is the first collaborative
effort amongst the Exchanges under the ASEAN umbrella using FTSEs internationally recognised index design methodology. The exchanges involved
are Bursa Malaysia Berhad, PT Bursa Efek Jakarta (Jakarta Stock Exchange), the Philippine Stock Exchange, Inc., Singapore Exchange (SGX) and the
Stock Exchange of Thailand (SET).
1.5.1 Bursa Malaysia BerhadBursa Malaysia Berhad is a public company limited by shares under the Companies Act 1965. Bursa Malaysia is an approved exchange holding
company under Section 11D of the Securities Industry Act 1983. Other companies in the Bursa Malaysia Bhd Group of companies include a stock
exchange, a derivatives exchange, an off-shore international financial exchange, equity and derivatives clearing houses, a central depository, an
information services provider and an Information Technology services provider.
Bursa Malaysia Securities Berhad, a wholly-owned subsidiary of Bursa Malaysia Berhad, is an approved stock exchange under Section 8 of the
Securities Industry Act 1983.
1.5.2 PT Bursa Efek Jakarta (Jakarta Stock Exchange)PT Bursa Efek Jakarta (Jakarta Stock Exchange), the Company, was established in 1992. In accordance to the Indonesian Capital Market Law, Law
Number 8/ 1995, the main purpose of the PT Bursa Efek Jakarta (Jakarta Stock Exchange) is to establish a regular, fair and efficient securities
trading activities.
1.5.3 The Philippine Stock ExchangeThe Philippine Stock Exchange, Incorporated (PSE) owns and operates the only stock exchange in the Philippines. The Securities and Exchange
Commission granted the company the status of self-regulatory organisation in 1998.
It was incorporated in 1992 as a non-stock corporation and underwent a listing by way of introduction in 2003, pursuant to the demutualization
mandate of the Securities Regulation Code of 2000. In addition, the PSE sold equity to strategic investors by way of private placement in 2004.
1.5.4 Singapore Exchange (SGX)Singapore Exchange (SGX) is Asia-Pacific's first demutualised and integrated securities and derivatives exchange.
SGX was inaugurated on 1 December 1999, following the merger of two established and well-respected financial institutions - the Stock Exchange
of Singapore (SES) and the Singapore International Monetary Exchange (SIMEX).
On 23 November 2000, SGX became the first exchange in Asia-Pacific to be listed via a public offer and a private placement. Listed on its own
bourse, the SGX stock is a component of benchmark indices such as the FTSE All-World Index and the Straits Times Index.
1.5.5 The Stock Exchange of ThailandThe Stock Exchange of Thailand (SET) was established in 1975 under the 1974 Securities Exchange Act of Thailand and officially began securities
trading on April 30, 1975. The Stock Exchange of Thailand stands at the centre of Thailand’s capital market, and is a thriving and dynamic exchange
offering a full range of products, services and trading infrastructure for investors, listed companies and other participants.
PAGE 9FTSE/ASEAN INDEX SERIES RESEARCH REPORT – SEPTEMBER 2005

1.6 Exchange StatisticsExchange Listed Cos Mkt Cap Value Traded No Trades No Shares Ave Daily Ave Value
of Listed Cos (USDm) (m) Traded (m) Turnover of Trades(USDm) (USDm) (USD000s)
Indonesia 331 73,250.6 27,517.7 3,724.0 411,768.3 114.2 7.4Malaysia 959 181,623.8 61,636.4 20,035.3 122,680.4 248.5 3.1Philippines 235 28,602.0 3,681.2 633.6 284,341.7 247.0 5.8Singapore 633 217,617.8 107,247.4 n/a 171,149.7 252.0 n/aThailand 463 115,390.4 116,381.2 28,551.7 555,298.7 247.0 4.1
Source: World Federation of Exchanges
PAGE 10FTSE/ASEAN INDEX SERIES RESEARCH REPORT – SEPTEMBER 2005

2. Introducing the FTSE/ASEAN Indices• The FTSE/ASEAN Indices are designed to represent the performance of ASEAN region’s markets.
• Initially the series will comprise of five markets: Indonesia, Malaysia, the Philippines, Singapore and Thailand. Other markets may be added over
time.
• The series contains a benchmark and a tradable index that are suitable for Exchange Traded Funds (ETFs), derivatives and other tradable products.
These indices have been produced in collaboration with exchanges of the initial five countries listed above and are derived from the FTSE All-World
ASEAN Index, part of the FTSE Global Equity Index Series.
These indices are designed to give investors access to the ASEAN markets a major emerging player in the global market place, and present new and
exciting opportunities.
2.1 The Indices
2.1.1 The FTSE/ASEAN IndexThis index represents those companies from the ASEAN region that are current constituents of the FTSE All-World Index. The Index is calculated on an
end-of-day basis. Capital and Total Return Indices are available and the base currency for the FTSE/ASEAN Index is US dollars.
Constituents of the FTSE All-World Country Index for each participating exchange are eligible for inclusion in the index. The shares, free float
weightings and treatment of secondary lines of stock of constituents are the same as those used in the FTSE Global Equity Index Series.
The constituents of the FTSE/ASEAN Index are determined by the ground rules of the FTSE Global Equity Index Series.
Companies must trade at least 0.5% of their available shares in issue, in ten out of twelve months prior to an index review to be eligible for inclusion
in the index. This ensures that every stock is liquid, keeps trading impact lower and reduces turnover. They must also have a market capitalisation
greater than USD100m.
Free float adjusted to take into account that available shares to be traded are applied using a banding structure. The bands are narrower at the lower
end of the scale for greater sensitivity, and broader at the top. The weighting of companies therefore remains stable unless a significant corporate
event occurs. The system is proven to accurately reflect the investability of a company, without subjecting investors to unnecessary rebalancing and
transaction costs.
2.1.2 The FTSE/ASEAN 40 IndexThis index is designed to represent the performance of the largest companies in the ASEAN region’s markets. It is suitable for Exchange Traded Funds
(ETFs), derivatives and other tradable products. The index is calculated in real-time and published every 15 seconds during the hours of calculation.
The base currency for the index is US dollars. Total return and price indices are available on an end of day basis.
The index consists of the largest 40 companies by full market capitalisation from the eligible markets. Securities that are members of the FTSE All-
World Country Index of Singapore, Malaysia, Thailand, Indonesia or the Philippines are potentially eligible for inclusion in the FTSE/ASEAN 40 Index,
subject to them passing a liquidity screen. Each security must turn over at least 20% of its shares in issue, after adjusting for free float, in the twelve
months prior to the review.
The FTSE/ASEAN 40 Index is reviewed annually in March, based on data from the close of the last business day in February. Changes arising from the
annual review are implemented after the close of business on the third Friday in March.
If a constituent of the FTSE/ASEAN 40 Index ceases to be a constituent of the FTSE Global Equity Index Series it will be removed from the index. The
removal will be concurrent with its removal from the FTSE Global Equity Index Series. The highest-ranking non-constituent from the FTSE/ASEAN Index
will become eligible for inclusion into the index and will be added at the same time.
PAGE 11FTSE/ASEAN INDEX SERIES RESEARCH REPORT – SEPTEMBER 2005

If a constituent is added to the relevant FTSE Global Equity Index Series Country Index it will be considered for eligibility to the FTSE/ASEAN 40 Index
at the next annual review.
If two constituents of the FTSE/ASEAN 40 Index merge the resulting company will remain a constituent of the index and a vacancy will be created.
This vacancy will be filled by selecting the largest eligible non-constituent security, by full market capitalisation, from the FTSE/ASEAN Index at the
time of the event. The removal and replacement of these stocks will be simultaneous.
If a constituent is taken over by an eligible non-constituent, the original constituent will be removed and replaced by the merged entity. In the event
that the merged entity is non-eligible for the index, it will be replaced by the largest eligible non-constituent security, by full market capitalisation,
from the FTSE/ASEAN Index at the time the time of the event. The removal and replacement of these stocks will be simultaneous.
2.1.3 Country representation in the indicesThe chart below shows the breakdown of the FTSE/ASEAN 40 and FTSE/ASEAN Indices by market capitalisations. In the FTSE/ASEAN 40 Index
Singapore and Thailand have a larger representation than in the benchmark FTSE/ASEAN Index.
Comparison of the FTSE/ASEAN 40 Index with ASEAN Country Weights (%)
Source: FTSE Group
The Philippines weighting in the FTSE ASEAN/40 Index is about a third of that in the FTSE/ASEAN Index and is represented by one security, compared
to 12 out of 180 in the FTSE/ASEAN Index.
Comparison of number of securities in FTSE/ASEAN 40 Index and FTSE/ASEAN Index
Country FTSE/ASEAN 40 FTSE/ASEAN
Singapore 12 51
Malaysia 14 58
Thailand 6 44
Indonesia 7 15
Philippines 1 12
Total 40 180
Source: FTSE Group
PAGE 12FTSE/ASEAN INDEX SERIES RESEARCH REPORT – SEPTEMBER 2005
49.46
25. 80
12. 9811. 00
0.77
44.40
29. 30
14.69
8.90
2. 71
0
10
20
30
40
50
60
Singapore Malaysia Thailand Indonesia Philippines
FTSE/ASEAN 40 FTSE/ASEAN
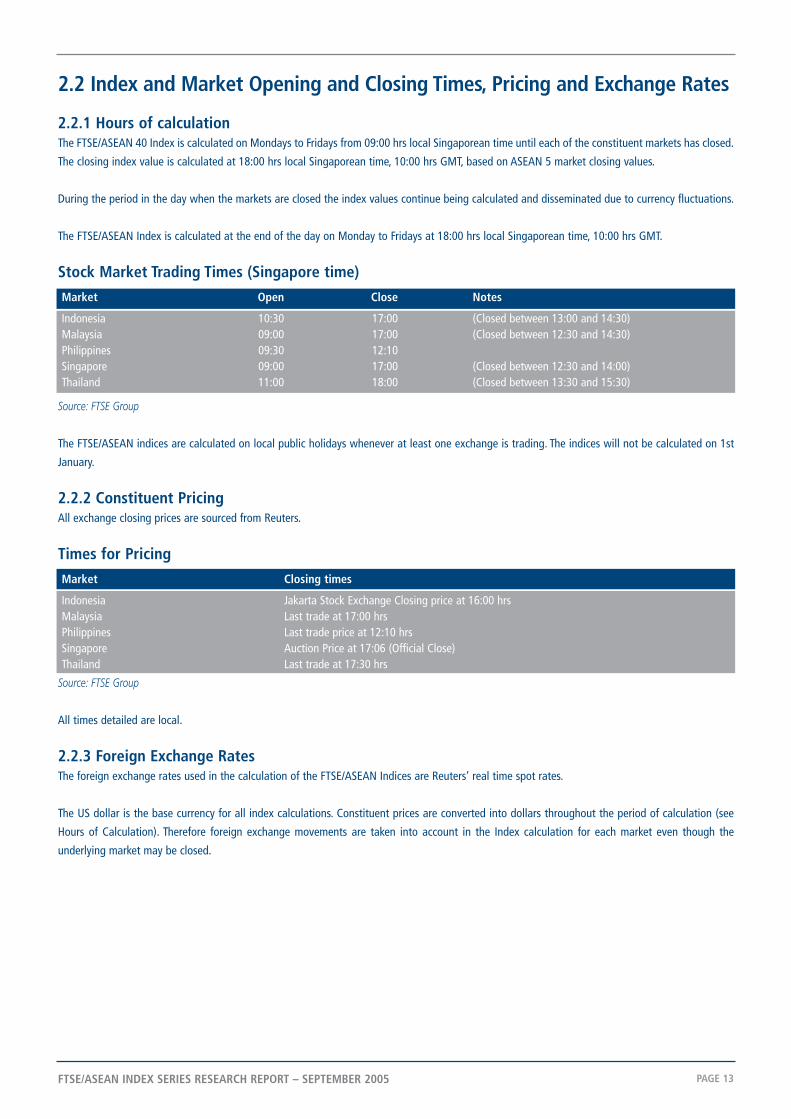
2.2 Index and Market Opening and Closing Times, Pricing and Exchange Rates
2.2.1 Hours of calculationThe FTSE/ASEAN 40 Index is calculated on Mondays to Fridays from 09:00 hrs local Singaporean time until each of the constituent markets has closed.
The closing index value is calculated at 18:00 hrs local Singaporean time, 10:00 hrs GMT, based on ASEAN 5 market closing values.
During the period in the day when the markets are closed the index values continue being calculated and disseminated due to currency fluctuations.
The FTSE/ASEAN Index is calculated at the end of the day on Monday to Fridays at 18:00 hrs local Singaporean time, 10:00 hrs GMT.
Stock Market Trading Times (Singapore time)
Market Open Close Notes
Indonesia 10:30 17:00 (Closed between 13:00 and 14:30)Malaysia 09:00 17:00 (Closed between 12:30 and 14:30)Philippines 09:30 12:10Singapore 09:00 17:00 (Closed between 12:30 and 14:00)Thailand 11:00 18:00 (Closed between 13:30 and 15:30)
Source: FTSE Group
The FTSE/ASEAN indices are calculated on local public holidays whenever at least one exchange is trading. The indices will not be calculated on 1st
January.
2.2.2 Constituent PricingAll exchange closing prices are sourced from Reuters.
Times for Pricing
Market Closing times
Indonesia Jakarta Stock Exchange Closing price at 16:00 hrsMalaysia Last trade at 17:00 hrsPhilippines Last trade price at 12:10 hrsSingapore Auction Price at 17:06 (Official Close)Thailand Last trade at 17:30 hrs
Source: FTSE Group
All times detailed are local.
2.2.3 Foreign Exchange RatesThe foreign exchange rates used in the calculation of the FTSE/ASEAN Indices are Reuters’ real time spot rates.
The US dollar is the base currency for all index calculations. Constituent prices are converted into dollars throughout the period of calculation (see
Hours of Calculation). Therefore foreign exchange movements are taken into account in the Index calculation for each market even though the
underlying market may be closed.
PAGE 13FTSE/ASEAN INDEX SERIES RESEARCH REPORT – SEPTEMBER 2005

3. Performance, Volatility, Correlations and Tracking Error
3.1 Performance
3.1.1 Performance of FTSE/ASEAN 40 Index and FTSE/ASEAN Index relative to the FTSE All-WorldAsia Pacific ex Japan Index
Performance comparisons have been carried out between the tradable FTSE/ASEAN 40, the benchmark FTSE/ASEAN and the broad FTSE Asia Pacific
ex Japan Indices to show how performance has compared over the last five years. As can be seen from the chart below there has been similar
performance between the two FTSE/ASEAN Indices and the FTSE All-World Asia Pacific ex Japan Index over the last five years, although recently the
performance has started to diverge.
Five year total return performance to 31 August 2005 (USD terms)
Source: FTSE Group
3.1.2. Performance of FTSE/ASEAN 40 Index and FTSE/ASEAN Index relative to the FTSE All-WorldAsia Pacific ex Japan Index, FTSE All-World India Index and FTSE All-World China IndexPerformance – Year-on-Year (Price Index and Total Returns)
The following chart shows the performance over one year in comparison to the FTSE All-World Asia Pacific ex Japan, FTSE All-World China, FTSE
All-World China and FTSE/Xinhua China 25 Indices. These indices have been chosen because they also represent large emerging market economies
that would be expected to perform in a similar manner. As can be seen in the chart the FTSE/ASEAN Indices performed well in the earlier part of the
year, outperforming the FTSE/Xinhua 25 and FTSE All-World China Indices, but suffering more recently. This can be partly explained by the weakening
of the Indonesian rupiah against the dollar and the reliance of ASEAN on oil imports, causing a temporary correction. India, the top performer in the
chart, is a more developed emerging market and not subject to the same economic pressures as ASEAN.
PAGE 14FTSE/ASEAN INDEX SERIES RESEARCH REPORT – SEPTEMBER 2005
Aug-20
00
Nov-20
00
Feb-
2001
May-20
01
Aug-20
01
Nov-20
01
Feb-
2002
May-20
02
Aug-20
02
Nov-20
02
Feb-
2003
May-20
03
Aug-20
03
Nov-20
03
Feb-
2004
May-20
04
Aug-20
04
Nov-20
04
Feb-
2005
May-20
05
FTSE/ASEAN 40 Index FTSE/ASEAN Index FTSE Asia Pacific ex Japan
60
80
100
120
140
160

One year total return performance to 31 August 2005 (USD terms)
Source: FTSE Group
3.1.3. Performance over last 5 years (Price Index and Total Returns)
Capital returns over the last 5 years (USD)
Index 3M 6M YTD 12M 3Y 5Y 5Y Ann (%) (%) (%) (%) (%) (%) (%)
FTSE/ASEAN 40 Index 2.8 -2.2 0.8 14.4 48.7 12.2 2.3
FTSE/ASEAN Index 3.5 -1.4 2.9 17.7 55.2 20.5 3.8
FTSE Asia Pacific ex Japan Index 6.2 1.4 6.8 28.0 71.1 31.3 5.6
FTSE China Index 10.5 -0.7 7.9 17.5 106.3 184.9 23.3
FTSE India Index 14.1 13.2 14.1 53.8 167.0 76.6 12.0
FTSE/Xinhua China 25 Index 12.0 3.8 9.4 21.7 97.8 48.7 8.3
Source: FTSE Group
Total returns over the last 5 years (USD)
Index 3M 6M YTD 12M 3Y 5Y 5Y Ann (%) (%) (%) (%) (%) (%) (%)
FTSE/ASEAN 40 Index 5.0 1.8 4.9 20.2 68.9 35.0 6.2
FTSE/ASEAN Index 4.6 1.0 5.5 21.6 69.9 37.3 6.5
FTSE Asia Pacific ex Japan Index 7.5 3.5 9.6 32.3 88.2 52.4 8.8
FTSE China Index 10.8 1.8 10.7 21.2 127.2 245.2 28.1
FTSE India Index 15.3 14.6 15.6 56.7 185.4 96.4 14.5
FTSE/Xinhua China 25 Index 12.2 6.4 12.1 26.0 118.1 74.0 11.7
Source: FTSE Group
PAGE 15FTSE/ASEAN INDEX SERIES RESEARCH REPORT – SEPTEMBER 2005
Aug-20
04
Sep-
2004
Oct-20
04
Nov-20
04
Dec-20
04
Jan-20
05
Feb-
2005
Mar-20
05
Apr-20
05
May-20
05
Jun-2
005
Jul-2
005
Aug-20
05
FTSE/ASEAN 40 Index FTSE/ASEAN Index FTSE Asia Pacific ex Japan Index
FTSE China Index FTSE India Index FTSE/Xinhua China 25 Index
90
100
110
120
130
140
150
160

3.2 Volatility• Short term volatility of both ASEAN indices is lower than that of other indices in the region
• One year volatility currently is lower than that of the FTSE Asia Pacific ex Japan for both ASEAN indices
22 day rolling volatility (annualised)
Source: FTSE Group Volatility annualised using basis of 260 trading days in a year
One year rolling volatility (annualised)
Source: FTSE Group
PAGE 16FTSE/ASEAN INDEX SERIES RESEARCH REPORT – SEPTEMBER 2005
Sep-
2004
Oct-20
04
Nov-20
04
Dec-20
04
Jan-20
05
Feb-
2005
Mar-20
05
Apr-20
05
May-20
05
Jun-2
005
Jul-2
005
Aug-20
05
FTSE/ASEAN 40 Index FTSE/ASEAN Index FTSE Asia Pacific ex Japan Index
FTSE China Index FTSE India Index FTSE/Xinhua China 25 Index
0. 00
0. 05
0. 10
0. 15
0. 20
0. 25
0. 30
03-S
ep-2
001
03-D
ec-2
001
03-M
ar-20
02
03-Ju
n-20
02
03-S
ep-2
002
03-D
ec-2
002
03-M
ar-20
03
03-Ju
n-20
03
03-S
ep-2
003
03-D
ec-2
003
03-M
ar-20
04
03-Ju
n-20
04
03-S
ep-2
004
03-D
ec-2
004
03-M
ar-20
05
03-Ju
n-20
05
FTSE/ASEAN 40 Index FTSE/ASEAN Index FTSE Asia Pacific ex Japan Index
FTSE China Index FTSE India Index FTSE/Xinhua China 25 Index
0.05
0.10
0.15
0.20
0.25
0.30
0.35

3.3 Correlations• There is a very high degree of correlation between tradable FTSE/ASEAN 40 Index and benchmark FTSE/ASEAN Index, making the FTSE/ASEAN 40
Index a good proxy for the FTSE/ASEAN Index benchmark.
• The correlation between the FTSE Asia Pacific ex Japan Index and the FTSE/ASEAN Index benchmark is also high.
• Low correlations between the FTSE China and FTSE India indices and both the FTSE/ASEAN 40 Index and the FTSE/ASEAN Index imply that neither
index is a good proxy for either country. Investors will have to treat these as a separate asset class for exposure to emerging economies.
Five year correlationIndex FTSE/ASEAN FTSE/ASEAN FTSE Asia Pacific FTSE China FTSE India FTSE/Xinhua
40 Index Index ex Japan Index Index Index China 25 Index
FTSE/ASEAN 40 Index 1.000 0.976 0.696 0.361 0.354 0.477
FTSE/ASEAN Index 1.000 0.730 0.381 0.373 0.501
FTSE Asia Pacific ex Japan Index 1.000 0.498 0.430 0.656
FTSE China Index 1.000 0.274 0.862
FTSE India Index 1.000 0.312
FTSE/Xinhua China 25 Index 1.000
Source: FTSE Group
3.4 Tracking Error• Tracking error between the FTSE/ASEAN 40 Index and FTSE/ASEAN Index is below the 5% level generally considered acceptable, so the tradable
index is a good proxy for the benchmark index
• There are large tracking errors for both the tradable and benchmark indices against the broader FTSE Asia Pacific ex Japan Index. This is mainly
due to the different industry group exposures in these indices.
Tracking error
Index FTSE/ASEAN 40 Index FTSE/ASEAN Index FTSE Asia Pacific ex Japan Index
FTSE/ASEAN 40 Index 3.5 12.2
FTSE/ASEAN Index 3.5 11.1
FTSE Asia Pacific ex Japan Index 12.2 11.1
Source: FTSE Group
3.5 Risk Ratios
Risk Adjusted Return (Sharpe Ratio) and Information Ratio
Sharpe Ratio Information RatioIndex 5yrs 3 yrs 5 yrs 3 yrs
FTSE/ASEAN 40 Index 0.122 0.999 0.149 1.093
FTSE/ASEAN Index 0.219 1.179 0.264 1.305
FTSE Asia Pacific ex Japan Index 0.324 1.251 0.358 1.380
FTSE All-World China Index 0.923 1.155 0.966 1.239
FTSE All-World India Index 0.535 1.579 0.512 1.788
FTSE/Xinhua China 25 Index 0.378 1.084 0.328 1.149
Source: FTSE Group
PAGE 17FTSE/ASEAN INDEX SERIES RESEARCH REPORT – SEPTEMBER 2005

4. Industry Classification Benchmark (ICB)
4.1 Introduction to the Industry Classification Benchmark (ICB)Securities within both the FTSE/ASEAN 40 and FTSE/ASEAN indices have been classified using the Industry Classification Benchmark (ICB).
The ICB brings together two premier global providers of indices – Dow Jones Indexes and FTSE Group. It is a detailed and comprehensive structure
for sector and industry analysis, facilitating the comparison of companies across four levels of classification and national boundaries. The system
allocates companies to the Subsector whose definition most closely describes the nature of its business. The nature of a company’s business is
determined by its source of revenue or where it constitutes the majority of its revenue.
The ICB Universe Database contains over 45,000 securities from over 40,000 companies, from the Dow Jones Indexes and FTSE universes. The database
covers 67 countries and it is intended that the coverage be increased to 50,000 securities in 2005.
The classification structure consists of four layers:
• 10 Industries help investors monitor broad industry trends
• 18 Supersectors can be used for identifying macroeconomic opportunities for investment and trading decisions
• 39 Sectors provide a broad benchmark for investment managers
• 104 Subsectors allow for more detailed quantitative analysis
ICB has been adopted by stock exchanges representing over 65% of the world’s market capitalisation.
A comparison of weightings within the ICB Industry Groups is shown below for both the FTSE/ASEAN 40 and FTSE/ASEAN Indices. The Industry Group
Codes have been included for reference.
4.2 Industry Group Analysis• In both the FTSE/ASEAN 40 Index and FTSE/ASEAN Index the Financials (8000) is the largest Industry Group accounting for 36.8% in the tradable
index and 35.8% in the benchmark index market capitalisation.
• Industry Group breakdown shows the region’s dominance by Financials (8000), Industrials (2000), Telecommunications (6000) and Consumer
Services (5000) companies with a low representation in Technology (9000).
• Telecommunications (6000) is the second largest Industry group in the tradable index and Industrials (2000) has the second largest representation
in the benchmark index.
• The tradable index has no representation from the Basic Materials (1000), Health Care (4000) and Technology (9000) Industry Groups.
• Compared to the FTSE All-World Asia Pacific ex Japan Index, the ASEAN indices have a large underweight in Technology (9000) and Basic Materials
(1000) and a large overweight in Telecommunications (6000), Consumer Services (5000) and Financials (8000).
PAGE 18FTSE/ASEAN INDEX SERIES RESEARCH REPORT – SEPTEMBER 2005

4.2.2 Comparison of Industry Group weightings between the FTSE/ASEAN 40 and FTSE/ASEANIndices and AW Asia Pacific ex Japan Index
Industry Group Weightings (%)
Source: FTSE Group
4.2.2 Comparison of the Over/Underweight Industry Groups compared to the FTSE All-World AsiaPacific ex Japan Index
Over/Underweights vs AW Asia Pacific ex Japan Index
Source: FTSE Group
PAGE 19FTSE/ASEAN INDEX SERIES RESEARCH REPORT – SEPTEMBER 2005
Oil &Gas
Basic
Mater
ials
Indus
trials
Consu
merGoo
ds
Health
Care
Consu
merSe
rvice
s
Telec
ommun
icatio
ns
Utiliti
es
Finan
cials
Tech
nolog
y
FTSE/ASEAN 40 FTSE/ASEAN FTSE All-World ex Japan
0
5
10
15
20
25
30
35
40
Oil &Gas
Basic
Mater
ials
Indus
trials
Consu
merGoo
ds
Health
Care
Consu
merSe
rvice
s
Telec
ommun
icatio
ns
Utiliti
es
Finan
cials
Tech
nolog
y
FTSE/ASEAN 40 FTSE/ASEAN
-15
-10
-5
0
5
10
15

PAGE 20FTSE/ASEAN INDEX SERIES RESEARCH REPORT – SEPTEMBER 2005
4.2.3 ICB Industry Group Breakdown of the FTSE/ASEAN 40, FTSE/ASEAN and FTSE All-World Asia ExJapan Indices
ICB Industry Group Breakdown
FTSE/ASEAN 40 INDEX ASEAN INDEX FTSE ALL-WORLD ASIA EX JAPAN INDEXNo Full Investable No Full Investable No Full Investable
FTSE ICB Industry Group Mkt Cap Mkt Cap Wt Mkt Cap Mkt Cap Wt Mkt Cap Mkt Cap Wt(USDbn) (USDbn) (%) (USDbn) (USDbn) (%) (USDbn) (USDbn) (%)
1 Oil & Gas 2 24,299 8,054 6.4 4 25,826 8,458 4.2 24 304,891 85,827 4.7
1000 Basic Materials - - - - 11 11,432 5,007 2.5 82 284,520 193,964 10.6
2000 Industrials 8 39,282 17,774 14.2 33 61,087 28,890 14.4 175 395,110 248,546 13.6
3000 Consumer Goods 4 13,332 7,554 6.0 25 36,304 17,946 8.9 109 196,812 129,693 7.1
4000 Health Care - - - - 1 855 641 0.3 22 35,400 25,902 1.4
5000 Consumer Services 6 26,525 16,198 13.0 25 44,672 25,501 12.7 91 214,510 136,185 7.4
6000 Telecommunications 7 65,657 24,036 19.2 13 72,168 28,278 14.0 35 355,165 119,967 6.6
7000 Utilities 2 12,082 5,216 4.2 10 24,962 10,147 5.0 38 139,698 67,447 3.7
8000 Financials 11 76,520 46,185 36.9 50 123,111 72,260 35.9 191 815,909 581,695 31.8
9000 Technology - - - - 8 7,907 4,182 2.1 87 321,971 240,877 13.2
Grand Total 40 257,698 125,018 100.0 180 408,323 201,309 100.0 854 3,063,986 1,830,102 100.0
Source: FTSE Group

PAGE 21FTSE/ASEAN INDEX SERIES RESEARCH REPORT – SEPTEMBER 2005
5 Constituent Data
5.1 Top 10 Securities• The top 10 securities in the FTSE/ASEAN 40 Index account for approximately 54.16% of the tradable index. This compares with 34.67% for the
top 10 securities in the benchmark FTSE/ASEAN Index.
• Index weightings in both the indices are skewed towards the top four securities in each index showing the level of concentration in the large
stocks.
5.1.1 FTSE/ASEAN 40 Index
FTSE/ASEAN 40 Index Top 10 constituents (31 August 2005)
Rank Security Gross Market Cap Net Market Cap Weight in
(USDm) (USDm) FTSE/ASEAN 40 Index (%)
1 DBS Group Holdings 13,972 10,344 8.27
2 Singapore Telecom 25,346 10,138 8.11
3 United Overseas Bank 12,948 9,711 7.77
4 Overseas Chinese Banking 11,684 8,763 7.01
5 Malayan Banking 11,155 5,577 4.46
6 Telekomunikasi Indonesia 10,080 5,040 4.03
7 PTT 16,660 4,998 4.00
8 Tenaga Nasional 9,334 4,667 3.73
9 Singapore Airlines 8,578 4,289 3.43
10 Singapore Press Holdings 4,183 4,183 3.35
Total 123,760 67,711 54.16
Source: FTSE Group
5.1.2 FTSE/ASEAN Index
FTSE/ASEAN Index Top 10 constituents (31 August 2005)
Rank Security Gross Market Cap Net Market Cap Weight in
(USDm) (USDm) FTSE/ASEAN Index (%)
1 DBS Group Holdings 13,972 10,344 5.14
2 Singapore Telecom 25,346 10,138 5.04
3 United Overseas Bank 12,948 9,711 4.82
4 Overseas Chinese Banking 11,684 8,763 4.35
5 Public Bank 6,259 6,259 3.11
6 Malayan Banking 11,155 5,577 2.77
7 Telekomunikasi Indonesia 10,080 5,040 2.50
8 PTT 16,660 4,998 2.48
9 Tenaga Nasional 9,334 4,667 2.32
10 Singapore Airlines 8,578 4,289 2.13
Total 125,835 69,787 34.67
Source: FTSE Group

PAGE 22FTSE/ASEAN INDEX SERIES RESEARCH REPORT – SEPTEMBER 2005
5.2 FTSE/ASEAN Index 40 Constituents
FTSE/ASEAN 40 Index Constituents and Weightings (31 August 2005)
Rank Sedol Local Security Country ICB Industry Gross Mkt Cap Net Mkt Cap Weight in Code Group (USDm) (USDm) FTSE/ASEAN
40 Index (%)
1 6175203 D05 DBS Group Holdings Singapore 8000 13,792 10,344 8.3%
2 B02PY22 T48 Singapore Telecom Singapore 6000 25,346 10,138 8.1%
3 6916781 U11 United Overseas Bank Singapore 8000 12,948 9,711 7.8%
4 B0F9V20 O39 Overseas Chinese Banking Singapore 8000 11,684 8,763 7.0%
5 6556325 1155 Malayan Banking Malaysia 8000 11,155 5,577 4.5%
6 B02ZK79 TLKM Telekomunikasi Indonesia Indonesia 6000 10,080 5,040 4.0%
7 6420389 PTT PTT Thailand 1 16,660 4,998 4.0%
8 6904612 5347 Tenaga Nasional Malaysia 7000 9,334 4,667 3.7%
9 6811734 S55 Singapore Airlines Singapore 5000 8,578 4,289 3.4%
10 B012899 T39 Singapore Press Holdings Singapore 5000 4,183 4,183 3.3%
11 6490263 K02 Keppel Corp Singapore 2000 5,384 4,038 3.2%
12 6558031 3816F Malaysian Intl Shipping Malaysia 2000 8,777 3,511 2.8%
13 6197928 C09 City Developments Singapore 5000 4,425 3,319 2.7%
14 6290344 PTTEP PTT Exploration & Production Thailand 1 7,640 3,056 2.4%
15 6291712 ASII Astra International Indonesia 3000 3,960 2,970 2.4%
16 6808769 4197 Sime Darby Malaysia 2000 3,832 2,874 2.3%
17 6868398 4863 Telekom Malaysia Malaysia 6000 9,312 2,794 2.2%
18 6077019 BBLF Bangkok Bank (F) Thailand 8000 5,129 2,513 2.0%
19 6464514 1961 IOI Malaysia 3000 3,347 2,510 2.0%
20 6309303 C31 Capitaland Singapore 8000 4,571 2,285 1.8%
21 6043214 S63 Singapore Technologies Engineering Singapore 2000 4,445 2,222 1.8%
22 6412568 ADVANC Advanced Info Serv Thailand 6000 7,177 2,153 1.7%
23 B01C1P6 BBCA Bank Central Asia Indonesia 8000 4,076 2,038 1.6%
24 6530523 5051 Maxis Communications Malaysia 6000 6,240 1,872 1.5%
25 6366676 3182 Genting Malaysia 5000 3,567 1,819 1.5%
26 6888794 KBANKF Kasikornbank (F) Thailand 8000 3,588 1,758 1.4%
27 6609906 SCCF Siam Cement (F) Thailand 2000 6,973 1,743 1.4%
28 6709099 BBRI Bank Rakyat Indonesia Indonesia 8000 2,941 1,471 1.2%
29 6752349 4162 British American Tobacco (Malaysia) Malaysia 3000 2,895 1,448 1.2%
30 B08X163 U96 Sembcorp Industries Limited Singapore 2000 2,854 1,427 1.1%
31 6698120 5076 Astro All Asia Networks Malaysia 5000 2,791 1,395 1.1%
32 6075745 1023 Commerce Asset Holdings Malaysia 8000 3,976 1,193 1.0%
33 6731962 4715 Resorts World Malaysia 5000 2,981 1,193 1.0%
34 6628859 N03 Neptune Orient Lines Singapore 2000 2,777 1,111 0.9%
35 B00FYK2 ISAT Indosat Indonesia 6000 2,695 1,078 0.9%
36 6685661 TEL Phil Long Dist Tel Philippines 6000 4,808 962 0.8%
37 6531775 5052 Plus Expressways Malaysia 2000 4,242 848 0.7%
38 6687184 UNVR Unilever Indonesia Indonesia 3000 3,130 626 0.5%
39 B01GQS6 6742 YTL Power International Malaysia 7000 2,749 550 0.4%
40 6651048 BMRI Bank Mandiri Indonesia 8000 2,660 532 0.4%
Source: FTSE Group

PAGE 23FTSE/ASEAN INDEX SERIES RESEARCH REPORT – SEPTEMBER 2005
6. Using the FTSE/ASEAN IndicesThe FTSE/ASEAN Indices data and licences can support you whatever your investment requirement is. The products can be used for analysis,
benchmarking, trading and product creation.
6.1 Index ValuesReal-time index values for the tradable FTSE ASEAN 40 Index and end of day values for the benchmark FTSE/ASEAN Index are available on the
following codes:
Vendor codesIndex FTSE Reuters Bloomberg Thomson One Global Topic
FTSE/ASEAN 40 ASEAN40 <.FTASEAN40> =ASEAN40 ASEAN40 - LN =ASEAN40.ft
FTSE/ASEAN AWASEAN AWASEAN - LN =AWASEAN.ft
Source: FTSE
6.2 Exchange Traded Funds (ETF)Exchange Traded Funds are expected to be available, subject to regulatory approval, in the near future.
6.3 Index Linked Funds and OTC ProductsThe FTSE/ASEAN 40 Index can be used to run a wide range of funds and structured products based on linked to the indices. These include tracker
funds, warrants, certificates and futures & options. Announcements will be made as these products become available.
6.4 Data ProductsFor detailed analysis, end of day products are available for each of the indices.
• Index Valuation Service – Index level data on a daily basis
• Constituent Service – Constituents data on a daily or monthly basis
• Tracker Service – Highlights changes to the index and company constituents and weightings on a daily basis.

PAGE 24FTSE/ASEAN INDEX SERIES RESEARCH REPORT – SEPTEMBER 2005
© FTSE International Limited ("FTSE") 2005. All rights reserved. The FTSE/ASEAN indices are calculated by FTSE in conjunction with PT Bursa Efek Jakarta (Jakarta Stock Exchange), Bursa MalaysiaBerhad, The Philippine Stock Exchange, Inc., Singapore Exchange and The Stock Exchange of Thailand (the "Exchanges”). All rights in the FTSE/ASEAN indices vest in FTSE and the Exchanges. “FTSE®”is a trademark of the London Stock Exchange Plc and The Financial Times Limited and is used by FTSE under licence. Neither FTSE nor the Exchanges nor their licensors shall be liable (including innegligence) for any loss arising out of use of the FTSE/ASEAN indices by any person. Distribution of FTSE/ASEAN indices index values and the use of FTSE/ASEAN indices to create financial productsrequires a licence from FTSE.