cfo signalstm what north america’s top finance · means of this publication, rendering...
TRANSCRIPT

CFO SignalsTM
What North America’s top finance executives are thinking – and doing
4th Quarter 2012
High-Level Summary

CFO Signals
2 CFO Signals
About the CFO Signals surveyEach quarter, CFO Signals tracks the thinking and actions of CFOs representing many of North America’s largest and most influential companies. This report summarizes CFOs’ opinions in five areas: economy, industry, company, finance organization, and career.
This is the fourth quarter report for 2012. For more information, pleasesee the methodology section at the end of this document or contact [email protected].
Who participated this quarter?
Eighty-six CFOs responded this quarter. Three fourths of the CFOs are from public companies, and 77% are from companies with more than $1B in annual revenue.
IMPORTANT NOTES ABOUT THIS SURVEY REPORT:
All participating CFOs have agreed to have their responses aggregated and presented.
Please note that this is a “pulse survey” intended to provide CFOs with quarterly information regarding their CFO peers’ thinking across a variety of topics. It is not, nor is it intended to be, scientific in any way, including in its number of respondents, selection of respondents, or response rate, especially within individual industries. Accordingly, this report summarizes findings for the surveyed population but does not necessarily indicate economy- or industry-wide perceptions or trends. Except where noted, we do not comment on findings for segments with fewer than 5 respondents. Please see the Appendix for more information about survey methodology.
This publication contains general information only, and Deloitte is not, by means of this publication, rendering accounting, business, financial, investment, tax, legal, or other professional advice or services. This publication is not a substitute for such professional advice or services, nor should it be used as a basis for any decision or action that may affect your business. Before making any decisions that may impact your business, you should consult a qualified professional advisor.
U.S. 72.9%
Canada 20.0%
Mexico 7.1%
Participation by Country
2118
10 96 6 6 5 5
0
5
10
15
20
25
Participation by Industry
Findings at a glance 3Summary 4Growth expectations 6Operating expectations 7High-impact risks 8Economy highlights 9Industry highlights 15Company highlights 17Finance organization highlights 22CFO Career highlights 24About the survey 27
Additional findings available in full report (please contact [email protected] for full report)
Detailed findings (by industry)Industry-by-industry summariesCountry-by-country summaries

Findings at a Glance
3 CFO Signals*All numbers with an asterisk are averages that have been adjusted to eliminate the effects of stark outliers.
Risk
What high-impact risk worries you the most? The immediacy of the “fiscal cliff” has pushed it ahead of general economic and European crisis concerns. Europe and broader economic challenges remain top worries, however, and CFOs also cite strong concerns about Washington gridlock. Page 8.
Economy and Government
What are companies’ top economy-level challenges? Social policy remains the top concern for U.S. CFOs, and the “fiscal cliff” has elevated the focus on tax policy. Canadian CFOs indicate a rising focus on social and environmental policy. In Mexico, accounting/reporting policy, social policy, and currency exchange rates remain strong concerns. Page 9-10.
What do CFOs believe lawmakers will do about taxes and spending cuts at year end? Only about 20% of CFOs expect to go “over the cliff” on spending cuts, and about 60% expect tax rates to go up for couples earning over $250,000. Page 11.
In which policy/legislative area would better clarity most improve companies’ planning efforts? Fiscal policy is the clear priority, receiving twice as many votes as any other policy area. Tax and regulatory policy are next on the list. Page 12.
With which political party do CFOs most identify? Republican affiliation is claimed by nearly two thirds of North American CFOs and by three fourths of U.S. CFOs. Only about 20%, however, place themselves at the poles of the political spectrum. Page 13.
For which European economic scenarios have companies developed specific plans, and which scenario do they consider most likely? Nearly 60% of CFOs expect the status quo to continue for the foreseeable future, and few say their companies have done much to prepare for other scenarios. Page 14.
Industry
What are your company’s top industry-level challenges? Challenges vary markedly by industry, but government regulation is the dominant concern overall. Sluggish economies are causing market contraction, which is creating overcapacity and pricing challenges. Page 15.
Which information technology trends will most reshape business in the next five years? Mobility, social business, and customer data are the top three, but there are strong differences across industries. Most technologies are getting significant attention. Page 16.
Company
What are companies’ top company-specific challenges, and what is their business focus for the next 12 months? Preserving revenue in existing markets is again the dominant focus, followed by framing and adapting strategy. Companies remain focused on squeezing whatever they can out of their indirect costs, and plentiful cash seems to be relegating financing, liquidity, and working capital to relatively minor importance. Page 17.
How do companies expect performance, spending, and hiring to change over the next 12 months? Year-over-year growth expectations for sales and earnings have rebounded somewhat from their survey lows last quarter, rising to 5.6%* and 10.9%*, respectively. Domestic hiring growth projections rebounded to a meager 1.0%*, and capital investment growth fell to 4.2%* (a new survey low). Page 18-20.
How does your optimism regarding your company compare to last quarter? In the U.S., net optimism (the difference between the percent of CFOs expressing rising and falling optimism) fell from zero two quarters ago and -16 last quarter to -21 this quarter. In Canada, it fell from the +40s over the past two quarters to -6 this quarter. Two thirds of Mexican CFOs, however, report rising optimism. Page 21.
Finance Organization
What are finance organizations’ top challenges? Finance is again heavily focused on influencing and enabling business decisions, with a rising focus on financial reporting/controls and a declining focus on supporting M&A and business expansion. Page 22.
Which capabilities would CFOs most like to improve within their finance organization? CFOs appear mostly satisfied with their capabilities in core areas like corporate finance, treasury, and audit. They mostly seek improvements in competencies that support finance’s facilitative roles – strategic planning, IT/information management, and budgeting and financial planning. Page 23.
Career
What are CFOs’ top job stresses? Major change initiatives and changing regulatory requirements have both been top stresses over the past two years and remain so this quarter. Strategic ambiguity is back near the top after declining in the first half of the year, and pressure from poor company performance remains a top stress. Page 24.
How do CFOs want to be regarded by their CEOs, executive peers, and staff? CFOs want to be recognized mostly for their mindset and traits, although competency and role factor in as well. The specific descriptors they mention vary markedly by constituency. Page 25.

-25%
0%
25%
50%
75%
100% More optimistic
No change
Less optimistic
Net optimism (% moreoptimistic minus % lessoptimistic)
Last quarter, it was quite apparent that the combination of sluggish economic growth, persistent European Union issues, approaching elections in the United States, and the impending “fiscal cliff” were making CFOs very nervous. Even though corporate performance was largely positive and equities markets were doing well, last quarter’s survey results indicated the sharpest decline in expectations in the two-and-a-half-year history of the survey.
One major source of uncertainty is now resolved. The U.S. elections are over, and not much seems to have changed. The president is still a Democrat, the House is still Republican-led, and the Senate still has a Democratic majority. In the aftermath, the fiscal cliff parties have been working the inside and outside game of negotiations, but largely holding to the same positions they held before. Little wonder that CFOs’ outlook does not appear to have changed much either.
In fact, lingering uncertainty has pushed CFOs’ investment expectations even lower – with new lows for growth in capital spending, R&D, and marketing investments. CFOs are cautious on domestic hiring, too, and more of them are projecting cuts than at any time in the last two years. It is important to note that these expectations are largely premised on notgoing over the fiscal cliff and conditions not getting worse in Europe –since most CFOs also said they don’t expect either to be a factor in the near term.
No cliff plunge, but still dangerOnly about one in five CFOs expects Washington to go “over the cliff” at the end of the year. Instead, they mostly expect modification or delay of the scheduled spending cuts, and they also expect the Democrats to prevail on taxes, with rates going up for couples earning over $250,000.
But that doesn’t mean CFOs aren’t worried about the impacts of the fiscal cliff solution on an already-stumbling global economy. In fact, the potential detrimental impacts of the fiscal cliff became CFOs’ “most worrisome risk” this quarter, surpassing global economic stagnation and the European crisis – both of which were stronger concerns last quarter. And they name fiscal policy as their top priority area for better policy clarity going forward (corporate tax policy is a distant second).
4 CFO Signals
Own-Company OptimismCFO optimism relative to previous quarter
Those worries are being particularly felt in the U.S. and Canada where CFOs’ sentiment has declined – not so much because pessimism has risen, but rather because fewer CFOs are becoming more optimistic. In the U.S., net optimism+ (the difference between the percent of CFOs expressing rising and falling optimism) fell from zero two quarters ago and -16 points last quarter to -21 this quarter. And in Canada, it fell from the 40s over the past two quarters to -6 this quarter.
It is difficult to determine exactly what factors are driving CFOs’ sentiment, but political party affiliation might be a contributor. To the extent there is a stereotype that business leaders are mostly Republicans, there is not much of a surprise in this quarter’s survey results: about two thirds of North American CFOs said they are Republicans, as did three quarters of U.S. CFOs. Interesting to note, however, is that only about 20% placed themselves at the liberal and conservative poles of the spectrum.
Complacency around the European crisis? Despite all the focus on the fiscal cliff, the European crisis has not disappeared from CFOs’ radar screens and still ranks in the top three of their “most worrisome risks.” But there appears to be an expectation that the status quo will continue for the foreseeable future, and there doesn’t appear to be much preparation for other scenarios.
Still, there seems to be considerable room for debate about how long the status quo can actually extend. As Carl Steidtmann, Chief Economist of Deloitte Research, puts it:
* All numbers with an asterisk are averages that have been adjusted to eliminate the effects of stark outliers.+ Note that net optimism, as calculated, does not explicitly account for the level of “no change” responses.
SummaryLess uncertainty, but not much more clarity

5 CFO Signals
*All numbers with an asterisk are averages that have been adjusted to eliminate the effects of stark outliers.
“Maintaining the status quo in Europe is going to become politically and economically more challenging as time goes by. For the southern European countries, it requires unending austerity with little prospect for growth. For the Northern European countries, it requires a steady stream of support payments going to their southern partners. Neither requirement is politically popular or economically sustainable over the long run. Something has got to give.”
Results from our 3Q12 European CFO surveys similarly suggested the status quo may not hold for much longer: About one quarter of U.K. CFOs expected at least one country to exit the Euro in the next 12 months, and nearly half of German CFOs expected an exit within five years.
Dour expectations for investment and hiring The good news is that CFOs’ sales and earnings expectations have rebounded from their record lows last quarter. Sales are expected to rise 5.6%* overall, above last quarter’s survey-low 4.8%*. Earnings are expected to rise 10.9%* overall, above last quarter’s survey-low 8.0%*.
The bad news is that fiscal cliff uncertainty and/or skepticism appears to be depressing planned investments. Capital spending is expected to rise just 4.2%*, below last quarter’s survey-low 4.6%*. Similarly, R&D investment hit its lowest expected growth rate on record.
Perhaps most worrisome, employment expectations have remained dismal. Domestic hiring is expected to rise just 1.0%* overall. This is a bit better than the survey-low 0.6%* from last quarter, but 28% of CFOs are now expecting cuts – a new survey high.
Technology reshaping business – and financeEconomic and governmental trends aren’t the only factors driving the future of business; technology advances are having a strong impact as well. We asked CFOs specifically about the information technology trends they expect to most reshape their businesses moving forward, and mobility, social business, and customer data bubbled to the top. But almost all of the major trends showed a major impact on at least some businesses and industries.
The rising importance of information technology is clearly being felt by finance. Previous surveys have shown that finance is taking on more responsibility for information and related technologies, and also that about half of CFOs are not satisfied with either the quality of the information they have or with their IT systems’ flexibility. The result is that, almost every quarter, CFOs mention IT initiatives as one of their top career stresses.
All of this helps explain why, when we asked CFOs this quarter about their top priorities for capability improvement, they listed IT/information management second – just after strategic planning, and just ahead of budgeting and financial planning.
CFOs’ personal branding As CFOs of large companies play broader and more visible roles, they are inevitably redefining their personal brand with their CEOs, their executive peers, and their finance staff – deliberately or not.
So what do CFOs want their brand to be? Do they define their brand by their roles, their mindset, their competency, or their impact? The answers seem to vary by constituency.
When we asked CFOs what adjectives they wanted their CEOs to use to describe them, the descriptors focused mostly on mindset (being a “strategic” and “business-savvy” thinker), but also on role (being a “leader” and a “change agent”) and on traits (being “reliable,” “responsible,” and “loyal”).
When it comes to their executive peers, their descriptors focused very heavily on mindset (being a “team player,” “collaborator,” and “problem solver”); but also on traits (being “reliable” and “trustworthy”) and technical competency (“being “competent” and “authoritative”).
As for their finance staff, desired descriptors focused heavily on the indirect, influential aspects of leadership (being an “agenda-setter” and “standard-setter”), but also on the direct, personal aspects (being a “mentor,” “motivator,” and “coach”).
Clearly, CFOs need and want to be a many things to a broad range of people. This almost certainly requires CFOs to work outside their natural comfort zones and to develop formidable skills, versatility, and maturity as they rise through their careers. This explains why top CFOs are in such short supply, and also why succession planning is so important.
Summary (cont.)

Growth TrendsCFOs’ expected year-over-year increases in growth metrics
6 CFO Signals
Vertical lines indicate range for responses between 5th and 95th percentile.Horizontal marks ( – ) indicate outlier-adjusted means.
17.3% 19.5%12.0% 12.6% 14.0%
9.3% 10.1% 12.8% 10.5% 8.0% 10.8%
-20%
0%
20%
40%
60%
80%
100%
2Q10 3Q10 4Q10 1Q11 2Q11 3Q11 4Q11 1Q12 2Q12 3Q12 4Q12
12.4%8.3% 8.7% 11.8% 10.7% 7.9% 9.6% 12.0% 11.4%
4.6% 4.2%
-40%
-20%
0%
20%
40%
60%
80%
100%
2Q10 3Q10 4Q10 1Q11 2Q11 3Q11 4Q11 1Q12 2Q12 3Q12 4Q12
3.1% 2.0% 1.8% 1.8% 2.0% 1.2% 1.0% 2.1% 2.1%0.6% 1.0%
-15%
-10%
-5%
0%
5%
10%
15%
20%
25%
2Q10 3Q10 4Q10 1Q11 2Q11 3Q11 4Q11 1Q12 2Q12 3Q12 4Q12
Sales Growth Earnings Growth
Capital Spending Growth Domestic Employment Growth
9.3% 10.9%
6.5% 8.2% 7.1% 6.8% 6.3% 5.9% 6.6%4.8% 5.6%
-10%
0%
10%
20%
30%
40%
50%
2Q10 3Q10 4Q10 1Q11 2Q11 3Q11 4Q11 1Q12 2Q12 3Q12 4Q12

Operating TrendsExpected operating results
7 CFO Signals
CFOs’ Year-Over-Year Expectations(Mean growth rate*, median growth rate, and percent of CFOs who expect gains)
2Q10 3Q10 4Q10 1Q11 2Q11 3Q11 4Q11 1Q12 2Q12 3Q12 4Q12Sales 9.3% 10.9% 6.5% 8.2% 7.1% 6.8% 6.3% 5.9% 6.6% 4.8% 5.6%
6.0% 10.0% 5.0% 5.0% 5.5% 5.0% 5.0% 5.0% 5.0% 5.0% 5.0%84% 93% 81% 89% 80% 83% 87% 79% 85% 82% 83%
Earnings 17.3% 19.5% 12.0% 12.6% 14.0% 9.3% 10.1% 12.8% 10.5% 8.0% 10.9%6.0% 10.0% 8.0% 10.0% 10.0% 8.0% 9.0% 9.5% 8.5% 6.0% 7.0%89% 93% 80% 83% 83% 82% 84% 79% 81% 84% 76%
Wages/salaries 3.1% 3.3% 3.2% 3.1% 3.3% 3.2% 2.9% 3.2% 3.0% 3.2% 3.2%3.0% 3.0% 3.0% 3.0% 3.0% 3.0% 3.0% 3.0% 3.0% 3.0% 3.0%
94% 93% 95% 96% 95% 94% 94% 94% 90% 94% 94%
Employee benefits 4.1% 4.7% 5.3% 4.5% 4.7% 4.3% 4.3% 4.3% 4.5% 4.3% 4.3%4.0% 4.0% 4.0% 4.0% 5.0% 4.0% 4.0% 4.0% 4.0% 4.0% 4.0%
85% 90% 89% 87% 90% 93% 87% 89% 93% 89% 90%
Non-labor input costs / commodities 2.9% 2.2% 2.6% 3.4% 5.0% 4.2% 3.5% 2.7% 2.9% 2.5% 2.4%2.5% 2.0% 2.0% 3.0% 4.0% 3.0% 3.0% 3.0% 3.0% 2.0% 2.0%
73% 68% 75% 84% 93% 89% 78% 78% 84% 79% 77%
Dividends 6.5% 8.6% 4.1% 4.4% 3.7% 3.5% 2.4% 2.2% 3.9% 2.5% 2.5%0.0% 0.0% 0.0% 0.0% 0.0% 0.0% 0.0% 0.0% 0.0% 0.0% 0.0%
38% 39% 28% 36% 35% 41% 27% 31% 33% 30% 29%
Capital spending 12.4% 8.3% 8.7% 11.8% 10.7% 7.9% 9.6% 12.0% 11.4% 4.6% 4.2%5.0% 5.0% 4.0% 5.0% 10.0% 5.0% 5.0% 6.0% 10.0% 3.0% 0.0%62% 58% 57% 61% 69% 59% 61% 68% 70% 53% 43%
R&D spending 4.1% 5.9% 3.5% 3.9% 5.4% 3.5% 2.9% 3.1% 2.7%0.0% 1.0% 0.0% 0.0% 2.0% 0.0% 0.0% 0.0% 0.0%
54% 51% 43% 47% 53% 38% 40% 40% 37%
Marketing and advertising 4.6% 4.4% 3.9% 4.6% 3.9% 3.5% 2.0%5.0% 2.0% 4.5% 3.0% 2.5% 1.0% 0.0%
59% 53% 60% 56% 56% 53% 43%
Number of domestic personnel 3.1% 2.0% 1.8% 1.8% 2.0% 1.2% 1.0% 2.1% 2.1% 0.6% 1.0%0.5% 2.0% 1.0% 1.0% 2.0% 1.0% 1.0% 1.0% 1.0% 0.0% 0.0%50% 60% 48% 61% 64% 52% 51% 51% 52% 40% 40%
Number of offshore personnel 3.5% 2.8% 3.6% 3.7% 4.1% 2.9% 4.8% 3.7% 3.8% 1.5% 0.5%0.0% 0.0% 0.0% 0.0% 2.0% 0.0% 0.5% 0.0% 0.0% 0.0% 0.0%
41% 49% 47% 41% 57% 37% 50% 43% 41% 30% 32%
Use of offshore/outsourced third parties 2.9% 1.4% 2.8% 2.2% 2.2% 3.1% 3.7% 2.5% 3.6% 1.6% 2.3%0.0% 0.0% 0.0% 0.0% 0.0% 0.0% 0.0% 0.0% 0.0% 0.0% 0.0%
35% 37% 32% 41% 31% 36% 49% 26% 30% 28% 28%
Empl
oym
ent
Ope
ratin
g Re
sults
Cost
sIn
vest
men
t
*All means been adjusted to eliminate the effects of stark outliers.

High-Impact RisksAll eyes on Washington
What risks worry CFOs the most?Of all the factors that compete for CFOs’ attention, which are most likely to cause loss of sleep?
With the U.S. elections behind us, the “fiscal cliff’s” possible detrimental effects on an already-stumbling global economy are the top concern:• Economy-level concerns continue to dominate CFOs’ worries. • The immediacy of the “fiscal cliff” has pushed its importance ahead
of more general economic and European-crisis concerns.• About 60% of CFOs said their companies were not taking any
action in response to the “fiscal cliff” in our 3Q12 survey, but some were starting to delay investment and hiring.
• Overall, there are still strong and growing worries about Europe and the stagnation/recession of economies worldwide.
• There is strong concern about gridlock in Washington and the inability of political parties to compromise.
• Healthcare/Pharma is watching the revenue side of healthcare reform, while Retail/Wholesale is focused on the cost side.
8 CFO Signals

Economy and GovernmentFiscal cliff pushes social and tax policy to the forefront
Top economy-level challengesWith the U.S. elections over, how have CFOs’ concerns about the economy changed?
United States:
Social policy is still a major concern, but the immediacy of the “fiscal cliff” has added to the focus on tax policy:• Corporate and individual tax policy concerns both rose notably.• Unemployment concerns declined for the third straight quarter.• International trade policy concerns escalated.• Write-ins focus on issues of demand growth.
9 CFO Signals
Economy Challenges – U.S.Percent of respondents who place each option in their top three
Please see Appendix for industry-specific findings.
0% 10% 20% 30% 40% 50% 60%
Military/defense policy
Accounting/reporting/controls policy
International-trade policy
Inflation
Capital cost/availability
Other
Personal income tax policy
Intellectual-property policy
Currency exchange rates
Environmental policy (regulation, carbonreporting/tax, etc.)
Unemployment
Corporate-tax policy
Social policy/spending/investment(healthcare, education, infrastructure, etc.)
1Q12
2Q12
3Q12
4Q12

Economy and Government
Top economy-level challenges (cont.)
Canada:
CFOs indicate a rising focus on social and environmental policy as well as capital cost/availability:• Social policy concerns rebounded strongly after two down quarters.• Environmental policy concerns are again high, but not as high as a
few quarters ago.• Unemployment and corporate tax policy concerns have risen
markedly over the last year.• Currency exchange rate concerns have fallen after two very high
quarters.
Mexico:
Accounting/reporting policy, social policy, and currency exchange rates remain strong concerns, and new concerns have arisen(please note the very small sample size):• Accounting/reporting/controls policy is a consistent concern – much
more in Mexico than in other regions.• Social policy concerns rebounded strongly after a down quarter.• Environmental policy and currency exchange rates are persistent
concerns.• Unemployment concerns are relatively minor – and are much lower
than in the U.S. and Canada.
Industry:
• Retail/wholesale is still very concerned about unemployment; Financial Services is similar but not as high.
• Energy/Resources is still highly focused on environmental policy.• Healthcare/Pharma is highly focused on social policy (i.e. healthcare
policy), and so is Services.• All Telecom/Media/Entertainment (T/M/E) CFOs named intellectual
property policy a top challenge.
10 CFO Signals
Economy Challenges – CanadaPercent of respondents who place each option in their top three
Please see Appendix for industry-specific findings.
Economy Challenges – MexicoPercent of respondents who place each option in their top three
0% 10% 20% 30% 40% 50% 60% 70% 80%
Military/defense policy
Personal income tax policy
Intellectual-property policy
International-trade policy
Other
Inflation
Currency exchange rates
Accounting/reporting/controls policy
Corporate-tax policy
Unemployment
Capital cost/availability
Environmental policy (regulation, carbonreporting/tax, etc.)
Social policy/spending/investment(healthcare, education, infrastructure, etc.)
1Q122Q123Q124Q12
0% 10% 20% 30% 40% 50% 60% 70% 80%
Military/defense policy
International trade policy
Other
Capital cost/availability
Corporate tax policy
Personal income tax policy
Unemployment
Inflation
Currency exchange rates
Environmental policy (regulation, carbonreporting/tax, etc.)
Social policy/spending/investment(healthcare, education, infrastructure, etc.)
Intellectual-property policy
Accounting/reporting/controls policy
1Q122Q123Q124Q12

11 CFO Signals
Spending CutsPercent of CFOs expecting each action
from lawmakers before year end
0% 10% 20% 30% 40% 50% 60% 70%
Extend the current law tax rates for everyone
Extend the current law tax rates only for joint filersbelow $250k in AGI
0% 10% 20% 30% 40% 50% 60% 70%
Take no action on defense and non-defensespending cuts scheduled for 2013
Modify or delay scheduled spending cuts
0% 10% 20% 30% 40% 50% 60% 70%
Address debt ceiling
Wait for debt ceiling to be reached
Tax RatesPercent of CFOs expecting each action
from lawmakers before year end
Debt CeilingPercent of CFOs expecting each action
from lawmakers before year end
Expectations for the “fiscal cliff”As lawmakers work feverishly to negotiate a fiscal cliff solution, what do CFOs believe will be accomplished by year-end?
CFOs expect to avoid going “over the cliff,” and also for Democrats to win out on tax rates:• Only about 20% expect to go “over the cliff” on spending cuts
(7% expect no action at all; 15% expect action on taxes or the debt ceiling, but not on spending cuts).
• CFOs consider it very unlikely that current tax rates will be extended for joint filers over $250,000 in adjusted gross income (AGI).
• Expectations for the debt ceiling appear much less defined than for spending cuts or taxes rates.
Economy and Government
Please see Appendix for industry-specific findings.

12 CFO Signals
Please see Appendix for industry-specific findings.
0% 10% 20% 30% 40%
Monetary/rate policy
Individual tax policy
Health care policy
None of these policy areas is a majorfactor in our planning
Regulatory policy
Corporate tax policy
Fiscal/spending policy
Priorities for Policy ClarityPercent of participants citing each
response
Economy and Government
Government policy clarityNow that the U.S. elections are over, which policy area should be lawmakers’ first priority for providing better clarity?
Fiscal policy is the clear priority, but better tax and regulatory policy clarity would be next on CFOs’ agenda:• Fiscal policy received twice as many votes as any other single policy
area, receiving more than half the votes in the Manufacturing, Retail/Wholesale, and T/M/E sectors.
• Corporate tax policy’s importance is driven primarily by the Energy/Resources sector.
• Regulatory policy clarity is mostly a priority for the Energy/Resources, Financial Services, and Healthcare/Pharma sectors.
• Health care policy is the top priority for half of Healthcare/Pharma companies and one third of Services firms.

CFOs’ political leaningsBusiness leaders are often assumed to be Republicans. To what degree is this perception valid for CFOs?
Large company CFOs are mostly Republicans; Democrats are few and far between – especially “liberal Democrats”:• Just 7% of North American CFOs and 2% of U.S. CFOs say they are
liberal Democrats.• Republican affiliation is claimed by 65% of North American CFOs
and by 75% of U.S. CFOs.• Conservative Republicans are outnumbered by moderate
Republicans, but they are still roughly as common as moderate Democrats.
• Most Democrats (and liberal Democrats) are within the Healthcare/Pharma, Technology, and Financial Services sectors; Manufacturing reports the highest percentage of conservative Republicans and almost no Democrats
• Overall, about 80% of CFOs consider themselves “moderates” or “independents” – and only about 20% are at the poles of the political spectrum.
13 CFO Signals
0% 25% 50% 75% 100%Liberal Dems Moderate Dems Independent/Other Moderate Reps Conservative Reps
CFOs’ Political AffiliationPercent of respondents who claimed each classification
North America
U.S. Only
Economy and Government
Please see Appendix for industry-specific findings.

Preparation for European scenariosCFOs have been monitoring the European crisis for more than a year. What do they think is actually going to happen, and how are they preparing?
CFOs overwhelmingly expect the status quo to continue for the foreseeable future, and they have not done much to prepare for other scenarios: • Nearly 60% of CFOs expect the status quo to continue.• There is very little belief that Germany’s departure from the Euro or
the total collapse of the Euro is the most likely scenario.• About 60% of CFOs have no plans for addressing changes in the
European situation – either because they have planned only for the status quo, or because they have no specific plans for any particular scenario.
• It is not clear how tenable the status quo is; as Carl Steidtmann, Chief Economist of Deloitte Research, puts it:
“Maintaining the status quo in Europe is going to become politically and economically more challenging as time goes by. For the southern European countries, it requires unending austerity with little prospect for growth. For the Northern European countries, it requires a steady stream of support payments going to their southern partners. Neither requirement is politically popular or economically sustainable over the long run. Something has got to give.”
14 CFO Signals
Euro Crisis Plans and ExpectationsFor each presented scenario, percent of CFOs citing specific
company plans and assigning highest-likelihood
Have specific plans
Most likely
scenario
Political union (i.e., central treasury, unified banking system, wealth transfer system, politically empowered E.U.)
12% 2%
Greece and/or other Club Med countries exit union 13% 14%
Germany exits union (possibly accompanied by Austria, Finland, and the Netherlands)
2% 0%
Euro collapses (i.e., general return to historical currencies)
12% 1%
Status quo continues (i.e., E.U. continues to negotiate/finance bailouts across members)
33% 57%
No specific plans 29% N/A
Don't know N/A 26%
Please see Appendix for industry-specific findings.
Economy and Government
IndustryStagnation and contraction taking a toll
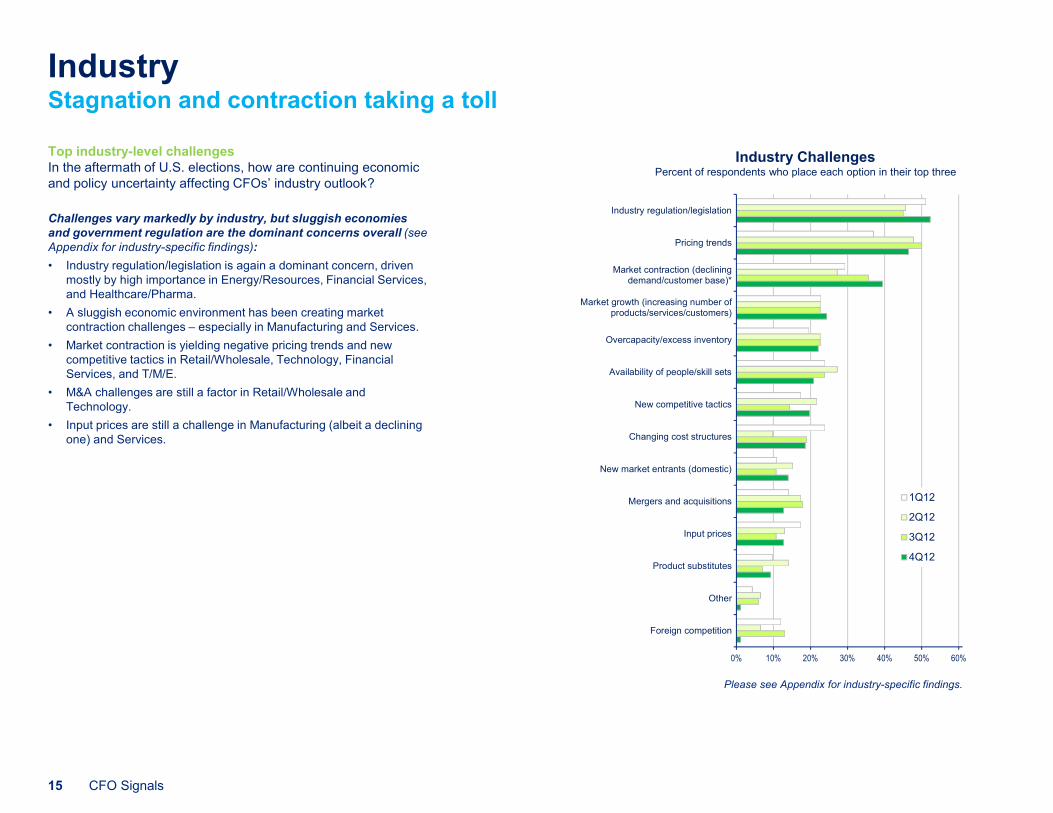
Top industry-level challengesIn the aftermath of U.S. elections, how are continuing economic and policy uncertainty affecting CFOs’ industry outlook?
Challenges vary markedly by industry, but sluggish economies and government regulation are the dominant concerns overall (see Appendix for industry-specific findings):• Industry regulation/legislation is again a dominant concern, driven
mostly by high importance in Energy/Resources, Financial Services, and Healthcare/Pharma.
• A sluggish economic environment has been creating market contraction challenges – especially in Manufacturing and Services.
• Market contraction is yielding negative pricing trends and new competitive tactics in Retail/Wholesale, Technology, Financial Services, and T/M/E.
• M&A challenges are still a factor in Retail/Wholesale and Technology.
• Input prices are still a challenge in Manufacturing (albeit a declining one) and Services.
15 CFO Signals
Please see Appendix for industry-specific findings.
Industry ChallengesPercent of respondents who place each option in their top three
0% 10% 20% 30% 40% 50% 60%
Foreign competition
Other
Product substitutes
Input prices
Mergers and acquisitions
New market entrants (domestic)
Changing cost structures
New competitive tactics
Availability of people/skill sets
Overcapacity/excess inventory
Market growth (increasing number ofproducts/services/customers)
Market contraction (decliningdemand/customer base)*
Pricing trends
Industry regulation/legislation
1Q12
2Q12
3Q12
4Q12

Industry
16 CFO Signals
Please see Appendix for industry-specific findings.
0% 10% 20% 30% 40% 50%
Voice recognition / voice-control
Other
Location-based services(customer/product location data)
Channel data(volumes, prices, ratings, etc.)
Product/service data(prices, ratings, etc.)
Targeted/customized offerings(based on location, demographics, history, etc.)
Cloud-based services
Analytical techniques(predictive modeling, visualization, statistical
computing, etc.)
Customer data(behaviors, history, demographics, etc.)
Social business(media, networking, computing and software)
Mobile(access to wireless connections and mobile
devices)
Business-Changing IT Trends Percent of respondents who place each option in their top three
Most important IT trendsWhich advancements do CFOs think will most reshape their businesses?
Mobility, social business, and customer data are the top three, but most technology developments are getting significant attention:• Mobility is a top trend for every industry – and for nearly every
Services company.• Social business trends are particularly important to Retail/Wholesale,
Financial Services, and Healthcare/Pharma.• Customer data trends are most important to Retail/Wholesale and
Healthcare/Pharma.• Analytical techniques are getting attention from all sectors, but
especially in Manufacturing and Technology.• Cloud-based services are particularly important to Technology and
T/M/E companies.

CompanyPessimism and trepidation limit investment and hiring
Top company-level challenges and business focusHow are economic, political, and industry developments affecting where companies focus their attention?
Companies are focused on preserving and growing revenues in their current markets, working to reduce costs where possible, and reworking their strategies:• Revenues in existing markets have been the dominant focus for
most of the last two years; all CFOs in Healthcare/Pharma and Services named it a top challenge.
• The focus on new markets is significant and steady, but much lower than the focus on existing markets – except in the Technology sector.
• Talent challenges have been a top factor for the last year –especially within Retail/Wholesale.
• Companies still appear to be squeezing whatever they can out their indirect costs; only Energy/Resources has a strong focus on direct costs.
• Plentiful balance sheet cash seems to be relegating financing, liquidity, and working capital to only minor importance.
17 CFO Signals
Company ChallengesPercent of respondents who place each option in their top three
0% 10% 20% 30% 40% 50% 60%
Other
Projecting and reporting results
Managing assets and working capital
Financing and liquidity
Managing operations and supply chain risks
Direct cost reduction
Pursuing or responding to M&A opportunities/approaches
Addressing government policy and regulation
Revenue growth/preservation in new markets
Overhead cost reduction
Prioritizing investments
Talent (availability, development, morale and cost)
Framing and/or adapting strategy
Revenue growth/preservation in existing markets
1Q12
2Q12
3Q12
4Q12
Please see Appendix for industry-specific findings.
0% 10% 20% 30% 40%
Other
Asset efficiency - working capital
Asset efficiency - fixed assets
Cost reduction - direct costs
Cost reduction - indirect costs
Revenue growth/preservation - new markets
Revenue growth/preservation - current markets
1Q12
2Q12
3Q12
4Q12
Company Business FocusDistribution of company focus among respondents
Please see Appendix for industry-specific findings.

Company
Sales, earnings, and input costsAfter hitting survey record lows last quarter, year-over-year growth expectations have improved, but not by very much.
Sales growth expectations are generally getting better, driven mostly by rising optimism in the U.S. and Mexico:• Sales are expected to rise 5.6%* overall, above last quarter’s survey-low
4.8%*; the median is 5%, and 83% of CFOs expect year-over-year gains.• Country-specific expectations are 4.8%* for the U.S. (4.3%* last quarter),
5.5%* for Canada (6.5%* last quarter), and 10.6%* for Mexico (6.5%* last quarter).
• T/M/E and Financial Services are highest at 8.8%* and 6.5%*, respectively; Energy/Resources (3.5%*) and Services (4.0%*) are lowest.
Earnings growth expectations have risen substantially, driven mostly by rising optimism in the U.S. and within Manufacturing:• Earnings are expected to rise 10.9%* overall, above last quarter’s survey-
low 8.0%*; the median is 7%*\, and 76% of CFOs expect year-over-year gains.
• Country-specific expectations are 10.5%* for the U.S. (7.2%* last quarter), 9.2%* for Canada (8.1%* last quarter), and 9.2%* for Mexico (8.9%* last quarter).
• Manufacturing is highest at a whopping 17.5%* (although the result is mainly driven by a few companies’ expectation of very strong growth) and Healthcare/Pharma is next at nearly 13%*; T/M/E and Financial Services are lowest at about 5%* and 7%*, respectively.
Wage and benefits cost growth estimates are near their long-term averages, but non-labor input cost growth estimates are the lowest we have seen:• Wages are expected to rise 3.2%*, in line with the long-term average for
this survey.• Non-labor input costs are expected to rise 2.4%* – a new survey low (the
long-term average is about 4%).• Benefits costs are expected to rise 4.3%*, consistent with estimates over
the past year. • There are significant industry differences for all cost categories (see
breakdown in Appendix).
18 CFO Signals
Operating Results*Expected change year-over-year
0%2%4%6%8%
10%12%14%16%18%20%
1Q12 2Q12 3Q12 4Q12
*Averages have been adjusted to eliminate the effects of stark outliers. Please see Appendix for industry-specific findings.
Costs*Expected change year-over-year
0%
2%
4%
6%
1Q12 2Q12 3Q12 4Q12

Company
Dividends and investmentCompanies appear to be hoarding cash again, with “fiscal cliff” driven uncertainty apparently depressing planned investments in capital, R&D, and marketing/advertising.
Dividend growth expectations are at the lower end of their long-term average:• Dividends are expected to rise 2.5%* overall, even with last quarter;
the median is 0%, and just 29% of CFOs expect year-over-year gains.
• Healthcare/Pharma is highest at 7%*; Financial Services and T/M/E are lowest at 1%* and 0%*, respectively.
Capital spending growth expectations are the lowest we have seen, driven mostly by sharp declines in Energy/Resources and T/M/E:• Capital spending is expected to rise just 4.2%*, below last quarter’s
survey-low 4.6%*; the median is 0%, and just 43% of CFOs expect year-over-year gains.
• Manufacturing and Retail/Wholesale are the highest, both at about 10%*; Energy/Resources and T/M/E are lowest at -15%* and -3%*, respectively.
R&D spending growth expectations are the lowest we have seen, driven by notable declines in half of the eight sectors:• R&D spending is expected to rise just 2.7%*, well below the longer-
term average of about 4%; the median is 0%, and just 37% of CFOs expect year-over-year gains.
• Retail/Wholesale, Financial Services, Energy/Resources, and T/M/E are all near 0%; the other sectors are closer to 5%.
Marketing and advertising spending growth expectations are the lowest we have seen, driven by notable declines in three sectors:• Marketing and advertising is expected to rise just 2.0%*, well below
the longer-term average of about 4%; the median is 0%, and 43% of CFOs expect year-over-year gains.
• Technology, Energy/Resources, and Services are all near 0%; the other sectors range from 3% to 4.5%.
19 CFO Signals
Investments*Expected change year-over-year
0%
2%
4%
6%
8%
10%
12%
14%
1Q12 2Q12 3Q12 4Q12
*Averages have been adjusted to eliminate the effects of stark outliers. Please see Appendix for industry-specific findings.

Company
EmploymentDomestic hiring expectations have improved somewhat from last quarter’s dismal lows; Manufacturing trends suggest some slowing of offshore jobs growth (and some shifting of jobs to the U.S.), but not much.
Domestic hiring growth expectations have improved somewhat, driven mostly by significant improvements in Mexico and modest improvements in the U.S.:• Domestic hiring is expected to rise 1.0%* overall, above last
quarter’s survey-low 0.6%*; the median is 0%, with 40% of CFOs expecting year-over-year gains and 28% expecting cuts (a new survey high)
• Country-specific expectations are 0.7%* for the U.S. (0.2%* last quarter), 0.2%* for Canada (1.1%* last quarter), and 5.8%* for Mexico (2.7%* last quarter).
• Energy/Resources and Financial Services are highest at 3.0%* and 2.4%*, respectively; Service, Retail/Wholesale, and Healthcare/Pharma all posted declines of 1% or more.
Offshore hiring growth expectations have declined to a new survey low; outsourcing is expected to increase modestly:• Offshore hiring is expected to rise just 0.5%* (a new survey low); the
median is 0%, with 32% of CFOs expecting year-over-year gains and relatively few CFOs expecting cuts. Energy/Resources expects a nearly 4% drop in offshore hiring and Manufacturing expects a nearly 3% gain.
• Outsourcing is expected to rise 2.3%* (above the survey low of 1.6%* last quarter); the median is 0%, with 28% of CFOs expecting year-over-year gains and relatively few CFOs expecting cuts. Healthcare/Pharma, Energy/Resources, and Retail/Wholesale all project declines in outsourcing; T/M/E, Financial Services, and Manufacturing all expect outsourcing gains of more than 3%.
* Numbers with asterisks have been adjusted to eliminate the effects of stark outliers.
20 CFO Signals
0%
1%
2%
3%
4%
5%
1Q12 2Q12 3Q12 4Q12
Employment*Expected change year-over-year
*Averages have been adjusted to eliminate the effects of stark outliers. Please see Appendix for industry-specific findings.

Company
Own-company optimismWith looming U.S. elections adding to economic and policy uncertainty, CFO sentiment (especially in the U.S.) has been falling for the past two quarters. But has the resolution of the elections and the relative stability of the European predicament helped CFOs’ outlook?
CFO optimism continued to decline this quarter – possibly due to the election outcome (and the resulting prospects for U.S. fiscal cliff negotiations), but also possibly due to cyclical patterns:• Net optimism (the difference between those reporting rising optimism
and those reporting declining pessimism) fell to -11 for the continent.• Pessimism did not rise, but fewer CFOs expressed rising optimism
(and more expressed no change in sentiment).• Just 7% of CFOs express rising optimism that is based on perceived
improvements in external factors – i.e. economic conditions, political developments, and industry trends.
• Nearly all pessimism is attributed to external factors.• This is the second year in which sentiment has peaked in the first
quarter and declined most of the rest of the year.• Despite rising equity markets last quarter, CFO optimism declined
substantially – and the S&P index declined shortly thereafter (a little more than 2% between surveys); both times we have seen this pattern, equities markets have declined.
• Optimism in the U.S. continued to decline – with net optimism falling from zero two quarters ago and -16 last quarter to -21 this quarter.
• Net optimism in Canada fell markedly from the 40s over the past two quarters to just -6 this quarter.
• Two thirds of CFOs in Mexico report rising optimism, and none reported a decline (note the small sample size).
21 CFO Signals
Own-Company OptimismNet optimism and causes of rising/falling optimism
-40%
-20%
0%
20%
40%
60%
80%
100% More optimistic primarily due to external factors(e.g., economy, industry, and market trends)
More optimistic primarily due tointernal/company-specific factors (e.g.,products/services, operations, financing, assets)
No notable change
Less optimistic primarily due tointernal/company-specific factors (e.g.,products/services, operations, financing, assets)
Less optimistic primarily due to external factors(e.g., economy, industry, and market trends)
Net optimism (% more optimistic minus % lessoptimistic)
Please see Appendix for industry-specific findings.
Own-Company OptimismOptimism and net optimism relative to S&P500 price
500
600
700
800
900
1000
1100
1200
1300
1400
1500
-30%
-20%
-10%
0%
10%
20%
30%
40%
50%
60%
70%
Optimism (% of CFOs more optimistic)
Net Optimism (% more optimistic less %more pessimistic)
S&P 500 price at survey period midpoint

Finance OrganizationStrategic roles and information needs drive new competency requirements
Top finance-level challengesHow are companies’ challenges affecting the focus of finance organizations?
Finance is again heavily focused on influencing and enabling business decisions, with a rising focus on financial reporting/controls and a declining focus on supporting M&A and business expansion:• Providing information and tools for business decisions has been the
dominant finance focus for more than a year.• Finance is spending a substantial (and growing) portion of time
influencing business strategy and operational priorities.• Finance is more focused on ensuring current initiatives deliver
results than on selecting/aligning new initiatives, especially in Manufacturing, Technology, and Services.
• Compliance with financial reporting/controls requirements became a notably stronger focus this quarter.
• There is relatively little focus on cost and availability of capital.
22 CFO Signals
0% 10% 20% 30% 40% 50% 60%
Addressing changes in tax laws and/or accountingstandards
Other
Ensuring funding, liquidity and acceptable costs of capital
Supporting a major business initiative (e.g., geographic orproduct/service expansion, new production facility)
Supporting a major transaction (e.g., merger, acquisition,divestiture)
Managing finance organization's costs
Forecasting and reporting business results
Ensuring compliance with financial reporting and controlrequirements
Supporting a major infrastructure initiative (e.g., IT systemschange, shared services consolidation, outsourcing)
Securing and retaining finance talent
Aligning budgets and capex decisions withpriorities/strategies
Ensuring initiatives achieve desired business outcomes
Influencing business strategy and operational priorities
Providing metrics, information and tools needed for soundbusiness decisions
1Q12
2Q12
3Q12
4Q12
Finance Organization ChallengesPercent of respondents who place each option in their top three
Please see Appendix for industry-specific findings.

Finance Organization
23 CFO Signals
Please see Appendix for industry-specific findings.
0% 10% 20% 30% 40% 50% 60%
Other
Audit
Treasury
Accounting / Reporting
Tax
Capital Investment
M&A
Risk Management
Financial Processes/Controls
Budgeting / Financial Planning
IT/Info/Systems Management
Strategic Planning
Improving Finance Organization CapabilitiesPercent of respondents who place each option in their top three
Priorities for finance capability improvement Which capabilities would CFOs most like to improve?
CFOs are mostly satisfied with their capabilities in longstanding core areas like corporate finance, treasury, and audit, but they want to improve in areas that support finance’s increasingly strategic role: • Better strategic planning capabilities are important to all sectors
except Healthcare/Pharma, and are particularly important in Manufacturing.
• Budgeting and financial planning capability improvement is a priority for all sectors, especially within Technology and Healthcare/Pharma.
• Improvements in IT/information management are a top priority for all sectors except Technology.
• Financial processes/controls improvement is a priority for all sectors except Energy/Resources.

CFO CareerBroadening demands affecting the way CFOs want (and need) to be viewed
Top job stressesHow are current economic and company challenges affecting CFOs?
Major change initiatives and changing regulatory requirements have been perpetual stresses, and strategic ambiguity is back: • Major change initiatives have been the top stress almost every
quarter over the past two years.• Changing regulatory requirements are the top stress for Financial
Services and Healthcare/Pharma. • Strategic ambiguity was a minor stress in the first half of the year,
but it is back among the top stresses as companies look toward 2013 – especially within Technology, T/M/E, and Services.
• Poor company performance has been a top stress for at least a third of CFOs for the past year, with particularly strong effects for Technology, Healthcare/Pharma, and Services.
• Board relationships/demands appear to be a rising source of stress.• Internal power struggles and politics are a persistent stress for
Retail/Wholesale.
24 CFO Signals
0% 10% 20% 30% 40% 50% 60%
Expansion of job role/responsibility intoareas of less comfort
Insufficient internal politicalinfluence/authority
Poor quantity/quality/reliability ofinformation
Internal power struggles and politics
Other
Excessive workload/responsibilities
Relationship with and demands fromboard
Insufficient support staff (skills and/ornumber)
Pressures from poor companyperformance
Strategic ambiguity
Changing regulatory requirements
Major change initiatives (e.g., M&A, ITsystems change, IPO)
1Q12
2Q12
3Q12
4Q12
Job StressesPercent of respondents who place each option in their top three
Please see Appendix for industry-specific findings.

CFO Career
CFOs’ desired reputation with key constituenciesHow do CFOs want to be regarded by their CEOs, executive peers, and finance staff?
CFOs mostly want to be recognized for their attitudes (or mindsets) and their personal values (or traits) – although competency, role, and mindset certainly play a role as well. And their emphasis shifts depending on the constituency: • CEO descriptors focus mostly on mindset and traits, with heavy
emphasis on a strategy/business mindset and also on reliability, responsibility, and loyalty; being regarded as a leader, communicator, and change agent is also frequently mentioned.
• Executive peer descriptors focus heavily on mindset, with a strong orientation toward teamwork, collaboration, and problem-solving; reliability and trustworthiness are also highly important, as is technical competency/experience.
• Finance staff descriptors focus heavily on role, with a strong emphasis on being seen as a leader, agenda-setter, and standard-setter; being regarded as supportive, approachable, and understanding is also important, as is being seen as mentor, motivator, and coach.
25 CFO Signals
Please see chart on next page
Please see chart on next page.

26 CFO Signals
CFO Career
How CFOs want to be regarded by…
…their CEO …their executive team peers …their finance staff
Text represents adjectives provided by respondents.Text size represents relative prevalence of response.
Red boxes denote top three responses for each constituency.

Public, 74.1%
Private, 25.9%
Demographics
27 CFO Signals
$1B - $5B, 37.2%
Less than $1B, 23.3%
More than $10B, 18.6%
$5.1B -$10B, 20.9%
Annual Revenue ($U.S.)(n=86)
Ownership(n=85)
Subsidiary Company(n=85)
81% -100%, 50.6%
61% - 80%, 16.5%
41% - 60%, 15.3%
21% - 40%, 12.9%
20% or less, 4.7%
Revenue from North America
(n=85)
No (Holding Company/Gro
up), 75.3%,
Yes (Subsidiary of
North American
Company), 11.8%
Yes (Subsidiary of
Non-North American
Company), 12.9%

U.S., 72.9%
Canada, 20.0%
Mexico, 7.1%
Less than 5, 31.4%
5 to 10, 30.2%
11 to 20, 31.4%
More than 20, 7%
Demographics (cont.)
CFO Signals
CFO Experience (Years)(n=86)
Previous CFO Role(n=86)
CFO of Another
Organization, 50.0%
Controller, 12.8%
Treasurer, 7.0%
FP&A Leader, 7.0%
Public Accounting Prof., 2.3%
Consultant, 1.2% Business Unit
Leader, 12.8%
Other, 7.0%
Manufacturing, 20.9%
Financial Services, 24.4%
Tel/Med/Ent, 5.8%
Retail/ Wholesale,
10.5%
Energy & Resources,
16.5%
Other, 5.8%
Technology, 7.0%
Healthcare/ Pharma, 7.0%
Services, 7.0%
Country(n=85)
Industry(n=86)
28

Methodology
BackgroundThe Deloitte North American CFO Survey is a quarterly survey of CFOs from large, influential companies across North America. Thepurpose of the survey is to provide these CFOs with quarterly information regarding the perspectives and actions of their CFO peers across five areas: CFO career, finance organization, company, industry, and economy.
ParticipationThis survey seeks responses from client CFOs across the United States, Canada, and Mexico. The sample includes CFOs from public and private companies that are predominantly over $3B in annual revenue. Respondents are nearly exclusively CFOs. Participation is open to all sectors except for government.
Survey ExecutionAt the opening of each survey period, CFOs receive an email containing a link to an online survey hosted by a third-party service provider. The response period is typically two weeks, and CFOs receive a summary report approximately two weeks after the surveycloses. Only CFOs who respond to the survey receive the summary report for the first two weeks after the report is released.
Nature of ResultsThis survey is a “pulse survey” intended to provide CFOs with information regarding their CFO peers’ thinking across a variety of topics; it is not, nor is it intended to be, scientific in any way, including in its number of respondents, selection of respondents, or response rate – especially within individual industries. Accordingly, this report summarizes findings for the surveyed population but does not necessarily indicate economy- or industry-wide perceptions or trends.
29 CFO Signals

As used in this survey, “Deloitte” means Deloitte LLP and its subsidiaries. Please see www.deloitte.com/us/about for a detailed description of the legal structure of Deloitte LLP and its subsidiaries. Certain services may not be available to attest clients under the rules and regulations of public accounting.
Copyright © 2013 Deloitte Development LLC. All rights reserved.
Member of Deloitte Touche Tohmatsu Limited.