cfd analysis of helical nozzles effects on the energy separation in a vortex tube...
TRANSCRIPT

1
CFD ANALYSIS OF HELICAL NOZZLES EFFECTS ON THE ENERGY SEPARATION
IN A VORTEX TUBE
by
Nader POURMAHMOUD*1, Amir HASSAN ZADEH
1, Omid MOUTABY
1, Abdolreza BRAMO
1
1Department of Mechanical Engineering, Urmia University, Urmia, Iran
E-mail: [email protected]
E-mail: [email protected]
E-mail: [email protected]
E-mail: [email protected]
In this article computational fluid dynamics (CFD) analysis of a three-
dimensional steady state compressible and turbulent flow has been carried
out through a vortex tube. The numerical models use the k–ε turbulence
model to simulate an axisymmetric computational domain along with
periodic boundary conditions. The present research has focused on the
energy separation and flow field behavior of a vortex tube by utilizing both
straight and helical nozzles. Three kinds of nozzles set include of 3 and 6
straight and 3 helical nozzles have been investigated and their principal
effects as cold temperature difference was compared. The studied vortex
tubes dimensions are kept the same for all models. The numerical values of
hot and cold outlet temperature differences indicate the considerable
operating role of helical nozzles, even a few numbers of that in comparing
with straight nozzles. The results showed that this type of nozzles causes to
form higher swirl velocity in the vortex chamber than the straight one. To be
presented numerical results in this paper are validated by both available
experimental data and flow characteristics such as stagnation point situation
and the location of maximum wall temperature as two important facts. These
comparisons showed reasonable agreement.
Key words: Vortex tube, CFD simulation, Stagnation point, Energy
separation, Helical nozzles
1. Introduction
Vortex tube is also known as the Ranque-Hilsch vortex tube is a mechanical device that
separates compressed air (or any inert gas) into hot and cold streams. The vortex tube was invented in
1933 by French physicist George J. Ranque [1]. Physicist Rudolf Hilsch improved the design and
published a widely read paper in 1947 on the device [2]. A vortex tube has no moving part, and only
compressed air is injected tangentially into one or more nozzles, which causes the air to rotate at a
high speed. It rotates and moves towards the end of the vortex tube. Using of a conical valve at the end
of tube lets exiting of hot gas and then formation of reversely rotating vortex moving in opposite
direction. This flow is forced to return in an inner vortex of reduced diameter within the outer vortex,
and exit through the central orifice near the entrance nozzles; that is called cold exit. This mechanism
is described in fig. 1.
Kurosaka [3] reported the temperature separation to be a result of acoustic streaming effect

2
Figure 1. Schematic drawing of a vortex tube operational mechanism
that transfers energy from the cold core to the hot outer annulus. Stephan et al. [4] proposed the
formation of Gortler vortices on the inside wall of the vortex tube that drive the fluid motion. Ahlborn
and Gordon [5] described an embedded secondary circulation. Aljuwayhel et al. [6] utilized a fluid
dynamics model of the vortex tube to understand the process that drives the temperature separation
phenomena. Behera et al. [7] used the CFD to simulate the flow field and energy separation. Skye et
al. [8] used a model similar to that of Aljuwayhel et al. [6]. Chang et al. [9] conducted a visualization
experiment using surface tracing method to investigate the internal flow phenomena and to indicate
the stagnation position in a vortex tube. Eisma et al. [10] performed a numerical study to research the
flow field and temperature separation phenomenon. Volkan Kirmaci [11] applied Taguchi method to
optimize the number of nozzle of vortex tube. Akhesmeh et al. [12] made a CFD model in order to
study the variation of velocity, pressure and temperature inside a vortex tube. Their results obtained
upon numerical approach comprehensively emphasized on the mechanism of hot peripheral flow and a
reversing cold inner core flow formation. Xue Y. et al. [13] discussed on pressure, viscosity,
turbulence, temperature, secondary circulation and acoustic streaming. Bramo and Pourmahmoud [14-
16] studied numerically the effect of length to diameter ratio (L/D) and stagnation point occurrence
importance in flow patterns. Hossein Nezhad and Shamsoddini [17] based on a three dimensional CFD
model analyzed the mechanism of flow and heat transfer in the vortex tube.
Until now, complete understanding of the physical mechanisms that occurs in the vortex tube
is one of the most scientific challenges in theoretical and experimental researches. Recent efforts that
have successfully benefited of CFD could explain the basic principles behind the energy separation
produced by the vortex tube. More designing parameters such as tube length and its geometry, cold
and hot exit area, number of nozzles can be governed the flow field behavior in a vortex tube. But
among them, nozzle geometrical shape is a specific case because it can be significantly enhanced the
entrance gas velocity to vortex chamber. The present investigation, therefore, tends to explore the
effects of helical nozzle geometry as a one of the main fundamentals of vortex tube structure in
describing energy separation and clarification of correlation between stagnation point location and the
position where the maximum wall temperature occurs.
2. Governing equations
The compressible turbulent and highly rotating flow inside the vortex tube is assumed to be
three-dimensional, steady state and employs the standard k-ε turbulence model. The RNG k-ε
turbulence model and more advanced turbulence models such as the Reynolds stress equations were
also investigated, but as known these models could not be made to converge for this simulation.
Bramo and Pourmahmoud [15] showed that, because of good agreement of numerical results with the
experimental data, the k-ε model can be selected to simulate the effect of turbulence inside of

3
computational domain. Consequently, the governing equations are arranged by the conservation of
mass, momentum and energy equations, which are given by:
0)(
j
j
ux
(1)
)(3
2)( ji
jk
kij
i
j
j
i
ji
ji
j
uup
xx
u
x
u
x
u
xxuu
x
(2)
effiji
j
eff
j
jji
i
ux
kx
uuux
Th )(
2
1 ,
Prt
tp
eff
cKk
(3)
Since we assumed the working fluid is an ideal gas, then the compressibility effect must be
imposed so that:
RTp
(4)
The turbulence kinetic energy (k) and the rate of dissipation (ε) are got from the following
equations:
YGGxxx
Mbk
jk
t
j
i
i
kkuk
t
])[()()(
(5)
kCGCG
kCkk
tbk
j
t
j
i
i xxu
x
2
231 )(])[()()(
(6)
In these equations, Gk, Gb, and YM represent the generation of turbulence kinetic energy due to
the mean velocity gradients, the generation of turbulence kinetic energy due to buoyancy and the
contribution of the fluctuating dilatation in compressible turbulence to the overall dissipation rate,
respectively. C1ε and C2ε are constants. σk and σε are the turbulent prandtel numbers for k and ε also.
The turbulent (or eddy) viscosity, µt, is computed as follows:
k
Ct
2
(7)
Where, Cμ is a constant. The model constants C1ε, C2ε, Cμ, σk and σε have the following default values:
C1ε = 1.44, C2ε = 1.92, Cμ = 0.09, σk = 1.0, σε = 1.3.
3. Vortex tube model description
The CFD models of present research are based on the analysis of Skye et al. [8] experimental
vortex tube. The vortex tube had been equipped with 6 straight nozzles. In an experimental and
numerical analysis process, they found a good correlation between two approaches, however their

4
CFD model has employed 2D computational model. Since the high rotating flow inside the vortex tube
makes a complex compressible turbulent flow, therefore one must be analyzed these types of flow
patterns in full 3D CFD models. Bramo and Pourmahmoud [14-16] enhanced capability of Skye et al.
[8] model results in 3D CFD models, so that this system has been investigated in with respect to
various geometrical parameters such as tube length. The exploration of stagnation point location
showed that the experimental device tube length was just appropriately, as the numerical results
prediction.
Hence, this article has devoted its research direction to study effects of both nozzles number
and its geometry on the mentioned device. In the new regarding, the Skye's vortex tube is modeled
numerically with respect to 3 straight and 3 helical nozzles instead of 6 straight nozzles such that the
total nozzles area are kept constant to all set of nozzles. This is due to the fact that this article believes
that helical nozzles can play very considerable role in appropriately operating of a vortex tube even for
a few number of nozzles in comparison with straight nozzles.
As the geometry of the vortex tube is periodic, only a part of sector is taken for analysis in
given cyclic boundary condition. Basic assumptions for all computations of the particular vortex tube
flows were made as follows: A circumferential pressurized gas inlet and two axial orifices for cold and
hot stream with air as a working fluid. Since the chamber consists of 3 slots, the CFD models are
assumed to be a rotational periodic flow and only a sector of the flow domain with angle 120° needs to
be considered. The 6 straight nozzles CFD model corresponds to Skye's experimental vortex tube is
shown in fig. 2. Figure 3 describes introduced 3D CFD vortex tube models with 3 straight and 3
helical nozzles. Dimensional geometric details of these models are presented in tab. 1.
(a)
(b)
Figure 2. a) 3D CFD model of vortex tube with six straight nozzles b) nozzles geometrical
details
(a)
(b)
Figure. 3: 3D modified CFD model of vortex tube with a) 3 straight nozzles b) 3 helical nozzles

5
Boundary conditions for the models are determined based on the experimental measurements
by Skye et al. [8]. The inlet is modeled as a mass flow inlet. The specified total mass flow rate and
stagnation temperature are fixed to 8.35 gr/s and 294.2 K, respectively. The static pressure at the cold
exit boundary was fixed at experimental measurements pressure. The static pressure at the hot exit
boundary is adjusted in the way to vary the cold mass fraction.
Table 1: Geometric summery of CFD models used for vortex tube
Measurement Skye's experimental
vortex tube
Present vortex tube with 3 number
of either helical or straight nozzle
Working tube length 106 mm
106 mm
Working tube I.D. 11.4 mm
11.4 mm
Nozzle height 0.97 mm
0.97 mm
Nozzle width 1.41 mm
2.82 mm
Nozzle total inlet area(An) 8.2 mm2
8.2 mm2
Cold exit diameter 6.2 mm
6.2 mm
Hot exit area 95 mm2 95 mm
2
3.1 Validation
A compressible form of the Navier-Stokes equations together with appropriate k-ε turbulence
model are derived and solved by using the FLUENTTM
software package. In order to discretise of
derivative terms, the second order upwind and quick schemes are employed to momentum, turbulence
and energy equations. The temperature separation obtained from the present calculations were
compared with the experimental results of Skye et al.[8] for validation. Figures 4 and 5 show the cold
and hot temperature differences. As seen in fig. 4, the cold temperature difference (ΔTi,c ) predicted by
the model is in good agreement with the experimental results. Prediction of the cold exit temperature
difference is found to lie between the experimental and computational results of Skye et al. [8].
However, both numerical results of hot exit temperature difference (ΔTi,h) are very closer to
experimental data as shown in fig. 5.
10
15
20
25
30
35
40
45
50
0.1 0.2 0.3 0.4 0.5 0.6 0.7 0.8 0.9
Co
ld T
emp
era
ture
Dif
fere
nce
(K
)
Cold Mass Fraction
Skye et al [8] Experiments
Present CFD Analysis
Skye et al [8] CFD Analysis
0
10
20
30
40
50
60
70
80
90
0.1 0.2 0.3 0.4 0.5 0.6 0.7 0.8 0.9
Ho
t Tem
per
atu
re D
iffe
ren
ce (K
)
Cold Mass Fraction
Skye et al [8] Experiments
Present CFD Analysis
Skye et al [8] CFD Analysis
Figure 4. Cold exit temperature difference as
a function of cold mass fraction
Figure 5. Hot exit temperature difference as a
function of cold mass fraction

6
The hot exit temperature difference is observed to increase with an increase in the cold mass
fraction. The maximum hot exit temperature difference of 70 K was found due to a cold mass fraction
of 0.81. Meanwhile in cold mass fraction range of 0.2–0.4, the cold temperature differences can reach
to its maximum values.
4. Results and discussion
4.1 Effect of nozzles shape
In vortex tube, shape type and number of inlet nozzles are quite important. So far, many
investigations have been implemented on these parameters to achieve the best performance of vortex
tube upon minimum cold outlet temperature. Kirmaci and Uluer [18] investigated the vortex tube
performance experimentally. They used 2, 3, 4, 5 and 6 numbers of nozzles with air inlet pressures
varying from 150 kPa to 700 kPa, and the cold mass fractions of 0.5–0.7. Prabakaran and
Vaidyanathan [19] investigated the effect of nozzle diameter on energy separation. Shamsoddini and
Hossein Nezhad [20] numerically investigated the effects of nozzles number on the flow and power of
cooling of a counter flow vortex tube. They concluded that as the number of nozzles is increased,
power of cooling increases significantly while cold outlet temperature decreases moderately. Behera et
al. [7] also studied the effect of nozzle shape and number numerically. All of implied investigations
reported that the shape of inlet nozzles should be designed such that the flow enters tangentially into
vortex tube chamber.
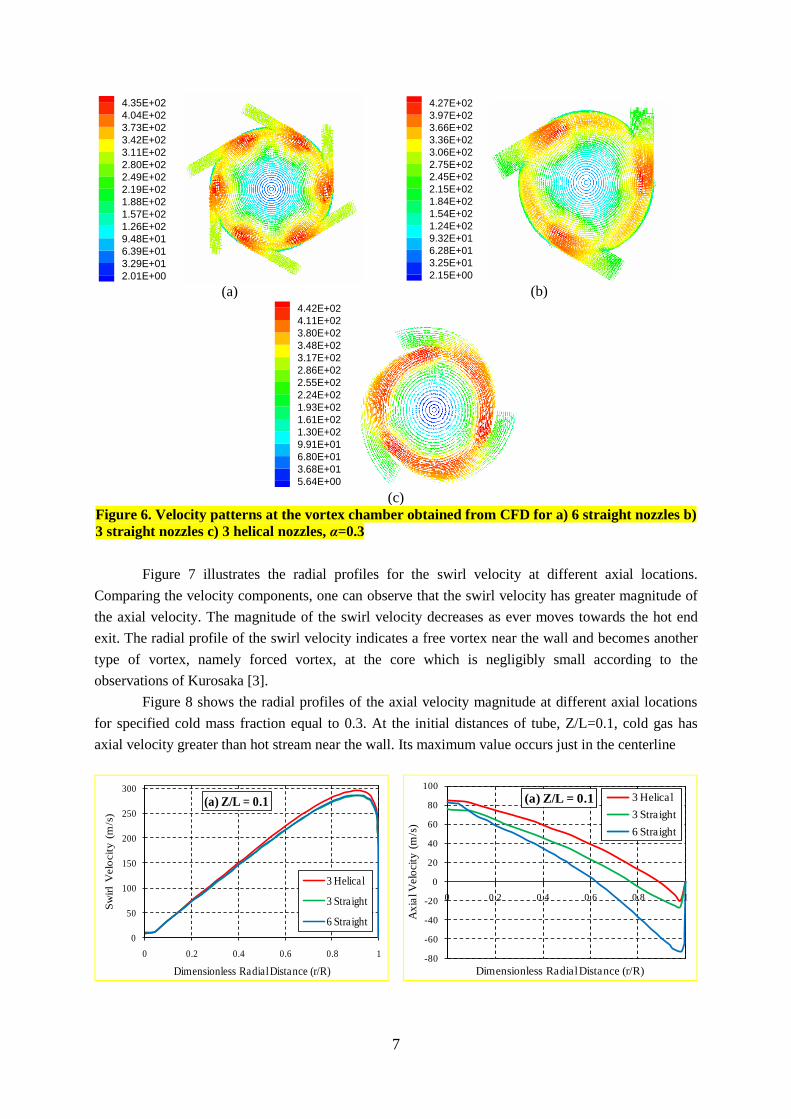
The flow patterns at the vortex chamber of the three CFD models of vortex tube, as the
velocity field, are shown in fig. 6. Indeed, vortex chamber is a place that, cold exit is completely
coincided to the end plan of its, but with smaller diameter than the main tube. In fig. 6a, in spite of 6
straight nozzles presence, locally injected momentum by means of nozzles in to vortex chamber is
restricted to nozzle exit area only, that is instantaneously and low order because of small width of
nozzle and division of total mass among the nozzles. What makes this set reasonable is only the
creation of a symmetric flow field.
In fig. 6b, objection of locally momentum injection is recovered by increasing of nozzle width
(nozzle area) because total nozzles area is constant for all of nozzles set. This situation caused a
uniformly injection of momentum to produce semi continues high momentum zones in the rotating
flow domain; as can be seen in the fig. 6b by red areas. It must be reminded that at this condition since
the nozzles number is less than the last one, so the exit momentum from each nozzle is more effective
to move downstream flow toward next nozzle.
Finally in fig. 6c, applying of 3 helical nozzles has removed the issue of instantaneously
momentum injection and semi continues high momentum zones in the vortex chamber. These are
implemented by formation of good tangential exit velocity from each helical nozzle. The properly exit
swirl velocity, has provided a reasonable and interested rotating flow so that each nozzle gains
sufficient enough energy to the downstream flow to push toward the next nozzle. These types of
nozzles show that, they can produce somewhat higher swirl velocity than the others; as seen in fig. 7.
Thus, it is a criterion to attain maximum cold temperature difference in the vortex tube device. It must
be regard that in this condition the vortex tube has operated only with 3 helical nozzles instated of 6
straight nozzles.
7
X
Y
-0.0025 0 0.0025 0.0050
0.001
0.002
0.003
0.004
0.005
0.006
0.007
0.008
4.35E+02
4.04E+02
3.73E+02
3.42E+02
3.11E+02
2.80E+02
2.49E+02
2.19E+02
1.88E+02
1.57E+02
1.26E+02
9.48E+01
6.39E+01
3.29E+01
2.01E+00
Frame 001 07 Jul 2011 titleFrame 001 07 Jul 2011 title
(a)
X
Y
-0.0025 0 0.0025 0.0050
0.001
0.002
0.003
0.004
0.005
0.006
0.007
0.008
4.27E+02
3.97E+02
3.66E+02
3.36E+02
3.06E+02
2.75E+02
2.45E+02
2.15E+02
1.84E+02
1.54E+02
1.24E+02
9.32E+01
6.28E+01
3.25E+01
2.15E+00
Frame 001 07 Jul 2011 titleFrame 001 07 Jul 2011 title
(b)
X
Y
-0.0025 0 0.0025 0.0050
0.001
0.002
0.003
0.004
0.005
0.006
0.007
0.008
4.42E+02
4.11E+02
3.80E+02
3.48E+02
3.17E+02
2.86E+02
2.55E+02
2.24E+02
1.93E+02
1.61E+02
1.30E+02
9.91E+01
6.80E+01
3.68E+01
5.64E+00
Frame 001 07 Jul 2011 titleFrame 001 07 Jul 2011 title
(c)
Figure 6. Velocity patterns at the vortex chamber obtained from CFD for a) 6 straight nozzles b)
3 straight nozzles c) 3 helical nozzles, α=0.3
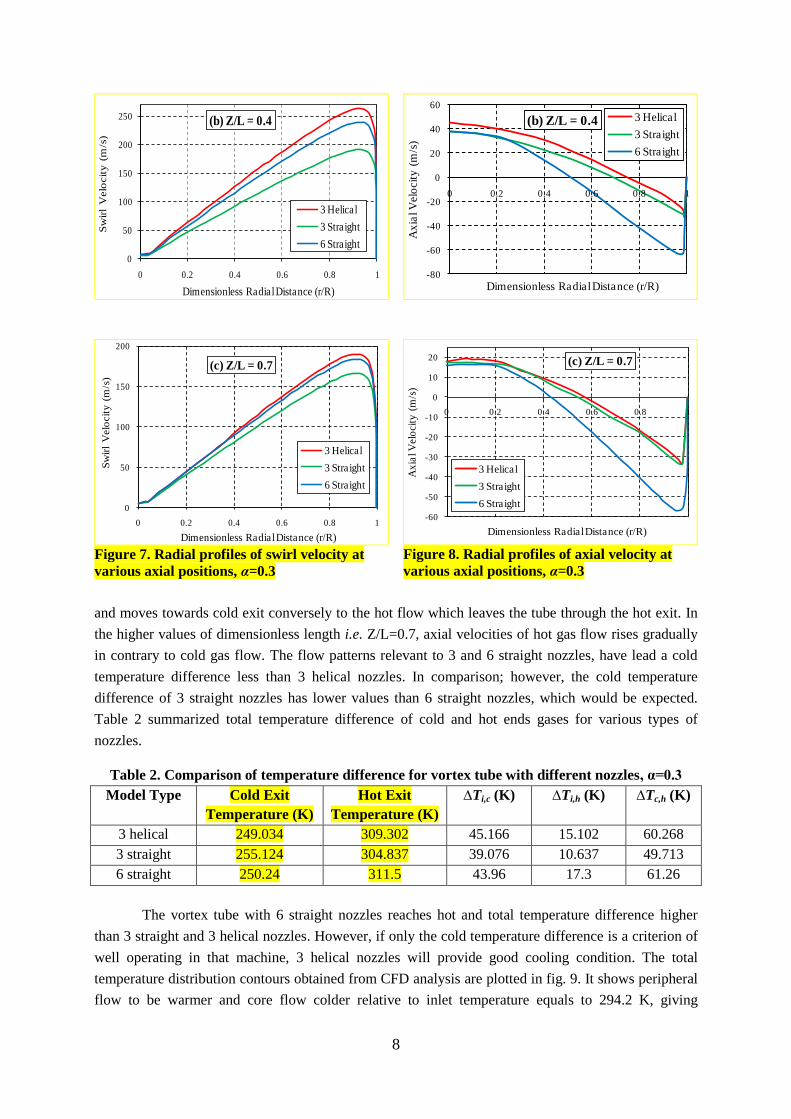
Figure 7 illustrates the radial profiles for the swirl velocity at different axial locations.
Comparing the velocity components, one can observe that the swirl velocity has greater magnitude of
the axial velocity. The magnitude of the swirl velocity decreases as ever moves towards the hot end
exit. The radial profile of the swirl velocity indicates a free vortex near the wall and becomes another
type of vortex, namely forced vortex, at the core which is negligibly small according to the
observations of Kurosaka [3].
Figure 8 shows the radial profiles of the axial velocity magnitude at different axial locations
for specified cold mass fraction equal to 0.3. At the initial distances of tube, Z/L=0.1, cold gas has
axial velocity greater than hot stream near the wall. Its maximum value occurs just in the centerline
0
50
100
150
200
250
300
0 0.2 0.4 0.6 0.8 1
Sw
irl
Velo
cit
y (
m/s
)
Dimensionless Radial Distance (r/R)
(a) Z/L = 0.1
3 Helical
3 Straight
6 Straight
-80
-60
-40
-20
0
20
40
60
80
100
0 0.2 0.4 0.6 0.8 1
Ax
ial V
elo
cit
y (
m/s
)
Dimensionless Radial Distance (r/R)
(a) Z/L = 0.1 3 Helical
3 Straight
6 Straight
8
0
50
100
150
200
250
0 0.2 0.4 0.6 0.8 1
Sw
irl
Velo
cit
y (
m/s
)
Dimensionless Radial Distance (r/R)
(b) Z/L = 0.4
3 Helical
3 Straight
6 Straight
-80
-60
-40
-20
0
20
40
60
0 0.2 0.4 0.6 0.8 1
Ax
ial V
elo
cit
y (
m/s
)
Dimensionless Radial Distance (r/R)
(b) Z/L = 0.4 3 Helical
3 Straight
6 Straight
0
50
100
150
200
0 0.2 0.4 0.6 0.8 1
Sw
irl
Velo
cit
y (
m/s
)
Dimensionless Radial Distance (r/R)
(c) Z/L = 0.7
3 Helical
3 Straight
6 Straight
Figure 7. Radial profiles of swirl velocity at
various axial positions, α=0.3
-60
-50
-40
-30
-20
-10
0
10
20
0 0.2 0.4 0.6 0.8 1A
xia
l V
elo
cit
y (
m/s
)
Dimensionless Radial Distance (r/R)
(c) Z/L = 0.7
3 Helical
3 Straight
6 Straight
Figure 8. Radial profiles of axial velocity at
various axial positions, α=0.3
and moves towards cold exit conversely to the hot flow which leaves the tube through the hot exit. In
the higher values of dimensionless length i.e. Z/L=0.7, axial velocities of hot gas flow rises gradually
in contrary to cold gas flow. The flow patterns relevant to 3 and 6 straight nozzles, have lead a cold
temperature difference less than 3 helical nozzles. In comparison; however, the cold temperature
difference of 3 straight nozzles has lower values than 6 straight nozzles, which would be expected.
Table 2 summarized total temperature difference of cold and hot ends gases for various types of
nozzles.
Table 2. Comparison of temperature difference for vortex tube with different nozzles, α=0.3
Model Type Cold Exit
Temperature (K)
Hot Exit
Temperature (K)
∆Ti,c (K)
∆Ti,h (K)
∆Tc,h (K)
3 helical 249.034 309.302 45.166 15.102 60.268
3 straight 255.124 304.837 39.076 10.637 49.713
6 straight 250.24 311.5 43.96 17.3 61.26
The vortex tube with 6 straight nozzles reaches hot and total temperature difference higher
than 3 straight and 3 helical nozzles. However, if only the cold temperature difference is a criterion of
well operating in that machine, 3 helical nozzles will provide good cooling condition. The total
temperature distribution contours obtained from CFD analysis are plotted in fig. 9. It shows peripheral
flow to be warmer and core flow colder relative to inlet temperature equals to 294.2 K, giving

9
maximum hot gas temperature of 313.451 K and minimum cold gas temperature of 249.034 K for 3
helical nozzles.
(a)
(b)
(c)
Figure 9. Temperature distribution in vortex tube with: a) 3 helical nozzles b) 3 straight nozzles
c) 6 straight nozzles, α=0.3
X
Y
0.0
02
0.0
03
0.0
04
0.0
05
0.0
06
0.0
07
0.0
08
0.0
04
0.0
05
0.0
06
0.0
07
0.0
08
0.0
09
3.0
5E
+0
2
3.0
3E
+0
2
3.0
0E
+0
2
2.9
8E
+0
2
2.9
5E
+0
2
2.9
3E
+0
2
2.9
1E
+0
2
2.8
8E
+0
2
2.8
6E
+0
2
2.8
4E
+0
2
2.8
1E
+0
2
2.7
9E
+0
2
2.7
6E
+0
2
2.7
4E
+0
2
2.7
2E
+0
2
2.6
9E
+0
2
2.6
7E
+0
2
2.6
5E
+0
2
2.6
2E
+0
2
2.6
0E
+0
2
2.5
7E
+0
2
2.5
5E
+0
2
Fra
me
00
1
29
Ju
l2
01
1
titleF
ram
e0
01
29
Ju
l2
01
1
title
X
Y
0.0
02
0.0
03
0.0
04
0.0
05
0.0
06
0.0
07
0.0
08
0.0
04
0.0
05
0.0
06
0.0
07
0.0
08
0.0
09
3.0
9E
+0
2
3.0
6E
+0
2
3.0
3E
+0
2
3.0
0E
+0
2
2.9
8E
+0
2
2.9
5E
+0
2
2.9
2E
+0
2
2.8
9E
+0
2
2.8
6E
+0
2
2.8
3E
+0
2
2.8
0E
+0
2
2.7
8E
+0
2
2.7
5E
+0
2
2.7
2E
+0
2
2.6
9E
+0
2
2.6
6E
+0
2
2.6
3E
+0
2
2.6
0E
+0
2
2.5
8E
+0
2
2.5
5E
+0
2
2.5
2E
+0
2
2.4
9E
+0
2
Fra
me
00
1
29
Ju
l2
01
1
titleF
ram
e0
01
29
Ju
l2
01
1
title
XY
0.0
02
0.0
03
0.0
04
0.0
05
0.0
06
0.0
07
0.0
08
0.0
04
0.0
05
0.0
06
0.0
07
0.0
08
0.0
09
3.1
2E
+0
2
3.0
9E
+0
2
3.0
6E
+0
2
3.0
3E
+0
2
3.0
0E
+0
2
2.9
7E
+0
2
2.9
4E
+0
2
2.9
1E
+0
2
2.8
8E
+0
2
2.8
5E
+0
2
2.8
2E
+0
2
2.8
0E
+0
2
2.7
7E
+0
2
2.7
4E
+0
2
2.7
1E
+0
2
2.6
8E
+0
2
2.6
5E
+0
2
2.6
2E
+0
2
2.5
9E
+0
2
2.5
6E
+0
2
2.5
3E
+0
2
2.5
0E
+0
2
Fra
me
00
1
29
Ju
l2
01
1
titleF
ram
e0
01
29
Ju
l2
01
1
title

10
Comparison of three different nozzles set in this figure, indicates that cold exit gas region in
the 3 helical nozzles set is smaller than 3, and 6 straight nozzles vortex tube. This means that the
mechanism of energy separation can occur just in a place that rotating flow has higher swirl velocity.
Nevertheless, at the straight nozzles set the energy separation mechanism encountered with a
considerable delay, which produces sufficient time to exchange of thermal energy between hot and
cold cores. In addition, the flow patterns as path lines at sectional lengths near the cold, hot exits and
mid region because of using different nozzles sets are shown in fig. 10. The formation of core and
peripheral streamlines can be clearly seen at the near cold end and mid region, but after occurring of
separation phenomenon the core vortex is disappeared. In spite of creating of such reverse flow, the
peripheral flow does not alter its continuation toward the hot end. One should notice that, the axial
distance between stagnation point and hot exit end is too short. The path lines help to realize of flow
patterns, so that any flow filed symmetry, various regions of hot and cold flow can be identified by
them. Approaching to a properly symmetric rotating flow and effective intensively domain can be seen
in fig. 10a. The exact values of axial location for stagnation point due to utilize of any nozzles set will
be presented and discussed at the following section in more details.
(a)
(b)
(c)
Figure 10. 3D Path lines colored by total temperature along the vortex tube with a) 3 helical b)
3 straight c) 6 straight nozzles, α=0.3
4.2 Power separation rate
The rate of energy (power) separation provides another measuring way for evaluation of the
vortex tube performance. The rates of energy separation in the hot and cold exit streams ( cQ.
and hQ.
)
X
Y
0.0
02
0.0
03
0.0
04
0.0
05
0.0
06
0.0
07
0.0
08
0.0
04
0.0
05
0.0
06
0.0
07
0.0
08
0.0
09
3.0
9E
+0
2
3.0
6E
+0
2
3.0
3E
+0
2
3.0
0E
+0
2
2.9
8E
+0
2
2.9
5E
+0
2
2.9
2E
+0
2
2.8
9E
+0
2
2.8
6E
+0
2
2.8
3E
+0
2
2.8
0E
+0
2
2.7
8E
+0
2
2.7
5E
+0
2
2.7
2E
+0
2
2.6
9E
+0
2
2.6
6E
+0
2
2.6
3E
+0
2
2.6
0E
+0
2
2.5
8E
+0
2
2.5
5E
+0
2
2.5
2E
+0
2
2.4
9E
+0
2
Fra
me
00
1
29
Ju
l2
01
1
titleF
ram
e0
01
29
Ju
l2
01
1
title
X
Y
0.0
02
0.0
03
0.0
04
0.0
05
0.0
06
0.0
07
0.0
08
0.0
04
0.0
05
0.0
06
0.0
07
0.0
08
0.0
09
3.0
5E
+0
2
3.0
3E
+0
2
3.0
0E
+0
2
2.9
8E
+0
2
2.9
5E
+0
2
2.9
3E
+0
2
2.9
1E
+0
2
2.8
8E
+0
2
2.8
6E
+0
2
2.8
4E
+0
2
2.8
1E
+0
2
2.7
9E
+0
2
2.7
6E
+0
2
2.7
4E
+0
2
2.7
2E
+0
2
2.6
9E
+0
2
2.6
7E
+0
2
2.6
5E
+0
2
2.6
2E
+0
2
2.6
0E
+0
2
2.5
7E
+0
2
2.5
5E
+0
2
Fra
me
00
1
29
Ju
l2
01
1
titleF
ram
e0
01
29
Ju
l2
01
1
title
X
Y
0.0
02
0.0
03
0.0
04
0.0
05
0.0
06
0.0
07
0.0
08
0.0
04
0.0
05
0.0
06
0.0
07
0.0
08
0.0
09
3.1
2E
+0
2
3.0
9E
+0
2
3.0
6E
+0
2
3.0
3E
+0
2
3.0
0E
+0
2
2.9
7E
+0
2
2.9
4E
+0
2
2.9
1E
+0
2
2.8
8E
+0
2
2.8
5E
+0
2
2.8
2E
+0
2
2.8
0E
+0
2
2.7
7E
+0
2
2.7
4E
+0
2
2.7
1E
+0
2
2.6
8E
+0
2
2.6
5E
+0
2
2.6
2E
+0
2
2.5
9E
+0
2
2.5
6E
+0
2
2.5
3E
+0
2
2.5
0E
+0
2
Fra
me
00
1
29
Ju
l2
01
1
titleF
ram
e0
01
29
Ju
l2
01
1
title

11
are determined and compared with the available experimental data of Skye et al. [8] as shown in fig.
11 and 12. The values of cQ.
and hQ.
can be evaluated as follows:
)(..
cinpcc TTcmQ (8)
)(..
inhphh TTcmQ (9)
The helical nozzles set show a good capability of power separation rate in cold exit, however;
the six straight nozzles reverse this phenomenon at the hot exit. Both the experimental data and the
CFD models show maximum power separation with a cold fraction of about 0.65.
0.04
0.06
0.08
0.1
0.12
0.14
0.16
0.18
0.2
0.1 0.2 0.3 0.4 0.5 0.6 0.7 0.8 0.9
Po
wer
Sep
ara
tio
n R
ate
(K
W)
Cold Mass Fraction
Cold Energy Separation
Skye et al [8] Experiments
3 Helical
3 Straight
6 Straight
0.04
0.06
0.08
0.1
0.12
0.14
0.16
0.18
0.2
0.1 0.2 0.3 0.4 0.5 0.6 0.7 0.8 0.9
Po
wer
Sep
ara
tio
n R
ate
(K
W)
Cold Mass Fraction
Cold Energy Separation
Skye et al [8] Experiments
3 Helical
3 Straight
6 Straight
Figure 11. Comparison of cold power
separation rate with experimental data
Figure 12. Comparison of hot power
separation rate with experimental data
4.3 Stagnation point and wall temperature
Figure 13 attempts to clarify the reasons which make relationship between stagnation point
position and where maximum wall temperature occurs. Physical mechanism of energy separation in
vortex tube would be related to exist of two counter flows in the tube because of stagnation point
presence [15], although these two locations are not exactly coincide to each other. The stagnation
point position within the vortex tube can be determined by two ways: according to maximum wall
temperature location, and on the basis of velocity profile along the tube length at the point where it
ceases to a negative value. The point of maximum wall temperature represents the stagnation point
determined by Fulton et al. [21]. Fulton stated that “at this point, the tube wall is hotter than the final
mixed air and hotter than the tube wall either at the inlet or at the far end of the tube”. Figure 14 shows
the stagnation point and corresponding streamlines in the r–z plane. The numerical results of
Aljuwayhel et al. [6] CFD model, suggested that considerable or strictly spoken the most part of
energy separation in the vortex tube occurs before stagnation point. At the present work, for the
applied three set of nozzles, fig. 14 exaggeratedly illustrated axial difference of stagnation point along
the tube.
Beside to attain maximum swirl velocity and maximum cold temperature difference, axial
velocity distribution together with maximum wall temperature location also would be another two

12
important parameters in designing of a good vortex tube. The former two criteria have been discussed
in the previous sections, and resent parameters must be in reasonable conformity with them. So that
Figure 13. Schematic description of energy
transfer pattern in the vortex tube
Figure 14. Exaggerated schematic drawing of
separation point location for different nozzles
the present research would believe that the four mentioned facts should justify one another. The
investigated variations of axial velocity along the center line of the vortex tube for 3 different type of
nozzles set are shown in fig. 15, where the Z/L denoted as the dimensionless tube length. The results
show that the positions of stagnation points for all of models are too close to the hot exit. But, 3 helical
nozzles set causes the position of this point is drawn rather a little to the hot exit end. The axial
locations of these pointes relative to hot exit end can be arranged as: first for 3 helical nozzles, second
6 straight nozzles and finally 3 straight, respectively. One can consider due to somewhat closeness of
separation point of 3 helical nozzles set to the hot exit, it brings maximum cold temperature difference
in this type of vortex tube. In other words, any nozzle shapes or their numbers that can produce a
situation moving stagnation point possibly closer to hot exit would be preferred in comparison. Figure
16 depicts tube wall temperature distribution along a straight line laid from cold side to hot end.
-10
0
10
20
30
40
50
60
70
80
90
0 0.2 0.4 0.6 0.8 1
Ax
ial V
elo
cit
y (
m/s
)
Dimensionless Length (Z/L)
Axial Velocity in Centerline of Tube
6 Straight
3 Straight
3 Helical
Stagnation Point
285
290
295
300
305
310
315
0 0.2 0.4 0.6 0.8 1
Wa
ll T
em
pera
ture
(K
)
Dimensionless Length (Z/L)
3 Helical3 Straight6 Straight
Figure 15. Variation of axial velocity along the
center line of the vortex tubes
Figure 16. The variations of wall temperature
along the vortex tubes length
As shown in fig. 7, the swirl velocities at the initial length of tube are very high. If one can
accept that the large energy dissipation occurs just in this zone of high rotating flow field, thus
sufficiently large temperature gradient would be expected, as shown in fig. 16. This condition has been
continued until where is called stagnation point. Of course, these behaviors may be interpreted such

13
that the needed length or control volume for dissipating of inlet flow kinetic energy is as small as for 3
helical nozzles. As a rough estimation, according to fig. 16, these dimensionless length are Z/L=0.18,
Z/L=0.4 and Z/L=0.65, respectively. These arrangements lead to achieve greater wall temperature of 3
helical nozzles and then 6 straight nozzles relative to 3 straight nozzles. The evaluated numerical
values for both (Z/L)w and (Z/L)v are compared in tab. 3. Also, as mentioned before; there is a slightly
difference between maximum wall temperature and stagnation point axial locations. As illustrated in
the fifth column of tab. 3, the 3 straight nozzles set devotes higher discrepancy itself.
Table 3. Comparison of the stagnation point location using two methods
Model Twmax (Z/L)w (Z/L)v Diff%
3 Straight 310.101 0.816774 0.984 16.72
6 Straight 310.119 0.834784 0.985 15.2
3 Helical 313.402 0.869958 0.986 11.62
4.4 Secondary flow in helical nozzles
It is well-known that the secondary flow can developed in the curved/helical tubes, for
example, Kurnia et al. [22] investigated the heat transfer performance of different geometry coils.
They also studied secondary flow in curved shape tubes and its influence on the temperature
distribution. In the proximity of curved ducts inner and outer walls, however, the axial velocity and the
centrifugal force will approach zero. Hence, to balance the momentum transport, secondary flows will
appear [22]. In the present research of helical nozzles, the formation of secondary flow is also
investigated. Because of too short length of this type of nozzles, the flow stream does not have enough
space and time for considerable secondary flow formation. However, as shown in fig. 17, secondary
flow intensity grows up at the corners of nozzle duct. In this figure, the axial velocity profile in the
plate near outlet of nozzle has been illustrated. Figure 18 depicts the predicted temperature distribution
for the same plane of helical nozzle, which confirms a lower temperature gradient in the nozzles.
Figure 17. Axial velocity profile of air flow in
a helical rectangular cross section nozzle
Figure 18. Temperature distribution of air flow
in a helical rectangular cross section nozzle
294.438
294.373
294.309
294.276
294.267
294.255
294.245
294.18
294.116
294.051
293.987
293.923
293.858
293.794
293.729
293.665
293.601
293.536
Frame 001 07 Jul 2011 titleFrame 001 07 Jul 2011 title
5.46688
4.67942
3.89196
3.1045
2.31704
1.52958
0.74212
0.148879
0.0581487
0.00408434
-0.0453398
-0.156232
-0.415398
-0.8328
-1.62026
-2.40772
-3.19518
-3.98264
-4.7701
-5.55756
Frame 001 07 Jul 2011 titleFrame 001 07 Jul 2011 title
Inner Wall Outer Wall Inner Wall Outer Wall

14
Formation of secondary flow causes slightly increasing of gas temperature near inner wall,
and as expected affects negligibly the heat transfer performance. Consequently, because of weak
formation of secondary flow in this nozzles set, then, it is assumed that it cannot influence the vortex
tube flow behavior.
Application of vortex tube device showed that this machine does not have engineering
justification, and attaining to maximum cold exit temperature is only important criterion. This paper
has endeavored on the ways which can help to this demand. Of course, effect of pressure drop in the
nozzles is one of the important facts. In this way, both pressure drop and the thermal energy separation
per unit pumping power/pressure drop in terms of Figure of Merit are investigated in the present
article, and these results are shown in fig. 19 and 20.
According to the obtained results of fig. 19, it is obvious that helical nozzles set has higher
pressure drop than straight ones. By analyzing of results of fig. 20, respect to Figure of Merit criteria;
one can accept that straight nozzles set helps to decrease of pressure drop.
Figure 19. Pressure drop in the three different
set of nozzles
Figure 20. Figure of merit of different nozzle
types
However, straight geometry is not suitable to produce reasonable swirl velocity (or equally
thermal energy separation) in the vortex chamber. On the other hand, because of flow field complexity
in vortex tube an expectation on the nozzle function is merely focused on the capability of producing
higher values of swirl velocity; that is implemented by helical nozzles.
Conclusion
A computational approach has been carried out to realize the effects of injection nozzles shape
and its number on the performance of vortex tube. In a three dimensional compressible flow, standard
k-ε turbulence model is employed to analyze the flow patterns through the CFD models. Three nozzles
set consist of 6 straight, 3 straight and 3 helical nozzles have been studied. The main purpose was
considered to reach maximum cold temperature difference. In this way, numerical results shown that
higher swirl velocity due to appropriately nozzles shape can effectively influence the exit cold gas
temperature. Comparison of flow fields in the three nozzles sets has been cleared that helical nozzles
are suitable to the desired amount of energy separation and higher cold gas temperature difference.
Using of 6 straight nozzles, have locally injected momentum to fluid flow in the vortex
chamber. This is not sufficient because in this case increased momentum of flow is restricted only in a
small region just at vicinity of nozzles exit area. In utilizing of 3 straight nozzles the exit area is

15
increased, thus a semi continues high momentum regions are created in the rotating flow field domain.
However, 3 helical nozzles set has removed objections of the last two sets, since a good tangential exit
velocity from the helical nozzles is provided. Hence, each nozzle helps to gain sufficient energy to the
downstream flow in order to conduct them toward next nozzle.
Moreover, this conclusion has also been proven by investigating of another four facts. These
criteria are maximum cold temperature difference, capability of swirl velocity increasing, location of
stagnation point, which occurs in a place that is farther than cold exit and finally adjustment possibility
between the locations of maximum wall temperature with stagnation point position. The total
temperature separations (hot and cold exit) predicted by the CFD model of 6 straight nozzles were
found to be in a good agreement with available experimental data and another flow characteristics
shown reasonable behaviors.
Nomenclature D -Diameter of vortex tube [mm]
k -Turbulence kinetic energy [m2 s
-2]
L -Length of vortex tube [mm]
R -Radial distance measured from the centerline of tube [mm]
T -Temperature [K]
Twmax -Maximum wall temperature [K]
Z -Axial length from nozzle cross section [mm]
(Z/L)w -Axial location of maximum wall temperature
(Z/L)v -Axial location of stagnation point
Greek Symbols
-Cold mass fraction
-Turbulence dissipation rate [m2 s
-3]
c,h -Temperature difference between cold and hot end [K]
i,c -Temperature difference between inlet and cold end [K]
i,h -Temperature difference between hot end and inlet [K]
-Density [kg m-3
]
-Stress [N m-2
]
-Dynamic viscosity [kg m-1
s-1
]
t -Turbulent viscosity [kg m-1
s-1
]
-Shear stress [N m-2
]
ij -Stress tensor components
References
[1] Ranque, G.J., Experiences sur la détente giratoire avec simultanes d’un echappement d’air
chaud et d’un enchappement d’air froid, J. Phys.Radium, 4 (1933), pp. 112-114
[2] Hilsch, R., Die expansion von gasen im zentrifugalfeld als kälteproze, Z. Naturforschung
1(1946), pp. 208-214
[3] Kurosaka, M., Acoustic Streaming in Swirling Flows, J. Fluid Mech., 124 (1982), pp. 139-172
[4] Stephan, K., et al., An Investigation of Energy Separation in a Vortex tube, Int. J. Heat Mass
Transfer, 26 (1983), pp. 341-348

16
[5] Ahlborn, B., Gordon, J., The Vortex Tube as a Classical Thermodynamic Refrigeration
Cycle, J. Appl. Phys, 88 (2000), pp. 645-653
[6] Aljuwayhel, N.F., Nellis, G.F., Klein, S.A., Parametric and Internal Study of The Vortex Tube
Using a CFD Model, Int. J. Refrig., 28 (2005), pp. 442-450
[7] Behera, U., et al., CFD Analysis and Experimental Investigations Towards Optimizing The
Parameters of Ranque-Hilsch Vortex Tube. Int. J. Heat and Mass Transfer, 48 (2005), pp.
1961-1973
[8] Skye, H.M., Nellis, G.F., Klein, S.A., Comparison of CFD Analysis to Empirical Data in a
Commercial Vortex Tube. Int. J. Refrig., 29 (2006), pp. 71-80
[9] Chang, H.S., Experimental and Numerical Studies in a Vortex Tube, Journal of Mechanical
Science and Technology, 3 (2006), pp. 418-425
[10] Eisma., Promvonge, S., Numerical Investigations of The Thermal Separation in a Ranque-
Hilsch Vortex Tube. Int. J Heat and Mass Transfer , 50 (2007), pp. 821-32
[11] Kirmaci V., Optimization of Counter Flow Ranque-Hilsch Vortex Tube Performance Using
Taguchi Method, International Journal of Refrigeration, 32 (2009), pp. 1487-1494
[12] Akhesmeh, S., Pourmahmoud, N., Sedgi, H., Numerical Study of the Temperature Separation
in the Ranque-Hilsch Vortex Tube, American Journal of Engineering and Applied Sciences, 3
(2008), pp. 181-187
[13] Xue, Y., Ajormandi M., Kelso, R., A Critical Review of Temperature Separation in a Vortex
Tube, Journal of Experimental Thermal and Fluid Science, 8 (2010), pp. 1367-1374
[14] Bramo, A.R., Pourmahmoud, N., A Numerical Study on The Effect of Length to Diameter
Ratio and Stagnation Point on The Performance of Counter Flow Vortex Tube, Aust. J. Basic
& Appl. Sci., 4 (2010), pp. 4943-4957
[15] Bramo, A.R., Pourmahmoud, N., CFD Simulation of Length to Diameter Ratio Effect on The
Energy Separation in a Vortex Tube, Thermal Science, In Press
[16] Pourmahmoud, N., Bramo, A.R., The Effect of L/D Ratio on The Temperature Separation in
The Counter Flow Vortex Tube , IJRRAS, 6 (2011), pp. 60-68
[17] Hossein Nezhad, A., Shamsoddini, R., Numerical Three-Dimensional Analysis of The
Mechanism of Flow and Heat Transfer in a Vortex Tube , Thermal Science, 4 (2009), pp. 183-
196
[18] Kirmaci, V., Uluer, O. An Experimental Investigation of the Cold Mass Fraction, Nozzle
Number, and Inlet Pressure Effects on Performance of Counter Flow Vortex Tube, Journal of
Heat Transfer, 131 (2009), pp. 603-609
[19] Prabakaran, J., Vaidyanathan S., Effect OF Diameter of Orifice and Nozzle on the
Performance of Counter Flow Vortex Tube, International Journal of Engineering Science and
Technology, 4 (2010), pp. 704-707
[20] Shamsoddini, R., Hossein Nezhad, A., Numerical Analysis of The Effects of Nozzles Number
on The Flow and Power of Cooling of a Vortex Tube, International Journal of Refrigeration,
33 (2010), pp. 774-782
[21] Fulton, C.D., Ranque’s tube, J Refrig Eng., 5 (1950), pp. 473-479
[22] KURNIA, J.C., SASMITO. A.P., MUJUMDAR. A.S., Laminar Convective Heat Transfer for
In-Plane Spiral Coils of Non-Circular Cross Section Ducts: A computational fluid dynamics
study, Thermal science, (2011), in press