cfd analysis of exhaust manifold of multi-cylinder si .... cfd analysis.full.pdf · cfd analysis of...
TRANSCRIPT
International Journal of Automobile Engineering
Research and Development (IJAuERD)
ISSN 2277-4785
Vol. 3, Issue 4, Oct 2013, 45-56
© TJPRC Pvt. Ltd.
CFD ANALYSIS OF EXHAUST MANIFOLD OF MULTI-CYLINDER SI ENGINE TO
DETERMINE OPTIMAL GEOMETRY FOR REDUCING EMISSIONS
K. S. UMESH1, V. K. PRAVIN
2 & K. RAJAGOPAL
3
1Department of Mechanical Engineering, Thadomal Shahani Engineering College, Mumbai, Maharashtra, India
2Department of Mechanical Engineering, P. D. A. College of Engineering, Gulbarga, Karnataka, India
3Former Vice Chancellor, JNT University, Hyderabad, Andhra Pradesh, India
ABSTRACT
Exhaust manifold is one of the most critical components of an IC Engine. The designing of exhaust manifold is a
complex procedure and is dependent on many parameters viz. back pressure, exhaust velocity, mechanical efficiency etc.
Preference for any of this parameter varies as per designers needs. Usually fuel economy, emissions and power
requirement are three different streams or thought regarding exhaust manifold design. This work comprehensively analyzes
eight different models of exhaust manifold and concludes the best possible design for least emissions and complete
combustion of fuel to ensure least pollution.
KEYWORDS: Multi-Cylinder SI Engine, Exhaust Manifold, Back Pressure, Exhaust Velocity, LBCE, LBSE, LBSER,
LBCER, SBCE, SBSE, SBCER, SBSER
INTRODUCTION
In an IC Engine at the beginning of suction stroke inlet valve of cylinder opens due to pressure difference. Air fuel
mixture (in case of SI engine) or air (in case of CI Engine) is sucked into the cylinder through this intake valve from inlet
manifold. Inlet manifold contains carburetor for mixing of air and fuel in case of SI Engines. Once air or air fuel mixture is
completely sucked into the cylinder whose piston has reached BDC the inlet valve closes and compression stroke begins.
As piston reaches TDC spark is ignited in the mixture (SI Engines require external sparking arrangement whereas in CI
Engine auto ignition takes place on injection of fuel) this marks the beginning of power stroke. Once again as the piston
reaches BDC exhaust stroke begins. During exhaust stroke exhaust valve is opened and the burnt mixture is rejected to
exhaust manifold. As exhaust stroke is completed suction stroke begins once again and cycle continues. The energy
supplied to engine in form of chemical energy of fuel is converted into thermal energy.
In any multi-cylinder IC engine, an exhaust manifold (also known as a header) collects the exhaust gases from
multiple cylinders into one pipe. This header is connected to these cylinders through bends. It is attached downstream of
the engine and is major part in multi‐ cylinder engines where there are multiple exhaust streams that have to be collected
into a single pipe. Exhaust gases comes out of this Header as a single stream of hot exhaust gases through single outlet.
From emission point of view most important parameters are backpressure and exhaust velocity.
Back Pressure
Engine exhaust backpressure is defined as the exhaust gas pressure that is produced by the engine to overcome the
hydraulic resistance of the exhaust system in order to discharge the gases into the atmosphere. The exhaust backpressure is
the gage pressure in the exhaust system at the outlet of the exhaust turbine in turbocharged engines or the pressure at the
outlet of the exhaust manifold in naturally aspirated engines.
46 K. S. Umesh, V. K. Pravin & K. Rajagopal
The word back may suggest a pressure that is exerted on a fluid against its direction of flow indeed, butthere are
two reasons to object. First, pressure is a scalar quantity, not a vector quantity, and has no direction. Second, the flow of
gas is driven by pressure gradient with the only possible direction of flow being that from a higher to a lower pressure.
Gas cannot flow against increasing pressure .It is the engine that pumps the gas by compressing it to a sufficiently high
pressure to overcome the flow obstructions in the exhaust system.
Effects of Increased Back Pressure
At increased back pressure levels, the engine has to compress the exhaust gases to a higher pressure which
involves additional mechanical work and/or less energy extracted by the exhaust turbine which can affect intake
manifold boost pressure. This can lead to an increase in fuel consumption, PM and CO emissions and exhaust
temperature. The increased exhaust temperature can result in overheating of exhaust valves and the turbine.
An increase in NOx emissions is also possible due to the increase in engine load.
Increased backpressure may affect the performance of the turbocharger, causing changes in the air-to-fuel
ratio-usually enrichment—which may be a source of emissions and engine performance problems. The magnitude
of the effect depends on the type of the charge air systems. Increased exhaust pressure may also prevent some
exhaust gases from leaving the cylinder (especially in naturally aspirated engines), creating an internal exhaust
gas recirculation (EGR) responsible for some NOx reduction. Slight NOx reductions reported with some DPF
system, usually limited to 2-3% percent, are possibly explained by this effect.
Excessive exhaust pressures can increase the likelihood of failure of turbocharger seals, resulting in oil leakage
into the exhaust system. In systems with catalytic DPFs or other catalysts, such oil leak can also result in the
catalyst deactivation by phosphorus and/or other catalyst poisons present in the oil.
All engines have a maximum allowable engine back pressure specified by the engine manufacturer. Operating the
engine at excessive backpressure might invalidate the engine warranty.
It is generally accepted by automotive engineers that for every inch of Hg of backpressure (that's Mercury - inches
of Hg is a unit for measuring pressure) approximately 1-2 HP is lost depending on the displacement and efficiency
of the engine, the combustion chamber design etc.
Table 1: VERT Maximum Recommended Exhaust Back Pressure
Exhaust Velocity
Exhaust system is designed to evacuate gases from the combustion chamber quickly and efficiently. Exhaust
gases are not produced in a smooth stream; exhaust gases originate in pulses. A 4-cylinder motor will have 4 distinct pulses
per complete engine cycle a 6 cylinder has 6 pulses and so on. More the pulses produced, the more continuous the exhaust
flow. Backpressure can be loosely defined as the resistance to positive flow - in this case, the resistance to positive flow of
the exhaust stream.

CFD Analysis of Exhaust Manifold of Multi-Cylinder SI Engine to Determine Optimal Geometry for Reducing Emissions 47
It is a general misconception that wider exhaust gives helps in better scavenging. But actually main factor behind
good scavenging is exhaust velocity. The astute exhaust designer knows that flow capacity must be balanced with velocity.
The faster an exhaust pulse moves, the better it can scavenge out all of the spent gasses during valve overlap.
The guiding principle of exhaust pulse scavenging is that a fast moving pulse creates a low-pressure area behind it.
This low-pressure area acts as a vacuum and draws along the air behind it. A similar example would be a vehicle traveling
at a high rate of speed on a dusty road. There is a low pressure area immediately behind the moving vehicle - dust particles
get sucked into this low pressure area causing it to collect on the back of the vehicle.
Exhaustive work has taken place already in this field. Scheeringa et al studied analysis of Liquid cooled exhaust
manifold using CFD. He to improve the fundamental understandings of manifold operation obtained detailed information
of flow property distributions and heat transfer. He to investigate the parametric effects of operating conditions and
geometry on the performance of manifolds performed a number of computations. Yasar Deger et al. did CFD-FE-Analysis
for the Exhaust Manifold of a Diesel Engine aiming to determine specific temperature and pressure distributions. The fluid
flow and the heat transfer through the exhaust manifold were computed correspondingly by CFD analyses including the
conjugate heat transfer.
Kulal et al.(2013)in his “CFD Analysis and Experimental Verification of Effect of Manifold Geometry on
Volumetric efficiency and Back Pressure for Multi-cylinder SI Engine” investigated optimal geometry for exhaust
manifold for maximum volumetric efficiency. Kulal et al.(2013)in his “Experimental Analysis of Optimal Geometry for
Exhaust Manifold of Multi-cylinder SI Engine for Optimum Performance” investigated the effect of attaching a reducer to
the outlet of exhaust manifold.
This work focuses upon study of pressure distribution and velocity distribution inside an exhaust manifold of
different geometries and to conclude best possible geometry from emissions point of view.
DISCUSSIONS
Model Description
We have considered eight different models for this particular research work. We have flaunted with symmetric
and asymmetric designs and have flocked concepts of having either long or short bends (inlet for exhaust manifold).
Additionally we have tried out idea of attaching a reducer at the outlet of exhaust manifold for each of these designs.
The material used for pipe was SA 106 (grade B). Flange material was IS 2602 (Grade B). Elbow material was SA 234
WPB.
The eight models considered for this work are
Short Bend Center Exit (SBCE)
Short Bend Side Exit (SBSE)
Long Bend Center Exit (LBCE)
Long Bend Side Exit (LBSE)
Short Bend Center Exit with Reducer (SBCER)
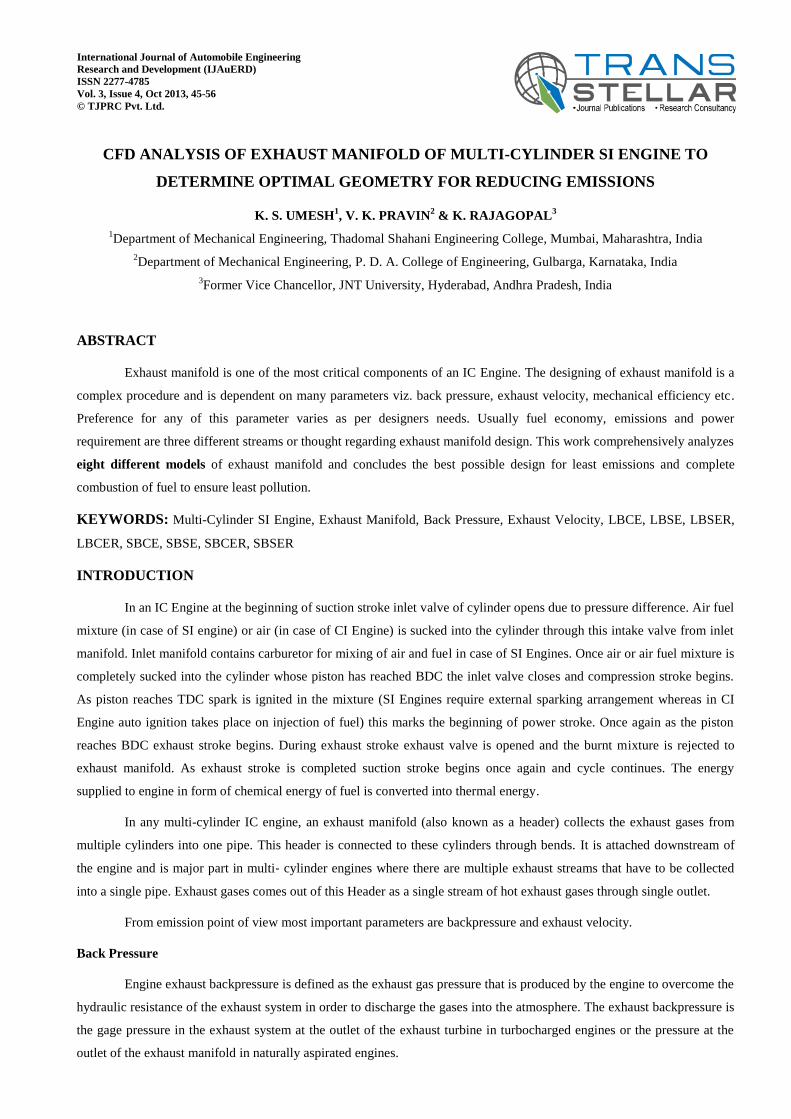
Short Bend Side Exit with Reducer (SBSER)
Long Bend Center Exit with Reducer (LBCER)
48 K. S. Umesh, V. K. Pravin & K. Rajagopal
Long Bend Side Exit with Reducer (LBSER)
Figure 1: Short Bend Side Exit
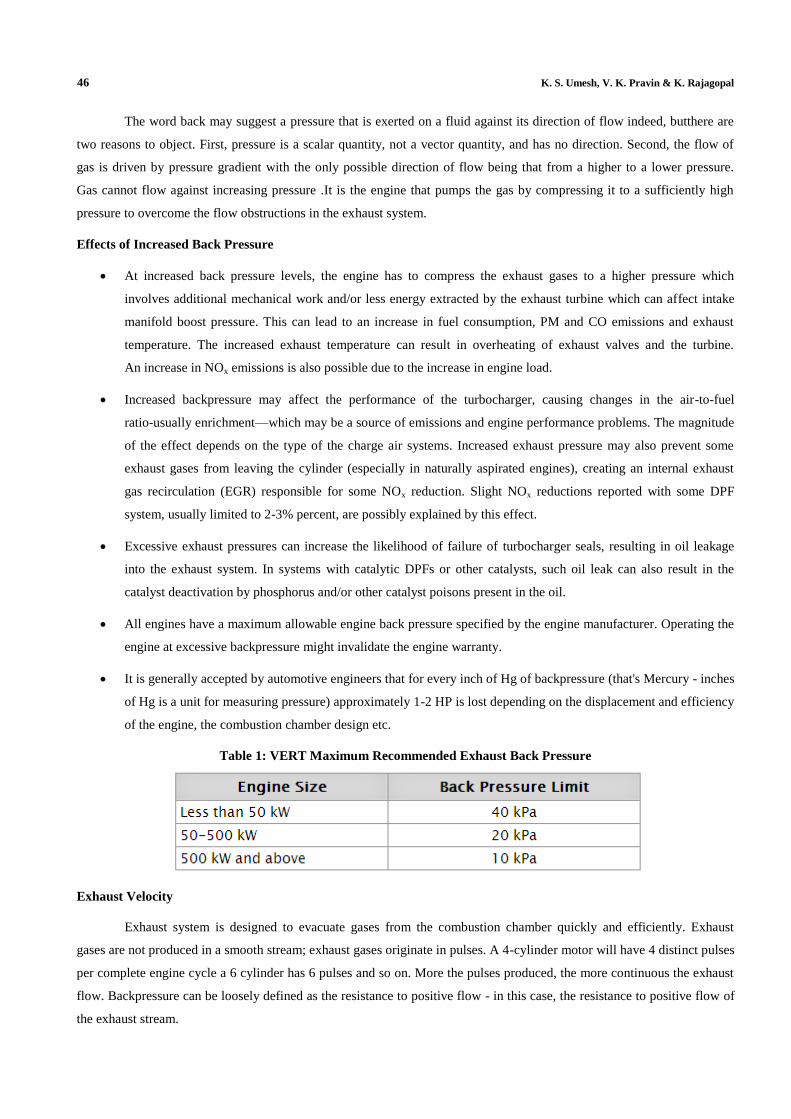
Figure 2: Long Bend Center Exit
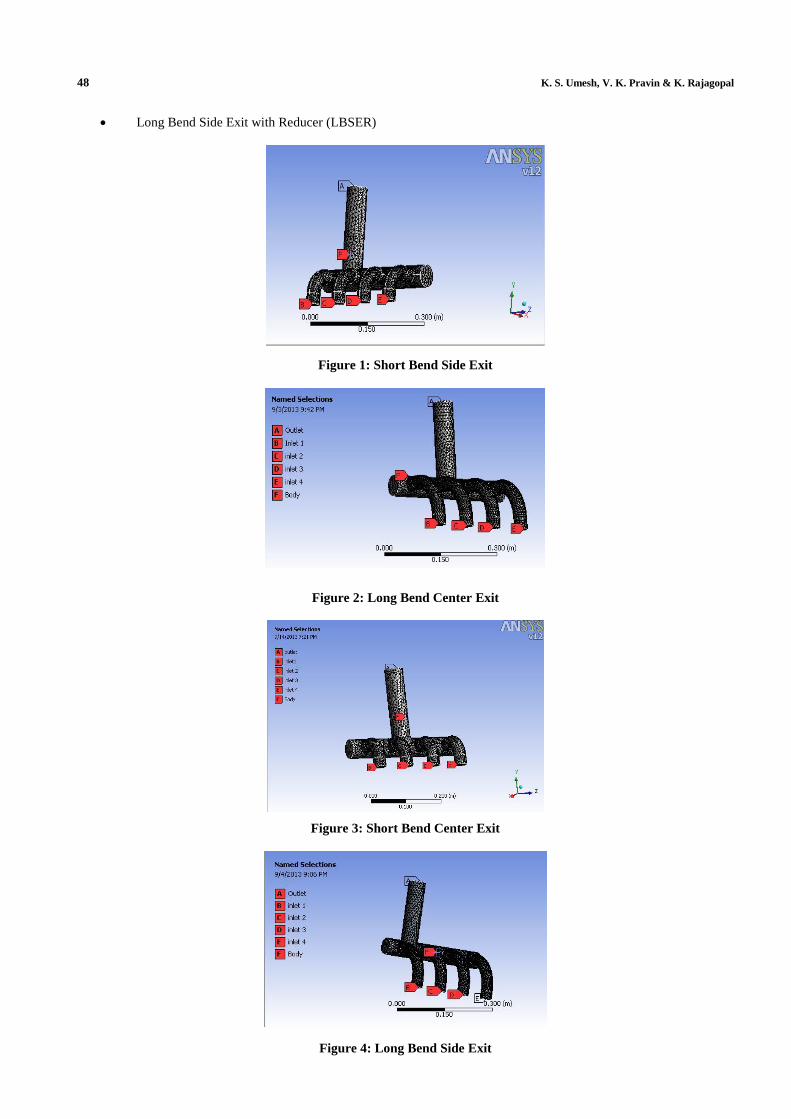
Figure 3: Short Bend Center Exit
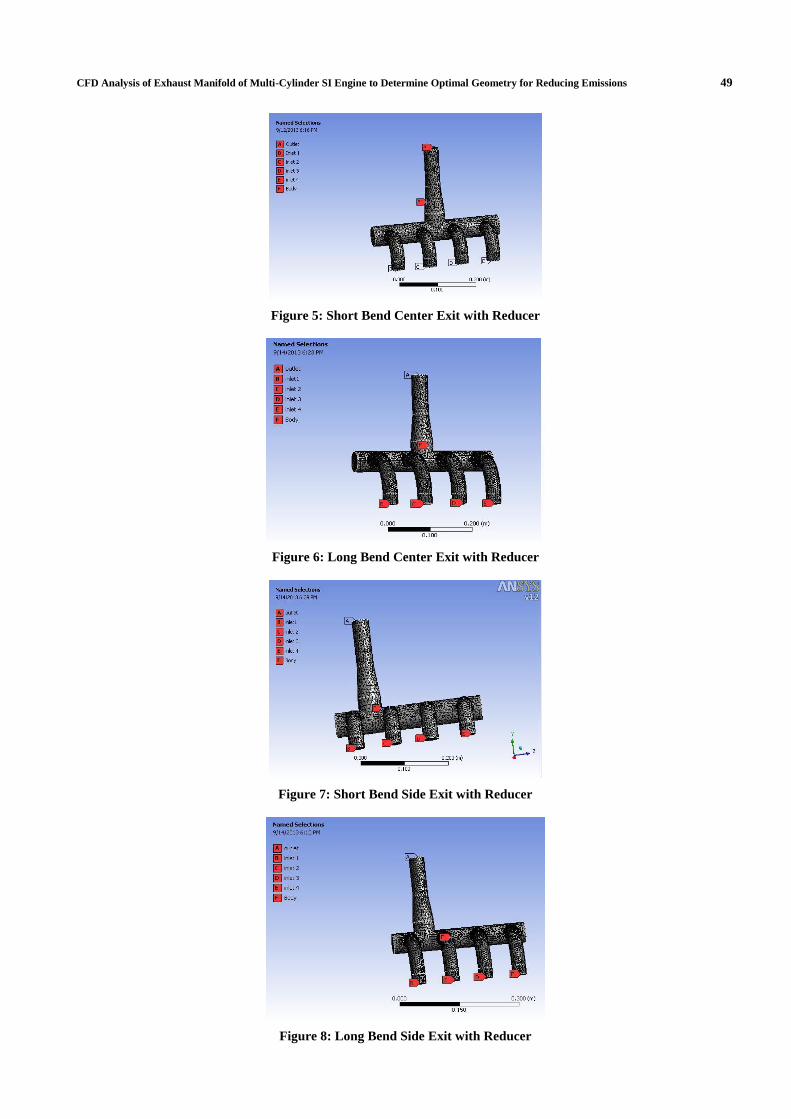
Figure 4: Long Bend Side Exit
CFD Analysis of Exhaust Manifold of Multi-Cylinder SI Engine to Determine Optimal Geometry for Reducing Emissions 49
Figure 5: Short Bend Center Exit with Reducer
Figure 6: Long Bend Center Exit with Reducer
Figure 7: Short Bend Side Exit with Reducer
Figure 8: Long Bend Side Exit with Reducer

50 K. S. Umesh, V. K. Pravin & K. Rajagopal
All models have header length of 335mm. ID and OD of headers is 52.48 mm & 60.3 mm respectively. In Short
Bend models the bend radius is 48 mm and exhaust is on one side. ID and OD of bend were 35.08mm and 42.86mm
respectively.
Long Bend models have bend radius of 100 mm and exhaust is at the centre of header. ID & OD of the bend &
exhaust is 52.48mm and 60.3 mm respectively for both models. Length of the outlet of exhaust manifold was kept at
220mm and flange was attached at the end to connect it to exhaust muffler.
For models with reducer the reducer length was kept 70mm its inlet ID was 52.48mm and outlet ID was 38mm.
the straight length after the reducer was kept 100mm and total length of outlet of exhaust manifold was kept at 220mm and
flange was attached at the end to connect it to exhaust muffler.
Methodology
For all 8 models the mass flow rate of flue gasses was evaluated keeping speed constant at 1500rpm.
These calculations were carried out at different loading condition i.e. 2kg, 4kg, 6kg, 8kg, 10kg and 12 kg. Pressure and
velocity contours were obtained for all eight models at six above mentioned loading conditions. All eight models were
prepared using Solidworks and analysis was carried out using Ansys workbench 12.0.
The results were categorized into groups and comprehensive game matrix was prepared to render a peculiar
performance score to each of these models to finally conclude upon the best possible design.
Material Fluid Properties
Exhaust gas will be considered as an incompressible fluid operating at 230‐280 0C. The material properties under
these conditions are
Table 2: Material Fluid Properties
Material Air + Gasoline
Density (kg/m3) 1.0685
Viscosity (Pa-s) 3.0927 x 10‐5
Specific heat (J/kg-K) 1056.6434
Thermal conductivity (W/m-K) 0.0250
Boundary Conditions
The inlet mass flow rates for different models at six different loading conditions are given below using these mass
flow rates the pressure and velocity contours were obtained.
Table 3: Inlet Mass Flow Rate
Load Inlet 1 Inlet 2 Inlet 3 Inlet 4
2 KG 0.000424 Kg/s 0.000424 Kg/s 0.000424 Kg/s 0.000424 Kg/s
4 KG 0.000848 Kg/s 0.000848 Kg/s 0.000848 Kg/s 0.000848 Kg/s
6 KG 0.001272 Kg/s 0.001272 Kg/s 0.001272 Kg/s 0.001272 Kg/s
8 KG 0.001696 Kg/s 0.001696 Kg/s 0.001696 Kg/s 0.001696 Kg/s
10 KG 0.002120 Kg/s 0.002120 Kg/s 0.002120 Kg/s 0.002120 Kg/s
12 KG 0.002544 Kg/s 0.002544 Kg/s 0.002544 Kg/s 0.002544 Kg/s
The flow was considered to be turbulent. 10% turbulent intensity was taken and K-εmodel was considered with
RNG scheme. The hydraulic mean diameter for all four inlets are given below:
CFD Analysis of Exhaust Manifold of Multi-Cylinder SI Engine to Determine Optimal Geometry for Reducing Emissions 51
Table 4: Inlet Mean Hydraulic Diameter
Boundary Mean Hydraulic Diameter
INLET 1 0.00877m
INLET 2 0.00877m
INLET 3 0.00877m
INLET 4 0.00877m
Outlet pressure was taken as 0atm (Gauge) for all models. The mean hydraulic diameter for outlets of different
models are shown below:
Table 5: Outlet Mean Hydraulic Diameter
Model Mean Hydraulic Diameter
Short Bend Center Exit (SBCE) 0.01302m
Short Bend Side Exit (SBSE) 0.01302m
Long Bend Center Exit (LBCE) 0.01302m
Long Bend Side Exit (LBSE) 0.01302m
Short Bend Center Exit with Reducer
(SBCER) 0.0095m
Short Bend Side Exit with Reducer
(SBSER) 0.0095m
Long Bend Center Exit with Reducer
(LBCER) 0.0095m
Long Bend Side Exit with Reducer
(LBSER) 0.0095m
Engine Specifications
Following engine parameters were considered for calculation of mass flow rate at different loading conditions.
The flow through exhaust manifold was considered density based.
Table 6: Engine Specification
Engine 4 Stroke 4 Cylinder SI Engine
Make Maruti-Suzuki Wagon-R
Calorific Value of Fuel (Gasoline) 45208 KJ/Kg-K
Specific Gravity of Fuel 0.7 gm/cc
Bore and Stroke 69.05 mm X 73.40 mm
Swept Volume 1100 cc
Compression Ratio 7.2 :1
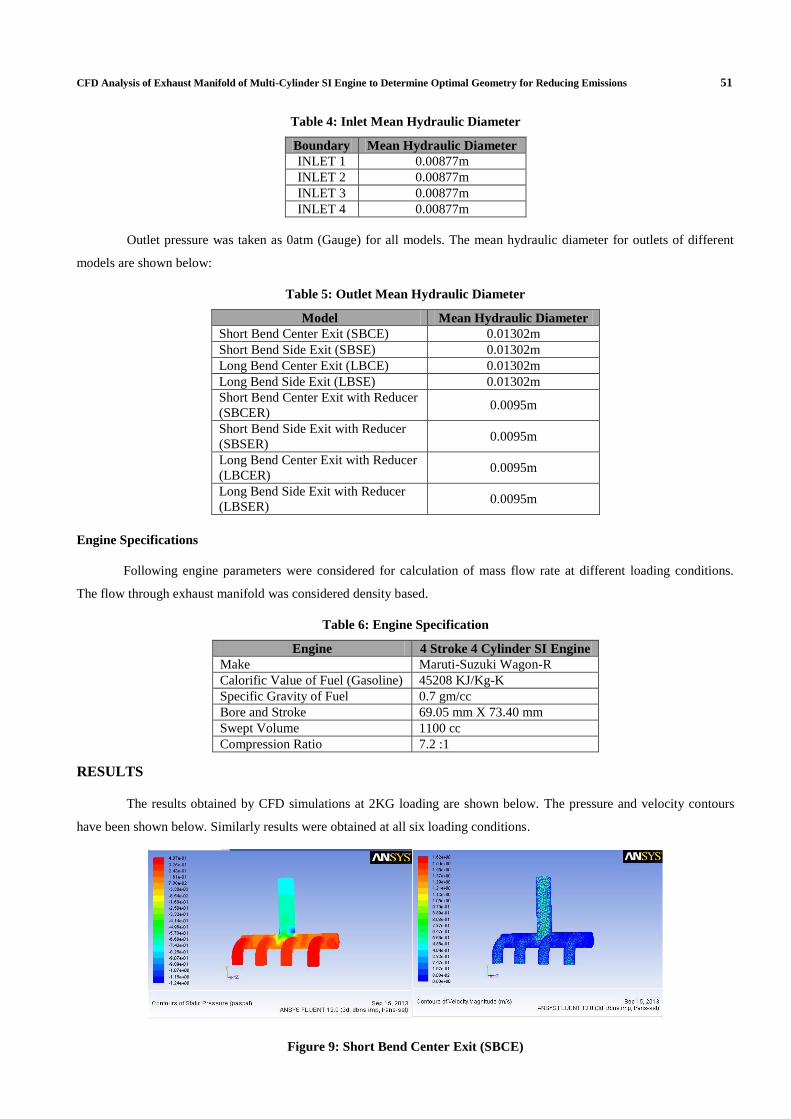
RESULTS
The results obtained by CFD simulations at 2KG loading are shown below. The pressure and velocity contours
have been shown below. Similarly results were obtained at all six loading conditions.
Figure 9: Short Bend Center Exit (SBCE)

52 K. S. Umesh, V. K. Pravin & K. Rajagopal
Figure 10: Short Bend Side Exit (SBSE)
Figure 11: Long Bend Center Exit (LBCE)
Figure 12: Long Bend Side Exit (LBSE)
Figure 13: Short Bend Center Exit with Reducer (SBCER)

CFD Analysis of Exhaust Manifold of Multi-Cylinder SI Engine to Determine Optimal Geometry for Reducing Emissions 53
Figure 14: Short Bend Side Exit with Reducer (SBSER)
Figure 15: Long Bend Center Exit with Reducer (LBCER)
Figure 16: Long Bend Side Exit with Reducer (LBSER)
CONCLUSIONS
The backpressure and exhaust velocity for all the models at all loading conditions are listed below:
Table 7: Backpressure for Different Models in Pascals
2KG 4KG 6KG 8KG 10KG 12KG
SBCE 940 976 1002 1036 1079 1111
SBSE 1020 1071 1098 1113 1132 1172
LBCE 850 863 894 923 984 1012
LBSE 973 1005 1039 1076 1099 1125
SBCER 984 1012 1047 1077 1114 1154
SBSER 1180 1214 1222 1268 1272 1303
LBCER 1037 1080 1112 1154 1187 1201
LBSER 1138 1174 1219 1218 1276 1271

54 K. S. Umesh, V. K. Pravin & K. Rajagopal
The backpressure performance score was evaluated as follows:
Performance Score = x 100
Table 8: Backpressure for Different Models (Performance Score)
2KG 4KG 6KG 8KG 10KG 12KG Score
SBCE 0.904255
319
0.884221
311
0.892215
569
0.890926
641
0.911955
514
0.910891
089
89.90775
74
SBSE 0.833333
333
0.805788
982
0.814207
65
0.829290
207
0.869257
951
0.863481
229
83.58932
253
LBCE 1 1 1 1 1 1 100
LBSE 0.873586
845
0.858706
468
0.860442
733
0.857806
691
0.895359
418
0.899555
556
87.42429
518
SBCER 0.863821
138
0.852766
798
0.853868
195
0.857010
214
0.883303
411
0.876949
74
86.46199
16
SBSER 0.720338
983
0.710873
147
0.731587
561
0.727917
981
0.773584
906
0.776669
225
74.01619
671
LBCER 0.819672
131
0.799074
074
0.803956
835
0.799826
69
0.828980
623
0.842631
141
81.56902
489
LBSER 0.746924
429
0.735093
697
0.733388
023
0.757799
672
0.771159
875
0.796223
446
75.67648
568
Table 9: Exhaust Velocity for Different Models in Meter per Second (m/s)
2KG 4KG 6KG 8KG 10KG 12KG
SBCE 17.03 18.1 18.7 19.52 21.45 23.01
SBSE 18.1 18.6 19.1 20.2 21.6 23.5
LBCE 20.22 21.33 22.07 23.52 23.98 24.77
LBSE 18.71 18.92 19.23 20.12 22.21 23.65
SBCER 17.7 17.79 18.22 19.86 21.1 23.89
SBSER 16.8 17.12 18.6 19.9 21.76 23.92
LBCER 17.3 18.67 19.54 21.96 23.65 24.71
LBSER 17.9 18.01 19.1 20.65 21.86 23.98
The exhaust velocity performance score was evaluated as follows:
Performance Score = x 100
Table 10: Exhaust Velocity for Different Models (Performance Score)
2KG 4KG 6KG 8KG 10KG 12KG Score
SBCE 0.842235
41
0.848570
089
0.847304
033
0.829931
973
0.894495
413
0.928946
306
86.52472
04
SBSE 0.895153
314
0.872011
252
0.865428
183
0.858843
537
0.900750
626
0.948728
3
89.01525
353
LBCE 1 1 1 1 1 1 100
LBSE 0.925321
464
0.887013
596
0.871318
532
0.855442
177
0.926188
49
0.954784
013
90.33447
12
SBCER 0.875370
92
0.834036
568
0.825555
052
0.844387
755
0.879899
917
0.964473
153
87.06205
608
SBSER 0.830860
534
0.802625
41
0.842772
995
0.846088
435
0.907422
852
0.965684
296
86.59090
871
LBCER 0.855588
526
0.875293
015
0.885364
749
0.933673
469
0.986238
532
0.997577
715
92.22893
343
LBSER 0.885262
117
0.844350
68
0.865428
183
0.877976
19
0.911592
994
0.968106
581
89.21194
575

CFD Analysis of Exhaust Manifold of Multi-Cylinder SI Engine to Determine Optimal Geometry for Reducing Emissions 55
Table 11: Over all Performance Score
Model
Pressure
Performance
Score
Velocity
Performance
Score
Average
Performance
Score
SBCE 89.9077574 86.5247204 88.2162389
SBSE 83.58932253 89.01525353 86.30228803
LBCE 100 100 100
LBSE 87.42429518 90.3344712 88.87938319
SBCER 86.4619916 87.06205608 86.76202384
SBSER 74.01619671 86.59090871 80.30355271
LBCER 81.56902489 92.22893343 86.89897916
LBSER 75.67648568 89.21194575 82.44421571
Figure 17: Backpressure for Various Models at Various Loads
Figure 18: Velocity for Various Models at Various Loads
Thus we conclude that LBCE model is the best possible designs for exhaust manifold from emission point of
view.
REFERENCES
1. PL. S. Muthaiah, Dr. M. Senthil Kumar, Dr. S. Sendilvelan “CFD Analysis of catalytic converter to reduce
particulate matter and achieve limited back pressure in diesel engine”, Global journal of researches in engineering
A: Classification (FOR) 091304,091399, Vol.10 Issue 5 (Ver1.0) October 2010.
2. P. R. Kamble and S.S. Ingle “Copper Plate Catalytic Converter: An Emission Control Technique”, SAE Number
2008-28-0104.
3. Eberhard Jacob, Rheinhard Lammermann, Andreas Pappenherimer, and Diether Rothe Exhaust Gas After
treatment System for Euro 4: Heavy Duty Engines – MTZ 6/2005.
4. Jacobs, T., Chatterjee, S., Conway, R., Walker, A., Kramer, J. and K. Mueller-Haas, Development of a Partial
Filter Technology for Hdd Retrofit, Sae Technical Paper 2006-01-0213.

56 K. S. Umesh, V. K. Pravin & K. Rajagopal
5. C. Lahousse, B. Kern, H. Hadrane and L. Faillon, “Backpressure Characteristics of Modern Three-way Catalysts”,
Benefit on Engine Performance, SAE Paper No. 2006011062,2006 SAE World Congress, Detroit, Michigan ,
April 36, 2006 [1] M.B. Beardsley et al.,Thermal Barrier Coatings for Low Emission, High Efficiency Diesel
Engine Applications” SAE Technical Paper 1999-01-2255.
6. Rajesh Biniwale , N.K. Labhsetwar, R. Kumar and M. Z. Hasan, “A non-noble metal based catalytic converter for
two strokes, two-wheeler applications”, SAE Paper No. 2001011303, 2001.
7. G. Muramatsu, A. Abe, M. Furuyama, “Catalytic Reduction of Nox in Diesel Exhaust”, SAE 930135, 1993.
8. John B. Heywood, Internal Combustion Engine Fundamentals (Tata McGrah Hill).
9. Nitin K. Labhsetwar, A. Watanabe and T. Mitsuhashi, “Possibilities of the application of catalyst technologies for
the control of particulate emission for diesel vehicles”, SAE Transaction 2001, paper no. 2001280044.
10. K.S. Umesh, V.K. Pravin and K. Rajagopal “CFD Analysis and Experimental Verification of Effect of Manifold
Geometry on Volumetric efficiency and Back Pressure for Multi-cylinder SI Engine” International Journal of
Engineering & Science Research IJESR/July 2013/ Vol-3/Issue-7/342-353