cfa institute research challenge challenge/romgaz... · cfa institute research challenge hosted in...
TRANSCRIPT

CFA Institute Research Challenge
Hosted in Romania The Bucharest University of Economic Studies

CFA Research Challenge | 21 Feb 2015
1 | P a g e
S.N.G.N RomGaz S.A. | BVB symbol: SNG | LSE symbol: SNGR
Action: HOLD Analysts: Theodora Alexe, Carmen Dobrescu, Carmen Dima, Cosmin Popa
Radu Lupu (Faculty Advisor), Sorin Dumitrescu, CFA (Industry Mentor) Faculty of International Business and Economics, ASE Bucharest
Price (BVB Close 18 Feb 2015): 34.01
End-2015 target price: 38.5
Report currency: RON
Sector: Oil and Gas/Romania
Key stock statistics (Thomson Reuters, BSE, LSE, company reports)
52 weeks Price Range (RON/sh) 32.1- 36.4 Market cap.(£m) 222.78 Debt/Equity 0 P/NAV 0.3% Average daily volume 255,252 Free Float 20% Gearing 0 DPS 2.57 Shares Outstanding (m) 385.4 Beta 0.85 EPS 0.88 Closing price BVB 34.01 Market cap.(RON) 13,069 NAV (RON) 9736.6 P/E ratio 7.73 Closing price LSE £8.5
Highlights Price performance chart
Romgaz is the leading natural gas supplier in Romania, involved in exploration and production of natural gas, storage and technological transport. The regulated market protects its competitive position, while strategic partnerships with international players sustain its stronghold in both local and external operations.
As a state-owned company, Romgaz performance depends on positive macroeconomic outlook and industry trends. In the context of declining global and regional gas reserves, Romania’s exposure to Russia as its main gas supplier puts it at risk, though the risk for Romgaz is capped due to production and sales operations being focused extensively on the local market. In addition, the development of the Black Sea area and AGRI interconnector are an opportunity for Romgaz in the mid- and long-term.
Source: Bucharest Stock Exchange
Financials Valuation Investment Risk
2014 2015e
Profitability
Profit margin 36.7% 31.1%
Dividend yield 8.4% 8.5%
Liquidity
Working capital turnover 5.44 5.00
Solvency
Total Debt to Total Assets 0.0% 0.0%
Free Cash Flow 1,448 928
Valuation
Price to Earnings 8.7 7.3
The 2014 financial profitability ratios highlight an impressive 42.11% y-o-y increase in earnings before interest and taxes. This high profit margin of 36.7% reflects the effect of the gas price liberalisation for non-household consumers.
The relatively high dividend yields of 8.5% in 2015e compared to Romgaz peers would offer potential investors a significant return for their investment.
The capital structure of Romgaz is underleveraged, with an atypical zero debt level. On the upside, Romgaz can attract more debt in the future with no risk of default. However, this implies lower returns on equity which can hamper the competitive advantage of the company.
The actual free cash flows for 2014 are significantly high at 1,448 million RON, enabling Romgaz to halt the production decline and to pursue other opportunities that enhance shareholders’ value.
Given limited risk exposure and good business development prospects, we recommend HOLD on Romgaz, with a 12-13% upside on the current stock price. Countering production decline, developing new resources and continuing to establish key partnerships in exploitation will affect the prospects of the company further on.
Financials and valuation are indicative of a HOLD recommendation. We established a target price of RON 38.50, a 13% growth from the current price of RON 34.00 and expect low stock price volatility due to the price liberalization calendar. Our valuation approach relies on Discounted Cash-Flow Model, Net Asset Value and Multiples model. The latter is computed on the stock market trading of peer companies.
The main share price triggers are the reshuffle of the tax system, the gas demand and the depressed oil prices which act as a benchmark for import gas.
One major risk for the company is represented by the limited exploitable reserves, which cause the gas production of Romgaz to decline with more than 1 % per year. The company’s profitability for the forthcoming years will also be influenced by a new taxation system that could include higher royalty rates.
Key strengths relate to the intent of the company to mitigate financial risks through the introduction of a risk management department, to the significant work interest in the Black Sea offshore discoveries and to the 25% interest in the Azerbaijan-Georgia-Romania Interconnector regional project.
With a high probability of materializing, operational risks represent a serious concern for the company. However, regulatory risks should not be overlooked by the risk department as they may have a significant impact on the profits of Romgaz.
Source: team estimation Source: team assessment
0
500
1000
1500
2000
2500
3000
30
31
32
33
34
35
36
37
11
-Dec-1
3
25
-Dec-1
3
8-J
an
-14
22
-Ja
n-1
4
5-F
eb
-14
19
-Fe
b-1
4
5-M
ar-
14
19
-Ma
r-1
4
2-A
pr-
14
16
-Apr-
14
30
-Apr-
14
14
-Ma
y-1
4
28
-Ma
y-1
4
11
-Ju
n-1
4
25
-Ju
n-1
4
9-J
ul-
14
23
-Ju
l-1
4
6-A
ug-1
4
20
-Aug
-14
3-S
ep-1
4
17
-Sep
-14
1-O
ct-
14
15
-Oct-
14
29
-Oct-
14
12
-Nov-1
4
26
-Nov-1
4
10
-Dec-1
4
24
-Dec-1
4
7-J
an
-15
21
-Ja
n-1
5
4-F
eb
-15
High-Low Volume (rhs) 10-day MA 30-day MA
-10%
0%
10%
D-13 J-14 F-14 M-14 A-14 M-14 J-14 J-14 A-14 S-14 O-14 N-14 D-14 J-15 F-15
Returns
13.40%
8.30%
18%
30
32
34
36
38
40
42
44
46
48
DCF Peers NAV
Po
ten
tia
l
Pri
ce
Valuation method
Target Price Current price Upside
Pro
ba
bil
ity
Impact
FinancialRisks
OperationalRisks
RegulatoryRisks
Environmental Risks
CorruptionRisks
GeneralCountryRisks

CFA Research Challenge | 21 Feb 2015
2 | P a g e
Business Description
Company info
Address: Piata Constantin Motas, No. 4, Medias, Sibiu; Romania, 551130
Website: www.romgaz.ro
FTSE Sector: Oil &Gas Producers
Shares listed on:
Bucharest Stock Exchange(BVB) since 12/11/2013, code: SNG
London Stock Exchange (LSE) since 12/11/2013, code: SNGR
ISIN number: ROSNGNACNOR3
Share denomination: RON
Shareholder structure
Source: Romgaz
Projects Companies
Participation agreement for exploration and exploitation of the Black Sea area
OMV Petrom and ExxonMobil
Building a natural gas compression unit in Roman
SC Sutech SRL Medias, SC Condmag SA and SC Inspet SA
Construction of a drying station and a gas compressor
SC Condmag SA and SC Inspet SA
Natural gas exploration and production are the core business of the company
The focus of the company is on exploitation of current reserves and discovery of new sites. Romgaz currently operates 3257 gas producing wells which access 147 commercial fields, as well as 29 exploration wells in nine on-shore exploration blocks. As of June 2013, the company held net proved reserves of 62.1 billion m
3 of gas and additional net probable reserves of 13.2
billion m3. The use of modern specialized software and specific surface exploration methods for
identification of areas with accumulations of hydrocarbon led to a maximum reserves replacement ratio of 298% in 2012. Going forward annual investments of approximately RON 600 million have been announced for projects aimed at discovering new gas reserves and enhancing production output through improvement of equipment performance and redevelopment of mature fields.
Strategic partnerships sustain Romgaz’s stronghold in local and international operations
Romania has the largest natural gas market in Central and Eastern Europe and was the first country to use natural gas for industrial purposes, allowing Romgaz to develop early expertise and transform it into a competitive advantage. To sustain its advance in know-how, Romgaz has established strategic partnerships covering 15 petroleum concessions in Romania. The company has joint-ventures with Wintershall in the exploration and development of the RG 03 Transilvania South Block, with Falcon Oil & Gas in the exploitation of the Brodina and Cuejdiu Blocks, with Amromco Energy in the rehabilitation of 11 gas fields and with Schlumberger for the rehabilitation of Laslău Mare gas field. Moreover, as of 2008 Romgaz has been expanding internationally becoming co-titleholder of petroleum rights and obligations in 3 blocks from Slovakia(25 % interest share) and 2 blocks from Poland(30% interest share)
Romanian state holds 70%
A 15% stake in Romgaz was offered through the October 2013 IPO on both Bucharest Stock Exchange through shares listed and on London Stock Exchange through Global Depository Receipts (GDRs). The IPO made Romgaz the most valuable state-owned company in Romania and was therefore a success: the offer was oversubscribed nearly seven times, the share price of the sale – at RON 30/unit, was close to the maximum offer price of RON32/unit, and as a result Romgaz raised EUR 390 million. As of September 30, 2014 the shareholder structure entitled a majority stake of 70,01% to the Romanian State through the Ministry of Economy, 10% to Fondul Proprietatea S.A. which works as a Romanian investment fund, 17,69% to various legal persons and 2,30% to natural persons.
A long-term strategy to counter Romgaz’s main challenges
The decline in natural gas production, the costs of discovering new resources and the difficulty of establishing key partnerships for exploitation are the main challenges that Romgaz plans to overcome. Finding new proven reserves is crucial to maintain investors’ confidence on the long term. Romgaz’s already proven reserves of natural gas will ensure internal production for the following 12 to 15 years.
The company has planned to partner with strategic players, in accordance with its expansion strategy. As it targets development in the Black Sea, Romgaz signed a participation agreement with OMV Petrom and ExxonMobil whereby it will hold a 10% of the exploration and exploitation of the area. The exploration of the Black Sea perimeters could start in 2019 - 2020.
To further strengthen operations, Romgaz is building new assets to enhance local output. The companies SC Sutech SRL Medias, SC Condmag SA and SC Inspet SA will build a natural gas compression unit in Roman in the near future for Romgaz, the contract being valued at 58.4 million RON (13,2 million Euro). Another significant project which will be done by SC Condmag SA and SC Inspet SA is the construction of a drying station and a gas compressor near the gas deposit in Sarmasel, Mures County. The contract is valued at 237.5 million RON (53.5 million Euro) and will be completed in 24 months.
Industry Overview and Competitive Positioning
Consumer confidence
Source: Romgaz
Macroeconomic Outlook
Consumer confidence is improving steadily
As the world financial crisis began to be perceived in Romania starting with the year 2008, the consumer confidence dropped because population saved more and spent less. Therefore, the gas consumption in Romania maintained the decreasing trend for the following years. On the above graph we can observe a tight relationship between consumer confidence and household consumption. With a correlation coefficient of 59%, we can state that consumer confidence tends to follow the trend of household consumption as it is lower during an economic decline.
Romania’s GDP projection is on uptrend through 2019, generating growth also in the gas industry
In March 2014 Fitch re-affirmed Romania’s rating at BBB- with stable outlook. The rating agency believes that Romania’s public finances are under control and considers that in comparison to 2013 the GDP growth is more balanced in 2014 because of the stronger contribution of domestic demand.
In 2014 the GDP recorded a 2.3% increase and according to IMF and European Commission forecasts Romania’s GDP is estimated to grow by 2.5% in 2015 and by 2.9% in 2016. With a developing economy and an increasing in GDP, the gas industry is flourishing and thus triggers the need for more energy in both the industrial and household sector. In Romania, household consumption is indeed more significant than the industrial one, since there are fewer alternatives in the market.
Romanian State,
70.01% Fondul Proprietatea S.A., 10.00%
BNY Mellon DRS, 5.37% Legal
persons, 12.58%
Natural persons, 2.04%
-70
-60
-50
-40
-30
-20
-10
0
10
20
30
Se
p-2
00
7
Mar-
200
8
Se
p-2
00
8
Mar-
200
9
Se
p-2
00
9
Mar-
201
0
Se
p-2
01
0
Mar-
201
1
Se
p-2
01
1
Mar-
201
2
Se
p-2
01
2
Mar-
201
3
Se
p-2
01
3
Mar-
201
4
Se
p-2
01
4
Industrial production - 12 months
Consumer confidence

CFA Research Challenge | 21 Feb 2015
3 | P a g e
0
20
40
60
80
100
120
19
76
19
78
19
80
19
82
19
84
19
86
19
88
19
90
19
92
19
94
19
96
19
98
20
00
20
02
20
04
20
06
20
08
20
10
20
12
20
14
Historical Prices Brent Crude Oil ($/bbl)
Source:BP statistical review
Proved Reserves Romania
Source: Romgaz
Comsumption cyclicality and seasonality
Source: Romgaz
However, with a growing economy and an increasing GDP projected throughout 2019, the gas industry in Romania is looking toward more demand for energy in both the industrial and household sectors.
Inflation, unemployment and the evolution of government debt are expected to prop industry growth
Government debt peaked in 2014 at around 40% of GDP; the gap is expected to be at 36.5% of GDP in 2019. Lower government debt, coupled with increasing GDP, are positive developments for the Romanian economy and may reflect in industry trends as well. Nonetheless, several other factors influence the stock evolution of companies in the oil and gas industry, which we shall review further in this document.
The consumer price index was constantly in [-1%; +1%] variation interval, except for 2011 when inflation reached a record -3%. There were two causes for this record low: i) the impact of VAT increase in 2010 faded, ßand ii) there was a huge deflation on food segment, which had not been anticipated. Prospects for 2015 are that inflation will increase again reaching a level of 3.4% which will also be reflected in higher energy prices. Unemployment rate had a peak in 2013 (7.1%), and started to decrease in 2014 (7.0%). The prospects are that it will be stable at about 7% from 2015 onwards.
Focus on the local market protects Romgaz to a certain degree from geopolitical events
The oil price is at its lowest price since 2008, affecting the stock price of companies from the oil and gas industry. The risks have increased in part due to the geopolitical events and turmoil in Middle East and Russia-Ukraine. Positioned close to the Ukraine and Russia, Romania is influenced by the evolution of the current conflict. However, unlike a company with import-export activities, Romgaz runs its main operations within country borders: gas extraction, production and sales are confined to Romanian territory and consumers, and thus the company stock price is not significantly dependent on events outside the country.
Industry Analysis
Black Sea gas reserves are an opportunity in the context of global and regional reserves
Global natural gas reserves are being depleted at a fast rate. In the year 2000, remaining discovered reserves of natural gas were estimated to last 58 years, assuming constant production; in 2013, accounting for new discoveries and ongoing production, remaining reserve duration reduced to 55 years. This highlights the increased efficiency of current discovery techniques and the intense activity in the gas industry. The global proved natural gas reserves at the end of 2013 are concentrated in Middle East and C.I.S., with Western Europe holding the smallest share of resources.
The energy industry of the European Union is predominantly dependent on imports, thus making the European Union the greatest energy importer worldwide. Import weights vary with the types of natural resources, so that 88% is connected with oil imports and 66% represents the import level for natural gases. The annual consumption level of natural gas in the European Union is approximately 440 billion m
3. With fewer supply sources of natural gas, the fulfillment of European
natural gas needs will remain difficult and costly. Russia currently supplies 41% of import needs, with Norway closely following at 32%. According to European Commission forecasts, the import dependency of European Union countries will rise to 73% of consumption in 2030 mainly because of the depletion of internal resources, the stricter environmental protection policies, the closing down of nuclear power stations and the strong public opposition to shale gas exploitation. Moreover, alternative sources of supply are highly unlikely to change the future energy map since complex and costly transportation systems need to be built in countries with great political uncertainty such as Azerbaidjan, Turkmenistan, Israel, Iran or Iraq.
South-East Europe and hydrocarbon accumulations in the Black Sea
Countries from SEE are highly dependent on gas imports from a sole supplier – Russia – which are further distributed through Ukraine’s pipelines. Since 17% of Europe’s annual gas consumption is satisfied through deliveries made from Russia through Ukraine’s pipelines, the recent Russia-Ukraine war presented serious threats to the European energy security. The conflict makes countries vulnerable to political and price conflicts that can lead to a halt in natural gas provisions as it happened in 2006 and 2009. A stress test ran by PricewaterhouseCoopers showed that Bulgaria and Macedonia would be highly affected if the Ukraine gas transportation system were disrupted, and that Romania, Greece, Serbia, Bosnia and Hungary would be less influenced. In such a situation, the wholesale gas prices in Europe would rise. Moreover, if Russia interrupted its gas exports, most European countries would suffer. Therefore, the Black Sea represents a new area of opportunity for natural gas exploitation. This area will increase proven reserves of Romania, Ukraine, Russia, Georgia, Turkey and Bulgaria. This is regarded with extreme interest, given the limited reserves of conventional natural gas in SEE and the currently unevaluated potential of shale gas in the region. The reserves are estimated at 2 billion boe in the West side of Black Sea and at 5 billion boe in the East.
Industry cyclicality and seasonality
The prices of natural gas are determined by supply and demand factors and are intrinsically linked to oil prices. Due to the fact that natural gas is used primarily for heating, it has an incredibly seasonal market and prices are usually dependent upon weather patterns and ultimately upon demand levels. Romania has a seasonal pattern with consumption reaching up to 20 TWh in winter months and approximately 5 TWh in summer months. This pattern will consequently influence prices for the newly liberalised industrial market, making Romgaz a good stock acquisition when prices are low in summer months.
0
0.1
0.2
0.3
0.4
0.5
0.6
0.7
19
80
19
82
19
84
19
86
19
88
19
90
19
92
19
94
19
96
19
98
20
00
20
02
20
04
20
06
20
08
20
10
20
12
0.00
5.00
10.00
15.00
20.00
25.00
Ja
n-1
2
Mar-
12
May-1
2
Ju
l-12
Se
p-1
2
Nov-1
2
Ja
n-1
3
Mar-
13
May-1
3
Ju
l-13
Se
p-1
3
Nov-1
3
Ja
n-1
4
Mar-
14
May-1
4
Ju
l-14
Se
p-1
4
TW
h

CFA Research Challenge | 21 Feb 2015
4 | P a g e
The evolution of natural gas production and consumption in Romania
Source: Romgaz
Oil & Gas stocks price performance vs. brent crude oil price (100 = 1 Jan 2014)
Source: Thomson Reuters Datastream, team calculations
Household sector-Romgaz and EU prices
Source: Romgaz
Non-household sector-Romgaz and EU prices
Source: European Commission
Internal production supplies 85% of Romanian gas consumption, which is expected to remain stable over the next years
Although Romania is one of the world’s main energy producers and the only country in the region with onshore resources, it became a net importer of gas from Russia in the 1970s when production started to decline. Consequently, the country’s energy security is threatened by the undiversified sources of external supply. Currently, Romania exploits 450 deposits of oil and natural gas, out of which 255 are exploited by OMV Petrom and 153 by Romgaz. These two companies are the main producers of natural gas and together account for approximately 97% of total domestic production: Romgaz (6 bcm/year) and OMV Petrom (5.2 bcm/year). Other small independent producers (leased gas fields) are Depomures, Amromco Energy, Amgaz. The country has approximately 150 billion m
3 proven reserves of natural gas that at a level of 11
billion m3 in annual production and at an 80% rate of reserve recovery could be exhausted in 12-
15 years. One already implemented solution to stop production decrease is the redevelopment of mature fields. The exploitation of the Black Sea natural gases is a long-term strategic project that requires massive investments; OMV Petrom-ExxonMobil, Petroceltic and Sterling Resources are some companies that have already invested in research and discovery.
Though potential resources need to be properly appraised, Romania considers developing interconnectors with neighbouring countries, improving the underground storage capacities and liberalizing the gas prices for both industrial and household consumers in order to integrate with the regional and European gas market. For example, the interconnector Giurgiu-Ruse between Romania and Bulgaria is waiting to be completed, the construction of interconnector Ungheni-Iasi between Romania and Moldova started in 2013, the Arad-Szeged interconnector between Romania and Hungary was completed in 2010 but operates only to bring import gas from Hungary, and the Mokrin-Arad gas interconnection between Serbia and Romania is to be approved. The possibility of engaging in exports from 2020 onwards, when the Romanian gas market will also be fully liberalized, is alluring. However, the importance of these interconnectors is undermined by the fact that none of the before mentioned countries are gas producers, and the source of imported gas will therefore remain the same. Demand for natural gas is mainly influenced by weather conditions and by national energy-efficiency programs which introduce new technologies for renewable energy production. Natural gas demand in Romania has followed the European trend of lower consumption levels during the financial crisis and slight decreases since 2012. The Q3 2014 results of Romanian gas companies reveal that there is an increase of approximately 7% y-o-y of gas quantities sold. The pressures coming from the gas price liberalization in Romania are not expected to diminish consumption levels.
Prices to converge to European levels
The liberalization of the Romanian gas market is expected to deliver more competitive and therefore efficient and cheaper energy. The wholesale market for natural gas is liberalized since 2015, but the lack of trading has left the price at the 89.4RON/MWh. The current European spot prices of 19-21 EUR/MWh have been decreasing in 2014. The US LNG prices pushed gas prices lower, and the recent conflict between Ukraine and Russia pushed oil prices at a five-year low, below $50 a barrel which will correspondingly account for a fall in gas prices. Import prices from Russia usually range from 100 to 130 RON/MWh. Eligible, non-residential Romanian customers will have to negotiate contracts with gas distribution companies until July, 2015 and thereafter the gas prices will be based purely on market mechanisms. Since gas distribution companies have greater bargaining power, the maximum price level for the wholesale market is set around 92 RON/MWh. For residential customers the current regulated market requires a price of 53.3RON/MWh, which is due to change once the new price increase calendar is made public on July, 2015. The gas market for households will be fully liberalized by mid-2021.
The local taxation framework will be modified as of 2016
The current Romanian taxation system will be revised as of January 1st, 2016 and the new
system will be maintained for the coming 10 to 15 years. The government plans to increase energy royalties at a level which is closer to the one practiced by other countries in the European Union. The current level of royalties paid for natural gas development and exploration of production in designated blocks ranges between 3.5% and 13% of the entire value of production, depending on the size of the reservoir. The Government has not changed the royalties from 2004, when it has signed an agreement with Petrom, currently owned by the Austrian group OMV, in which they set the value of the royalty for the next 10 years. The average royalty paid in 2014 by Romgaz was 7% and it is predicted to remain at the same value for 2015.
The standard corporate profit tax of 16 % is applicable for petroleum operators. Furthermore, a "construction tax" of 1.5% for power plants, platforms for productions and gas wells was introduced in 2014. The tax is computed as a percentage from the accounting value of these constructions from which the value of buildings is deducted. This tax will decrease to 1% in 2015. There is also a windfall tax set at 60% for gas producing companies which was introduced in 2013 and applies to the additional revenues that result from gas price liberalization. The percentage applied for additional revenues is expected to change from 2016.
0
5
10
15
20
25
30
35
40
45
19
70
19
73
19
76
19
79
19
82
19
85
19
88
19
91
19
94
19
97
20
00
20
03
20
06
20
09
20
12
consumption production
0
20
40
60
80
100
120
01
-Ja
n-1
4
01
-Fe
b-1
4
01
-Ma
r-1
4
01
-Apr-
14
01
-Ma
y-1
4
01
-Ju
n-1
4
01
-Ju
l-1
4
01
-Aug
-14
01
-Sep
-14
01
-Oct-
14
01
-Nov-1
4
01
-Dec-1
4
01
-Ja
n-1
5
01
-Fe
b-1
5
Brent oil
Romgaz
Frontier markets
0.00
10.00
20.00
30.00
40.00
50.00
60.00
2013 s1 2013s2 2014s1 2014s2
Romgaz (EUR/Mwh) EU-28 (EUR/Mwh)
0.00
5.00
10.00
15.00
20.00
25.00
30.00
35.00
40.00
2013 s1 2013s2 2014s1 2014s2
Romgaz (EUR/Mwh) EU-28 (EUR/Mwh)

CFA Research Challenge | 21 Feb 2015
5 | P a g e
Forces analysis
5 = most favorable to Romgaz Source: team analysis ROE peers comparison
Source: S&P Capital IQ, team calculations ROA peers comparison
Source: S&P Capital IQ, team calculations
Competitive positioning The two main suppliers of natural gas that dominate the Romanian market with a compound 97% share are Romgaz and OMV Petrom. As the industry is highly regulated by ANRE, it is very hard for a new large competitor to arise in the gas market. Moreover, gas is a necessary product for both households and industrial consumers, thus for the moment, Romgaz and OMV Petrom have the power to influence the price. On the other hand, there are potential upcoming concerns for these two big companies. Even though natural gas is irreplaceable in the market, renewable energy might be a threat in the future. Furthermore, when gas price will be fully liberalized in Romania, the consumers’ impact on price will increase, as price will be determined by market forces of supply and demand. SWOT Analysis Despite new potential threats and weaknesses the company may face in the long run, Romgaz needs to innovate and to take advantage of its strengths and of the opportunities of the market in order to mitigate them. The proven reserves of gas onshore are not encouraging for Romgaz, thus the company must consider alternatives. The interest the company has in the Black Sea offshore reserves and the AGRI interconnector project developed with neighboring countries must materialize and account for future production operations. The company’s weaknesses will affect its profitability over the next years, when actual reserves of Romgaz will reduce. Nevertheless, the alignment with EU system and prices will aid the company to maintain or even increase its revenues due to higher prices applied to both industrial and household consumers. Position in the peer group In terms of industry profitability for the period 2010-2014, the relative valuation of peers emphasizes the striking evolution of Romgaz ROA from a 2.85% value which was below the lower quartile returns in 2010, ranking Romgaz among the poorest performers on a global scale, to upper quartile returns in 2014 with a ROA of around 13%. This recent substantial increase in net profit margins y-o-y have also set the Romanian natural gas leader Romgaz ahead of its national peer, OMV Petrom, which in 2014 had a 50% decrease in profit margin and a ROA of approximately 5%. In terms of ROE, Romgaz traditionally encompasses insignificant debt in its capital structure and therefore its leverage ratio calculated as total assets to total equity is historically close to 1.1. This unique feature of the 70%-state-owned gas company has accounted for lower ROE when compared with its industry peers. However, Romgaz is still an impressive story due to the jump from the 3.24% ROE in 2010 to the 14.43% figure in 2014. Even underleveraged, it offers shareholders a higher profitability compared to its national competitor OMV Petrom which in 2014 registered a 7.8% ROE. Globally, Romgaz breaks from the lower quartile to the upper quartile for ROE based solely on an increased profit margin due to a sound business model. The twofold geographical segmentation of the oil and gas industry for mature companies highlights the soundness of Romgaz in relation to its regional and Russian peers. Moreover, the prominent discrepancy between the financials of Romgaz and those of the largest global players in the oil and gas market is mainly a result of the considerable difference in proven oil and gas reserves. Whilst the largest American oil and gas producer Exxon Mobil boasts around 71,860 bcf gas reserves due to the innovative hydraulic fracturing, Romgaz possesses approximately 4.2% of this amount. Financial Valuation In terms of financial valuation, Romgaz has the lowest 2015e EV/EBITDA multiple compared with its regional peers, at 3.67, which implies that it is traded relatively cheap compared with the wider market. At the industry level, its Russian peers have a better earning potential of the business than Romgaz, with the average EV/EBITDA at 3.08. The 2015e P/E ratio for Romgaz, 7.73, is again closer to the average equity multiplier for the Russian competitors, and significantly lower than the average regional ratio. This implies that Romgaz has less room for higher earnings in the future, compared for example with the regional peers Statoil or Repsol YPF, but also that current investor demand for a company share is low. Therefore, Romgaz has an undervalued stock with a P/E well below the production and exploration industry average of 18.78, while still providing sound operational profits. EBITDA Growth Valuation and Income Growth Valuation Over a 3-year period, Romgaz has a compound annual growth rate for EBITDA that positively sets it apart from the regional trend of declining earnings. The 10.66% growth is also well above the investment performance of the most expensive global oil and gas stocks, and above the average industry rate of 4%. Combined with a below industry-average EV/EBITDA, this profitable growth of Romgaz indicates that it has an upside potential for its share price that has not yet been traded and unlocked. The 12.6% compound annual growth rate for net income emphasizes the exceptional profitability of Romgaz over a 3-year period as opposed to the sinking gains of regional and global companies that are a result of historical low oil prices and depressed gas prices. Romgaz is advantageously isolated from the global trend of falling prices until 2021e when the domestic gas market is set to efficiently respond to market forces of supply and demand. The discrepancy between the industry average for 3-yr net income CAGR of -9% and the average 3-yr CAGR for EBITDA of 4% reveal the effects of taxation on oil and gas profits. Romgaz benefits from a mild taxation regime in comparison to its peers, fact which could account for its stronghold position.
1
2
3
4
5
Threat ofNew
Entrants
Bargaining Power
ofSuppliers
Competition in theIndustry
Bargaining Power
of Buyers
Threat ofSubstitut
eProducts
-10.00%
-5.00%
0.00%
5.00%
10.00%
15.00%
20.00%
25.00%
30.00%
2010 2011 2012 2013 2014e
Romgaz ROE
-5.0%
0.0%
5.0%
10.0%
15.0%
20.0%
25.0%
2010 2011 2012 2013 2014e
Romgaz ROA

CFA Research Challenge | 21 Feb 2015
6 | P a g e
40
50
60
70
80
90
100
20
12
20
13
20
14
20
15
e
20
16
e
20
17
e
20
18
e
20
19
e
20
20
e
20
21
e
RO
N/M
Wh
Households Industrials
Average price
Hydrocarbon gas average reserve replacement ratio
Source: S&P Capital IQ, Raiffeisen
Azerbaijan-Georgia-Romania Interconnector AGRI (Interconnector Azerbaijan-Georgia-Romania-Hungary) gives the possibility for transport of Azerbaijan LNG to the Black Sea, where new regasification and liquefaction terminals will be built and will further supply gas for the European market. Romgaz has a 25% interest in the AGRI project along with the other countries national gas companies (Georgian Oil and Gas Corporation, MVM Hungarian Electricity and State Oil Company of the Republic of Azerbaijan). A feasibility study has been conducted and concluded in December 2014 – its conclusions are promising for the further potential achievements which the project will reach. The main benefit for Romania and implicitly Romgaz is that it can ensure a part of its domestic consumption in the current context of gas reserves depletion. The project represents an alternative for the import of Russian Gas. Romgaz boasts a competitive reserve replacement ratio of 173% over the last three years, which sets it among the top performers in terms of stopping the natural reserves depletion process. Moreover, the latest financial report on Romgaz stresses the successful approach of freezing natural gas production decline at the 5.66 billion cm for the fourth consecutive year and confirms 3 previous gas discoveries while presenting the discovery of 4 new ones.
Peer Valuation Metrics
(a) Financial valuation (b) EBITDA growth valuation (c) Net income growth valuation
Source: S&P capital IQ, team calculations
Investment Summary Price performance chart
Domestic Gas Price Evolution
Source: team estimation
We issue a HOLD recommendation for S.N.G.N. Romgaz S.A. with a target price of 38.5 RON through the Discounted Cash-Flow technique, a target price of 36.8 RON through peers multiple valuation and a target price of 40.10 RON through Net Asset Valuation. The average upside potential of the three methods is 13.33%. Our recommendation is in line with the consensus upside potential of 12% that market analysts agree upon. Limited upside potential from the price liberalisation process due to oil price contagion At the end of 2014 the non-household domestic gas market has been fully liberalised, and the still-regulated prices for household consumers are expected to converge to the market price by mid-2021, as promised to the European Union/ International Monetary Fund. The revised calendar of price increases for household consumers is to be released by the government in mid-2015. The last regulated prices of 2014 stood at RON 89.4/MWh for non-households and at RON 53.3/MWh for households. These prices were not yet aligned with the average import gas costs of RON 120/MWh for the fiscal year 2014. The import price of gas for Romgaz depends on only one supplier – Russian gas – and is linked to oil prices through the standard Romanian supply contracts. The unprecedented collapse of oil prices from $115 a barrel in June to below $50 is therefore set to influence Romgaz revenues. The expected delay until oil price drops are reflected in gas prices is of 6 to 9 months. The European spot prices for gas will not be used as the benchmark prices since we expect the lower import gas prices to set the price convergence trend for the newly liberalised market for industrial consumers. However, we do not expect significant shortfalls in terms of profitability in the latter part of 2015. Difficult shift to a truly liberalised domestic gas market for non-households The beginning of 2015 marked the start of the fully liberalised gas market for non-households. However, no transactions have been recorded on the centralized market until now. This risk of a quasi-deregulation should be mitigated by the 2014 Government Ordinance which requires gas producers to sell a minimum volume of gas from own production on the centralised market and which therefore seeks to increase transparency. Consequently, in 2015e Romgaz is obliged to sell minimum 35% of the quantities produced, minimum 30% in 2016e, minimum 25% in 2017e and minimum 20% in 2018e. These measures should successfully reduce the risk of an illiquid, opaque centralized market for non-households. The negotiation of royalties will impact profits from 2016e
48
85
91
91
93
100
103
108
114
115
130
132
152
173
214
294
OMV Petrom
MOL
Statoil
Royal Dutch Shell
OMV
Chevron
BP
LUKOil
TatNeft
Exxon
Gazprom Neft
ENI
ConocoPhillips
Romgaz
Repsol YPF
Rosneft
Russian peers
Regional peers
Global peers
Romgaz
0
10
20
30
40
50
60
70
80
2 4 6 8 10
P/E
20
15
EV/EBITDA 2015
Russian peers
Regional peers
Global peers
Romgaz
-20%
-10%
0%
10%
20%
30%
40%
50%
60%
2 4 6 8 10
3 y
r C
AG
R
EV/EBITDA 2015
Russian peers
Regional peers
Global peers
Romgaz
-40%
-30%
-20%
-10%
0%
10%
20%
30%
2 22 42 62 82
3 y
r C
AG
R N
et
Inc
om
e
P/E 2015
CFA Research Challenge | 21 Feb 2015
7 | P a g e
Valuation
Key assumptions DCF
Revenue Growth 4% COGS/Sales 12% Costs/Sales 32% NWC/Sales 20% TV Growth -3% Tax rate 21%
Bond Rating* BBB- YTM (Bonds) - KD 6.50% Tax Rate 16.00% Beta 85.00% Debt as % of Capital - WD 0.00% 10-Yr Treasury Bond Yield 4.50% Market Risk Premium 6.00%
Cost of Equity - KE 9.60% Equity as % of Capital 100.00% WACC 9.60%
Discounted Cash-Flow Model Our target price is based on our two-stage DCF model for Romgaz which we believe is the most accurate method for capturing the hidden value of the company. Therefore, we estimate a target price of RON 38.57 per share for Romgaz, suggesting a 13.4% upside from the current stock price (RON 34.01 as of 18th of February), a sign for a HOLD recommendation. When valuing Romgaz, we took into consideration the fact that it is a largely regulated company. The UGS tariffs are set by the regulatory body ANRE through the revenue-cap methodology and the process of gas price liberalization has been delayed until 2021. Therefore, we estimate that the stock price will register a lower volatility with respect to Romanian market movements, and we correspondingly set the beta at 0.85 after considering the historical correlation between the market index and Romgaz. Since the company employs virtually no debt, the unlevered beta is equal to the levered beta. The key risk interest rate has been recently reduced by BNR in order to adjust for current market conditions, and the corresponding T-bond yields have thus lowered. Therefore we estimate the medium term nominal risk free rate to be 4.5% in our valuation. Our discount cash flow model is a two-stage model based on a higher expected growth period until year 2018 and a stable growth thereafter. We calculated an approximate 4% growth rate for the period 2015e-2018e. The terminal growth rate is -3% assuming a Reserve Replacement Ratio of 70% due to the foreseeable exploration opportunities in the Black Sea and the optimistic average Reserve Replacement Ratio of 173% of the previous three years. Moreover, Romgaz is expected to boost its capital expenditures in order to enhance production via application of new technologies. The estimated CAPEX figures in thousand RON are: 2014 - 1,085.5, 2015e - 1,194.1, 2016e - 1,313.5, 2017e - 1,444.8, 2018e - 1,589.3.
Divident yield peers comparison
Peer Group Dividend Yield
14e 15e
Gazprom Neft 7.7 7.2
Tatneft 4.6 4.5
LUKoil 7.0 7.8
Rosneft 5.0 4.7
Median integrated Russian 6.0 5.9
MOL 3.9 4.3
OMV 5.0 5.1
Repsol YPF 10.9 5.5
Statoil 4.5 4.4
Omv Petrom 6.7 6.1
Median integrated regional 5.0 5.1
BP 5.5 5.8
Chevron 3.6 3.8
ConocoPhilips 3.8 4.0
ENI 6.2 6.3
Exxon 2.9 3.2
Royal Dutch Shell 5.1 5.2
Total 5.2 5.4
Median integrated global 5.1 5.2
Romgaz Analysts Estimates* 8.4 8.5
Source: Raiffeisen
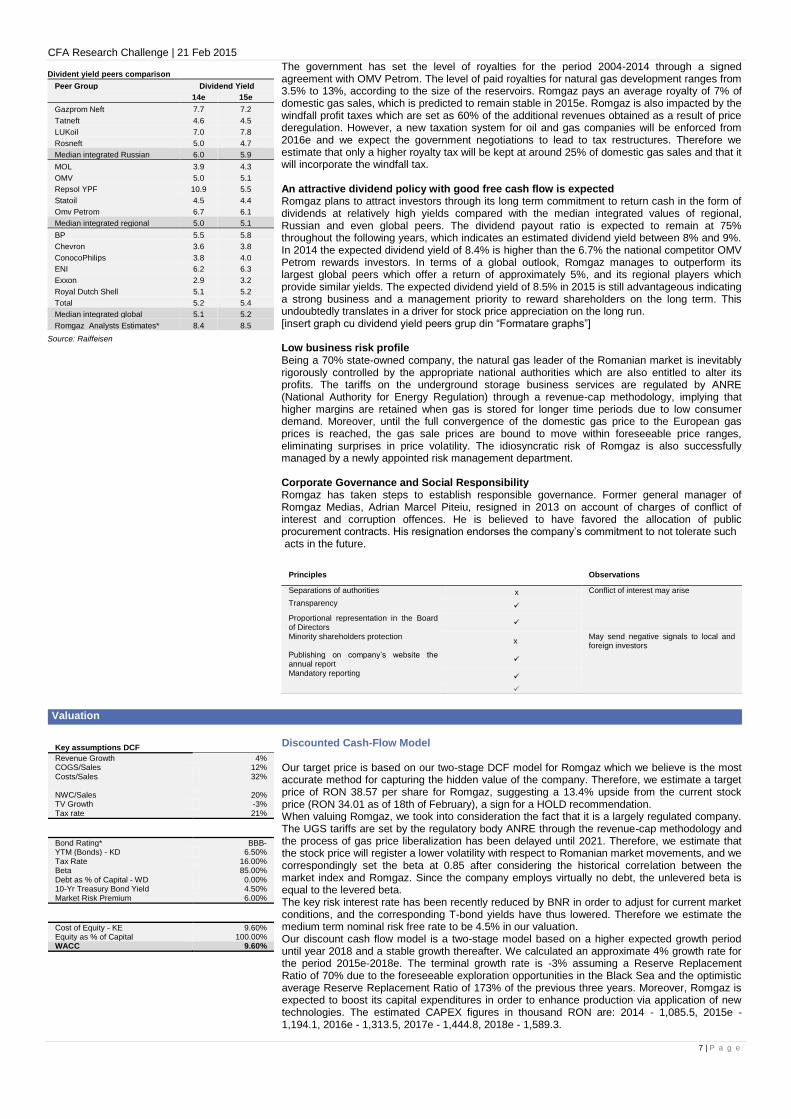
The government has set the level of royalties for the period 2004-2014 through a signed agreement with OMV Petrom. The level of paid royalties for natural gas development ranges from 3.5% to 13%, according to the size of the reservoirs. Romgaz pays an average royalty of 7% of domestic gas sales, which is predicted to remain stable in 2015e. Romgaz is also impacted by the windfall profit taxes which are set as 60% of the additional revenues obtained as a result of price deregulation. However, a new taxation system for oil and gas companies will be enforced from 2016e and we expect the government negotiations to lead to tax restructures. Therefore we estimate that only a higher royalty tax will be kept at around 25% of domestic gas sales and that it will incorporate the windfall tax. An attractive dividend policy with good free cash flow is expected Romgaz plans to attract investors through its long term commitment to return cash in the form of dividends at relatively high yields compared with the median integrated values of regional, Russian and even global peers. The dividend payout ratio is expected to remain at 75% throughout the following years, which indicates an estimated dividend yield between 8% and 9%. In 2014 the expected dividend yield of 8.4% is higher than the 6.7% the national competitor OMV Petrom rewards investors. In terms of a global outlook, Romgaz manages to outperform its largest global peers which offer a return of approximately 5%, and its regional players which provide similar yields. The expected dividend yield of 8.5% in 2015 is still advantageous indicating a strong business and a management priority to reward shareholders on the long term. This undoubtedly translates in a driver for stock price appreciation on the long run. [insert graph cu dividend yield peers grup din “Formatare graphs”] Low business risk profile Being a 70% state-owned company, the natural gas leader of the Romanian market is inevitably rigorously controlled by the appropriate national authorities which are also entitled to alter its profits. The tariffs on the underground storage business services are regulated by ANRE (National Authority for Energy Regulation) through a revenue-cap methodology, implying that higher margins are retained when gas is stored for longer time periods due to low consumer demand. Moreover, until the full convergence of the domestic gas price to the European gas prices is reached, the gas sale prices are bound to move within foreseeable price ranges, eliminating surprises in price volatility. The idiosyncratic risk of Romgaz is also successfully managed by a newly appointed risk management department. Corporate Governance and Social Responsibility Romgaz has taken steps to establish responsible governance. Former general manager of Romgaz Medias, Adrian Marcel Piteiu, resigned in 2013 on account of charges of conflict of interest and corruption offences. He is believed to have favored the allocation of public procurement contracts. His resignation endorses the company’s commitment to not tolerate such acts in the future.
Principles Observations
Separations of authorities x Conflict of interest may arise
Transparency
Proportional representation in the Board of Directors
Minority shareholders protection x
May send negative signals to local and foreign investors
Publishing on company’s website the annual report
Mandatory reporting

CFA Research Challenge | 21 Feb 2015
8 | P a g e
Target price based on DCF
Terminal Value 13,084.2
PV Terminal Value 8,406.0
PV FCF (Yr2014 to Yr2018) 3,494.0
Enterprise Value 11,900.0
+ MV of non-operating assets 94.3
- MV of net debt (2,870.1)
Fair value of equity 14,864.4
Shares outstanding 385.4
Market capitalization 13,108.2
Value based on DCF model 14,864.4
Curent price * 34.01
Target Price 38.57
Upside potential 13.4%
Based on closing price at 18 Feb 2015
Source: team estimates
Target price based on Peer Valuation
EBIT Romgaz 2015e (USD) 512.3
USDRON 2015e 3.6
EBIT Romgaz 2015e (RON) 1,839.0
based on Russian and Regional peers median EV/EBIT
EV Romgaz
15,994.6
Cash 2,870.0
MV of non-operating assets 94.3
Adj to PV Feb 2015 (WACC = 9.6%,
cash return = 4.5%) -
1,162.5
Fair value of equity based on EV/EBIT
17,796.3
Net earnings Romgaz 2015e (USD) 439.4
Net earnings Romgaz 2015e (RON) 1,577.3
Adj to PV Feb 2015 (Cost of equity = 9.6%) -847.0
Fair value of equity based on EqV/NE
10,587.9
based on Russian and Regional peers median Equity Value/EBIT
Shares outstanding 385.4
Current price 34.01
Target price 36.8
Upside potential 8.3%
Based on closing price at 18 Feb 2015
Source: team estimates
Target price based on NAV valuation
Shares outstanding 385.4
USDRON 2015e 3.6
Overall risk for resources 92%
Implied EV/2P (USD/boe) 7.59
Current price (RON) 34.01
Target price 40.10
Upside potential 18%
Based on closing price at 18 Feb 2015
Source: team estimates
For the calculation of WACC we used a target capital structure of 100% Equity and 0% Debt as there are no expectations of changes in the financing model of the company. For the market risk premium we chose the 6% consensus estimate of Romanian financial analysts. Therefore the WACC is 9.60%. Sensitivity analysis The following tables summarize the sensitivity of the DCF model to key determinants. The first determinants are the rate of revenue growth from 2014 to 2018 and WACC. We also performed the sensitivity analysis of the terminal decline rate from 2018 onwards and of the revenue growth rate. The third table represents the change in share price if the effective tax rate were to change simultaneously with WACC. Multiples Valuation Next, we used multiples valuation method through which we calculated the value of Romgaz based on how its peer companies are traded in the market. We identified the main players in the oil and gas market that have a similar mature stage of growth and distributed them into three categories: the Russian companies comprising Gazprom, Tatneft, LUKOil and Rosneft, the regional companies including MOL, OMV, Repsol, Statoil, and Petrom OMV and finally the global players BP, Chevron, Conoco Phillips, Eni, Exxon and Royal Dutch. However, we only considered the regional and Russian companies as relevant peers. We calculated the enterprise value for the companies and two key ratios: EV/EBIT and Equity Value/Net Earnings as of 2015e. In order to arrive at the Enterprise Value (EV) of Romgaz we calculated the ratio EV/EBIT for the Russian and regional companies and multiplied it with Romgaz expected EBIT in 2015e as computed in the DCF model and averaged the EV/NE ratio for the same companies to find EV Romgaz. Afterwards we averaged the two EV values to find the fair value of Romgaz. The result offered us a similar upside potential for Romgaz: 8.3%. Net Asset Value We value Romgaz’s 2P reserves at 6.7$/boe or at 29.84 RON/share (based on an FX rate of 3.6 RON/$ - estimated for 2016). We do not considered risky the 2P reserves due to the very high proportion of developed, proved reserves. This valuation, when adding net cash, implies a total target core NAV of RON 33.91/share. In addition, we applied a very low probability of success for prospective resources (8%) and a heavily discounted NPV. In the end we have an NPV of 2.11 RON/share for prospective resources We also add a 4.08 RON/share value to account for the non-E&P assets (exploration and production) that the company owes. Finally, we arrive at our total NAV of 40.10 RON/share (compared to actual price of 34.01 RON – upside potential 18%). Despite the above mentioned, we would recommend HOLD as the price is highly affected by the FX rate. Lately Romanian leu depreciated heavily in relation to USD (0.50 RON in 5 months). Actual company price is driven by more than resources (current and prospective) and cash and thus, based on previous valuations (peers and discounted cash-flow), we consider potential of Romgaz to be upside, at roughly 16-17% Sensitivity analysis There is an upstream potential of 6% and a downstream of 7% based on the current price of 12.97. At $12.97/boe NPV/share is RON 40.10. If one assumes the price will drop to $11.80/boe than the price of a share will drop 7% to 37.42. On the other side, if one assumes the price will target $14/boe than the share will be valued at 42.48 RON (6% increase). The value of a share has the same sensibility for up or down movements of the price of one boe of gas
NAV Sensitivity Analysis
Price of 1 boe of gas NPV NPV/share
11.80 2,907.84 37.42
12.00 2,957.13 37.88
12.20 3,006.41 38.34
12.30 3,031.06 38.57
12.65 3,117.31 39.38
12.70 3,129.63 39.49
12.97 3,194.93 40.10
13.00 3,203.56 40.18
13.10 3,228.20 40.41
13.25 3,265.16 40.76
13.40 3,302.13 41.10
13.50 3,326.77 41.33
14.00 3,449.98 42.48
DCF Sensitivity Analysis
WACC
Revenue growth
WACC
7.6% 8.6% 9.6% 10.6% 11.6%
Te
rmin
al
gro
wth
0.0% 2.0% 4.0% 6.0% 8.0%
Ta
x r
ate
7.6% 8.6% 9.6% 10.6% 11.6%
Re
ve
nu
e
gro
wth
0.0% 35.52 32.78 30.50 28.58 26.93 0.0% 35.42 40.19 45.38 51.03 57.16 15.0% 49.28 45.14 41.69 38.77 36.27
2.0% 40.31 37.07 34.37 32.08 30.13 -1.0% 33.47 37.88 42.68 47.89 53.55 17.0% 48.03 44.00 40.65 37.81 35.38
4.0% 45.53 41.73 38.57 35.89 33.60 -2.0% 31.86 35.97 40.45 45.30 50.57 19.0% 46.78 42.87 39.61 36.85 34.49
6.0% 51.20 46.79 43.12 40.02 37.36 -3.0% 30.50 34.37 38.57 43.12 48.06 21.0% 45.53 41.73 38.57 35.89 33.60
8.0% 57.35 52.28 48.06 44.48 41.43 -4.0% 29.35 33.00 36.96 41.26 45.92 23.0% 44.28 40.60 37.53 34.93 32.71

CFA Research Challenge | 21 Feb 2015
9 | P a g e
Fnancial Analysis
Revenue Breakdown 2010-2013
Source: Romgaz Romgaz Clients
Source: Romgaz
Romgaz Resources
Source: Romgaz Dividend pay-out ratio
Source: Romgaz
Strong growth in 2014 revenues maintain a positive financial outlook on Romgaz The company revenues are historically generated in proportion of approximately 65% from the upstream business line - internal production and sale of natural gas, while the underground storage (UGS) facilities account for approximately 8% of the total revenue stream. Although Romgaz might in the future produce sufficient gas to meet the consumer demand, the UGS regulations impose limits on the amount of gas that can be retrieved at a certain period from the underground reserves, which obliges Romgaz to appeal to Russian import gas. The revenue from sale of import price hoovers at 20% from total revenues and the cost of import gas that ANRE considered for the Q1 of 2015 stood at 144 RON/MWh. In 2014 cost of commodity sold decreased by 60.01% due to a reduction in sales of import gas. However, Romgaz ensures that the import costs are fully covered through the prices of gas sold to suppliers, never recording a loss on the trade. Overall, the total revenues of Romgaz increased by approximately 15.5% y-o-y. There was a slight decrease of 8% y-o-y in revenues in 2014 Q4 mainly because of mild weather conditions that led to lower quantities of gas supplied. Nevertheless, this did not diminish the year-round quantity of gas supplied, which marginally increased by 0.62% y-o-y. The electric energy supply through Iernut power plant is responsible for 2.4% of total electric power production in Romania and recorded 324.6 million RON in revenue. The gas sold to Iernut is accounted at cost as of Q3 2014. Romgaz revenues in 2014 targeted RON 4.49 billion compared to 3.9 billion in 2013. According to the preliminary financial reports, 2014 EBIT increased y-o-y by an impressive 42.11%, mainly due to the higher prices for the gas sold to non-household consumers in the process of price convergence to European levels. The revenues from UGS facilities increased by 16.69% as compared to the amount recorded in 2013 due to higher tariffs. These high estimates for sales are also supported by their increasing capital expenditure as well as by the reserves and exploration program for 2014-2015. Romgaz currently holds 62.71% proved reserved, while only 12.15% are probable and 12.14% possible In 2014 Romgaz had 90% reserves replacement rate on account of explorations investments that increased by 1.9% as compared to the previous year (exploration investment of RON 427.9).The company has a development programme in place, with 36 new wells tested (20 were successful, 12 were dry hole and 4 are in progress). As of September 2014 there were 2 wells contingent resources, 4 wells prospective resources and 9 others in testing. They expect 13 new wells for 2015, contingent resources and 6 wells for prospective resources in 2015. As their PPE (Property, Plant and Equipment) financial statement line is decreasing with roughly 3% annually and it will reach RON 5,610 by 2016 and in order to be able to grow and develop more the company adopted a policy for increasing CAPEX and from RON 668,930 in 2013 we are expecting a RON 1,589,300 in 2018. GDF Suez and E.ON are main clients Romgaz has 8 important clients: E.ON Energie, GDF Suez, Electrocentrale Bucuresti, Electrocentrale Galati, Conef, Azomures, Transgaz and Ten Gaz. Its most important client is E.ON with 33% of total sales, followed by GDF Suez with 27%. Liquidity Working capital estimations for Romgaz are slowly increasing and are expected to reach RON 1,051,300 in 2018, from RON 826,200 in 2014. Positive working capital means strong short-term liquidity for the company. Romgaz is able to repay its short term debt, and also has the ability to expand its operations, with the liquidity it holds. Equity and 0 Debt Romgaz has no short term debt, nor long term ones. Its equity mainly comprises of share capital, reserves and retained earnings. Total equity was roughly constant during 2011-2013. In 2014 it increased from RON 9,292,774 to RON 9,736,584. On IFRS accounting standard the company reported RON 385,422 on share capital, RON 2,142,348 on reserves and RON 7,208,814 on retained earnings. Following OMF directions the company decided to record in FY 2014 the adjustment for hyperinflation on retained earnings and thus they reached 7 million. The above mentioned idea means that the company will have enough capital to develop and expand. In order to sustain the above mentioned idea we can observe that reserves also show an increase. This means that the company is willing to retain more funds now to finance future projects Dividend pay-out Dividend pay-out was closely to 100% in 2012 and 2013, 94.7% and 99.5% respectively. In 2014 the policy is to give about 75% annually (very close to its historical value from 2011 – 79%). Given the fact that net profit is expected to rise, a 75% dividend policy is a great risk-adjusted return.
0
2,000,000
4,000,000
6,000,000
2010 2011 2012 2013 2014
Th
ou
sa
nd
RO
N
ElectricityOther revenuesSale of import gasUnderground storage activityInternal gas production and sale
33.27%
27%
16%
4%
4%
3% 2%
2%
9%
E.ON Energie GDF SuezElectrocentrale Bucuresti Electrocentrale GalatiConef AazomuresTransgaz Ten GazOthers
62, 71%
13, 15%
12, 14%
Proved Probable Possible
65%
70%
75%
80%
85%
90%
95%
100%
2011 2012 2013 2014
Dividend payout ratio

CFA Research Challenge | 21 Feb 2015
10 | P a g e
Investment Risks
Daily volatilities
Source: Thomson Reuters Datastream, team estimation
Long term volatilities - peers comparison
Source: Thomson Reuters Datastrea, team estimation
Financial Risks Romgaz is exposed to a variety of financial risks, such as: market risk which includes currency risk and interest rate risk, credit risk, liquidity risk. Currency and interest rate risk: The company is exposed to currency risks that arise from exposure to various currencies, mainly the US dollar and euro. The currency risks arise from future commercial transactions, receivables and debts. Because Romgaz imports gas from Russia, it has foreign currency denominated debts.Due to the associated high costs, the Company has adopted a policy of not using derivatives to reduce risk. 4.4821 RON / EUR and 3.6868 RON / USD at 31.12.2014 ;4.4847 RON / EUR and 3.2551 RON / USD at 31.12.2013. The company is exposed to interest rate risk on loans provided to related parties. On 30 September 2014, Romgaz had granted loans with variable interest amounting to 16,785 thousand RON (31 December 2013: 16,422 thousand RON). Credit Risk The financial assets, which potentially expose the company to credit risk primarily, include cash and cash equivalents, bank deposits, trade receivables and loans granted. Romgaz policies stipulate that sales are made to customers with low credit risk. The credit risk focuses on the most important clients of Romgaz which are Interagro Bucuresti, Electrocentrale Bucuresti, Azomures Tg. Mures, GDF Suez Energy Romania, E.ON Gaz Romania and account for 90% of the company’s accounts receivable. Operational Risks Depletion of gas resources is a serious issue in Romania as natural gas production has generally decreased since 1986, although the rate of decline in annual natural gas production has stabilized during the past two years. For the moment, Romgaz can produce from their existing reserves for the following 12 years. There are a few alternatives for their reserves issue. Romgaz has a 10% working interest in offshore exploration in the Black Sea with Lukoil and Vanco where there are two deep water blocks (East Rapsodia and Trident) for almost 2,000 km
2.
The Black Sea offshore fields are potentially promising, in theory, but there are substantial technical challenges, while the underlying risks and drilling and extraction costs are high, much more expensive than onshore operations. Thus, if a final investment decision to commercially develop new offshore fields is reached by the end of 2014, it is not until 2020 that new natural gas volumes will hit the market. Annual domestic natural gas production has averaged approximately 10-11 billion cubic meters per year, but natural gas production has generally decreased since 1986, although the rate of decline in annual natural gas production has stabilized during the past two years, Romgaz keeping it below 1%. Regulatory risks NAMR(National Agency for Mineral Resources) provides rights to production and exploration of gas under a petroleum concession agreement which is given to an entity after a public bid award. Regarding the legislation concerning the issuance of authorization and licenses for the national gas sector, ANRE is the institution responsible. The titleholder of a concession agreement is fully liable for damages caused to third parties. The licence may be suspended or terminated if the titleholder does not manage to complete the amount of work until the deadline as per contract, fails to pay the royalties in due time or does not respect the validity conditions of licenses. Romgaz fulfilled all its obligations with respect to license terms and conditions by following a best-practice principle. Further regulations include restrictions of performing activities on archaeological, historical, cultural areas and on natural reservations. Until the present day, Romgaz has only executed operations for reservoirs after being authorized by the proper institution. Taxation, fiscal regime The current system of royalties for natural resources in Romania will be extended one year and from January 1, 2016 will be introduced a new way of charging. There is no clear indication regarding the exact changes, but we estimate that the new regime will increase the value of the royalties. Currently, the royalty rates range between 3.5% and 13% (averaging between 7% and 8%). Romania currently has among the smaller royalties in Europe. Also, according to Prime Minister Victor Ponta, Romania plans to differentiate royalties from oil and gas production at the country’s onshore and offshore fields to stimulate investment. Furthermore, from 2016, the government may impose, based on the press reports, a new taxation, in addition to oil and gas royalties. The new taxation will surcharge strictly the profit obtained from upstream activities, exploration and production. The Government announced that it will extend by one year, until 31 December 2015, the imposed 60% tax on the income earned as a result of price hikes introduced under the country's energy market deregulation and will decrease the special construction tax from 1.5% to 1%. Environmental risks With respect to exploration, EPA (Environmental Protection Authority) settles if a situation is subject to an EIA (environmental impact assessment), whether it will have a considerable effect on the environment. Romgaz complies with legal requirements for environmental authorization and for environmental protection through monitoring programs performed. The company created a computer application which helps them to supervise the activities that affect the environment. Companies must manage the waste resulted from extraction according to specific regulations for disposal and recovery of waste. Every year, Romgaz recycles and disposes either by incineration or by storage, large amounts of waste.
0%
1%
2%
3%
4%
5%
6%
7%
8%
9%
10%
13
-Nov-1
3
13
-Dec-1
3
13
-Ja
n-1
4
13
-Fe
b-1
4
13
-Ma
r-1
4
13
-Apr-
14
13
-Ma
y-1
4
13
-Ju
n-1
4
13
-Ju
l-1
4
13
-Aug
-14
13
-Sep
-14
13
-Oct-
14
13
-Nov-1
4
13
-Dec-1
4
13
-Ja
n-1
5
4th quartile
1st quartile
Romgaz
0%
1%
1%
2%
2%
3%
3%
R
OM
GA
Z
Exxo
n
Ch
evro
n
Roya
l D
utc
h
Rep
so
l
BP
OM
V P
etr
om
Con
oco P
OM
V
En
i
MO
L
Sta
toil
LU
KO
IL
RO
SN
EF
T
GA
ZP
RO
M
TA
TN
EF
T

CFA Research Challenge | 21 Feb 2015
11 | P a g e
Appendices
Cash Flow
For the Fiscal Period Ending
12 months
Dec-31-2009 12 months
Dec-31-2010 12 months
Dec-31-2011 12 months
Dec-31-2012 12 months
Dec-31-2013
12 months
Dec-31-2014
Currency RON RON RON RON RON RON Net Income [2150] - 344.5 1,187.7 1,119.2 995.6 - Depreciation & Amort. [2171] -
678.5
653.1
623.2
607.8 -
Amort. of Goodwill and Intangibles [2182] - 20.6
21.6
42.7
35.1
-
Impair. of Oil, Gas & Mineral Prop. [2031] - 260.3
209.1
111.6
131.9
-
Depreciation & Amort., Total [2160] - 959.4 883.7 777.5 774.7 -
Other Amortization [2014] -
0.5
0.5
0.1
0.1 -
(Gain) Loss From Sale Of Assets [2026] - (21.2)
4.9
15.7
32.5
-
(Gain) Loss On Sale Of Invest. [2090] - - 3.4
- 7.8
-
Asset Writedown & Restructuring Costs [2019] - 6.2
6.0
45.5
80.0
-
Provision & Write-off of Bad debts [2111] - 56.9
(81.4)
134.7
186.8
-
Other Operating Activities [2047] - (135.2)
(213.2)
(290.7)
(113.3)
-
Change in Acc. Receivable [2018] - (283.3)
(318.2)
89.1
(573.2)
-
Change In Inventories [2099] - (26.1)
641.7
(56.6)
43.9
-
Change in Acc. Payable [2017] - 301.4
659.1
(382.8)
251.6
-
Change in Other Net Operating Assets [2045] - - - - - -
Cash from Ops. [2006] - 1,203.1 2,774.2 1,451.7 1,686.5 -
Capital Expenditure [2021] -
(367.9)
(292.5)
(214.4)
(338.0) -
Cash Acquisitions [2057] - - - - - -
Divestitures [2077] - - - - - -
Invest. in Marketable & Equity Securt. [2027] - (47.9)
(876.2)
178.1
(37.7)
-
Net (Inc.) Dec. in Loans Originated/Sold [2032] - - - - - -
Other Investing Activities [2051] - (389.4)
(272.0)
(159.8)
(426.4)
-
Cash from Investing [2005] - (805.2) (1,440.8) (196.2) (802.2) -
Short Term Debt Issued [2043] - - - - - -
Long-Term Debt Issued [2034] - - - - - -
Total Debt Issued [2161] - - - - - -
Short Term Debt Repaid [2044] - - - - - -
Long-Term Debt Repaid [2036] - (4.5)
(6.3)
(6.7)
- -
Total Debt Repaid [2166] - (4.5) (6.3) (6.7) - - Common Dividends Paid [2074] -
(585.8)
(706.7)
(938.0)
(1,060.1) -
Total Dividends Paid [2022] - (585.8) (706.7) (938.0) (1,060.1) - Special Dividend Paid [2041] - - - - - -
Other Financing Activities [2050] - - - - - -
Cash from Financing [2004] - (590.4) (713.1) (944.8) (1,060.1) -
Net Change in Cash [2093] - (192.5) 620.3 310.7 (175.7) -
Supplemental Items Cash Interest Paid [3028] NA
1.7
1.2
0.7 NA NA
Cash Taxes Paid [3053] NA 247.0
264.8
295.9
284.6
NA
Levered Free Cash Flow [4422] NA 1,187.5
2,217.3
926.7
1,354.9
NA
Unlevered Free Cash Flow [4423] NA 1,188.5
2,218.0
927.0
1,355.0
NA
Change in Net Working Capital [4421] 1,075.2
(367.3)
(943.5)
392.1
(38.0)
(108.8)
Net Debt Issued [2003] NA (4.5)
(6.3)
(6.7)
NA NA
Filing Date [2155] Jan-15-2010 Aug-22-2013 Aug-22-2013 Mar-26-2014 Mar-26-2014 Feb-19-2015
Restatement Type [2208] NV O O NC O NV
Calculation Type [22646] NA REP REP REP REP NA
Appendix 1: Cash flow

CFA Research Challenge | 21 Feb 2015
12 | P a g e
Income Statement
For the Fiscal Period Ending
12 months
Dec-31-2009 12 months
Dec-31-2010 12 months
Dec-31-2011 12 months
Dec-31-2012 12 months
Dec-31-2013
12 months
Dec-31-2014
Currency RON RON RON RON RON RON
Revenue [112] 3,320.2
3,497.5
4,195.5
3,837.9
3,894.3 4,493.3
Other Revenue [90] - - - - - -
Total Revenue [28] 3,320.2 3,497.5 4,195.5 3,837.9 3,894.3 4,493.3 Cost Of Goods Sold [34]
606.4
761.2
1,211.0
912.1 462.8
214.1
Gross Profit [10] 2,713.8 2,736.3 2,984.4 2,925.8 3,431.5 4,279.3 Selling General & Admin Exp. [102]
459.8
477.8
478.3
503.0 480.7
522.8 Exploration/Drilling Costs [49] - - - - -
43.3 R & D Exp. [100] - - - - - -
Depreciation & Amort. [41] 575.1
699.6
675.2
642.3
629.8 776.8
Impair. of Oil, Gas & Mineral Prop. [71] - 260.3
209.1
111.6
131.9 -
Other Operating Expense/(Income) [260] 962.0
932.0
529.3
459.4
781.0 934.8
Other Operating Exp., Total [380] 1,996.9 2,369.7 1,891.9 1,716.4 2,023.3 2,277.7
Operating Income [21] 716.9 366.6 1,092.5 1,209.5 1,408.1 2,001.6
Interest Expense [82]
(1.9)
(1.7)
(1.1)
(0.6) 0 -
Interest and Invest. Income [65] 199.1
94.3
106.8
148.3
123.3 78.7
Net Interest Exp. [368] 197.2 92.6 105.7 147.8 123.2 78.7
Currency Exchange Gains (Loss) [38] - (1.2)
(4.5)
(15.2)
(6.1) -
Other Non-Operating Inc. (Exp.) [85] (81.8)
49.2
159.6
114.8
(104.3) (292.0)
EBT Excl. Unusual Items [4] 832.2 507.3 1,353.3 1,456.9 1,421.0 1,788.3 Impairment of Goodwill [209] - - - - - -
Gain (Loss) On Sale Of Invest. [62] (1.3)
- - - (7.8) -
Gain (Loss) On Sale Of Assets [56] - 21.2
(4.9)
(15.7)
(32.5) -
Asset Writedown [32] - (6.2)
(6.0)
(45.5)
(80.0) -
Other Unusual Items [87] - - - - - -
EBT Incl. Unusual Items [139] 830.9 522.2 1,342.5 1,395.6 1,300.6 1,788.3
Income Tax Expense [75]
258.5
177.7
154.8
276.5 305.1
353.9
Earnings from Cont. Ops. [7] 572.5 344.5 1,187.7 1,119.2 995.6 1,434.4
Earnings of Discontinued Ops. [40] - - - - - -
Extraord. Item & Account. Change [42] - - - - - -
Net Income to Company [41571] 572.5 344.5 1,187.7 1,119.2 995.6 1,434.4
Minority Int. in Earnings [83] - - - - - -
Net Income [15] 572.5 344.5 1,187.7 1,119.2 995.6 1,434.4
Pref. Dividends and Other Adj. [97] - - - - - -
NI to Common Incl Extra Items [16] 572.5 344.5 1,187.7 1,119.2 995.6 1,434.4 NI to Common Excl. Extra Items [379] 572.5 344.5 1,187.7 1,119.2 995.6 1,434.4
Per Share Items Basic EPS [9] NA
0.9
3.1
2.92 2.58
3.72 Basic EPS Excl. Extra Items [3064] NA
0.9
3.1
2.92 2.58
3.72 Weighted Avg. Basic Shares Out. [3217] NA
383.0
383.0
383.0 385.4
385.4 Diluted EPS [8] NA
0.9
3.1
2.92 2.58
3.72 Diluted EPS Excl. Extra Items [142] NA
0.9
3.1
2.92 2.58
3.72 Weighted Avg. Diluted Shares Out. [342] NA
383.0
383.0
383.0 385.4
385.4
Normalized Basic EPS [4379] NA 0.83
2.21
2.38
2.3 2.9
Appendix 2: Income Statement

CFA Research Challenge | 21 Feb 2015
13 | P a g e
Normalized Diluted EPS [4380] NA 0.83
2.21
2.38
2.3 2.9
Dividends per Share [3058] NA
1.8
2.4
2.77 NA NA
Payout Ratio % [4377] NA 170.1% 59.5% 83.8% 106.5% NA
Shares per Depository Receipt [4005]
1.0
1.0
1.0
1.0 1.0
1.0 Supplemental Items
EBITDA [4051] 1,292.0
1,326.0
1,976.3
1,987.0
2,182.9 2,803.2
EBITA [100689] 716.9
387.2
1,114.1
1,252.2
1,443.2 2,001.6
EBIT [400] 716.9
366.6
1,092.5
1,209.5
1,408.1 2,001.6
As Reported Total Revenue* [339] 3,561.9
NA NA NA NA NA
Effective Tax Rate % [4376] 31.1% 34.0% 11.5% 19.8% 23.5% 19.8% Total Current Taxes [35383] -
241.0
288.9
284.8 416.5 -
Total Deferred Taxes [35385] - (63.2)
(134.2)
(8.3)
(111.4) -
Normalized Net Income [4378]
520.1
317.0
845.8
910.5 888.1
1,117.7 Filing Date [349] Jan-15-2010 Aug-22-2013 Aug-22-2013 Mar-26-2014 Mar-26-2014 Feb-19-2015 Restatement Type [408] P O O NC O P Calculation Type [22645] REP REP REP REP REP REP Supplemental Operating Expense Items R&D Exp. [3168] NA
0.5
0.5 NA NA NA
Exploration/Drilling Expenses [33394] NA NA NA NA NA 43.3
Source: S&P Capital IQ
Balance Sheet
Balance Sheet as of:
Dec-31-2009 Dec-31-2010 Dec-31-2011 Dec-31-2012 Dec-31-2013
Dec-31-2014
Currency RON RON RON RON RON RON ASSETS
Cash And Equivalents [1096] 773.8
808.3
1,428.6
1,739.3
1,563.6
1,953.8
Short Term Investments [1069] 389.0
203.7
1,090.1
928.2
970.7
916.3
Total Cash & ST Investments [1002] 1,162.7 1,012.0
2,518.8
2,667.6
2,534.3
2,870.1
Accounts Receivable [1021]
1,277.8
860.3
930.8
906.8
1,086.6
1,000.2 Other Receivables [1206]
22.3
22.3
37.2
96.5
58.9 -
Total Receivables [1001] 1,300.1 882.7
967.9
1,003.3
1,145.5
1,000.2
Inventory [1043]
1,076.2
1,084.5
451.2
507.8
463.9
392.1 Prepaid Exp. [1212] -
4.8
2.8
1.9
1.9 -
Other Current Assets [1055] - 66.7
125.7
34.1
85.3
101.6
Total Current Assets [1008] 3,539.0 3,050.6
4,066.4
4,214.7
4,231.0
4,364.0
Gross Property, Plant & Equipment [1169]
- 7,216.4
7,700.8
7,839.7
8,363.8
-
Accumulated Depreciation [1075] - (682.0)
(1,336.4)
(1,959.0)
(2,596.5)
-
Net Property, Plant & Equipment [1004]
4,339.6 6,534.5
6,364.5
5,880.8
5,767.3
5,962.7
Long-term Investments [1054]
7.5
8.2
8.0
9.3
77.8
77.6 Other Intangibles [1040]
41.8
188.7
117.4
230.5
383.9
407.4 Accounts Receivable Long-Term [1088] -
92.1
145.4
52.6 - -
Loans Receivable Long-Term [1050] 7.3
- 8.3
16.5
16.4
-
Deferred Charges, LT [1025] 1.1
0.6
0.1
0.2
0.0
-
Other Long-Term Assets [1060] 1,124.1
- 0.2
0.5
0.7
-
Total Assets [1007] 9,060.5 9,874.7
10,710.3
10,405.0
10,477.2
10,811.8
LIABILITIES Accounts Payable [1018]
195.0
21.8
25.1
19.3
30.9
217.0 Accrued Exp. [1016] -
156.8
235.2
201.4
362.8 -
Curr. Port. of LT Debt [1297] 5.9
13.2
6.8
- - -
Curr. Income Taxes Payable [1094] 35.3
55.0
79.1
68.0
201.0
92.4
Appendix 3: Balance Sheet

CFA Research Challenge | 21 Feb 2015
14 | P a g e
Unearned Revenue, Current [1074] 39.9
- - - - -
Other Current Liabilities [1057] 214.2
280.5
627.3
285.4
167.1
358.3
Total Current Liabilities [1009] 490.3 527.4
973.5
574.1
761.8
667.7
Long-Term Debt [1049]
12.0 - - - - -
Unearned Revenue, Non-Current [1256]
4.6
- - - - -
Pension & Other Post-Retire. Benefits [1213]
44.6
52.8
53.6
63.8
79.2
97.3
Def. Tax Liability, Non-Curr. [1027] - 400.3
266.2
257.8
146.4
108.0
Other Non-Current Liabilities [1062] 200.5
211.6
253.4
164.5
197.0
202.3
Total Liabilities [1276] 752.0 1,192.0
1,546.7
1,060.2
1,184.4
1,075.2
Common Stock [1103] 383.0
383.0
383.0
383.0
385.4
385.4
Additional Paid In Capital [1084] - - - - - -
Retained Earnings [1222] 654.1
6,792.4
7,273.3
7,454.5
7,400.1
7,208.8
Treasury Stock [1248] - - - - - -
Comprehensive Inc. and Other [1028] 7,271.4
1,507.3
1,507.3
1,507.3
1,507.3
2,142.3
Total Common Equity [1006] 8,308.5 8,682.7
9,163.6
9,344.8 9,292.8 9,736.6
Total Equity [1275] 8,308.5 8,682.7
9,163.6
9,344.8 9,292.8 9,736.6
Total Liabilities And Equity [1013] 9,060.5 9,874.7
10,710.3
10,405.0
10,477.2
10,811.8
Supplemental Items Total Shares Out. on Filing Date [24153]
NA 383.0
383.0
383.0
385.4
385.4
Total Shares Out. on Balance Sheet Date [24152]
NA 383.0
383.0
383.0
385.4
385.4
Book Value/Share [4020] NA 22.67
23.92
24.4
24.11
25.26
Tangible Book Value [1310] 8,266.7
8,494.0
9,046.2
9,114.3
8,908.9
9,329.1
Tangible Book Value/Share [4156] NA 22.18
23.62
23.79
23.11
24.2
Total Debt [4173] 17.8
13.2
6.8
0
0
0
Net Debt [4364] (1,144.9)
(998.8)
(2,511.9)
(2,667.6)
(2,534.3)
(2,870.1)
Equity Method Investments [3063] NA 7.3
7.1
7.6
0.9
0.7
Inventory Method [3007] NA NA NA Spec. ID NA NA
Raw Materials Inventory [3171] 166.2
0.0
0.0
0.0
0.0
NA
Work in Progress Inventory [3219] 1.8
0.6
0.1
0.3
0.2
NA
Finished Goods Inventory [3075] 889.9
919.8
277.6
360.0
310.3
NA
Other Inventory Accounts [1042] 18.4
181.5
182.6
156.6
162.5
NA
Land [3098] NA 84.8
89.0
91.9
99.9
NA
Buildings [3023] NA 324.9
348.2
355.4
435.6
NA
Machinery [3114] NA 801.1
944.8
1,000.6
1,133.1
NA
Construction in Progress [3033] - 252.9
197.5
171.5
271.2
-
Natural Resources, at Cost [24457] - 4,455.7
4,750.7
4,716.2
4,884.4
-
Accum. Allowance for Doubtful Accts [3012]
NA 565.3
631.5
767.5
393.2
NA
Filing Date [1264] Jan-15-2010 Aug-22-2013 Aug-22-2013 Mar-26-2014 Mar-26-2014 Feb-19-2015
Restatement Type [1303] P O O NC O P
Calculation Type [22647] REP REP REP REP REP REP
Source: S&P Capital IQ

CFA Research Challenge | 21 Feb 2015
15 | P a g e
Source:S&P Capital IQ, team calculations
Peer Valuation Summary
USD mn. Industry Stage of Growth EBIT Net Earnings
Equity Value (Market)
Debt Value (Book)
EV EV / EBIT Eq. Val / NE
Russia
n Gazprom Integrated Oil & Gas Mature 25,237.9 21,355.8 60,260.0 32,403.7 92,663.7 3.67 2.82
Tatneft Oil and Gas E&P Mature 2,587.1 1,789.3 12,216.4 409.2 12,625.6 4.88 6.83
LUKOil Integrated Oil & Gas Mature 10,938.1 7,811.3 36,975.0 13,076.0 50,051.0 4.58 4.73
Rosneft Integrated Oil & Gas Mature 11,709.4 6,636.8 48,114.9 41,441.6 89,556.5 7.65 7.25
Reg
ion
al
MOL Integrated Oil & Gas Mature 592.4 343.0 3,473.7 3,542.7 7,016.4 11.84 10.13
OMV Integrated Oil & Gas Mature 1,703.6 638.2 8,849.8 5,966.9 14,816.7 8.70 13.87
Repsol Integrated Oil & Gas Mature 2,549.3 1,664.9 26,642.0 16,392.4 43,034.4 16.88 16.00
Statoil Integrated Oil & Gas Mature 10,553.7 2,947.2 61,355.0 30,542.8 91,897.8 8.71 20.82
PETROM Integrated Oil & Gas Mature 600.0 821.1 5,664.4 414.6 6,079.0 10.13 6.90
Glo
ba
l
BP Integrated Oil & Gas Mature 12,051.9 7,089.0 127,102.8 52,854.0 179,956.8 14.93 17.93
Chevron Integrated Oil & Gas Mature 14,919.9 8,425.8 208,775.8 25,709.0 234,484.8 15.72 24.78
ConocoPhillips Oil and Gas E&P Mature 2,669.7 1,087.0 83,985.2 21,187.0 105,172.2 39.39 77.26
ENI Integrated Oil & Gas Mature 8,242.7 3,065.3 66,679.6 29,483.6 96,163.2 11.67 21.75
Exxon Integrated Oil & Gas Mature 29,232.4 17,371.9 385,381.8 21,834.0 407,215.8 13.93 22.18
Royal Dutch Integrated Oil & Gas Mature 19,983.6 14,031.5 208,191.0 45,540.0 253,731.0 12.70 14.84
Romgaz Oil and Gas E&P Mature 512.3 439.4 3,356.8 0.0 3,356.8 6.55 7.64
Russian Average
12,618.1 9,398.3 39,391.6 21,832.6 61,224.2 5.2 5.4
Regional Average
3,199.8 1,282.9 21,197.0 11,371.9 32,568.9 11.3 13.5
Global Average
14,516.7 8,511.7 180,019.4 32,767.9 212,787.3 18.1 29.8
Russian Median
11,323.8 7,224.1 42,545.0 22,739.9 69,803.8 4.7 5.8
Regional Median
1,703.6 821.1 8,849.8 5,966.9 14,816.7 10.1 13.9
Global Median
13,485.9 7,757.4 167,646.9 27,596.3 207,220.8 14.4 22.0
Discount to Russian Median
39% 32%
Discount to Regional Median
-35% -45%
Discount to Global Median
-55% -65%
Source:S&P Capital IQ, team calculations
NAV Valuation Summary
Unrisked Risked
boe
(m)
Equity
stake NPV/boe
(USD) NPV
(USD)
NPV /
Share (USD)
Prob.
of success NPV
NPV /
Share (USD)
NPV /
share(RON)
2P Reserves 480 100% 6.7 3,195 8.29 100% 3,195 8.29 29.84
Cash
435 1.13 100% 435 1.13 4.06
Core NAV
3,630 9.42
3,630 9.42 33.91
Prospective Resources 425 100% 6.7 2,829 7.34 8% 226 0.59 2.11
Non - E&P assets (UGS)
100%
437 1.13 100% 437 1.13 4.08
Total NAV
6,896 17.89
4,293 11.14 40.10
2P = probable reserves, boe = barrels of oil
DCF Valuation summary
Key assumptions
RON mn 2014 2015e 2016e 2017e 2018e 2019e Steady State Revenue Growth 4%
Revenues (Sales) 4,493.3 4,673.1 4,860.0 5,054.4 5,256.6 5,466.8 5,685.5
COGS/Sales 12%
COGS 214.1 560.8 583.2 606.5 630.8 656.0
Costs/Sales 32%
Gross Profit 4,279.3 4,112.3 4,276.8 4,447.9 4,625.8 4,810.8
Other costs and expenses 1,500.9 1,495.4 1,555.2 1,617.4 1,682.1 1,749.4
NWC/Sales 20%
Depreciation 776.8 776.8 776.8 776.8 776.8 776.8 TV Growth -3%
EBIT 2,001.6 1,840.1 1,944.8 2,053.6 2,166.8 2,284.6
Tax rate 21%
-Taxes 353.9 386.4 408.4 431.3 455.0 479.8
NOPAT 1,647.7 1,453.7 1,536.4 1,622.4 1,711.8 1,804.8 1,877.0
Bond Rating* BBB-
YTM (Bonds) - KD 6.5%
Add: Depreciation
776.8 776.8 776.8 776.8 776.8 776.8 776.8
Tax Rate 16.0%
Less:Capital Expenditures 1,085.5 1,194.1 1,313.5 1,444.8 1,589.3 1,748.2 961.5
Beta 85.0%
Less: Increase in NWC (108.8) 108.4 37.4 38.9 40.4 42.1 43.7
Debt as % of Capital - WD 0.0%
FCF 1,447.8 928.0 962.4 915.5 858.9 791.4 1,648.6
10-Yr Treasury Bond Yield 4.5%
Market Risk Premium 6.0%
NWC 826.2 934.6 972.0 1,010.9 1,051.3 1,093.4 1,137.1
Fixed Assets (FA) 6,447.8 6,865.0 7,401.6 8,069.6 8,882.0 9,853.4 10,038.1
Cost of Equity - KE 9.6%
Change in FA 201.6 417.2 536.6 668.0 812.4 971.4 184.7
Equity as % of Capital 100.0%
NOPAT/ Sales 36.7% 31.1% 31.6% 32.1% 32.6% 33.0% 33.0%
WACC 9.6%
Appendix 4: DCF Valuation summary
Appendix 5: Peer Valuation Summary
Appendix 6: Net Asset Valuation Summary

CFA Research Challenge | 21 Feb 2015
16 | P a g e
Source: team calculations
F4. Consensus estimates
Source: S&P Capital IQ
F4. Stock performance
Source: S&P Capital IQ
STATOIL BP CHEVRON CONOCO PHILIPS ENI EXXON ROYAL DUTCH ROMGAZ
With variance targeting
With variance targeting
With variance targeting
With variance targeting
With variance targeting
With variance targeting
With variance targeting
With variance targeting
a0 0.061613 a0 0.035462 a0 0.048874 a0 0.078981 a0 0.034696 a0 0.037607 a0 0.049843 a0 0.132887
b0 0.919933 b0 0.951224 b0 0.94001 b0 0.910287 b0 0.960111 b0 0.938157 b0 0.940415 b0 0
w0 5.18E-06 w0 2.29E-06 w0 1.53E-06 w0 2E-06 w0 1.1E-06 w0 2.7E-06 w0 1.43E-06 w0 9.6E-05
a0+b0 0.981546 a0+b0 0.986686 a0+b0 0.988883 a0+b0 0.989268 a0+b0 0.994808 a0+b0 0.975764 a0+b0 0.990258 a0+b0 0.132887
MLE 880.86 MLE 951.55 MLE 990.77 MLE 958.60 MLE 914.37 MLE 1007.11 MLE 992.77 MLE 1006.37
0%
5%
10%
15%
20%
25%
30%
35%
40%
0.0
2.0
4.0
6.0
8.0
10.0
12.0
17
-Fe
b-1
4
03
-Ma
r-1
4
17
-Ma
r-1
4
31
-Ma
r-1
4
14
-Apr-
14
29
-Apr-
14
14
-Ma
y-1
4
28
-Ma
y-1
4
12
-Ju
n-1
4
26
-Ju
n-1
4
10
-Ju
l-1
4
24
-Ju
l-1
4
07
-Aug
-14
22
-Aug
-14
05
-Sep
-14
19
-Sep
-14
03
-Oct-
14
17
-Oct-
14
31
-Oct-
14
14
-Nov-1
4
28
-Nov-1
4
15
-Dec-1
4
31
-Dec-1
4
16
-Ja
n-1
5
30
-Ja
n-1
5
13
-Fe
b-1
5
# of Analyst Highest Recommendations (Thomson) # of Analyst High Recommendations (Thomson)
# of Analyst Neutral Recommendations (Thomson) Consensus upside potential (%)
0.00mm
0.50mm
1.00mm
1.50mm
2.00mm
2.50mm
3.00mm
-40%
-30%
-20%
-10%
0%
10%
20%
17
-Fe
b-1
4
03
-Ma
r-1
4
17
-Ma
r-1
4
31
-Ma
r-1
4
14
-Apr-
14
29
-Apr-
14
13
-Ma
y-1
4
27
-Ma
y-1
4
10
-Ju
n-1
4
24
-Ju
n-1
4
08
-Ju
l-1
4
22
-Ju
l-1
4
05
-Aug
-14
19
-Aug
-14
02
-Sep
-14
16
-Sep
-14
30
-Sep
-14
14
-Oct-
14
28
-Oct-
14
11
-Nov-1
4
25
-Nov-1
4
09
-Dec-1
4
23
-Dec-1
4
09
-Ja
n-1
5
23
-Ja
n-1
5
06
-Fe
b-1
5
Volume [LSE] Volume [BSE]
Romgaz Price Index (0=17/02/14) [BSE] Romgaz Price Index (0=17/02/14) [LSE]
GAZPROM TATNEFT LUKOIL ROSNEFT MOL OMV OMV PETROM REPSOL
With variance targeting
With variance targeting
With variance targeting
With variance targeting
With variance targeting
With variance targeting
With variance targeting
With variance targeting
a0 0.141639 a0 0.089622 a0 0.107395 a0 0.096575 a0 0.197924 a0 0 a0 0.068868 a0 0.023869
b0 0.812167 b0 0.895074 b0 0.860192 b0 0.879024 b0 0 b0 0.174444 b0 0.838707 b0 0.960578
w0 3.33E-05 w0 1.16E-05 w0 1.82E-05 w0 1.45E-05 w0 0.000213 w0 0.000167 w0 1.64E-05 w0 2.49E-06
a0+b0 0.953807 a0+b0 0.984696 a0+b0 0.967587 a0+b0 0.975599 a0+b0 0.197924 a0+b0 0.174444 a0+b0 0.907576 a0+b0 0.984447
MLE 742.50 MLE 748.95 MLE 795.49 MLE 791.37 MLE 863.15 MLE 901.96 MLE 928.78 MLE 946.14
Appendix 7: Consensus estimates
Appendix 8: Stock performance
Appendix 9: Generalized AutoRegressive Conditional Heteroskedasticity (GARCH)

CFA Research Challenge | 21 Feb 2015
17 | P a g e
Source: Team Estimates
Annual percentage change
Curr. Prices % GDP
95-10 2011 2012 2013 2014 2015 2016
GDP 637.6 100.0 3.0 1.1 0.6 3.4 3.0 2.7 2.9
Private Consumption 395.0 62.0 5.6 0.8 1.2 1.2 5.0 3.0 2.7
Public Consumption 90.5 14.2 0.2 0.6 0.4 -4.8 2.5 0.3 3.2
Gross fixed capital formation 151.6 23.8 5.9 2.9 0.1 -7.9 -5.4 3.5 4.1
of which: equipment 52.1 8.2 5.1 19.6 -2.7 -7.2 -5.9 4.0 4.5
Exports (goods and services) 253.4 39.7 9.3 11.9 1.0 16.2 8.4 5.7 5.8
Imports (goods and services) 257.6 40.4 12.8 10.2 -1.8 4.2 6.6 5.8 6.3
GNI (GDP deflator) 621.9 97.5 3.0 1.0 0.2 2.7 3.0 2.6 2.9
Contribution to GDP growth: Domestic demand 5.8 1.4 0.9 -2.1 2.2 2.7 3.1
Inventories -0.4 -0.2 -1.4 1.2 0.2 0.0 0.0
Net Exports -2.2 -0.1 1.1 4.3 0.6 0.0 -0.2
Employment -1.8 -0.8 -4.8 -0.6 0.2 0.3 0.4
Unemployment rate (a) 6.9 7.2 6.8 7.1 7.0 6.9 6.8
Compensation of employees/head 34.5 -4.1 9.4 2.7 4.7 3.4 4.1
Unit labour costs whole economy 28.2 -5.8 3.5 -1.3 1.8 0.9 1.5
Real unit labour costs -1.0 -
10.1 -1.4 -4.5 -0.6 -1.4 -0.9
Saving rate of households (b) -2.9 -7.0 -8.0 -
10.4 -
13.3 -
13.4 -
14.2
GDP deflator 29.5 4.7 4.9 3.4 2.4 2.3 2.5
Harmonised index of consumer prices - 5.8 3.4 3.2 1.4 1.2 2.5
Terms of trade goods 2.4 1.8 -3.4 -1.1 -0.1 0.0 0.7
Trade balance (goods) ( c ) -7.9 -6.7 -5.8 -3.9 -3.6 -3.6 -3.6
Current-account balance ( c ) -6.6 -4.7 -4.7 -1.2 -0.9 -1.1 -1.1 Net lending (+) or borrowing (-) vis-à-vis ROW ( c ) -6.1 -4.2 -3.3 1.1 1.4 1.3 1.2
General government balance ( c) -3.6 -5.5 -3.0 -2.2 -1.8 -1.5 -1.5
Cyclically-adjusted budget balance ( c ) -4.0 -4.4 -1.6 -1.4 -1.4 -1.2 -1.3
Structural budget balance ( c ) - -3.3 -2.1 -1.4 -1.3 -1.2 -1.3
General government gross debt ( c ) 18.1 34.2 37.3 38.0 38.7 39.1 39.3
(a) Eurostat definition. (b) gross saving dividend by gross disposable income. ( c ) as a percentage of GDP Source: European Economic Forecast EUROPEAN ECONOMY 1| 2015 Economic and Financial Affairs Winter 2015 / European Commission
Romgaz RON 2013 2014 2015 2016 2017
Revenue 3,894.27
A 4,665.69 E 4,955.53
E 5,219.97
E 5,019.85
E
EBITDA 2007.284 2547.36667 2682.5126 2769.08775 2402.05
EBIT 1189.582 1751.76667 1952.8762 2059.51125 1724.1
Net Income (Excl. Excep) 930.729 1487.9 1661.4602 1748.46625 1472.5
Net Debt -2534.254 -2659.06667 -2525.2404 -2518.8525 -2604
Depreciation & Amortization 817.702 685.03333 604.46667 622.26667 621.63333
Cash From Operations 1686.526 2329.4 2398.8 2649.4 2422
Capital Expenditure -876.264 -1119 -1232 -1367 -1442.5
Free Cash Flow 810.262 1192.46667 1149.86667 1264.4 858.2
Industry Specific 2013 2014 2015 2016 2017
Total Production - Natural Gas (MMCF) 199563.1815 199563.1815 193559.6882 185825.7762 176538.0188
Total Production (MBOE) 36900 36900 35800 34300 32600
Total Average Daily Production (MBOE) 101.1 101.1 98 94.1 89.4
Exploration Expense 61 100 200 200 200
ROE % 10.028 16.3 16.86 16.475
ROA % 8.9164 14 13 10.7
TEV 10802.33333 10611.35 10532.4 10625.55
RECOMMENDATIONS CAPITAL IQ
BVB:SNG - Recommendation: Outperform (2.29)
1 - Buy 2
2 - Outperform 1
3 - Hold 4
4 - Underperform 0
5 - Sell 0
0 - No Opinion 0
LSE:SNGR - Recommendation: Hold (3.00)
1 - Buy 0
2 - Outperform 0
3 - Hold 1
4 - Underperform 0
5 - Sell 0
0 - No Opinion 0
RECOMMENDATIONS FT.com
1 - Buy 2
2 - Outperform 2
3 - Hold 5
4 - Underperform 0
5 - Sell 0
0 - No Opinion 0
Appendix 10: Main features of Romania - forecast
Appendix 11: Consensus

CFA Research Challenge | 21 Feb 2015
18 | P a g e
Sources: Team Estimates
Sources: Team Estimates
Rivalry in the industry – HIGH
Two big competitors: Romgaz and OMV Petrom with similar
market share
Slow growth in the industry
Homogenous products
Bargaining Power of Suppliers -HIGH
Two main suppliers : Romgaz and OMV Petrom
Suppliers affect the market through charging high prices
Substitutes in the market are unavailable.
Threat of New Entrants – LOW
The industry is highly regulated by ANRE
Capital requirements are very high
Ownership of resources
Threat of Substitutes – LOW
Natural Gas is irreplaceable in the marketplace
Renewable energy will be a threat in the future
No cheaper alternative for now
Bargaining Power of Buyers – LOW
Gas is essential for the customer
Switching to alternative products is unrealizable for the
moment
The consumers will have in the future a large influence on prices
due to price liberalization
Porter’s Five
Forces
Appendix 12: Porter’s Five Forces
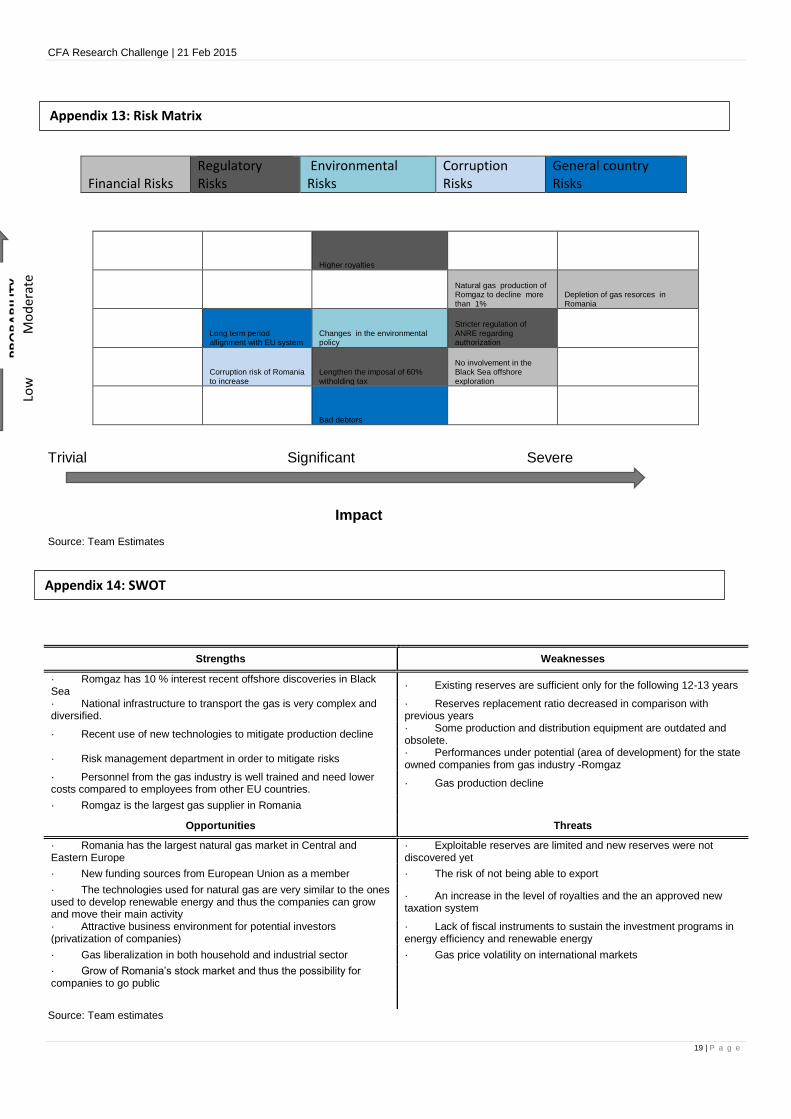
CFA Research Challenge | 21 Feb 2015
19 | P a g e
Financial Risks Regulatory Risks
Environmental Risks
Corruption Risks
General country Risks
Higher royalties
Natural gas production of Romgaz to decline more than 1%
Depletion of gas resorces in Romania
Long term period allignment with EU system
Changes in the environmental policy
Stricter regulation of ANRE regarding authorization
Corruption risk of Romania to increase
Lengthen the imposal of 60% witholding tax
No involvement in the Black Sea offshore exploration
Bad debtors
Trivial Significant Severe
Impact
Source: Team Estimates
Source: Team estimates
Strengths Weaknesses
· Romgaz has 10 % interest recent offshore discoveries in Black Sea
· Existing reserves are sufficient only for the following 12-13 years
· National infrastructure to transport the gas is very complex and diversified.
· Reserves replacement ratio decreased in comparison with previous years
· Recent use of new technologies to mitigate production decline · Some production and distribution equipment are outdated and obsolete.
· Risk management department in order to mitigate risks · Performances under potential (area of development) for the state owned companies from gas industry -Romgaz
· Personnel from the gas industry is well trained and need lower costs compared to employees from other EU countries.
· Gas production decline
· Romgaz is the largest gas supplier in Romania
Opportunities Threats
· Romania has the largest natural gas market in Central and Eastern Europe
· Exploitable reserves are limited and new reserves were not discovered yet
· New funding sources from European Union as a member · The risk of not being able to export
· The technologies used for natural gas are very similar to the ones used to develop renewable energy and thus the companies can grow and move their main activity
· An increase in the level of royalties and the an approved new taxation system
· Attractive business environment for potential investors (privatization of companies)
· Lack of fiscal instruments to sustain the investment programs in energy efficiency and renewable energy
· Gas liberalization in both household and industrial sector · Gas price volatility on international markets
· Grow of Romania’s stock market and thus the possibility for companies to go public
PR
OB
AB
ILIT
Y
Low
M
od
erat
e
Hig
h
Appendix 13: Risk Matrix
Appendix 14: SWOT

CFA Research Challenge | 21 Feb 2015
20 | P a g e
Source: S&P Capital IQ
32.00
32.50
33.00
33.50
34.00
34.50
35.00
35.50
36.00
36.50
37.00
GMS appointed the new company Negotiations for
selling of 50% of its 30% stake in two oil
Govt imposed to gas producers to sell a minimum volume of gas
Govt postponed the deadline for price liberalisation of gas supplied
Net Profit for the First Nine Months: +
The approval for the establishment of an underground gas storage
Mr. Dragos Dorcioman was appointed as interim Director
Provision of earnings guidance for the year 2014
0 1000 2000 3000 4000 5000 6000 7000
2011
2012
2013
2014
2015e
2016e
Retained Earnings Reserves Share capital
Appendix 15: Events
Appendix 16: Share capital, Reserves and Retained Earnings

CFA Research Challenge | 21 Feb 2015
21 | P a g e
Net profit
EBITDA
Revenues
- 1,000 2,000 3,000 4,000 5,000 6,000
2016e 2015e 2014 2013 2012
3,854 3,595 3,314 3,505 3,925.60
4,396.67
345 245
365 404
448.44
497.77 349
343 551 584
654.08
732.57
2011 2012 2013 2014e 2015e 2016e
Upstream Storage Others
0.00
500,000.00
1.00mm
1.50mm
2.00mm
2.50mm
3.00mm
3.50mm
4.00mm
7.00
7.20
7.40
7.60
7.80
8.00
8.20
8.40
Volume Share Pricing
Potential Transactions Corporate Structure Related
Results Announcements/Corporate Communications Customer/Product Related
Company Forecasts and Ratings Dividends/Splits
Listing/Trading Related
Appendix 17: Revenues/ EBITDA/ Net profit
Appendix 18: Sales
Appendix 19: Corporate Timeline

CFA Research Challenge | 21 Feb 2015
22 | P a g e
30
31
32
33
34
35
36
37
0
500000
1000000
1500000
2000000
2500000
3000000
41
61
9
41
62
6
41
63
3
41
64
0
41
64
7
41
65
4
41
66
1
41
66
8
41
67
5
41
68
2
41
68
9
41
69
6
41
70
3
41
71
0
41
71
7
41
72
4
41
73
1
41
73
8
41
74
5
41
75
2
41
75
9
41
76
6
41
77
3
41
78
0
41
78
7
41
79
4
41
80
1
41
80
8
41
81
5
41
82
2
41
82
9
41
83
6
41
84
3
41
85
0
41
85
7
41
86
4
41
87
1
41
87
8
41
88
5
41
89
2
41
89
9
41
90
6
RO
N
Th
ou
sa
nd
RO
N
Other Import Gas Electricity UGS Internal Production ROMGAZ PRICE
0
500000
1000000
1500000
2000000
2500000
3000000
2010 2011 2012 2013
Th
ou
sa
nd
RO
N
Internal gas production and sale Underground storage activity Sale of import gas Other revenues Electricity
3271662
3280213
3193503
3947461
4195477
3837941
3894267
2007 2008 2009 2010 2011 2012 2013
Appendix 20: Evolution of stock price and revenues
Appendix 21: Breaking down Romgaz Revenues
Appendix 21: Romgaz revenue evolution (thousands)

CFA Research Challenge | 21 Feb 2015
23 | P a g e
Source: Bucharest Stock Exchange, team calulation
Source: INSSE
y = 0.8321x - 0.0004 R² = 0.3524
-6.0%
-5.0%
-4.0%
-3.0%
-2.0%
-1.0%
0.0%
1.0%
2.0%
3.0%
4.0%
5.0%
-6.0% -4.0% -2.0% 0.0% 2.0% 4.0%
2010 2011 2012 2013
Total 20.25 20.15 20.08 19.96
Rural 9.35 9.28 9.22 9.14
Urban 10.90 10.87 10.86 10.83
0.00
5.00
10.00
15.00
20.00
25.00
Total Rural Urban
Appendix 23: Beta Romgaz
Appendix 24: Romania’s Demography
13.7 13 12.1 12.9 12.7 12.4 12.1 11.6 11.1 11.1 11.5 11 10.3 10.6 7.9 8
3.3 2.9 3.5
5.4 5 5.2 5.2 4.8
4.4 2 2.3 3.2
3.2 1.9
1.2 0.4
0
2
4
6
8
10
12
14
16
18
20
2000 2001 2002 2003 2004 2005 2006 2007 2008 2009 2010 2011 2012 2013 9M 2013 9M 2014
Domestic supply Import
Appendix 22: Gas supply and consumption in Romania (bcm)

CFA Research Challenge | 21 Feb 2015
24 | P a g e
Shape of the yield curve
Source: Thomson Reuters Datastream, team calculations
6.30 6.66
6.36 6.45 6.88
2.70 3.00
3.96
4.81
5.43
2.25 2.31
2.93 3.40
4.36
1.51 1.75 2.31
2.77
3.68
6M 1Y 3Y 5Y 10Y
Yie
ld (
%)
Maturity
Jan-2013 Jan-2014
Jul-2014 Jan-2015
Appendix 25: Shape of the yield curve
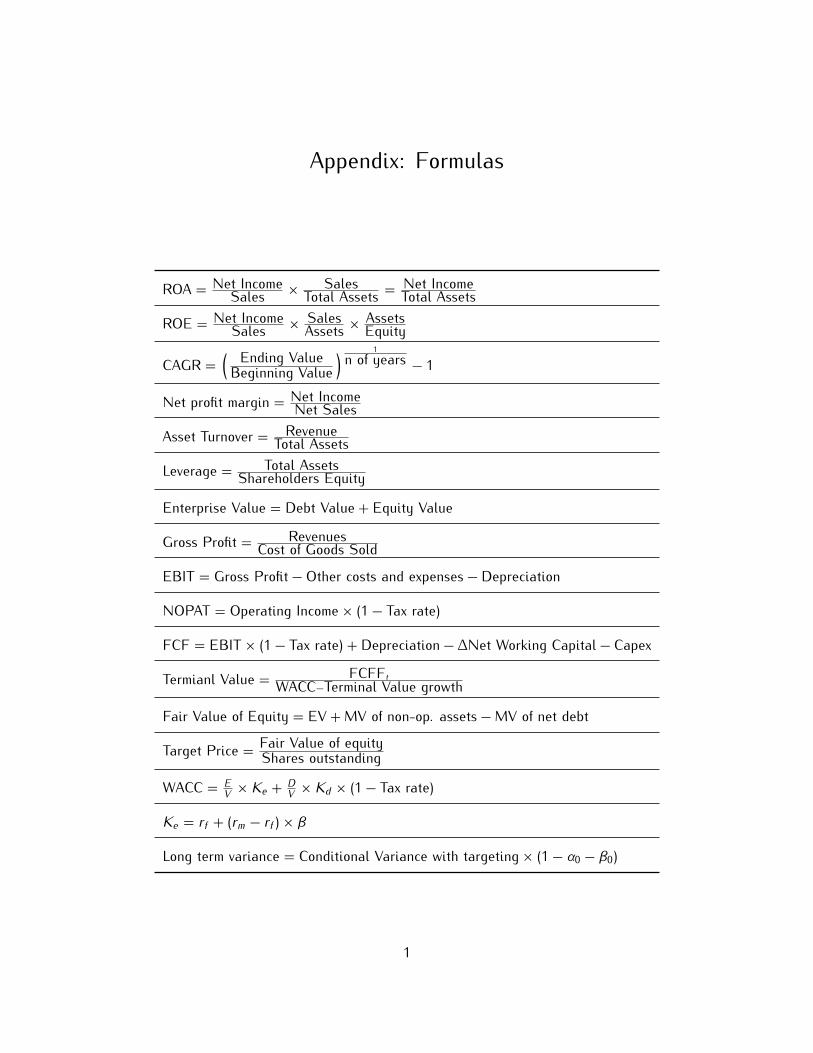
Appendix: Formulas
ROA = Net IncomeSales × SalesTotal Assets = Net IncomeTotal AssetsROE = Net IncomeSales × SalesAssets × AssetsEquityCAGR = ( Ending ValueBeginning Value) 1n of years − 1Net profit margin = Net IncomeNet SalesAsset Turnover = RevenueTotal AssetsLeverage = Total AssetsShareholders EquityEnterprise Value = Debt Value + Equity ValueGross Profit = RevenuesCost of Goods SoldEBIT = Gross Profit − Other costs and expenses − DepreciationNOPAT = Operating Income × (1 − Tax rate)FCF = EBIT × (1 − Tax rate) + Depreciation − ∆Net Working Capital − CapexTermianl Value = FCFFtWACC−Terminal Value growthFair Value of Equity = EV + MV of non-op. assets − MV of net debtTarget Price = Fair Value of equityShares outstandingWACC = E
V × Ke + DV × Kd × (1 − Tax rate)
Ke = rf + (rm − rf ) × β
Long term variance = Conditional Variance with targeting × (1 − α0 − β0)
1

Disclosures: Ownership and material conflicts of interest: The authors or a member of their household, of this report do not hold a financial interest in the securities of this company. The authors or a member of their household, of this report do not know of the existence of any conflicts of interest that might bias the content or
publication of this report.
Receipt of compensation:
Compensation of the authors of this report is not based on investment banking revenue.
Position as an officer or director:
The authors or a member of their household, does not serves as an officer, director or advisory board member of the subject company.
Market making:
The authors do not act as a market maker in the subject company’s securities.
Ratings guide:
Banks rate companies as a BUY, HOLD or SELL. A BUY rating is given when the security is expected to deliver absolute returns of 15% or greater
over the next twelve month period, and recommends that investors take a position above the security’s weight in the S&P 500, or any other relevant
index. A SELL rating is given when the security is expected to deliver negative returns over the next twelve months, while a HOLD rating implies flat
returns over the next twelve months.
Disclaimer: The information set forth herein has been obtained or derived from sources generally available to the public and believed by the author to be reliable, but the author does not make any representation or warranty, express or implied, as to its accuracy or completeness. The information is not intended to be used as the basis of any investment decisions by any person or entity. This information does not constitute investment advice, nor is it an offer or a solicitation of an offer to buy or sell any security. This report should not be considered to be a recommendation by any Research Challenge with regard to this company’s stock.