certs microgrid: modeling, analysis and control … · certs microgrid: modeling, analysis and...
TRANSCRIPT
CERTS MICROGRID: MODELING,
ANALYSIS AND CONTROL OF
DISTRIBUTED ENERGY RESOURCES PHASE I
Ajit A. Renjit, Mahesh S. Illindala, Abrez Mondal
Department of Electrical and Computer Engineering
The Ohio State University
Columbus, OH 43210
Technical Report Prepared under Subcontract No. 7004227
Lawrence Berkeley National Laboratory
December 2015

i THE OHIO STATE UNIVERSITY Electrical and Computer Engineering
Acknowledgments
The work described in this report was coordinated by the Consortium for Electric
Reliability Technology Solutions, and funded by the Office of Electricity Delivery and
Energy Reliability, Power Systems Engineering R&D Program of the U.S. Department
of Energy through a Subcontract #7004227 with The Ohio State University
administered by the Lawrence Berkeley National Laboratory.
Specifically, the authors would like to thank Robert H. Lasseter, University of
Wisconsin-Madison, Joseph H. Eto, Lawrence Berkeley National Laboratory, and
Benjamin L. Schenkman, Sandia National Laboratory for unfailing support and
encouragement. This work would not have been possible without the sharing of
knowledge, experience and field-testing carried out at the CERTS Microgrid test bed in
AEP Dolan Technology Center, Groveport, OH by David A. Klapp and Amrit S. Khalsa.

ii THE OHIO STATE UNIVERSITY Electrical and Computer Engineering
Executive Summary
Introduction:
A microgrid provides the framework for integration and coordination of distributed
energy resources (DERs). The aim of this work is to develop dynamic models for two
kinds of prime-mover driven DERs synchronous generator-based DER (also known as
‘genset’) and inverter-based DER installed at the CERTS Microgrid in AEP Dolan
Technology Center, Groveport, OH. Such models could be used in analyzing various
system scenarios including large-scale distribution systems, which maybe otherwise
impractical to do actual testing due to resource limitations in the field test bed.
Problem Identification:
The microgrid can work either in the grid-connected or islanded mode. However, the
islanded mode of operation presents many challenges to the microgrid survivability. In
particular, adverse conditions are observed in an islanded microgrid when large and
fluctuating loads are supplied from several smaller-rated DERs. Similar consequences
follow the loss of generation in the microgrid causing a large change in net load to the
surviving DERs. If any of these DERs cannot sustain the net load change, they lead the
microgrid system to a cascading failure.
Conclusion:
In this work, it was discovered that a large electrical load demand, sometimes even
within the DER kW-rating, can result in its prime-mover stalling. This is because every
engine is rated for maximum torque, or in other words, the mechanical power production
iii THE OHIO STATE UNIVERSITY Electrical and Computer Engineering
capability of engine is derated at lower speeds. Due to the lower inertia of DERs
employed in a microgrid system, their prime-mover speed undergoes huge swings upon a
large disturbances. The root cause of stalling behavior is the slow response of the engine
governor that restores the prime-mover speed following a load change.
In a synchronous generator-based DER (i.e., genset), the prime-mover speed is
proportional to the DER’s frequency. Hence, the stalling in genset causes a frequency
collapse in the microgrid. By contrast, the prime-mover stalling in an inverter-based DER
results in a voltage collapse. This is because the inverter-based DER has an additional
power conditioning stage after the permanent magnet synchronous generator (PMSG).
When multiple DERs are integrated in a microgrid, these DERs are expected to share
with each other their surplus marginal capacity so that no one will get overloaded.
However, this did not happen in a particular test carried out at the CERTS Microgrid, i.e.,
a mixed source microgrid comprising genset and inverter-based DER. It was found that
the slow acting governor controls of genset did not rescue the inverter-based DER from
its prime-mover stalling. A large load change caused voltage collapse in the inverter-
based DER and led to a cascading failure of the microgrid.
Recommendation:
To avoid the DER prime-mover stalling in a microgrid, the CERTS Pmax controls can
be applied. Otherwise, a modified active power-frequency (P-ω) droop controller is a
viable option for an inverter-based DER that is sharing load together with a genset.
Besides, prime-mover stalling could be prevented by making design changes to engine
governor controls. The ultimate goal is to improve DER coordination in the microgrid.

iv THE OHIO STATE UNIVERSITY Electrical and Computer Engineering
Thesis and Publications
[P1] A. A. Renjit, “Modeling, Analysis and Control of Mixed Source Microgrid,”
Ph.D. Dissertation, Electrical and Computer Engineering, The Ohio State University,
Columbus, OH, Dec. 2015.
[P2] A. A. Renjit, M. S. Illindala, and D. A. Klapp, “Graphical and Analytical Methods
for Stalling Analysis of Engine Generator Sets,” IEEE Trans. Ind. Appl., vol. 50, no. 5,
pp. 2967–2975, Sep. 2014.
[P3] A. A. Renjit and M. S. Illindala, "Graphical and analytical methods for stalling of
engine generator set," in Power Electronics, Drives and Energy Systems (PEDES), 2012
IEEE International Conference on, Dec. 2012, pp. 1–6.
[P4] A. A. Renjit, M. S. Illindala, R. H. Lasseter, M. J. Erickson, and D. Klapp,
“Modeling and control of a natural gas generator set in the CERTS microgrid,” in Energy
Conversion Congress and Exposition (ECCE), 2013 IEEE, 2013, pp. 1640–1646.
[P5] A. Mondal, M. S. Illindala, A. A. Renjit, and A. S. Khalsa, “Analysis of limiting
bounds for stalling of natural gas genset in the CERTS microgrid test bed,” in Power
Electronics, Drives and Energy Systems (PEDES), 2014 IEEE International Conference
on, Dec. 2014, pp. 1–5.
[P6] A. A. Renjit, M. S. Illindala, and D. A. Klapp, “Modeling and analysis of the
CERTS microgrid with natural gas powered distributed energy resources,” in Industrial
& Commercial Power Systems Technical Conference (I&CPS), 2015 IEEE/IAS 51st,
2015, pp. 1–8.

v THE OHIO STATE UNIVERSITY Electrical and Computer Engineering
Table of Contents
Executive Summary ............................................................................................................ ii
Table of Contents ................................................................................................................ v
List of Tables ................................................................................................................... viii
List of Figures .................................................................................................................... ix
CHAPTER 1 MODELING OF RECIPROCATING ENGINE DRIVEN DISTRIBUTED
ENERGY RESOURCES .................................................................................................... 1
1.1 Introduction ................................................................................................... 1
1.2 CERTS Microgrid Test Bed – System Description ...................................... 1
1.3 Modeling of Synchronous Generator-based Distributed Energy Resource
(i.e., Genset) ......................................................................................................... 3
1.4 Modeling of Inverter-based Distributed Energy Resource ......................... 10
1.5 Summary ..................................................................................................... 14
CHAPTER 2 ANALYSIS OF PRIME-MOVER STALLING IN RECIPROCATING
ENGINE DRIVEN DISTRIBUTED ENERGY RESOURCES ....................................... 16
2.1 Introduction ................................................................................................. 16
2.2 Prime-mover Stalling in a Synchronous Generator-based Distributed
Energy Resource ................................................................................................ 16

vi THE OHIO STATE UNIVERSITY Electrical and Computer Engineering
2.3 Stalling Analysis of Synchronous Generator-based DERs with Load Relief
Scheme ............................................................................................................... 23
2.4 Prime-mover Stalling in an Inverter-based Distributed Energy Resource .. 26
2.5 Effect of Incremental Load Change on Prime-mover Stalling ................... 34
2.6 Comparison Between Synchronous Generator-based DERs and Inverter-
based DERs ........................................................................................................ 36
2.7 Summary ..................................................................................................... 36
CHAPTER 3 DER OPERATION AT LIMITING CONDITIONS IN AN ISLANDED
MICROGRID .................................................................................................................... 38
3.1 Introduction ................................................................................................. 38
3.2 Load Sharing Between Two Gensets in a Microgrid at Limiting Conditions
38
3.3 Load Sharing in a Mixed Source Microgrid Under Limiting Conditions ... 45
3.4 Why is the Underfrequency Load Relief (V/Hz) Scheme not used in
Gensets for Operation in Microgrid? ................................................................. 52
3.5 Summary ..................................................................................................... 54
CHAPTER 4 CONTROL AND PREVENTION OF PRIME-MOVER STALLING IN
DISTRIBUTED ENERGY RESOURCES ....................................................................... 55
4.1 Introduction ................................................................................................. 55
4.2 Analysis of DER Prime-mover Stalling in a Mixed Source Microgrid ...... 56
vii THE OHIO STATE UNIVERSITY Electrical and Computer Engineering
4.3 Prevention of DER Prime-mover Stalling in a Mixed Source Microgrid ... 61
4.4 Prevention of DER Prime-mover Stalling Through Governor Controls .... 67
4.5 Summary ..................................................................................................... 69
CHAPTER 5 CONCLUSION AND FUTURE WORK ................................................... 70
5.1 Conclusion .................................................................................................. 70
5.2 Suggested Future Work ............................................................................... 72
Appendix A ....................................................................................................................... 74
Appendix B ....................................................................................................................... 76
References ......................................................................................................................... 78

viii THE OHIO STATE UNIVERSITY Electrical and Computer Engineering
List of Tables
Table 2.1 Calculated values of 𝑁𝑁𝑁𝑁 − 𝑙𝑙𝑙𝑙𝑙𝑙1 & 𝜔𝜔𝑁𝑁 − 𝑙𝑙𝑙𝑙𝑙𝑙1 for different step load
changes .............................................................................................................................. 22
Table 2.2 Synchronous generator-based DERs vs. inverter-based DERs .................. 36
Table 4.1 Difference between the frequency response of traditional and modified P -
ω droop controller ............................................................................................................. 62
Table 4.2 Lead/lag transfer function based modified droop controller settings ......... 63

ix THE OHIO STATE UNIVERSITY Electrical and Computer Engineering
List of Figures
Figure 1.1 Simplified schematic illustrating the interconnection of natural gas engine
driven DERs at the CERTS Microgrid test bed .................................................................. 2
Figure 1.2 Controller architecture of MTU Onsite Energy natural gas engine driven
synchronous generator-based DER (or ‘genset’). ............................................................... 4
Figure 1.3 Genset performance with isochronous governor for a 0 − 80 kW step
change in electrical load. Experimental waveforms are presented on the left column and
the corresponding simulation results are on the right column. ........................................... 9
Figure 1.4 Control architecture of the inverter-based DER model. (a) Natural gas
engine driven PMSG prime-mover, and (b) integration of CERTS controls into power
conditioning system (PCS). .............................................................................................. 11
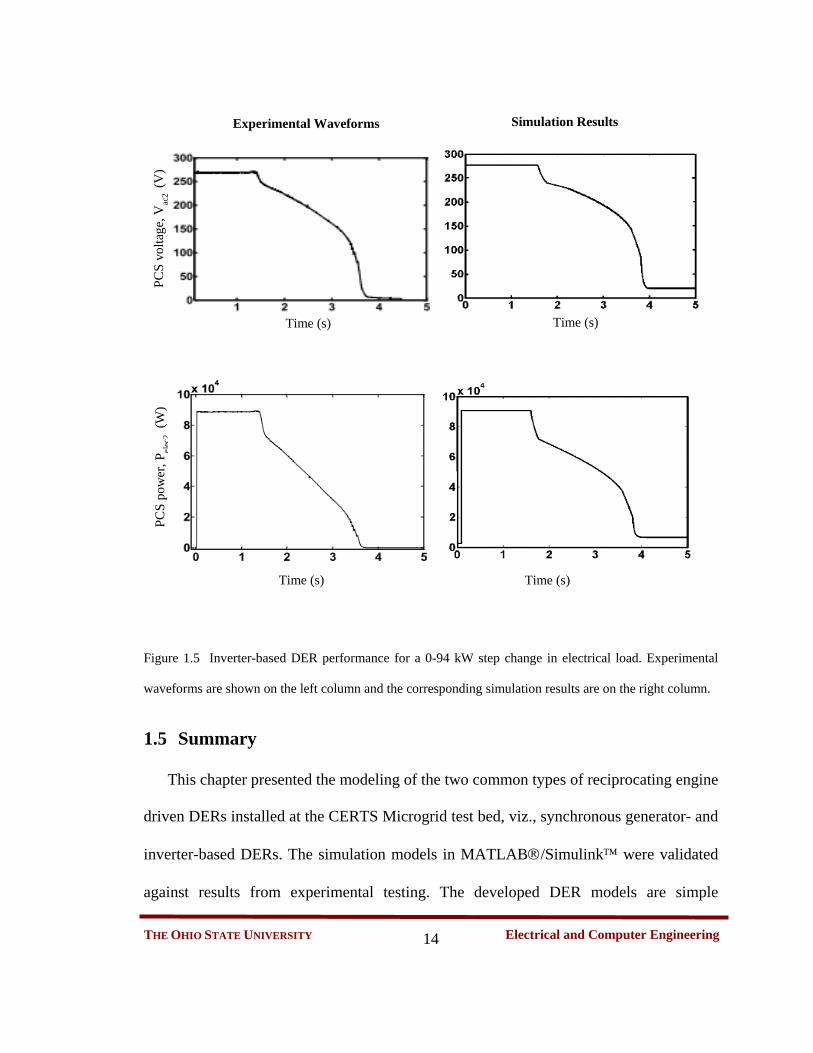
Figure 1.5 Inverter-based DER performance for a 0-94 kW step change in electrical
load. Experimental waveforms are shown on the left column and the corresponding
simulation results are on the right column. ....................................................................... 14
Figure 2.1 Block diagram of the electromechanical energy conversion process in a
synchronous generator-based DER (i.e., genset) .............................................................. 17
Figure 2.2 Fuel map of GM 8.1L natural gas engine [31] .......................................... 18
Figure 2.3 Speed vs. active power characteristics of the genset for a 0−70 kW step
load application ................................................................................................................. 20
x THE OHIO STATE UNIVERSITY Electrical and Computer Engineering
Figure 2.4 Locus of the active power-speed characteristics of the genset for 90% (i.e.
0−90 kW) step load application. ....................................................................................... 23
Figure 2.5 Experimental plots showing the genset response with load relief (V/Hz)
scheme for a 20−95 kW step change in electrical load ..................................................... 25
Figure 2.6 Locus of the speed vs. active power characteristics of the genset with load
relief (V/Hz) scheme for 20−95 kW step load application ............................................... 26
Figure 2.7 An inverter-based distributed energy resource (DER). (a) Simplified
schematic, and (b) block diagram of the electromechanical energy conversion process. 27
Figure 2.8 Locus of the PMSG speed and voltage vs. active power for the inverter-
based DER in response to a 0−94 kW step load application ............................................. 29
Figure 2.9 Inverter-based DER output characteristics for a 0−94 kW step load
application. (a) PCS output voltage (Vac2, RMS value) vs. active power, and (b) PCS
output frequency vs. active power. ................................................................................... 31
Figure 2.10 Locus of the PMSG speed and voltage vs. active power for the inverter-
based DER in response to a 0−70 kW step load application ............................................. 32
Figure 2.11 Inverter-based DER output characteristics for a 0−70 kW step load
application. (a) PCS output voltage (Vac2, RMS value) vs. active power, and (b) PCS
output frequency vs. active power. ................................................................................... 33
Figure 2.12 Locus of speed vs. active power for (a) genset with 70−90 kW load
change, and (b) inverter-based DER with 60−94 kW load change. .................................. 35
xi THE OHIO STATE UNIVERSITY Electrical and Computer Engineering
Figure 3.1 Schematic illustrating the interconnection of two gensets in an islanded
microgrid ........................................................................................................................... 39
Figure 3.2 Genset-1 (a) Steady state speed governor droop characteristics with Pref1 =
0 kW, and (b) locus of the active power-speed response for a 20−90 kW step load
application. ........................................................................................................................ 40
Figure 3.3 Genset-2 (a) Steady state speed governor droop characteristics with Pref2 =
40 kW, and (b) locus of the active power-speed response for a 20−90 kW step load
application. ........................................................................................................................ 41
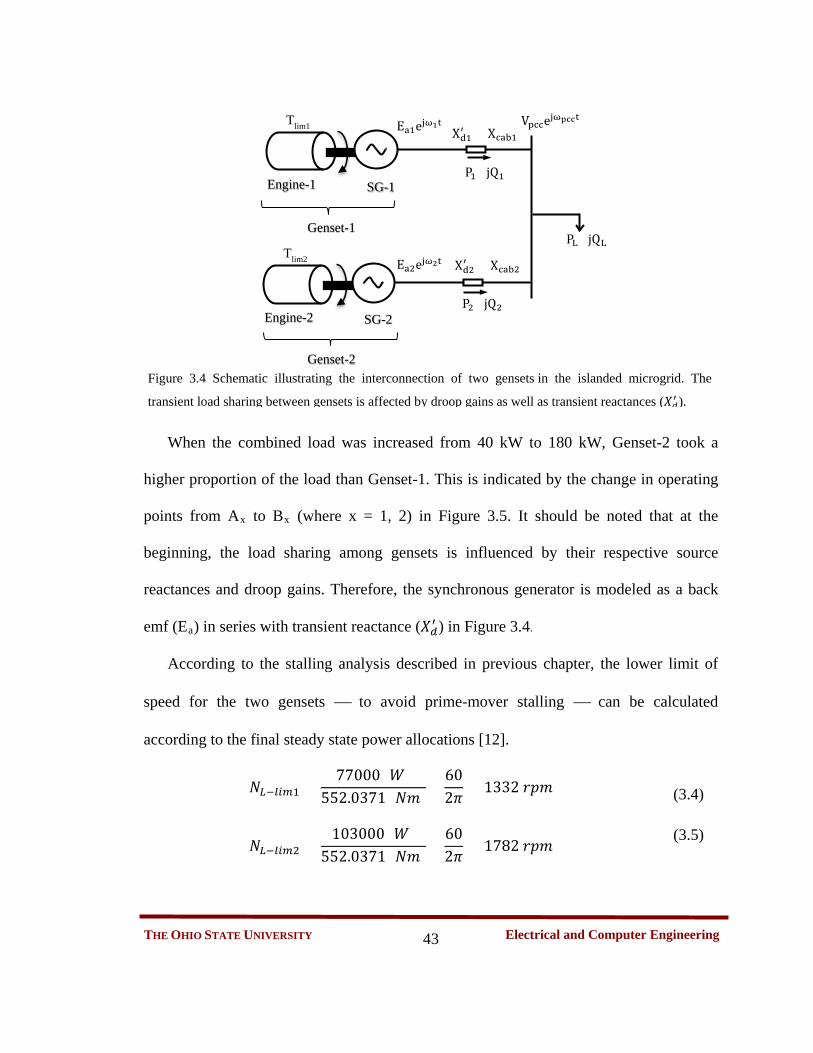
Figure 3.4 Schematic illustrating the interconnection of two gensets in the islanded
microgrid. The transient load sharing between gensets is affected by droop gains as well
as transient reactances (𝑋𝑋𝑋𝑋′). ............................................................................................ 43
Figure 3.5 Load sharing among Genset-1 and Genset-2. (a) Steady state speed
governor droop characteristics, and (b) locus of the active power-speed response for a
40−180 kW step load application. ..................................................................................... 44
Figure 3.6 Schematic of the mixed source microgrid comprising synchronous
generator-based and inverter-based DERs ........................................................................ 46
Figure 3.7 Simulation results illustrating the system performance for a load change
from 75 kW to 150 kW. DER-1 (genset in blue): isochronous governor; DER-2 (inverter-
based DER in red): Pref2 = 0 kW, Pmax2 = 100 kW. .......................................................... 47
Figure 3.8 Experimental results illustrating the system performance for a load change
from 75 kW to 150 kW. DER-1 (genset in blue): isochronous governor; DER-2 (inverter-
based DER in red): Pref2 = 0 kW, Pmax2 = 100 kW. .......................................................... 48

xii THE OHIO STATE UNIVERSITY Electrical and Computer Engineering
Figure 3.9 Steady state load sharing between DER-1 and DER-2 for a load change
from 75 kW to 150 kW. DER-1 (genset): isochronous governor; DER-2 (inverter-based
DER): Pref2 = 0 kW, Pmax2 = 100 kW. ............................................................................... 49
Figure 3.10 Simulation results illustrating the system performance for a load change
from 75 kW to 150 kW. DER-1 (genset in blue): Pref1 = 75 kW, Pmax1 = 93 kW; DER-2
(inverter-based DER in red): Pref2 = 0 kW, Pmax2 = 100 kW. ........................................... 50
Figure 3.11 Experimental results illustrating the system performance for a load
change from 75 kW to 150 kW. DER-1 (genset in blue): Pref1 = 75 kW, Pmax1 = 93 kW;
DER-2 (inverter-based DER in red): Pref2 = 0 kW, Pmax2 = 100 kW. ............................... 51
Figure 3.12 Steady state load sharing between DER-1 and DER-2 for a load change
from 75 kW to 150 kW. DER-1 (genset): isochronous governor; DER-2 (inverter-based
DER): Pref2 = 0 kW, Pmax2 = 100 kW. ............................................................................... 52
Figure 3.13 Experimental results illustrating the system performance for a load
change from 75 kW to 150 kW. DER-1 (genset in blue): Pref1 = 0 kW, Pmax1 = 100 kW,
and load relief (V/Hz) is enabled; DER-2 (inverter-based DER in red): Pref2 = 0.75 kW,
Pmax2 = 100 kW. ................................................................................................................ 54
Figure 4.1 Schematic of the mixed source microgrid comprising inverter- and
synchronous generator-based DERs. ................................................................................ 56
Figure 4.2 Experimental results showing the performance of the DERs for a load
change from 75 kW to 150 kW. DER-1 (genset in red): isochronous governor; DER-2
(inverter-based DER in blue): Pref2 = 37.5 kW, Pmax2 = 100 kW. .................................... 58
xiii THE OHIO STATE UNIVERSITY Electrical and Computer Engineering
Figure 4.3 Simulation results showing the performance of the DERs for a load
change from 75 kW to 150 kW. DER-1 (genset in red): isochronous governor; DER-2
(inverter-based DER in blue): Pref2 = 37.5 kW, Pmax2 = 100 kW. .................................... 59
Figure 4.4 Simulation plot showing the frequency collapse in the genset (DER-1) of
the mixed source microgrid for a 75−150 kW step load application. ............................... 60
Figure 4.5 Locus of the PMSG speed and voltage vs. power characteristics for the
inverter-based DER (DER-2) in the mixed source microgrid for a 75−150 kW step load
application. ........................................................................................................................ 60
Figure 4.6 Block diagram of inverter-based DER’s modified power-frequency (P-ω)
droop controller using lead/lag controls ........................................................................... 62
Figure 4.7 Transient and steady state frequency droop curves of the inverter-based
DER with modified power-frequency (P-ω) controls. ...................................................... 63
Figure 4.8 Simulation plots illustrating the system dynamic response for a 75−150 kW
step change in electrical load. DER-1 (genset in red): isochronous governor; DER-2
(inverter-based DER in blue): Pref2 = 37.5 kW, Pmax2 = 100 kW. .................................... 64
Figure 4.9 Locus of the PMSG speed and voltage vs. power characteristics for the
inverter-based DER in the mixed source microgrid for a 75−150 kW step load application
........................................................................................................................................... 65
Figure 4.10 Results showing the performance of the proposed controller for 75−150
kW load change. DER1 (synchronous generator in red): isochronous governor; DER2
(inverter in blue): Pref2 = 37.5 kW, Pmax2 = 100 kW. See Figure 4.8 for the description of
event . ............................................................................................................................ 66
xiv THE OHIO STATE UNIVERSITY Electrical and Computer Engineering
Figure 4.11 Locus of the genset speed vs. power characteristics for a 0−90 kW step
load application. Governor PID controller’s proportional gain is set at (a) Kpg1 = 15, and
(b) Kpg1 = 24 ..................................................................................................................... 68

1 Electrical and Computer Engineering THE OHIO STATE UNIVERSITY
CHAPTER 1
MODELING OF RECIPROCATING ENGINE DRIVEN
DISTRIBUTED ENERGY RESOURCES
1.1 Introduction
This chapter presents the modeling of two kinds of natural gas powered distributed
energy resources (DERs), viz., synchronous generator-based and inverter-based DERs,
installed at the CERTS Microgrid test bed.
1.2 CERTS Microgrid Test Bed – System Description
The Consortium of Electric Reliability Technology Solutions (CERTS) Microgrid test
bed was established at the American Electric Power Dolan Technology Center to test the
commercial off-the-shelf DERs for plug-and-play operation, peer-to-peer coordination,
and seamless islanding and reconnection capabilities [1]–[3]. An overview of the CERTS
Microgrid test bed, consisting of three natural gas powered combined heat and power
(CHP) DERs manufactured by Tecogen, is given in [1]. All the three units were at first
inverter-based DERs with the CERTS controls [4]–[6]. Later, one of these units was
replaced with a synchronous generator-based DER (also known as ‘genset’)
manufactured by MTU Onsite Energy. This is because gensets are popular and
affordable to many customers. A simplified schematic of the CERTS Microgrid test bed
is illustrated in Figure 1.1, where the system under study is shaded in green color.

2 Electrical and Computer Engineering THE OHIO STATE UNIVERSITY
Figure 1.1 Simplified schematic illustrating the interconnection of natural gas engine driven DERs at the
CERTS Microgrid test bed
It should be noted that the models for all the components installed at the CERTS
Microgrid test bed were developed in MATLAB/Simulink/SimPowerSystems
toolbox using a black-box approach with only publicly disclosed information and
empirical knowledge supported by observed facts from the several tests carried out. The
aim is to find simple system models that show the dynamic behavior without infringing
on the confidential information of the commercial equipment manufacturers. Such
models can be easily multiplied wherever necessary with proper scaling to help analyze
various scenarios that maybe otherwise impractical, expensive and time consuming for
undertaking a full scale field-testing.
480/277 V, 150 A, 100 kW, 125 kVA
Load Bank
(DER-2) Tecogen InVerdẽ INV-100
Tecogen InVerdẽ Prototype
480/277V, 100A, 60kW, 85kVA
(DER-1) MTU Onsite Energy Natural Gas Genset
480/277 V, 139 A, 104 kW, 225 kVA
Load Bank
Load Bank
Load Bank
to Utility Grid

3 Electrical and Computer Engineering THE OHIO STATE UNIVERSITY
1.3 Modeling of Synchronous Generator-based Distributed Energy
Resource (i.e., Genset)
The model of an engine generator set (or genset) has many subsystems that represent
its physical behavior. Typically, the genset has a reciprocating engine coupled to the
synchronous generator through a mechanical shaft [7]. The engine speed is regulated
using an isochronous governor, and the synchronous generator’s field circuit is controlled
by a brushless exciter. Figure 1.2 displays the detailed control architecture of the MTU
Onsite Energy genset. In the CERTS Microgrid test bed, the MTU Onsite Energy
natural gas powered genset (i.e., DER-1) has a GM 8.1L, 496cc engine (with 8.1L
displacement and 4-cycle) with an electronic isochronous speed governor. The output
voltage of generator is regulated through a Basler DECS-250 digital voltage regulator
(DVR), which can be programmed with adjustable load relief (V/Hz) characteristics. The
genset model parameters are given in Appendix A.
1.3.1 Engine speed governor
A majority of commercial off-the-shelf gensets come with an electronic isochronous
governor. This governor can be modeled by a proportional−integral−derivative (PID)
controller that regulates the engine speed, ω1, to match the generator speed reference set-
point, ωref1. During a load change, it helps adjust the fuel intake of the engine cylinders.
Thus, the output of the governor is the desired fuel quantity to be delivered to generate
the required torque.

4 Electrical and Computer Engineering THE OHIO STATE UNIVERSITY
1.3.2 Natural gas engine
An alteration in the fuel quantity does not cause a change of engine torque at once. In
natural gas engines, an inherent delay exists between the fuel flow (out of the intake
manifold of the engine) and the actual torque production. This time delay is comprised of
different lags in the fuel delivery and combustion process. The total delay calculation
between fuel intake and torque production for a four stroke engine is given by the
following equation [8]:
𝑡𝑡𝑑𝑑1 = �60𝑛𝑛1� �1 +
1𝑛𝑛𝑐𝑐𝑐𝑐𝑐𝑐1
� + �45
6𝑛𝑛1� (1.1)
Pmax1
Pelec1 bp1
Pref1
Δωmax1
ωref1 0
PI
ωnom1 PID e−std1
1J1s + B1
SG
ω1
Vac1ejω1t
Qe1
bq1 Qref1
Vnom1
Vref1
Vac1
PID 1/sτe1
Ke1
Se1
Ve1
Tlim1 Tm1
Te1
ω1
0
MTU / Onsite Energy Natural Gas Genset, DER-1
∑
∑
∑
∑ ∑
∑ ∑
∑ ∑
∑
Isochronous governor and natural gas engine model
AC8B exciter model
Figure 1.2 Controller architecture of MTU Onsite Energy natural gas engine driven synchronous
generator-based DER (or ‘genset’).
CERTS controls implemented in Vector CANoe
DECS 250
Laptop with Vector CANoe CAN bus communication

5 Electrical and Computer Engineering THE OHIO STATE UNIVERSITY
where 𝑛𝑛1 denotes the speed of the engine in rpm and 𝑛𝑛𝑐𝑐𝑐𝑐𝑐𝑐1 indicates the number of
cylinders in the engine. The delay function 𝑒𝑒−𝑠𝑠𝑡𝑡𝑑𝑑1 can be approximated for linear time
invariant (LTI) analysis. Generally, a first-order lag function 11+𝑠𝑠𝑡𝑡𝑑𝑑1
is a reasonable
approximation for LTI analysis. In this case, however, it was found that the first-order
Pade approximation 1−𝑠𝑠𝑡𝑡𝑑𝑑1∕21+𝑠𝑠𝑡𝑡𝑑𝑑1∕2
gave better results that matched with the manufacturer’s test
data. Hence, the engine delay is approximated as
𝑒𝑒−𝑠𝑠𝑡𝑡𝑑𝑑1 = 1 − 𝑠𝑠𝑡𝑡𝑑𝑑1 ∕ 21 + 𝑠𝑠𝑡𝑡𝑑𝑑1 ∕ 2
(1.2)
However, it should be noted that for more precise modeling of the engine, the
exponential time delay function (i.e., 𝑒𝑒−𝑠𝑠𝑡𝑡𝑑𝑑1) block available in MATLAB®/Simulink™
is recommended in the simulation. Further, the developed mechanical torque, Tm1, of the
engine is limited to its maximum capacity given by the fuel map. This map is
programmed as a torque limiter (saturation) in the model.
1.3.3 Mechanical coupling shaft
The next block in Figure 1.2 is the coupling shaft connecting the natural gas engine
and the synchronous generator. For the coupling shaft, the rotary motion is expressed by
the equation:
𝜔𝜔1(𝑠𝑠)(𝐽𝐽1𝑠𝑠 + 𝐵𝐵1) = 𝑇𝑇𝑚𝑚1(𝑠𝑠) − 𝑇𝑇𝑒𝑒1(𝑠𝑠) (1.3)
where J1 denotes the net moment of inertia, and B1 is the net friction loss coefficient of
the overall genset assembly.

6 Electrical and Computer Engineering THE OHIO STATE UNIVERSITY
1.3.4 Digital voltage regulator (DVR) and exciter
The voltage subsystem of the genset comprises the excitation system and digital
voltage regulator (DVR). In this subsystem, the generator’s field circuit is excited by an
AC brushless excitation system that is modeled using AC8B IEEE model [9]. It should be
noted that the exciter has a separate alternator with a rotating rectifier to give its dc field
supply called the rotating field exciter. The DVR is modeled as a PID controller for
regulating the terminal voltage of the genset. Additional features like the load relief
(V/Hz) scheme can also be programmed in the DVR. The model parameters of DVR and
exciter are listed in the Appendix A.
Initially, the Marathon Electric’s DVR2000E was used to regulate the terminal
voltage of the genset. However, it was found to be constraining the load relief to a
minimum non-zero value (and not allow programming ‘0’ V/Hz). Hence, it was replaced
with Basler’s DECS-250 DVR [10] in the experiments conducted later. The purpose of
disabling the load relief scheme (by programming ‘0’ V/Hz) is to prevent reactive power
circulation between gensets in the microgrid. This problem is discussed further in Section
3.4 of Chapter 3 in this report.
1.3.5 Synchronous generator
The synchronous generator based DER installed at the CERTS microgrid has a salient
pole rotor with a rotating field excitation system. It is modeled using the standard block
available in the MATLAB®/Simulink™ and SimPowerSystems toolbox library. It has
two control inputs, ω1 and Ve1, coming from the governor and exciter, respectively. The
generator parameters, given in [11], are programmed in this simulation block.

7 Electrical and Computer Engineering THE OHIO STATE UNIVERSITY
1.3.6 CERTS controls
The genset model, illustrated in Figure 1.2, also includes an outer loop containing
CERTS controls. These controls are used for generating the references to speed governor
and exciter. In addition to the power-frequency (P-ω) droop controller, the CERTS
controls also have a maximum power (i.e., Pmax) controller to assure that the power
supplied by the DER does not exceed its rated maximum capability [2]. However, the
Pmax controller engages only when the measured active power exceeds the programmed
Pmax1 value (cf. Figure 1.2), and is inactive during the remaining period. An advantage of
the flexibility in programming the Pmax1 parameter is the ability to constrain the DER’s
steady state output power below its engine rating. Likewise, the reactive power-voltage
(Q-V) droop controller is for reactive power sharing when the genset is interconnected
with other DERs.
1.3.7 Data acquisition system at the CERTS Microgrid
The data acquisition system at the CERTS Microgrid makes use of LabVIEW® for
communication with the genset. Three-phase voltages and currents are measured and
recorded with real time stamps by PowerLogic® ION7650 metering equipment at various
places in the microgrid. Besides them, the internal variables of engine control unit (ECU)
of governor were also monitored through the control area network (CAN) bus using
Vector CANoe® software. Furthermore, the hardware-in-loop (HIL) feature of Vector
CANoe® was utilized to program the CERTS droop controls described earlier. For this
purpose, the MATLAB®/Simulink™ Real-Time Workshop™ was used to compile a
MATLAB model into a Windows® DLL file that Vector CANoe® can execute.

8 Electrical and Computer Engineering THE OHIO STATE UNIVERSITY
1.3.8 Synchronous generator-based DER model validation
To validate the genset model (cf. Figure 1.2), standalone tests were carried out at the
CERTS Microgrid test bed [12]–[14]. The computer simulation in
MATLAB®/Simulink™ was done using the ODE 23tb solver, and the dynamic behavior
was evaluated for various operating conditions. Figure 1.3 shows selected results that
illustrates a close match between simulation waveforms and experimental test data for a 0
− 80 kW step change in load. It should be noted that the CERTS controls are inactive in
this particular case.
Prior to the load change, the engine torque and the load torque are equal (i.e., Tm1 −
Te1 = 0, neglecting losses) and the genset runs at its nominal speed. Yet, after the 80 kW
load is applied to the generator, the net torque becomes negative (i.e., Tm1 − Te1 < 0)
leading to a drop in generator speed. One thing to note is that the speed did not drop
instantly due to the generator inertia. Nonetheless, the speed was restored back to its
nominal value over time by the isochronous governor. Minor discrepancies between the
simulation and experimental waveforms shown in Figure 1.3 are due to un-modeled
generator core losses, stray losses and mechanical losses (including friction and windage
losses) that vary as a function of speed.

9 Electrical and Computer Engineering THE OHIO STATE UNIVERSITY
0 1 2 3 4 50
2
4
6
8
10x 104
Time (s)
Mec
hani
cal p
ower
(W)
0 1 2 3 4 50
2
4
6
8
10x 104
Time (s)
Mec
hani
cal P
ower
(W)
0 1 2 3 4 5
1550
1600
1650
1700
1750
1800
Time (s)
Spee
d (R
PM)
0 1 2 3 4 51500
1550
1600
1650
1700
1750
1800
Time (s)
Spee
d (R
PM)
0 1 2 3 4 50
100
200
300
400
500
600
Time (s)
Torq
ue (N
m)
0 1 2 3 4 50
100
200
300
400
500
600
Time (s)
Torq
ue (N
m)
Experimental Waveforms Simulation Results
Figure 1.3 Genset performance with isochronous governor for a 0 − 80 kW step change in electrical
load. Experimental waveforms are presented on the left column and the corresponding simulation results
are on the right column.

10 Electrical and Computer Engineering THE OHIO STATE UNIVERSITY
1.4 Modeling of Inverter-based Distributed Energy Resource
The synchronous generator-based DER, described in the earlier section, is always run
at fixed speed corresponding to the frequency of power delivered to the customers.
However, such an operation forces the engine prime-mover to operate outside its
optimum fuel efficiency envelope under low load condition [15]–[17]. This results in
increased fuel consumption and higher emissions of the engine. Moreover, these gensets
often show fluctuations in their frequency and voltage [12], [18]–[21], and even stall
sometimes [12], [22], [23] when a large load change occurs.
To overcome the above problems, the inverter-based DERs with a variable speed
engine generator set as the prime-mover was proposed [15]–[17], [24]–[26]. In such
DERs, the engine speed can be controlled to optimize fuel consumption and reduce
emissions [16], [17]. Since the engine is connected to a permanent magnet synchronous
generator (PMSG), the variable speed operation of PMSG produces a variable frequency
and voltage output. This is converted into a high quality 60 Hz output voltage using
power electronics.
At the CERTS Microgrid test bed, the inverter-based DER (labeled as DER-2 in
Figure 1.1) is the 100-kW Tecogen CHP unit, InVerdẽ INV-100 [4]–[6]. It has a natural
gas engine running at variable speed and driving a permanent magnet synchronous
generator (PMSG) [4]–[6], [27]. A power conditioning system (PCS) including diode-
bridge rectifier, dc/dc boost converter and dc/ac inverter converts the variable
voltage/frequency output of the generator into a high quality 60 Hz ac power supply [6].
11 Electrical and Computer Engineering THE OHIO STATE UNIVERSITY
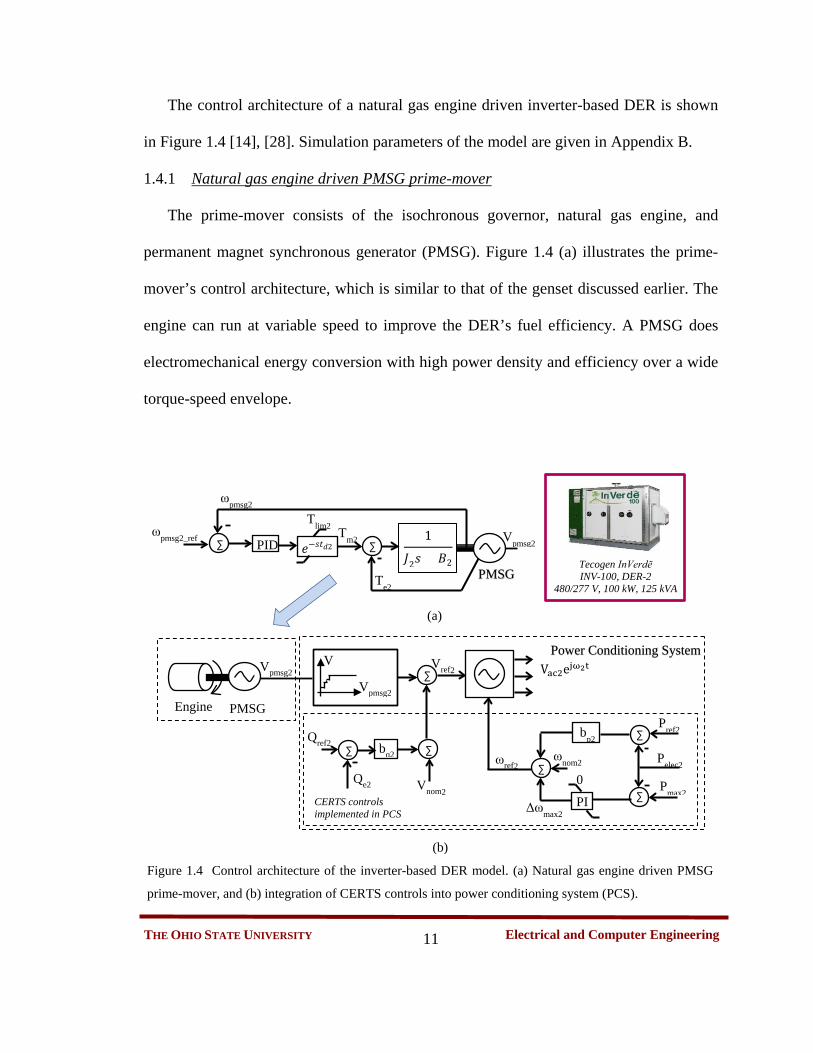
The control architecture of a natural gas engine driven inverter-based DER is shown
in Figure 1.4 [14], [28]. Simulation parameters of the model are given in Appendix B.
1.4.1 Natural gas engine driven PMSG prime-mover
The prime-mover consists of the isochronous governor, natural gas engine, and
permanent magnet synchronous generator (PMSG). Figure 1.4 (a) illustrates the prime-
mover’s control architecture, which is similar to that of the genset discussed earlier. The
engine can run at variable speed to improve the DER’s fuel efficiency. A PMSG does
electromechanical energy conversion with high power density and efficiency over a wide
torque-speed envelope.
ωref2
Vac2ejω2t Vref2
Engine PMSG
Vpmsg2
Tecogen InVerdẽ INV-100, DER-2
480/277 V, 100 kW, 125 kVA
PID 𝑒𝑒−𝑠𝑠𝑡𝑡𝑋𝑋2
1
𝐽𝐽2𝑠𝑠 + 𝐵𝐵2
ωpmsg2 Tlim2 Tm2
Te2
Vpmsg2
PMSG
ωpmsg2_ref ∑ ∑
(a)
(b)
Qe2
bq2 ∑ ∑ Qref2
Vnom2
∑
Vpmsg2
V
Pmax2
Pelec2 bp2
Pref2
Δωmax2
0 PI
ωnom2
∑
∑
∑
Figure 1.4 Control architecture of the inverter-based DER model. (a) Natural gas engine driven PMSG
prime-mover, and (b) integration of CERTS controls into power conditioning system (PCS).
Power Conditioning System
CERTS controls implemented in PCS

12 Electrical and Computer Engineering THE OHIO STATE UNIVERSITY
In the natural gas engine, any change in fuel input is reflected in the mechanical
torque. However, it does not happen immediately; and it is constrained by factors like
fuel transport delay, turbocharger time constant and availability of sufficient combustion
air. Therefore, the natural gas engine is modeled as an exponential time delay [8]. In
addition, the engine fuel map limits the developed mechanical torque within its maximum
rated capacity.
Since the shaft of PMSG is coupled to the natural gas engine, assuming a near linear
voltage regulation curve [29], the output voltage is given by the equation
𝑉𝑉𝑝𝑝𝑚𝑚𝑠𝑠𝑝𝑝2 = 𝑘𝑘𝑒𝑒𝜔𝜔𝑝𝑝𝑚𝑚𝑠𝑠𝑝𝑝2 (1.4)
where ωpmsg2 is the prime-mover speed and 𝑘𝑘𝑒𝑒 denotes the emf constant of the generator.
A major distinction in using the PMSG in the inverter-based DER is that it does not have
a DVR to regulate its terminal voltage as its field circuit excitation is controlled by the
permanent magnets in the rotor.
1.4.2 Power conditioning system (PCS)
The PMSG gives a variable voltage/frequency ac output that needs a power
conditioning system (PCS) to interface with the utility. The PCS includes a diode-bridge
rectifier, dc/dc boost converter and dc/ac inverter. Besides, the PCS converts the variable
ac output from PMSG into a high quality 60 Hz ac voltage through an LC filter and a
coupling inductance [5].
Under normal operating conditions, the PCS inverter’s dc bus voltage is regulated by
the dc/dc boost converter to decouple the prime-mover voltage (Vpmsg2) from the dc/ac

13 Electrical and Computer Engineering THE OHIO STATE UNIVERSITY
inverter output (Vac2). However, the relationship between these two voltages is non-
linear, and so it was found empirically and programmed as a look-up table in the model.
1.4.3 CERTS controls
For the inverter-based DER, the CERTS controls are programmed within the PCS
as shown in Figure 1.4. They include active power-frequency (P-ω) droop controller,
Pmax controller and reactive power-voltage (Q-V) droop controller. It should be noted that
the Pmax2 controller remains inactive all the time except when the measured active power
exceeds the Pmax2 parameter. An advantage of the flexibility in programming the Pmax2
parameter is the ability to constrain the DER’s steady state output below its power rating.
1.4.4 Inverter-based DER model validation
To validate the model for inverter-based DER, experimental tests were carried out at
the CERTS Microgrid test bed [1]. A particular case of 0−94 kW step load change caused
prime-mover stalling event that led to voltage collapse [14]. Figure 1.5 shows the results
from both experimental testing and the simulation model for this case.
14 Electrical and Computer Engineering THE OHIO STATE UNIVERSITY
Figure 1.5 Inverter-based DER performance for a 0-94 kW step change in electrical load. Experimental
waveforms are shown on the left column and the corresponding simulation results are on the right column.
1.5 Summary
This chapter presented the modeling of the two common types of reciprocating engine
driven DERs installed at the CERTS Microgrid test bed, viz., synchronous generator- and
inverter-based DERs. The simulation models in MATLAB/Simulink were validated
against results from experimental testing. The developed DER models are simple
Experimental Waveforms Simulation Results
PCS
volta
ge, V
ac2 (V
) PC
S po
wer
, Pel
ec2
(W)
Time (s) Time (s)
Time (s) Time (s)

15 Electrical and Computer Engineering THE OHIO STATE UNIVERSITY
physics-based models that show to a reasonable degree of accuracy the dynamic behavior
without infringing on the confidential information of the equipment manufacturers. Such
models can be easily scaled and multiplied to analyze various microgrid scenarios that
maybe otherwise impractical to carry out testing on-site due to resource limitations.

16 Electrical and Computer Engineering THE OHIO STATE UNIVERSITY
CHAPTER 2
ANALYSIS OF PRIME-MOVER STALLING IN RECIPROCATING
ENGINE DRIVEN DISTRIBUTED ENERGY RESOURCES
2.1 Introduction
For supplying large and varying loads, the general practice is to oversize the prime-
movers of reciprocating engine driven DERs. Otherwise, an abrupt change in the load
may cause a significant fluctuation in frequency or voltage. Under extremely harsh load
conditions, the DER prime-mover would stall and lead the system to a frequency/voltage
collapse. Hence, it is important to investigate the root cause of prime-mover stalling in
these DERs. For this purpose, the physics-based models developed in the earlier chapter
for the gensets and inverter-based DERs are used.
2.2 Prime-mover Stalling in a Synchronous Generator-based
Distributed Energy Resource
Consider the energy conversion process illustrated in Figure 2.1 for a synchronous
generator-based DER (i.e., genset). As seen in this figure, the electromechanical energy
conversion process in the synchronous generator can be expressed by the following
dynamic equation [30]
�𝑀𝑀𝑒𝑒𝑐𝑐ℎ𝑎𝑎𝑛𝑛𝑙𝑙𝑐𝑐𝑎𝑎𝑙𝑙 𝐸𝐸𝑛𝑛𝑒𝑒𝐸𝐸𝐸𝐸𝐸𝐸 𝐼𝐼𝑛𝑛𝐼𝐼𝐼𝐼𝑡𝑡𝑓𝑓𝐸𝐸𝑓𝑓𝑙𝑙 𝐸𝐸𝑛𝑛𝐸𝐸𝑙𝑙𝑛𝑛𝑒𝑒 � = �𝐸𝐸𝑙𝑙𝑒𝑒𝑐𝑐𝑡𝑡𝐸𝐸𝑙𝑙𝑐𝑐𝑎𝑎𝑙𝑙 𝐸𝐸𝑛𝑛𝑒𝑒𝐸𝐸𝐸𝐸𝐸𝐸𝑂𝑂𝐼𝐼𝑡𝑡𝐼𝐼𝐼𝐼𝑡𝑡 � + �
𝐸𝐸𝑛𝑛𝑒𝑒𝐸𝐸𝐸𝐸𝐸𝐸𝐷𝐷𝑙𝑙𝑠𝑠𝑠𝑠𝑙𝑙𝐼𝐼𝑎𝑎𝑡𝑡𝑒𝑒𝑋𝑋� + �𝐼𝐼𝑛𝑛𝑐𝑐𝐸𝐸𝑒𝑒𝑎𝑎𝑠𝑠𝑒𝑒 𝑙𝑙𝑛𝑛 𝐾𝐾𝑙𝑙𝑛𝑛𝑒𝑒𝑡𝑡𝑙𝑙𝑐𝑐
𝐸𝐸𝑛𝑛𝑒𝑒𝐸𝐸𝐸𝐸𝐸𝐸,∆𝐾𝐾𝐸𝐸 �

17 Electrical and Computer Engineering THE OHIO STATE UNIVERSITY
In terms of the power quantities, the above dynamic equation can be written as [12]
∆𝐾𝐾𝐾𝐾1∆𝑡𝑡
= 𝑃𝑃𝑚𝑚𝑒𝑒𝑐𝑐ℎ1 − 𝑃𝑃𝑒𝑒𝑐𝑐𝑒𝑒𝑐𝑐1 − 𝑃𝑃𝑐𝑐𝑙𝑙𝑠𝑠𝑠𝑠1 (2.1)
𝐽𝐽1𝜔𝜔1∆𝜔𝜔1∆𝑡𝑡
= 𝑃𝑃𝑚𝑚𝑒𝑒𝑐𝑐ℎ1 − 𝑃𝑃𝑒𝑒𝑐𝑐𝑒𝑒𝑐𝑐1 − 𝑃𝑃𝑐𝑐𝑙𝑙𝑠𝑠𝑠𝑠1 (2.2)
where Pmech1 is the mechanical input power of generator, Pelec1 is its electrical output
power, and Ploss1 accounts for the total power losses including copper losses, core losses,
stray losses, and friction and windage losses. However, in the first phase of modeling,
these losses are neglected. Under steady state conditions, the change in generator speed
Δω1 is zero; as such, the left hand side of the (2.2) will become zero.
Mechanical Energy Input
Energy Dissipated (Heat)
Electrical Energy Output Synchronous
Generator
Increase in Energy Stored (Kinetic Energy)
Internal Combustion Engine
Synchronous Generator (SG)
ω1 Vac1
Tlim1
Figure 2.1 Block diagram of the electromechanical energy conversion process in a synchronous
generator-based DER (i.e., genset)

18 Electrical and Computer Engineering THE OHIO STATE UNIVERSITY
Tlim1 line
At first, the generator is on no-load and rotating at synchronous speed (ωsyn1); so its
rotational kinetic energy (KEinit1) can be computed. Then, from the instant of step change
in electrical load (Pelec1), equation (2.1) would give the change in kinetic energy (∆KE1)
over time interval (∆t). Thus, the additional load is temporarily supplied by the stored
rotational kinetic energy until the governor action raises the mechanical power (Pmech1) to
match with Pelec1. However, Pmech1 is limited by the prime-mover’s maximum power
capability (MPmax1) given by the engine fuel map shown in Figure 2.2. Hence, if Pelec1 >
Pmech1 for a long duration, the stored kinetic energy is drained at the rate given by (2.1).
This also causes the generator’s speed to drop as per (2.2). For simplicity, it is assumed
that MPmax1 varies linearly with speed. This means that the mechanical torque limit
(Tlim1, cf. Figure 2.2) is almost constant.
Figure 2.2 Fuel map of GM 8.1L natural gas engine [31]

19 Electrical and Computer Engineering THE OHIO STATE UNIVERSITY
2.2.1 Case study
The case of a step load application to the genset, dealt in earlier chapter (cf. Figure
2.3) is studied further. When a large electrical load (Pelec 1) is applied to the synchronous
generator, its speed (ω1) reduces briefly until the governor PID controller restores to the
desired value. The governor increases the fuel input to the cylinders of the engine, which
then generates the necessary mechanical power (Pmech 1) to compensate for the increase in
Pelec 1. However, the engine fuel map limits the maximum mechanical torque supplied by
the engine to Tlim 1. As seen in Figure 2.3, Tlim 1 from both simulation and experimental
results is around 552 Nm. A theoretical approximation for Tlim 1 can be derived by
assuming the slope of the power curve of engine fuel map in Figure 2.2, to be a straight
line. This approximation is valid over a speed range, and Tlim 1 is computed from its fuel
map as
𝑇𝑇𝑐𝑐𝑙𝑙𝑚𝑚1 = 104.0 [𝑘𝑘𝑘𝑘]
188.5 [𝐸𝐸𝑎𝑎𝑋𝑋/𝑠𝑠]= 552.04 𝑁𝑁𝑙𝑙 (2.3)
Figure 2.3 illustrates the locus of speed vs. active power characteristics of the genset
for a step change in electrical load of 0−70 kW. The electrical load (Pelec1) trajectory is
indicated in blue color as Pelec1. By contrast, the mechanical power (Pmech 1−Ploss1)
trajectory follows the green color path. The governor controls gradually restore the speed
that dropped because of load change. An additional time (engine delay) is necessary to
increase fuel input to the engine cylinders. Hence, the energy balance equation (cf. (2.1))
forces ∆KE1 ≠ 0, thereby causing a speed variation in the transient; this is indicated by
the two (blue and green) trajectories going through different paths in Figure 2.3.

20 Electrical and Computer Engineering THE OHIO STATE UNIVERSITY
However, both the trajectories eventually converge in the equilibrium (i.e., steady state)
conditions, when ∆KE1 = 0; and under these conditions (2.1) becomes
𝑃𝑃𝑚𝑚𝑒𝑒𝑐𝑐ℎ1.𝑠𝑠𝑠𝑠 = 𝑃𝑃𝑒𝑒𝑐𝑐𝑒𝑒𝑐𝑐1.𝑠𝑠𝑠𝑠 + 𝑃𝑃𝑐𝑐𝑙𝑙𝑠𝑠𝑠𝑠1.𝑠𝑠𝑠𝑠 (in steady state) (2.4)
Figure 2.3 Speed vs. active power characteristics of the genset for a 0−70 kW step load application
2.2.2 Conditions for prime-mover stalling
In the locus of genset speed vs. active power shown in Figure 2.3, the mechanical
power trajectory would never cross the engine fuel map limit (MPmax1) [12]. Hence, the
MPmax1 line also indicates the boundary between Stalling zone and Safe zone. By
contrast, the electrical load shared by the genset with other DERs in the network could be
Power (kW)
Stalling zone
Safe zone
Mechanical power − losses
Electrical power
Spee
d (r
pm)

21 Electrical and Computer Engineering THE OHIO STATE UNIVERSITY
limited to Pmax1 value by the CERTS Pmax controller. Nevertheless, if the electrical power
trajectory remains in the Safe zone, then the genset speed is restored to the equilibrium
value without prime-mover stalling.
i.e., 𝑀𝑀𝑃𝑃𝑚𝑚𝑚𝑚𝑚𝑚1 > 𝑃𝑃𝑒𝑒𝑐𝑐𝑒𝑒𝑐𝑐1 + 𝑃𝑃𝑐𝑐𝑙𝑙𝑠𝑠𝑠𝑠1 (2.5)
since Pmech 1 is constrained by the fuel map limit (MPmax 1). However, as seen in Figure
2.3, MPmax1 has a linear relationship with speed (ω1). In other words
𝑀𝑀𝑃𝑃𝑚𝑚𝑚𝑚𝑚𝑚1 = 𝑇𝑇𝑐𝑐𝑙𝑙𝑚𝑚1 𝜔𝜔1 (2.6)
Substituting (2.6) in (2.5), the condition for genset to not stall is
𝑇𝑇𝑐𝑐𝑙𝑙𝑚𝑚1 𝜔𝜔1 > 𝑃𝑃𝑒𝑒𝑐𝑐𝑒𝑒𝑐𝑐1 + 𝑃𝑃𝑐𝑐𝑙𝑙𝑠𝑠𝑠𝑠1
i.e., 𝜔𝜔1 > 𝑃𝑃𝑒𝑒𝑙𝑙𝑒𝑒𝑐𝑐1+𝑃𝑃𝑙𝑙𝑓𝑓𝑠𝑠𝑠𝑠1
𝑇𝑇𝑙𝑙𝑙𝑙𝑙𝑙1 (2.7)
The right hand side of (2.7) is denoted by ωL-lim 1. Hence,
𝜔𝜔1 > 𝜔𝜔𝐿𝐿−𝑐𝑐𝑙𝑙𝑚𝑚1 (2.8)
Converting the units of 𝜔𝜔𝐿𝐿−𝑐𝑐𝑙𝑙𝑚𝑚1 from rad./s to rev./min. (i.e., rpm), the lower limit of
speed for the genset to be restored to equilibrium without stalling is given by
𝑁𝑁𝐿𝐿−𝑐𝑐𝑙𝑙𝑚𝑚1 [𝐸𝐸𝐼𝐼𝑙𝑙] = 𝑃𝑃𝑒𝑒𝑐𝑐𝑒𝑒𝑐𝑐1[𝑘𝑘] + 𝑃𝑃𝑐𝑐𝑙𝑙𝑠𝑠𝑠𝑠1[𝑘𝑘]
𝑇𝑇𝑐𝑐𝑙𝑙𝑚𝑚1[𝑁𝑁𝑙𝑙]×
602𝜋𝜋
(2.9)
The calculated values of ωL-lim1 and NL-lim1 are tabulated in Table 2.1 for two large
load demands. As seen in Figure 2.3, the Safe zone region (shaded in green) satisfies
(2.8). The restoration of speed to the equilibrium can be guaranteed by running the genset
in the Safe zone. Since the genset operation remained in the Safe zone when it was
subjected to a 0−70 kW step load, its speed was restored to the equilibrium in steady
state.

22 Electrical and Computer Engineering THE OHIO STATE UNIVERSITY
Table 2.1 Calculated values of 𝑁𝑁𝐿𝐿−𝑐𝑐𝑙𝑙𝑚𝑚1 & 𝜔𝜔𝐿𝐿−𝑐𝑐𝑙𝑙𝑚𝑚1for different step load changes
Applied load, Pelec1 [kW] 𝝎𝝎𝑳𝑳−𝒍𝒍𝒍𝒍𝒍𝒍𝒍𝒍 �𝒓𝒓𝒓𝒓𝒓𝒓𝒔𝒔𝒔𝒔𝒔𝒔
� 𝑵𝑵𝑳𝑳−𝒍𝒍𝒍𝒍𝒍𝒍𝒍𝒍 [𝒓𝒓𝒓𝒓𝒍𝒍] = 𝝎𝝎𝑳𝑳−𝒍𝒍𝒍𝒍𝒍𝒍 ∗ 𝟔𝟔𝟔𝟔𝟐𝟐𝟐𝟐
0−70 kW 70 𝑘𝑘𝑘𝑘552.0371 𝑁𝑁𝑚𝑚
= 126.8 𝑟𝑟𝑚𝑚𝑑𝑑𝑠𝑠
1210.88 𝐸𝐸𝐼𝐼𝑙𝑙
0−90 kW 90 𝑘𝑘𝑘𝑘552.0371 𝑁𝑁𝑙𝑙
= 163.043 𝐸𝐸𝑎𝑎𝑋𝑋𝑠𝑠
1556.951 𝐸𝐸𝐼𝐼𝑙𝑙
However, if the genset leaves the Safe zone and enters the Stalling zone, it would not
attain equilibrium steady state speed. The Stalling zone is indicated by the region shaded
in red in Figure 2.4, the locus of speed vs. active power for a 0−90 kW step load
application. As seen in the figure, the mechanical power trajectory did not cross the
MPmax1 line, as it cannot exceed the engine fuel map limit. When the electrical power
trajectory entered the Stalling zone (shaded in red), it cannot be met by the engine whose
mechanical power production is limited by the fuel map. During this prolonged power
mismatch, the genset’s stored kinetic energy is depleted, thereby resulting in prime-
mover stalling condition [12].
Another way to examine the prime-mover stalling is by defining the new variable of
electrical load torque,
𝑇𝑇𝐿𝐿−𝑒𝑒𝑐𝑐𝑒𝑒𝑐𝑐1 = 𝑃𝑃𝑒𝑒𝑒𝑒𝑒𝑒𝑒𝑒1+𝑃𝑃𝑒𝑒𝑙𝑙𝑙𝑙𝑙𝑙1𝜔𝜔1
(2.10)
It follows that the condition for the genset to be restored to equilibrium without
stalling, i.e., (2.8) is equivalent to
𝑇𝑇𝐿𝐿−𝑒𝑒𝑐𝑐𝑒𝑒𝑐𝑐1 < 𝑇𝑇𝑐𝑐𝑙𝑙𝑚𝑚1 (2.11)

23 Electrical and Computer Engineering THE OHIO STATE UNIVERSITY
Figure 2.4 Locus of the active power-speed characteristics of the genset for 90% (i.e. 0−90 kW) step load
application.
2.3 Stalling Analysis of Synchronous Generator-based DERs with Load
Relief Scheme
The analysis of prime-mover stalling in gensets, illustrated in previous section (i.e.,
Section 2.2), assumed that the genset exciter has no underfrequency load relief (V/Hz)
scheme. However, in the standalone mode of operation an underfrequency load relief
(V/Hz) scheme could prevent the genset from the stalling condition. In fact, several large
Power (kW)
Stalling zone
Safe zone
Mechanical power − losses
Electrical power
Spee
d (r
pm)

24 Electrical and Computer Engineering THE OHIO STATE UNIVERSITY
commercial-off-the-shelf gensets meant for standalone operation have DVRs with this
programmable option [20].
Figure 2.5 illustrates the genset response for a 20−95 kW step change in electrical
load with load relief setting at 3 pu V/Hz [12]. Earlier, it was shown that a 0−90 kW load
change, when applied without the load relief (V/Hz) scheme, caused prime-mover
stalling in the genset. However, a 3pu V/Hz load relief setting in the DVR reduced the
voltage with the speed drop during the time 0−2 s, and this led to an electrical load relief
as seen in the measured three-phase power plotted in Figure 2.5. In particular, a decrease
in speed from 1800 rpm to 1580 rpm caused a 33% decrease from 277 Vrms to 187 Vrms
in the generator terminal voltage. This temporary voltage reduction resulted in a
corresponding decrease in the effective electrical load by almost 48% (from 95 kW to 50
kW). The load relief helped in enforcing a gradual increase in load demand rather than an
abrupt one, thus giving adequate time for the natural gas engine to respond. In due
course, the engine speed was restored to the nominal value of 1800 rpm and the generator
terminal voltage and the electrical load returned to their desired values.
Figure 2.6 shows the genset speed vs. active power characteristics of the genset with
load relief (V/Hz) scheme for 20−95 kW step load application. Since the genset operation
remained in the Safe zone, its speed was restored to the equilibrium in steady state.

25 Electrical and Computer Engineering THE OHIO STATE UNIVERSITY
Figure 2.5 Experimental plots showing the genset response with load relief (V/Hz) scheme for a 20−95 kW
step change in electrical load

26 Electrical and Computer Engineering THE OHIO STATE UNIVERSITY
Figure 2.6 Locus of the speed vs. active power characteristics of the genset with load relief (V/Hz) scheme
for 20−95 kW step load application
2.4 Prime-mover Stalling in an Inverter-based Distributed Energy
Resource
Similar to the gensets (i.e., synchronous generator-based DERs), the inverter-based
DERs that have reciprocating engine driven generators as prime-movers also exhibit
stalling behavior when they are subjected to large block load changes. However, they
present a distinct dynamic response as compared to gensets due to the differences in their
operation and controls. Figure 2.7 illustrates the simplified schematic and
electromechanical energy conversion process of an inverter-based DER, which can be
described by the following energy balance equation [28]:
� 𝐼𝐼𝑛𝑛𝑐𝑐𝐸𝐸𝑒𝑒𝑎𝑎𝑠𝑠𝑒𝑒 𝑙𝑙𝑛𝑛 𝐾𝐾𝑙𝑙𝑛𝑛𝑒𝑒𝑡𝑡𝑙𝑙𝑐𝑐𝐸𝐸𝑛𝑛𝑒𝑒𝐸𝐸𝐸𝐸𝐸𝐸 𝑓𝑓𝑓𝑓 𝑃𝑃𝑀𝑀𝑃𝑃𝑃𝑃,∆𝐾𝐾𝐸𝐸�
= �𝑀𝑀𝑒𝑒𝑐𝑐ℎ𝑎𝑎𝑛𝑛𝑙𝑙𝑐𝑐𝑎𝑎𝑙𝑙 𝐸𝐸𝑛𝑛𝑒𝑒𝐸𝐸𝐸𝐸𝐸𝐸𝐼𝐼𝑛𝑛𝐼𝐼𝐼𝐼𝑡𝑡 𝑡𝑡𝑓𝑓 𝑃𝑃𝑀𝑀𝑃𝑃𝑃𝑃 � − �𝐸𝐸𝑙𝑙𝑒𝑒𝑐𝑐.𝐸𝐸𝑛𝑛𝑒𝑒𝐸𝐸𝐸𝐸𝐸𝐸 𝑂𝑂𝐼𝐼𝑡𝑡𝐼𝐼𝐼𝐼𝑡𝑡𝑓𝑓𝐸𝐸𝑓𝑓𝑙𝑙 𝑃𝑃𝑃𝑃𝑃𝑃 �
− � 𝑇𝑇𝑓𝑓𝑡𝑡𝑎𝑎𝑙𝑙 𝐸𝐸𝑛𝑛𝑒𝑒𝐸𝐸𝐸𝐸𝐸𝐸𝐷𝐷𝑙𝑙𝑠𝑠𝑠𝑠𝑙𝑙𝐼𝐼𝑎𝑎𝑡𝑡𝑒𝑒𝑋𝑋 𝑎𝑎𝑠𝑠 𝑁𝑁𝑓𝑓𝑠𝑠𝑠𝑠𝑒𝑒𝑠𝑠�
Stalling zone
Safe zone
Mechanical power
Electrical power + losses

27 Electrical and Computer Engineering THE OHIO STATE UNIVERSITY
Figure 2.7 An inverter-based distributed energy resource (DER). (a) Simplified schematic, and (b) block
diagram of the electromechanical energy conversion process.
The above energy balance equation can be expressed in terms of power quantities as
∆𝐾𝐾𝐾𝐾2∆𝑡𝑡
= 𝑃𝑃𝑚𝑚𝑒𝑒𝑐𝑐ℎ2 − 𝑃𝑃𝑒𝑒𝑐𝑐𝑒𝑒𝑐𝑐2 − 𝑃𝑃𝑐𝑐𝑙𝑙𝑠𝑠𝑠𝑠2 (2.12)
where Pmech2 = mechanical power provided by the prime-mover, Pelec2 = electrical output
power of power conditioning system (PCS), and Ploss2 = total power losses in the
permanent magnet synchronous generator (PMSG) and PCS.
Under steady state equilibrium conditions, the left hand side of (2.12).
∴ 𝑃𝑃𝑚𝑚𝑒𝑒𝑐𝑐ℎ2,𝑠𝑠𝑠𝑠 = 𝑃𝑃𝑒𝑒𝑐𝑐𝑒𝑒𝑐𝑐2,𝑠𝑠𝑠𝑠 + 𝑃𝑃𝑐𝑐𝑙𝑙𝑠𝑠𝑠𝑠2,𝑠𝑠𝑠𝑠 (in steady state) (2.13)
Mechanical Energy Input
Energy Dissipated (Losses)
Increase in Energy Stored
(Kinetic Energy)
Permanent Magnet Synchronous
Generator (PMSG)
Energy Dissipated (Losses)
Electrical Energy Output
Power Conditioning
System
Internal Combustion Engine
Permanent Magnet Synchronous Generator (PMSG)
Power Conditioning System (PCS)
ωpmsg2 Vpmsg2 Vac2
Tlim2
(a)
(b)

28 Electrical and Computer Engineering THE OHIO STATE UNIVERSITY
However, it is possible that the equilibrium condition is not reached after a large load
change. This happens because Pmech 2 cannot exceed the rated maximum capability
governed by the engine fuel map labeled as MPmax2. Hence, the condition for the prime-
mover speed to be restored to the steady state equilibrium without stalling is
𝑀𝑀𝑃𝑃𝑚𝑚𝑚𝑚𝑚𝑚2 > 𝑃𝑃𝑒𝑒𝑐𝑐𝑒𝑒𝑐𝑐2 + 𝑃𝑃𝑐𝑐𝑙𝑙𝑠𝑠𝑠𝑠2 (2.14)
The above condition for stalling prevention is similar to the case of gensets (cf. (2.5)).
However, MPmax2 varies linearly with the PMSG speed (ωpmsg). In fact, they are related
by the constant torque limit of engine fuel map, labeled as Tlim 2.
𝑀𝑀𝑃𝑃𝑚𝑚𝑚𝑚𝑚𝑚2 = 𝑇𝑇𝑐𝑐𝑙𝑙𝑚𝑚2 ∙ 𝜔𝜔𝑝𝑝𝑚𝑚𝑠𝑠𝑝𝑝2 (2.15)
2.4.1 Case study
To gain a deeper understanding of the limiting conditions for prime-mover in
inverter-based DER, the case of 0−94 kW step change in electrical load studied earlier
(cf. Figure 1.5) is revisited. For this case, the variation of PMSG speed and voltage vs.
active power are plotted in Figure 2.8. It was found from experimental testing that the
DER’s prime-mover has engine fuel map limit at Tlim2 = 398 Nm, and so the maximum
mechanical power from prime-mover (MPmax2) varies according to (2.15). Similar to the
case of a synchronous generator-based DER [12] explained in the earlier section
the Safe and Stalling zones are delineated by the MPmax2 line [28]. However, a
distinguishing characteristic of the inverter-based DER is that the PMSG has no DVR &
exciter to regulate its voltage, and therefore the PMSG voltage (i.e., Vpmsg2, RMS value)
is directly proportional to ωpmsg2 as

29 Electrical and Computer Engineering THE OHIO STATE UNIVERSITY
𝑉𝑉𝑝𝑝𝑚𝑚𝑠𝑠𝑝𝑝2 = 𝑘𝑘𝑒𝑒 ∙ 𝜔𝜔𝑝𝑝𝑚𝑚𝑠𝑠𝑝𝑝2 (2.16)
where ke is the emf constant that was determined from experimental testing as 1.3231
V⋅s/rad. Hence, the variation of Vpmsg2 in Figure 2.8 is along the same lines as ωpmsg2
(i.e., Npmsg2, when the units are changed from rad./s to rpm).
Figure 2.8 Locus of the PMSG speed and voltage vs. active power for the inverter-based DER in response
to a 0−94 kW step load application
For the inverter-based DER similar to the genset covered in the earlier section
the lower limit of PMSG speed that would be restored to equilibrium without stalling is
determined from (2.14) and (2.15)
𝑁𝑁𝐿𝐿−𝑐𝑐𝑙𝑙𝑚𝑚2 [𝐸𝐸𝐼𝐼𝑙𝑙] = 𝜔𝜔𝑁𝑁−𝑙𝑙𝑙𝑙𝑙𝑙2 [𝐸𝐸𝑎𝑎𝑋𝑋./𝑠𝑠] ×602𝜋𝜋
= 𝑃𝑃𝑒𝑒𝑐𝑐𝑒𝑒𝑐𝑐2[𝑘𝑘] + 𝑃𝑃𝑐𝑐𝑙𝑙𝑠𝑠𝑠𝑠2[𝑘𝑘]
𝑇𝑇𝑐𝑐𝑙𝑙𝑚𝑚2[𝑁𝑁𝑙𝑙]×
602𝜋𝜋
(2.17)
PMSG
voltage, Vpm
sg2 (V) PM
SG sp
eed,
Npm
sg2 (
rpm
)
Active power (W)
Power (kW)
Stalling zone
Safe zone
Mechanical power − losses
Electrical power

30 Electrical and Computer Engineering THE OHIO STATE UNIVERSITY
2.4.2 Conditions for prime-mover stalling
The prime-mover stalling occurs when the electrical power trajectory goes into the
Stalling zone [12]. This is because the mechanical power cannot exceed the rated
maximum capability of engine given by the MPmax2 line in Figure 2.10, which illustrates
the PMSG speed vs. active power characteristics. However, the additional power
conversion system (PCS) stage in the inverter-based DER decouples the output frequency
from the PMSG speed. Besides, the PCS output voltage (i.e., Vac2, RMS value) is tightly
regulated under normal operations. Nevertheless, when prime-mover stalling occurs, the
PCS controls cannot prevent a voltage collapse at the output of inverter-based DER.
Therefore, a drop in ωpmsg2 or Vpmsg2 (cf. Figure 2.10) below the threshold would lead to
a voltage collapse at the PCS output voltage (i.e., Vac2, RMS value). This is illustrated in
Figure 2.9 (a) by the Vac2 (RMS value) vs. power characteristics. By contrast, the PMSG
speed does not affect the frequency of inverter-based DER shown in Figure 2.9 (b).

31 Electrical and Computer Engineering THE OHIO STATE UNIVERSITY
Figure 2.9 Inverter-based DER output characteristics for a 0−94 kW step load application. (a) PCS output
voltage (Vac2, RMS value) vs. active power, and (b) PCS output frequency vs. active power.
PCS
outp
ut, V
ac2 (V
)
Power (kW)
PCS
freq
uenc
y, f 2
(Hz)
Power (kW)
(a)
(b)
Mechanical power − losses
Electrical power
Mechanical power − losses
Electrical power

32 Electrical and Computer Engineering THE OHIO STATE UNIVERSITY
Another case when the prime-mover does not stall is shown in Figures 2.11 (a) and
(b). In this case, a 0−70 kW step change in load is applied to the terminals of the inverter-
based DER. The electrical power trajectory of the prime-mover stayed within the Safe
zone assuring that the PMSG speed is restored to the steady state equilibrium value
without stalling.
Figure 2.10 Locus of the PMSG speed and voltage vs. active power for the inverter-based DER in response
to a 0−70 kW step load application
PMSG
voltage, Vpm
sg2 (V) PM
SG sp
eed,
Npm
sg2 (
rpm
)
Active power (W)
Power (kW)
Stalling zone
Safe zone
Mechanical power − losses
Electrical power

33 Electrical and Computer Engineering THE OHIO STATE UNIVERSITY
Figure 2.11 Inverter-based DER output characteristics for a 0−70 kW step load application. (a) PCS output
voltage (Vac2, RMS value) vs. active power, and (b) PCS output frequency vs. active power.
PCS
outp
ut, V
ac2 (V
)
Power (kW)
PCS
freq
uenc
y, f 2
(Hz)
Power (kW)
(b)
(a)
Mechanical power − losses
Electrical power
Mechanical power − losses
Electrical power
34 Electrical and Computer Engineering THE OHIO STATE UNIVERSITY
2.5 Effect of Incremental Load Change on Prime-mover Stalling
The earlier sections covered stalling analysis for both synchronous generator-based
and inverter-based DERs. Further case studies for different load changes confirmed that
the incremental load change (i.e., ∆Pelec) is a key variable affecting the stalling behavior
in addition to the final load value [23]. Figure 2.12 illustrates selected results showing the
speed restoration to the steady state equilibrium value for small load increments.
Figure 2.12 (a) presents the results of 70−90 kW load change on synchronous
generator-based DER, i.e., genset. As seen in this figure, the speed of genset was restored
to the steady state equilibrium for 70−90 kW load change [23], [32]. However, the earlier
tests showed that the prime-mover would stall for a larger load increment of 0−90 kW.
On similar lines, Figure 2.12 (b) illustrates the results of 60−94 kW load change on
inverter-based DER. As seen in this figure, the speed of PMSG (i.e., prime-mover) was
restored to the steady state equilibrium for 60−94 kW load change. However, the earlier
tests indicated that the prime-mover would stall for a larger load increment of 0−94 kW.
Therefore, it can be concluded from these results that the magnitude of load change,
i.e., ΔPelec2, is a key variable that influences the prime-mover stalling behavior in both
synchronous generator-based and inverter-based DERs. An important takeaway from this
analysis is that prime-mover stalling can be avoided by making load changes in smaller
increments.

35 Electrical and Computer Engineering THE OHIO STATE UNIVERSITY
Figure 2.12 Locus of speed vs. active power for (a) genset with 70−90 kW load change, and (b) inverter-
based DER with 60−94 kW load change.
(b)
(a)
Spee
d (r
pm)
Power (kW)
Power (kW)
PMSG
voltage, Vpm
sg2 (V) PM
SG sp
eed,
Npm
sg2 (r
pm)

36 Electrical and Computer Engineering THE OHIO STATE UNIVERSITY
2.6 Comparison Between Synchronous Generator-based DERs and
Inverter-based DERs
Table 2.2 Synchronous generator-based DERs vs. inverter-based DERs
2.7 Summary
This chapter presented analysis of the prime-mover stalling in two kinds of natural
gas engine powered DERs, viz., synchronous generator-based DER (also known as
‘genset’) and inverter-based DER. The root cause of stalling behavior is the slow
response of primary governor of the reciprocating engine. When a large load change
S. No. Synchronous generator-based DERs
(gensets) Inverter-based DERs
1
Excellent short circuit handling
capacitydue to the large transient
reactance of generator
Poor short circuit handling capacity that is
limited by the rating of the semiconductor
switches employed in PCS
2 Electrical output frequency is directly
related to the prime-mover’s speed
Electrical output frequency is independent of
the prime-mover’s speed
3
Can withstand large step changes in load
without stallingdue to slow response
of controls relative to the inverter-based
DERs
More vulnerable to prime-mover stalling since
the inverter controls can tightly regulate the
terminal voltage to form constant power loads
4
Prime-mover stalling (i.e., speed
collapse of the prime-mover) leads to an
output frequency collapse
Prime-mover stalling (i.e., speed collapse of
the prime-mover) leads to an output voltage
collapse
5
Can naturally respond to sudden
overloads because of the intrinsic inertia
of rotor mass
May require additional surge module (energy
storage) to handle large overloads without
collapse

37 Electrical and Computer Engineering THE OHIO STATE UNIVERSITY
occurs, the prime-mover speed is lowered temporarily due to the delay in governor
response.
At lower speeds, the engine power is derated by the engine fuel map and the
mechanical power production of engine is limited by the MPmax line. The engine fuel
map limit (MPmax line) is the hardware limit for mechanical power production from
engine. Any electrical load demand exceeding the MPmax value would result in prime-
mover stalling. Hence, the MPmax line demarcates the boundary between Safe zone and
Stalling zone for DER operation.
When the prime-mover stalls, a genset undergoes a frequency collapse. By contrast,
the same condition in an inverter-based DER results in a voltage collapse. This is because
the inverter output frequency is decoupled from the prime-mover's speed. The next
chapter studies the load sharing operation of synchronous generator-based and inverter-
based DERs in an islanded microgrid when limiting conditions are reached in one unit.

38 Electrical and Computer Engineering THE OHIO STATE UNIVERSITY
CHAPTER 3
DER OPERATION AT LIMITING CONDITIONS IN AN ISLANDED
MICROGRID
3.1 Introduction
Earlier chapters presented the modeling and analysis of synchronous generator-based
and inverter-based DERs. The distinguishing characteristics and operational
vulnerabilities of these two kinds of DERs were outlined. The integration and
coordination of these DERs in an islanded microgrid presents new challenges to its
survivability. This is especially true when one or more DERs operate near their rated
maximum capability in meeting the load demands of microgrid. During a large load
change in the islanded microgrid, such DERs are overloaded unless they can off-load the
burden to other units with sufficient reserve capacity. When the DERs operate at their
limiting conditions, the steady state load sharing is shown to deviate from the active
power-frequency (i.e., P-ω) droop curves.
3.2 Load Sharing Between Two Gensets in a Microgrid at Limiting
Conditions
In this section, the microgrid performance is analyzed when two interconnected
gensets are subjected to large step loads. It is well known that two or more gensets with
isochronous governors cannot be connected together as they would ‘fight’ with each

39 Electrical and Computer Engineering THE OHIO STATE UNIVERSITY
Vac1ejω1t
P1+jQ1
Vpccejωpcct
Engine-1 SG-1
Xcab1
Tlim1
Vac2ejω2t
Engine-2 SG-2
Tlim2
PL1+jQL1
Xcab2
P2+jQ2
Genset-1
Genset-2
PL2+jQL2
Figure 3.1 Schematic illustrating the interconnection of two gensets in an islanded microgrid
other [33]. Hence, the frequency droop controllers are used to make them all settle at a
common steady state frequency based on load sharing between them. The system
schematic illustrating connection of the two gensets is shown in Figure 3.1. These two
gensets are assumed identical with the ratings and specifications given in Appendix A.
3.2.1 Case A: Both the gensets are operating in the standalone mode
At first, the two gensets are operated in the standalone mode with the switch open (cf.
Figure 3.1). Their speed governor droop curves are programmed as shown in Figures 3.2
(a) and 3.3 (a), and the load reference setpoints are Pref1 = 0 kW and Pref2 = 40 kW. The
two gensets are subjected to the same load of 20 − 90 kW. Since the electrical power
output (Pelec) is higher than the mechanical power (Pmech), the stored kinetic energy is
expended for energy balance (cf. (2.1)) until the governor responds by increasing Pmech.
However, the mechanical power production is limited by the engine fuel map to the
MPmax line as shown in Figures 3.2 (b) and 3.3 (b).

40 Electrical and Computer Engineering THE OHIO STATE UNIVERSITY
Figure 3.2 Genset-1 (a) Steady state speed governor droop characteristics with Pref1 = 0 kW, and (b) locus
of the active power-speed response for a 20−90 kW step load application.
Power (kW)
Genset-1 N1 (rpm)
P1 (kW)
Pref1 = 0 kW
20 kW 90 kW
Slope = −0.18 rpm/kW
(a)
Nref1 = 1800 ΔPL1 = 70 kW
Stalling zone
Safe zone
Droop line
Mechanical power − losses
Electrical power
(b)
Spee
d (r
pm)

41 Electrical and Computer Engineering THE OHIO STATE UNIVERSITY
Figure 3.3 Genset-2 (a) Steady state speed governor droop characteristics with Pref2 = 40 kW, and (b)
locus of the active power-speed response for a 20−90 kW step load application.
Power (kW)
Genset-2 N2 (rpm)
P2 (kW)
Pref2 = 40 kW
20 kW 90 kW
Slope = −0.18 rpm/kW
(a)
Nref2 = 1800
ΔPL2 = 70 kW
Stalling zone
Safe zone
Droop line
Mechanical power − losses
Electrical power
(b)
Spee
d (r
pm)

42 Electrical and Computer Engineering THE OHIO STATE UNIVERSITY
The prime-movers of both gensets have stalled because
𝑃𝑃𝑒𝑒𝑐𝑐𝑒𝑒𝑐𝑐1 + 𝑃𝑃𝑐𝑐𝑙𝑙𝑠𝑠𝑠𝑠1 > 𝑀𝑀𝑃𝑃𝑚𝑚𝑚𝑚𝑚𝑚1 (3.1)
𝑃𝑃𝑒𝑒𝑐𝑐𝑒𝑒𝑐𝑐2 + 𝑃𝑃𝑐𝑐𝑙𝑙𝑠𝑠𝑠𝑠2 > 𝑀𝑀𝑃𝑃𝑚𝑚𝑚𝑚𝑚𝑚2 (3.2)
For both the gensets, the lower limit of generator speed to avoid stalling is determined
as
𝑁𝑁𝐿𝐿−𝑐𝑐𝑙𝑙𝑚𝑚[𝐸𝐸𝐼𝐼𝑙𝑙] =90000
552.0371∗
602𝜋𝜋
= 1556.95 𝐸𝐸𝐼𝐼𝑙𝑙 (3.3)
In the next case, the two gensets are interconnected by closing the switch.
3.2.2 Case B: Both the gensets are interconnected in a microgrid
In the microgrid, the total load is shared between interconnected gensets as illustrated
by the system schematic shown in Figure 3.2. Furthermore, the gensets could help each
other by offering additional safety reserves against prime-mover stalling. The
underfrequency (V/Hz) scheme is not employed because of the risk of causing large
reactive power circulation among the interconnected gensets (cf. Section 3.4).
Here the same load reference setpoints and speed governor droop gains as in Case A
are used for the gensets. Moreover, the total load also varies in the same manner from 40
kW to 180 kW. At the beginning, the combined load of 40 kW is shared by both units
according to their droop curves. When the two units are running at a steady state speed of
1800 rpm, Genset-2 takes up the entire load of 40 kW since Pref2 = 40 kW and Genset-1
is not loaded like the pre-load condition in Case A. For Case B, the operation points are
indicated by A1 and A2 in Figure 3.5, which includes both the steady state load sharing
(cf. Figure 3.5 (a)) and the dynamic behavior (cf. Figure 3.5 (b)).
43 Electrical and Computer Engineering THE OHIO STATE UNIVERSITY
Ea1ejω1t
P1+jQ1
Vpccejωpcct
Engine-1 SG-1
Tlim1
Ea2ejω2t
Engine-2 SG-2
Tlim2 PL+jQL
Figure 3.4 Schematic illustrating the interconnection of two gensets in the islanded microgrid. The
transient load sharing between gensets is affected by droop gains as well as transient reactances (𝑋𝑋𝑑𝑑′ ).
Xd2′ + Xcab2
P2+jQ2
Genset-1
Genset-2
Xd1′ + Xcab1
When the combined load was increased from 40 kW to 180 kW, Genset-2 took a
higher proportion of the load than Genset-1. This is indicated by the change in operating
points from Ax to Bx (where x = 1, 2) in Figure 3.5. It should be noted that at the
beginning, the load sharing among gensets is influenced by their respective source
reactances and droop gains. Therefore, the synchronous generator is modeled as a back
emf (Ea) in series with transient reactance (𝑋𝑋𝑑𝑑′ ) in Figure 3.4.
According to the stalling analysis described in previous chapter, the lower limit of
speed for the two gensets to avoid prime-mover stalling can be calculated
according to the final steady state power allocations [12].
𝑁𝑁𝐿𝐿−𝑐𝑐𝑙𝑙𝑚𝑚1 =77000 [𝑘𝑘]
552.0371 [𝑁𝑁𝑙𝑙]×
602𝜋𝜋
= 1332 𝐸𝐸𝐼𝐼𝑙𝑙 (3.4)
𝑁𝑁𝐿𝐿−𝑐𝑐𝑙𝑙𝑚𝑚2 =103000 [𝑘𝑘]
552.0371 [𝑁𝑁𝑙𝑙]×
602𝜋𝜋
= 1782 𝐸𝐸𝐼𝐼𝑙𝑙 (3.5)

44 Electrical and Computer Engineering THE OHIO STATE UNIVERSITY
N (rpm)
P (kW) Pref2=40 kW
Nref = 1800
ΔPL2 = 63 kW
Pref1= 0 kW
ΔPL1 = 77 kW Slope = −0.18 rpm/kW
Spee
d (r
pm)
Power (kW)
Figure 3.5 Load sharing among Genset-1 and Genset-2. (a) Steady state speed governor droop
characteristics, and (b) locus of the active power-speed response for a 40−180 kW step load
application.
(a)
A1 A2 B2 B1
Genset -1 Genset - 2
Genset -1 Genset - 2
Stalling zone
Safe zone Safe zone
Droop line Droop line
Stalling zone
Mechanical power − losses
Electrical power
(b)
Slope = −0.18 rpm/kW
A2
B2 A1 B1
45 Electrical and Computer Engineering THE OHIO STATE UNIVERSITY
As seen in Figure 3.5 (b), the speed of Genset-2 has gone below NL-lim2 computed in
(3.5). The lower speed operation at N2 < NL-lim2 should have led to prime-mover stalling
in Genset-2. Besides, the dynamic behavior of Genset-2 (cf. Figure 3.5 (b)) also points
out that the electrical load shared by it has briefly exceeded the MPmax2 line. However, it
did not happen because Genset-1 has sufficient safety margin to cover itself and pull out
Genset-2 from its Stalling zone. This can be observed from Genset-1 response in Figure
3.5 (b) and its NL-lim1 calculation of 1332 rpm in (3.4). Interestingly, the added safety
reserve of Genset-1 has protected Genset-2 from stalling (and has extended the Safe zone)
although Genset-2’s speed dropped below its NL-lim2 of 1782 rpm as per (3.5).
3.3 Load Sharing in a Mixed Source Microgrid Under Limiting
Conditions
A mixed source microgrid comprises diverse kinds of DERs. The CERTS Microgrid
is a mixed source microgrid with synchronous generator-based (i.e., genset) and inverter-
based DERs. Studies are carried out to investigate the dynamic behavior of CERTS
Microgrid (cf. Figure 1.1), when the DERs are operated at their limiting conditions [14].
3.3.1 Case A: DER-1 (genset)operated in the isochronous mode; DER-2 (inverter-
based DER)CERTS droop controller setpoints: Pref2 = 0 kW, Qref2 = 0, Pmax2 =
100 kW.
Figure 3.6 shows a simplified schematic of the mixed microgrid under test. As the
genset is operated in the isochronous mode, its speed is regulated at the nominal speed.

46 Electrical and Computer Engineering THE OHIO STATE UNIVERSITY
Vpccejωpcct
Vac2ejω2t
PL+jQL
Figure 3.6 Schematic of the mixed source microgrid comprising synchronous generator-based and
inverter-based DERs
XT + Xcab2
Pelec2+jQelec2
Engine-2 PMSG-2
Tlim2
DER-2
XL
Va1ejω1t
Pelec1+jQelec1
Engine-1 SG-1
Tlim1 Xcab1
DSP Controls
DER-1
The aim of this study is to investigate the system dynamic behavior when the genset
reaches the engine fuel map limits (i.e., MPmax1 line).
Simulation results from MATLAB/Simulink illustrating the system performance
for 75−150 kW load change are shown in Figure 3.7. The corresponding experimental
results from the CERTS Microgrid validating the models are displayed in Figure 3.8.
Before the load change, the genset takes up the entire burden of 75 kW since the load
reference setpoint on the inverter-based DER, i.e., Pref2 = 0 kW. At the instant of the load
change event, the inverter-based DER experienced the major transient burden. This is due
to its lower output reactance (XL + XT = 0.06 p.u.) as compared to the transient reactance
of generator (𝑋𝑋𝑑𝑑′ = 0.184 p.u.) [34]. However, it should be noted that there is discrepancy

47 Electrical and Computer Engineering THE OHIO STATE UNIVERSITY
in terms of damping between the simulation results and experimental data. It is attributed
to lack of complete details in the published information on commercially manufactured
DERs.
On the other hand, the steady state frequency after the load change event is not
restored to the nominal value by the genset’s isochronous governor. This is because the
genset’s output increased to take up the extra burden since the inverter’s load reference
setpoint (Pref2) is 0 kW. However, the genset’s mechanical power production got limited
by the engine fuel map to around 100 kW @ 59.7 Hz. Therefore, the remaining load of
Figure 3.7 Simulation results illustrating the system performance for a load change from 75 kW to 150
kW. DER-1 (genset in blue): isochronous governor; DER-2 (inverter-based DER in red): Pref2 = 0 kW,
Pmax2 = 100 kW.
P elec
1, Pel
ec2 (W
) f 1, f
2 (H
z)
Time (s)
Time (s)

48 Electrical and Computer Engineering THE OHIO STATE UNIVERSITY
50 kW is transferred to the inverter-based DER (despite having Pref2 = 0) and the
frequency dropped according to the droop gain programmed in its controller.
The steady state behavior can be better explained by the graphical illustration in
Figure 3.9. As seen in this figure, the genset got limited by its fuel map (i.e., MPmax1 line)
to take just 25 kW more load burden. Therefore, the inverter-based DER is forced to take
up the balance load of 50 kW. During this action, the system cannot bring the steady state
Figure 3.8 Experimental results illustrating the system performance for a load change from 75 kW to 150
kW. DER-1 (genset in blue): isochronous governor; DER-2 (inverter-based DER in red): Pref2 = 0 kW,
Pmax2 = 100 kW.
P ele
c1, P
elec
2 (W
) f 1
, f2 (H
z)
Time (s)
Time (s)
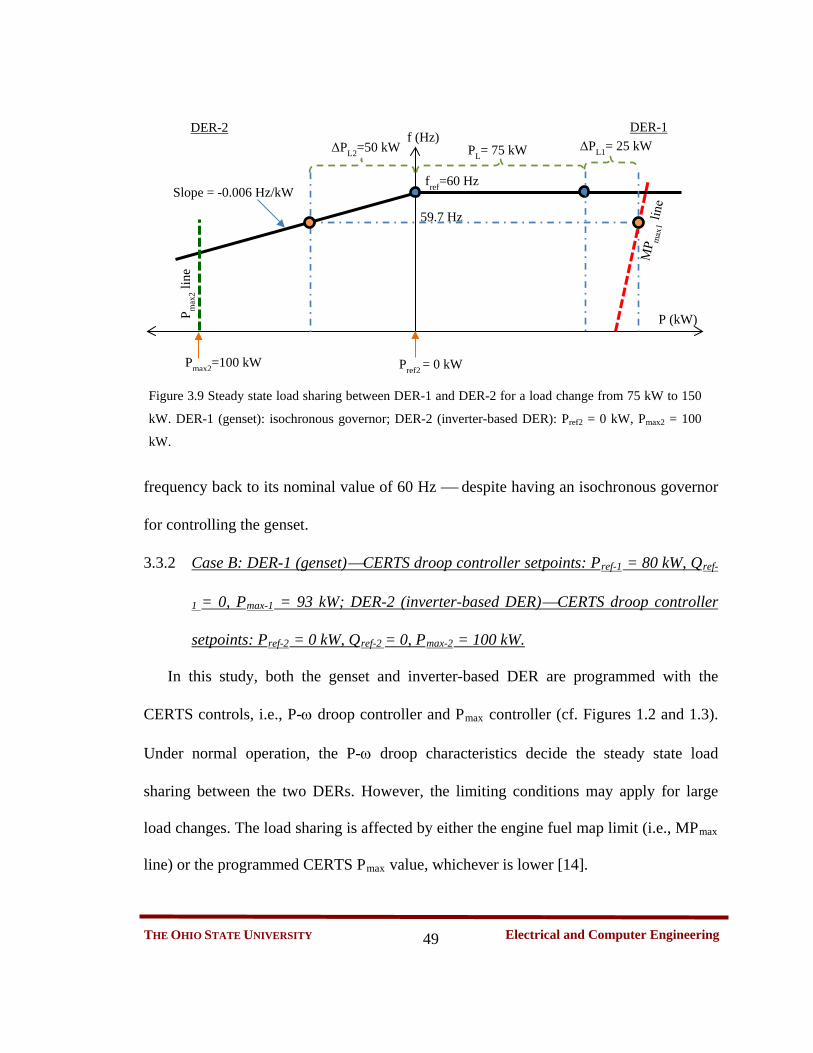
49 Electrical and Computer Engineering THE OHIO STATE UNIVERSITY
frequency back to its nominal value of 60 Hz despite having an isochronous governor
for controlling the genset.
3.3.2 Case B: DER-1 (genset)CERTS droop controller setpoints: Pref-1 = 80 kW, Qref-
1 = 0, Pmax-1 = 93 kW; DER-2 (inverter-based DER)CERTS droop controller
setpoints: Pref-2 = 0 kW, Qref-2 = 0, Pmax-2 = 100 kW.
In this study, both the genset and inverter-based DER are programmed with the
CERTS controls, i.e., P-ω droop controller and Pmax controller (cf. Figures 1.2 and 1.3).
Under normal operation, the P-ω droop characteristics decide the steady state load
sharing between the two DERs. However, the limiting conditions may apply for large
load changes. The load sharing is affected by either the engine fuel map limit (i.e., MPmax
line) or the programmed CERTS Pmax value, whichever is lower [14].
f (Hz)
fref=60 Hz
Pref2 = 0 kW
P (kW)
DER-2 DER-1
Slope = -0.006 Hz/kW
ΔPL2=50 kW
Pmax2=100 kW
P max
2 lin
e
Figure 3.9 Steady state load sharing between DER-1 and DER-2 for a load change from 75 kW to 150
kW. DER-1 (genset): isochronous governor; DER-2 (inverter-based DER): Pref2 = 0 kW, Pmax2 = 100
kW.
59.7 Hz
PL= 75 kW ΔPL1= 25 kW

50 Electrical and Computer Engineering THE OHIO STATE UNIVERSITY
The simulation results from MATLAB/Simulink and experimental data showing
the behavior of the DERs when the load is increased from 75−150 kW are illustrated in
Figures 3.10 and 3.11, respectively. At first, for the 75 kW load condition the genset (i.e.,
DER-1) is dispatched at 75 kW and inverter-based DER at 0 kW as the load reference
setpoints programmed at Pref1 = 75 kW and Pref2 = 0 kW. When the load is increased
from 75 kW to 150 kW, the genset (DER-1) load sharing is limited by its CERTS
maximum power controller value, which was programmed as Pmax1 = 93 kW. Moreover,
Figure 3.10 Simulation results illustrating the system performance for a load change from 75 kW to 150
kW. DER-1 (genset in blue): Pref1 = 75 kW, Pmax1 = 93 kW; DER-2 (inverter-based DER in red): Pref2 = 0
kW, Pmax2 = 100 kW.
P elec
1, Pel
ec2 (W
) f 1, f
2 (H
z)
Time (s)
Time (s)

51 Electrical and Computer Engineering THE OHIO STATE UNIVERSITY
the steady state frequency is no more dictated by the droop curves. This can be observed
from the graphical illustration in Figure 3.12.
As seen in Figure 3.12, when the load is increased from 75 kW to 150 kW, the genset
output got limited by its Pmax1 value to just an additional 18 kW. Hence, the other DER in
the microgrid (i.e., inverter-based DER) is forced to take up the balance load of 57 kW.
During this action, the system deviated from the droop curves and settled at the steady
state frequency of 59.66 Hz.
Thus, the CERTS controls offer the software flexibility in setting the maximum
power (i.e., Pmax1) through programming to any value less than the engine fuel map limit
Figure 3.11 Experimental results illustrating the system performance for a load change from 75 kW to 150
kW. DER-1 (genset in blue): Pref1 = 75 kW, Pmax1 = 93 kW; DER-2 (inverter-based DER in red): Pref2 = 0
kW, Pmax2 = 100 kW.
P elec
1, Pel
ec2 (W
) f 1, f
2 (H
z)
Time (s)
Time (s)

52 Electrical and Computer Engineering THE OHIO STATE UNIVERSITY
(i.e., MPmax line) [14]. Therefore, one of the key advantages in using such controls is that
even a smaller rated synchronous generator can be driven from the same prime-mover by
programming a lower value Pmax < MPmax. Otherwise, the generator would need to be
oversized above the engine rated maximum capability (i.e., MPmax), as seen in the earlier
case of the isochronous governor controlled genset.
3.4 Why is the Underfrequency Load Relief (V/Hz) Scheme not used in
Gensets for Operation in Microgrid?
It was observed earlier in Section 2.3 that the underfrequency load relief (V/Hz)
scheme could prevent the prime-mover stalling condition in gensets for standalone mode
of operation. This is because the V/Hz scheme senses a decrease in frequency below a
Figure 3.12 Steady state load sharing between DER-1 and DER-2 for a load change from 75 kW to 150
kW. DER-1 (genset): isochronous governor; DER-2 (inverter-based DER): Pref2 = 0 kW, Pmax2 = 100 kW.
f (Hz)
fref=60 Hz
Pref2 = 0 kW
P (kW)
DER-2 DER-1 ΔPL2=57 kW ΔPL1= 18 kW
Pref1 = 75 kW
59.66 Hz
Pmax1 = 93 kW Pmax2 = 100 kW
P max
2 lin
e
P max
1 lin
e
Slope= -0.006 Hz/kW
Slope= -0.006 Hz/kW
PL=75 kW
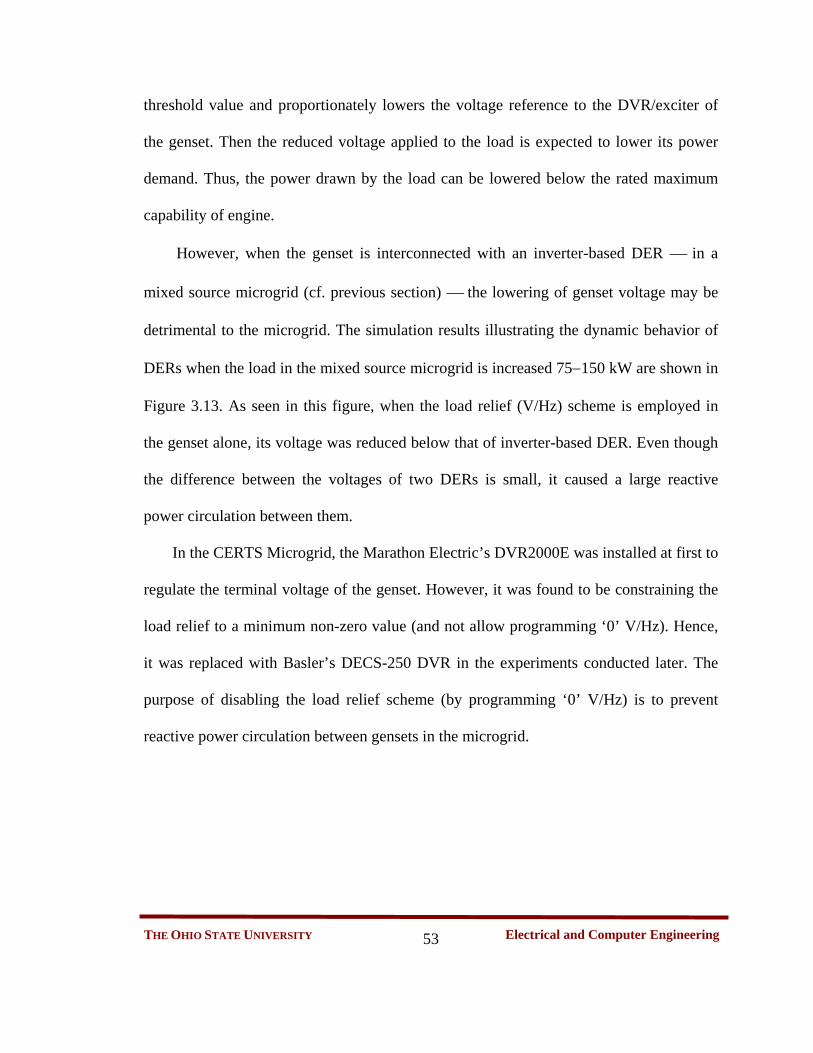
53 Electrical and Computer Engineering THE OHIO STATE UNIVERSITY
threshold value and proportionately lowers the voltage reference to the DVR/exciter of
the genset. Then the reduced voltage applied to the load is expected to lower its power
demand. Thus, the power drawn by the load can be lowered below the rated maximum
capability of engine.
However, when the genset is interconnected with an inverter-based DER in a
mixed source microgrid (cf. previous section) the lowering of genset voltage may be
detrimental to the microgrid. The simulation results illustrating the dynamic behavior of
DERs when the load in the mixed source microgrid is increased 75−150 kW are shown in
Figure 3.13. As seen in this figure, when the load relief (V/Hz) scheme is employed in
the genset alone, its voltage was reduced below that of inverter-based DER. Even though
the difference between the voltages of two DERs is small, it caused a large reactive
power circulation between them.
In the CERTS Microgrid, the Marathon Electric’s DVR2000E was installed at first to
regulate the terminal voltage of the genset. However, it was found to be constraining the
load relief to a minimum non-zero value (and not allow programming ‘0’ V/Hz). Hence,
it was replaced with Basler’s DECS-250 DVR in the experiments conducted later. The
purpose of disabling the load relief scheme (by programming ‘0’ V/Hz) is to prevent
reactive power circulation between gensets in the microgrid.
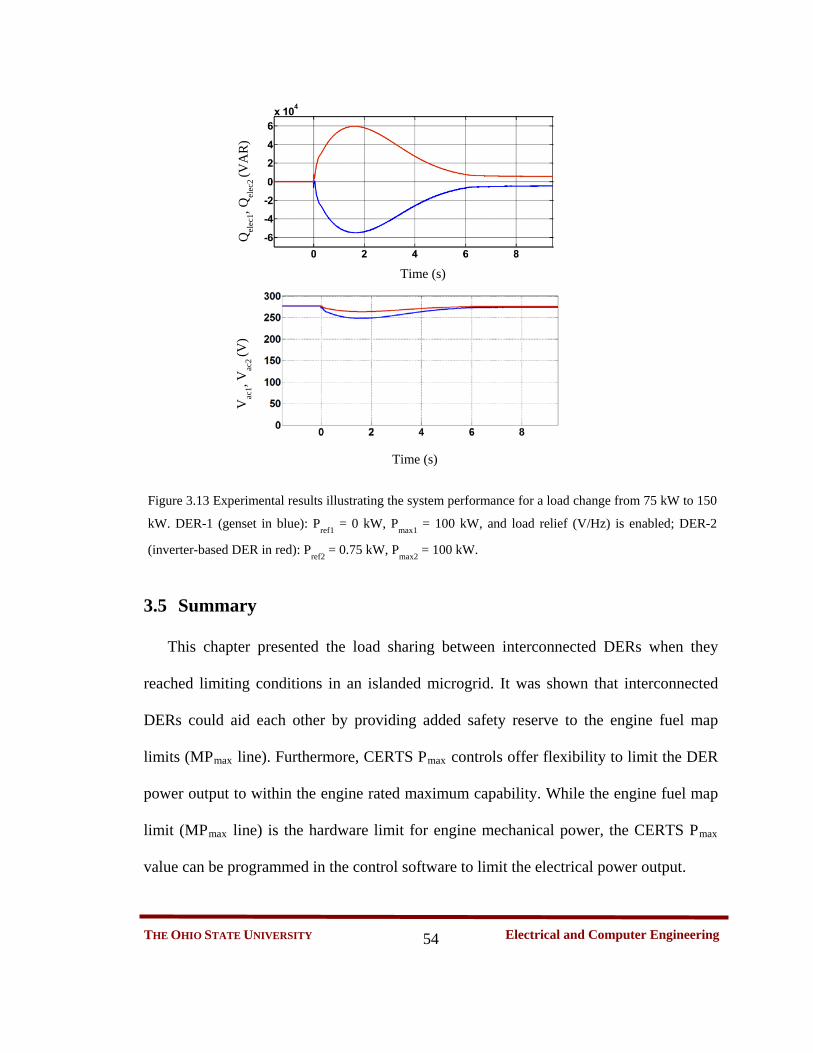
54 Electrical and Computer Engineering THE OHIO STATE UNIVERSITY
3.5 Summary
This chapter presented the load sharing between interconnected DERs when they
reached limiting conditions in an islanded microgrid. It was shown that interconnected
DERs could aid each other by providing added safety reserve to the engine fuel map
limits (MPmax line). Furthermore, CERTS Pmax controls offer flexibility to limit the DER
power output to within the engine rated maximum capability. While the engine fuel map
limit (MPmax line) is the hardware limit for engine mechanical power, the CERTS Pmax
value can be programmed in the control software to limit the electrical power output.
Figure 3.13 Experimental results illustrating the system performance for a load change from 75 kW to 150
kW. DER-1 (genset in blue): Pref1 = 0 kW, Pmax1 = 100 kW, and load relief (V/Hz) is enabled; DER-2
(inverter-based DER in red): Pref2 = 0.75 kW, Pmax2 = 100 kW.
Qel
ec1, Q
elec
2 (V
AR
) V
ac1, V
ac2 (V
)
Time (s)
Time (s)

55 Electrical and Computer Engineering THE OHIO STATE UNIVERSITY
CHAPTER 4
CONTROL AND PREVENTION OF PRIME-MOVER STALLING IN
DISTRIBUTED ENERGY RESOURCES
4.1 Introduction
The earlier chapters discussed the operation and performance of an islanded
microgrid when the DERs reach the rated maximum capability. It was observed that
synchronous generator-based DERs (i.e., gensets) interconnected in a microgrid aided
each other against prime-mover stalling by augmenting their margin capacity reserves (cf.
Section 3.2). Similar trend took place in a mixed source microgrid where an inverter-
based DER with enough reserve capacity came to the assistance of a genset that reached
its limiting condition (cf. Section 3.3). However, during experiments carried out at the
CERTS Microgrid, the results were negative when the power allocations of genset and
inverter-based DER were equal [28]. The inverter-based DER could not be prevented
from stalling upon load increase by an interconnected genset sharing the load equally.
Therefore, further investigations are carried out to understand the impact of sluggish
genset controls vis-à-vis fast inverter controls on the system dynamic behavior. Various
control strategies are studied to avoid prime-mover stalling condition in gensets as well
as inverter-based DERs [28].

56 Electrical and Computer Engineering THE OHIO STATE UNIVERSITY
Vac1ejω1t
Pelec1+jQelec1
𝑉𝑉𝑝𝑝𝑐𝑐𝑐𝑐𝑒𝑒𝑗𝑗𝜔𝜔𝑝𝑝𝑒𝑒𝑒𝑒𝑡𝑡
Engine-1 SG-1
Xcab1
Tlim1
Vac2ejω2t
PL+jQL
Figure 4.1 Schematic of the mixed source microgrid comprising inverter- and synchronous generator-
based DERs.
XT + Xcab2
Pelec2+jQelec2
DER-1
Engine-2 PMSG-2
Tlim2
DER-2
XL
DSP Controls
4.2 Analysis of DER Prime-mover Stalling in a Mixed Source
Microgrid
The mixed source microgrid comprising both genset and inverter-based DER is
reexamined in this section for more severe conditions than before (cf. Section 3.3), but
which could result in prime-mover stalling. Figure 4.1 gives a simplified circuit
schematic of the system under investigation. The dynamic modeling and simulation was
carried out in MATLAB/Simulink using SimPowerSystems toolbox. It is assumed
that the genset is controlled by an isochronous governor, whereas the controls for
inverter-based DER are the same as in Figure 1.4. To validate the simulation models,
experimental test data from CERTS Microgrid was used. However, it should be noted

57 Electrical and Computer Engineering THE OHIO STATE UNIVERSITY
that the commercial DER equipment do not provide access to all internal state variables.
Besides, the data acquisition system was found to have low resolution and quality for
some of the measurements. In such instances, the study relies on model-derived quantities
for gaining a better understanding of the internal dynamics.
4.2.1 Case study
The mixed source microgrid in Figure 4.1 is subjected to a 75−150 kW load change
with the genset is running with the isochronous governor, and the load reference setpoint
of inverter-based DER at Pref2 = 37.5 kW. Figures 4.2 and 4.3 present the experimental
waveforms and simulation results for this test. Before the load change event, the original
load of 75 kW is equally split between the two DERs. When another 75 kW load is added
to the system, the inverter-based DER took the big hit at first due to its smaller output
reactance as compared to the transient reactance 𝑋𝑋𝑑𝑑′ of generator. The sequence of events
that took place during this test are illustrated Figures 4.2−4.4. Since the genset is run with
an isochronous governor, it is expected become the slack unit and bring the inverter-
based DER back to Pref2 = 37.5 kW in the steady state. However, as seen in experimental
test and computer simulation, the transient load burden on inverter-based DER has
tripped it leading to the genset overload and eventually system collapse.
4.2.2 Discussion of the Microgrid System Collapse
To examine the sequence of events − in Figures 4.2−4.4, the internal state
variables (of inverter-based DER) not accessible in the commercial unit installed at
the CERTS Microgrid test bed are acquired from the developed model to plot the
PMSG speed vs. power presented in Figure 4.5 [28]. From this figure, it is evident that

58 Electrical and Computer Engineering THE OHIO STATE UNIVERSITY
Figure 4.2 Experimental results showing the performance of the DERs for a load change from 75 kW to
150 kW. DER-1 (genset in red): isochronous governor; DER-2 (inverter-based DER in blue): Pref2 = 37.5
kW, Pmax2 = 100 kW.
Vac
1, Vac
2 (V)
P ele
c1, P
elec
2 (W
) Q
elec
1, Q
elec
2 (V
AR
) I 1, I
2 (A)
Inverter-based DER takes higher load
Genset voltage when inverter-based DER has dropped-off
Genset takes entire load
Inverter-based DER has dropped-off
1
Genset has dropped-off
2
6
4
3
Time(s)
59 Electrical and Computer Engineering THE OHIO STATE UNIVERSITY
Figure 4.3 Simulation results showing the performance of the DERs for a load change from 75 kW to 150
kW. DER-1 (genset in red): isochronous governor; DER-2 (inverter-based DER in blue): Pref2 = 37.5 kW,
Pmax2 = 100 kW.
Vac
1, V
ac2 (
V)
I 1, I 2 (
A)
Inverter-based DER takes higher load transient
Genset takes entire load
Inverter-based DER has dropped-off
Genset has dropped-off
Collapse in voltage of inverter-based DER
2
1
6 4
3 Q
elec
1, Qel
ec2 (V
AR
) P el
ec1, P
elec
2 (W)
Time(s)

60 Electrical and Computer Engineering THE OHIO STATE UNIVERSITY
the transient load taken at the instant of load change by the inverter-based DER has
caused prime-mover stalling , which led to its voltage collapse and the inverter
dropped-off (i.e., tripped) . Then, the entire load burden of 150 kW fell on the genset,
thereby overloading it (cf. Figures 4.2−4.4). Since 150 kW load is more than the rated
maximum capability of genset per the engine fuel map (cf. Figure 2.2 [31]), the genset
has also experienced prime-mover stalling. This led to frequency collapse in the genset
Time (s)
f 1, f2 (H
z)
Collapse in frequency of the genset
5
Figure 4.4 Simulation plot showing the frequency collapse in the genset (DER-1) of the mixed source
microgrid for a 75−150 kW step load application.
Figure 4.5 Locus of the PMSG speed and voltage vs. power characteristics for the inverter-based DER
(DER-2) in the mixed source microgrid for a 75−150 kW step load application.
1
2 3
Stalling zone
Safe zone
PMSG
voltage, Vpm
sg2 (V) PM
SG sp
eed,
Npm
sg2 (r
pm)
Power (W)
Mechanical power − losses
Electrical power
× 104

61 Electrical and Computer Engineering THE OHIO STATE UNIVERSITY
, and so it dropped-off in the end . Thus, the microgrid system has crashed upon the
75−150 kW load change application.
4.3 Prevention of DER Prime-mover Stalling in a Mixed Source
Microgrid
In the earlier section, after unfolding the events following a 75−150 kW load change
in the mixed source microgrid, it became clear that at first the inverter-based DER
experienced prime-mover stalling that resulted in a cascading failure. The root cause of
the problem is the slow response of genset isochronous governor. Due to its sluggish
isochronous governor response, the genset could not restore the frequency soon enough
to ease the load burden of inverter-based DER [28]. When the frequency dropped in
response to the load change event, the inverter-based DER was hit with a peak load
demand that caused prime-mover stalling that resulted in a voltage collapse.
4.3.1 Modified Power−frequency (P-ω) droop controller for inverter-based DER
The DER prime-mover stalling in mixed source microgrid can be resolved in many
ways. In the microgrid under study (cf. Figure 4.1), a solution would be to move the
transient load burden from the inverter-based DER to the synchronous generator-based
DER. With this goal in mind, a modified controller architecture using lead/lag controls is
proposed for the inverter-based DER.
In the inverter-based DER, the traditional active power−frequency (P-ω) droop
controller has a constant droop gain, bp1 [2]. Table 4.1 shows the transfer function of the
proposed controller, and equations governing frequency response to a step change in
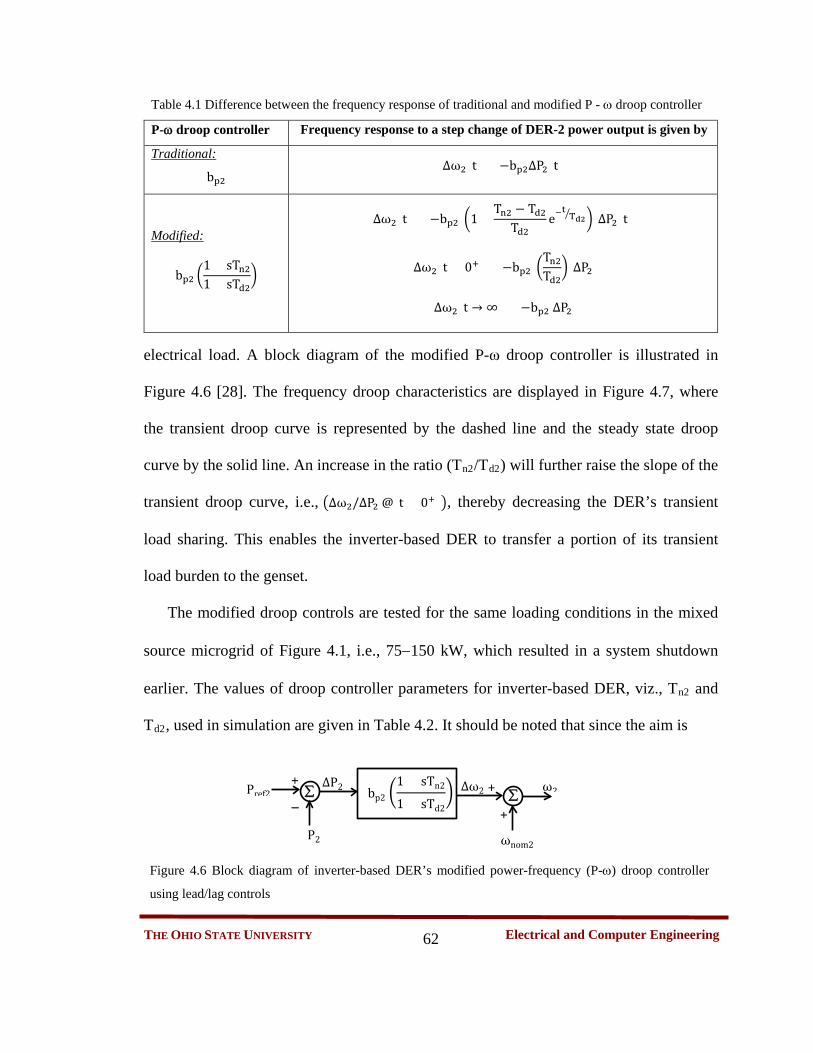
62 Electrical and Computer Engineering THE OHIO STATE UNIVERSITY
electrical load. A block diagram of the modified P-ω droop controller is illustrated in
Figure 4.6 [28]. The frequency droop characteristics are displayed in Figure 4.7, where
the transient droop curve is represented by the dashed line and the steady state droop
curve by the solid line. An increase in the ratio (Tn2/Td2) will further raise the slope of the
transient droop curve, i.e., �∆ω2/∆P2 @(t = 0+)�, thereby decreasing the DER’s transient
load sharing. This enables the inverter-based DER to transfer a portion of its transient
load burden to the genset.
The modified droop controls are tested for the same loading conditions in the mixed
source microgrid of Figure 4.1, i.e., 75−150 kW, which resulted in a system shutdown
earlier. The values of droop controller parameters for inverter-based DER, viz., Tn2 and
Td2, used in simulation are given in Table 4.2. It should be noted that since the aim is
Table 4.1 Difference between the frequency response of traditional and modified P - ω droop controller
P-ω droop controller Frequency response to a step change of DER-2 power output is given by
bp2
Traditional: ∆ω2(t) = −bp2∆P2(t)
bp2 �1 + sTn21 + sTd2
�
Modified: ∆ω2(t) = −bp2 �1 +
Tn2 − Td2Td2
e−tTd2� � ∆P2(t)
∆ω2(t = 0+) = −bp2 �Tn2Td2
� ∆P2
∆ω2(t → ∞) = −bp2 ∆P2
ωnom2 +
+
+ −
ω2
P2
∑ bp2 �1 + sTn2
1 + sTd2� ∆ω2 Pref2 ∆P2
∑
Figure 4.6 Block diagram of inverter-based DER’s modified power-frequency (P-ω) droop controller
using lead/lag controls

63 Electrical and Computer Engineering THE OHIO STATE UNIVERSITY
to change the transient load sharing and not the steady state, the value of bp2 parameter is
the same as before. Figure 4.8 shows the simulation results for this test. Before the load
change event, the original load of 75 kW is equally split between the two DERs. When
another 75 kW load is added to the system, the peak (transient) load shared by inverter-
based DER was limited to about 100 kW, which did not cause stalling of its prime-mover.
This is further illustrated by the prime-mover speed and PMSG voltage vs. power
characteristics shown in Figure 4.9.
Table 4.2 Lead/lag transfer function based modified droop controller settings
DER-k Tnk (s/rad) Tdk (s/rad) bpk (rad/s/Ppu )
DER-2 4 1 2*π
DER-1 Isochronous governor
P2 (kW)
ω2 (rad/sec)
Pref2 = 0
Figure 4.7 Transient and steady state frequency droop curves of the inverter-based DER with modified
power-frequency (P-ω) controls.
Droop slope (t) = −bp2 �1 + Tn2−Td2Td2
e−t Td2⁄ �, where Tn2 > Td2
Droop slope (t → ∞) = −bp2
Droop slope (t = 0+) = −bp2 �Tn2Td2�
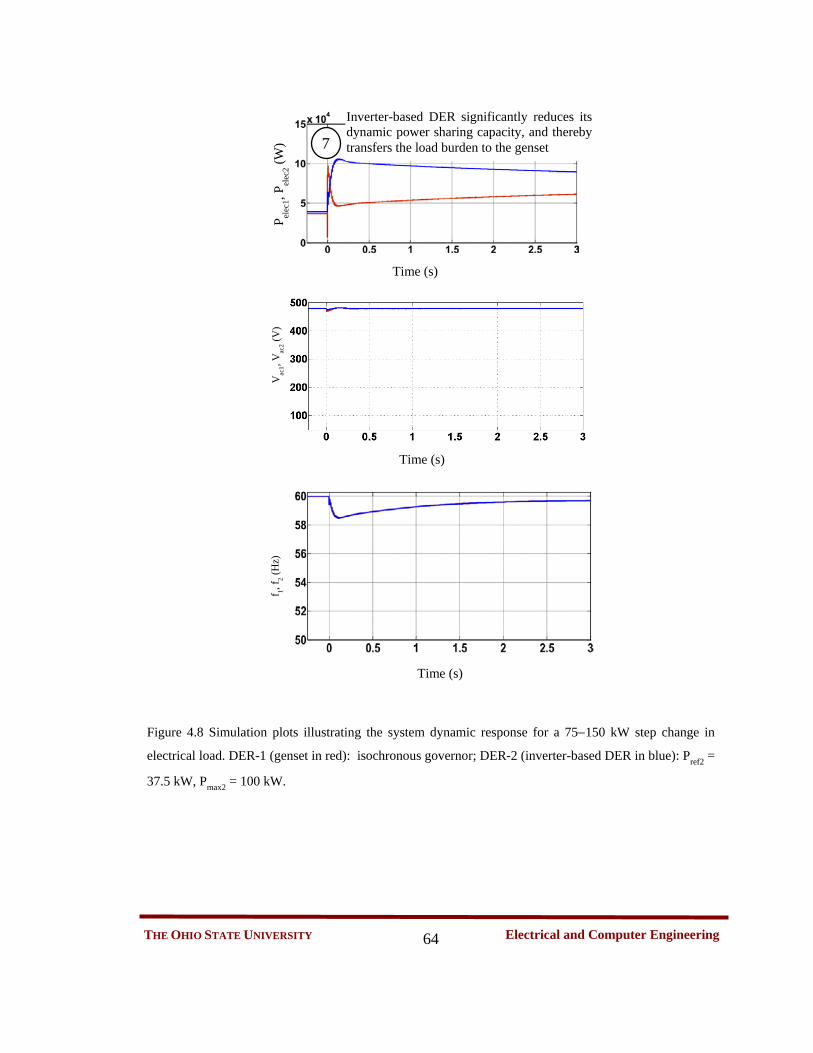
64 Electrical and Computer Engineering THE OHIO STATE UNIVERSITY
7
Inverter-based DER significantly reduces its dynamic power sharing capacity, and thereby transfers the load burden to the genset
Figure 4.8 Simulation plots illustrating the system dynamic response for a 75−150 kW step change in
electrical load. DER-1 (genset in red): isochronous governor; DER-2 (inverter-based DER in blue): Pref2 =
37.5 kW, Pmax2 = 100 kW.
Vac
1, Vac
2 (V)
f 1, f2 (H
z)
P elec
1, Pel
ec2 (W
)
Time (s)
Time (s)
Time (s)

65 Electrical and Computer Engineering THE OHIO STATE UNIVERSITY
As seen in Figures 4.8 and 4.9, the modified droop controller of inverter-based DER
ensures that the electrical power trajectory stays within the Safe zone. Figures 4.10 (a)
and (b) highlight the distinct frequency response characteristics of inverter-based DER
and genset during this test. It is clear from the results that the proposed controls can be a
viable option in preventing the prime-mover stalling in the inverter-based DER.
Figure 4.9 Locus of the PMSG speed and voltage vs. power characteristics for the inverter-based DER in
the mixed source microgrid for a 75−150 kW step load application
Stalling zone
Safe zone PM
SG voltage, V
pmsg2 (V
) PMSG
spee
d, N
pmsg
2 (rpm
)
Power (W)
Mechanical power − losses
Electrical power
A2 B2

66 Electrical and Computer Engineering THE OHIO STATE UNIVERSITY
Figure 4.10 Results showing the performance of the proposed controller for 75−150 kW load change.
DER1 (synchronous generator in red): isochronous governor; DER2 (inverter in blue): Pref2 = 37.5 kW,
Pmax2 = 100 kW. See Figure 4.8 for the description of event .
DER - 1 (Genset)
DER - 2 (Inverter-based DER)
58.5
60
59.5
59
P2 (kW)
P max
2= 1
00 k
W
f 2 (H
z)
f 1 (H
z)
Mechanical power − losses
Electrical power
150 50 100 P1 (kW)
7
A2 B2
A1 B1
7 58.5
60
59.5
59
150 50 100
Slope (t → ∞) = −bp2
Slope (t = 0+) = −bp2 �Tn2Td2�
(a)
(b)

67 Electrical and Computer Engineering THE OHIO STATE UNIVERSITY
4.4 Prevention of DER Prime-mover Stalling Through Governor
Controls
In the last section, the prime-mover stalling in an inverter-based DER was prevented
by changing its power-frequency (P-ω) droop controller. This worked in a mixed source
microgrid scenario since the transient load burden is transferred to another DER; but it
would be ineffective in the standalone mode of operation. Hence, other alternatives such
as the governor controls are explored for resolving the prime-mover stalling problem in
standalone systems [23].
Consider the standalone operation of the genset that was tested earlier in Section 2.2.
The prime-mover stalling took place for a 0−90 kW step load application to the genset
(cf. Figure 2.4). An investigation of the speed governor closed loop control system (cf.
Figure 1.2) reveals that the generator speed is influenced by various parameters related to
governor and reciprocating engine model in addition to the synchronous generator
parameters [23]. A few of these parameters like the machine inertia and friction
coefficient (i.e., J1 and B1) and the engine delay are physically constrained. However, the
electronic governor control gains could be programmed easily. Indeed the governor gains
were optimized to improve the engine performance earlier in [35]. Hence, the governor
control gains can be adjusted to prevent prime-mover stalling too [23].
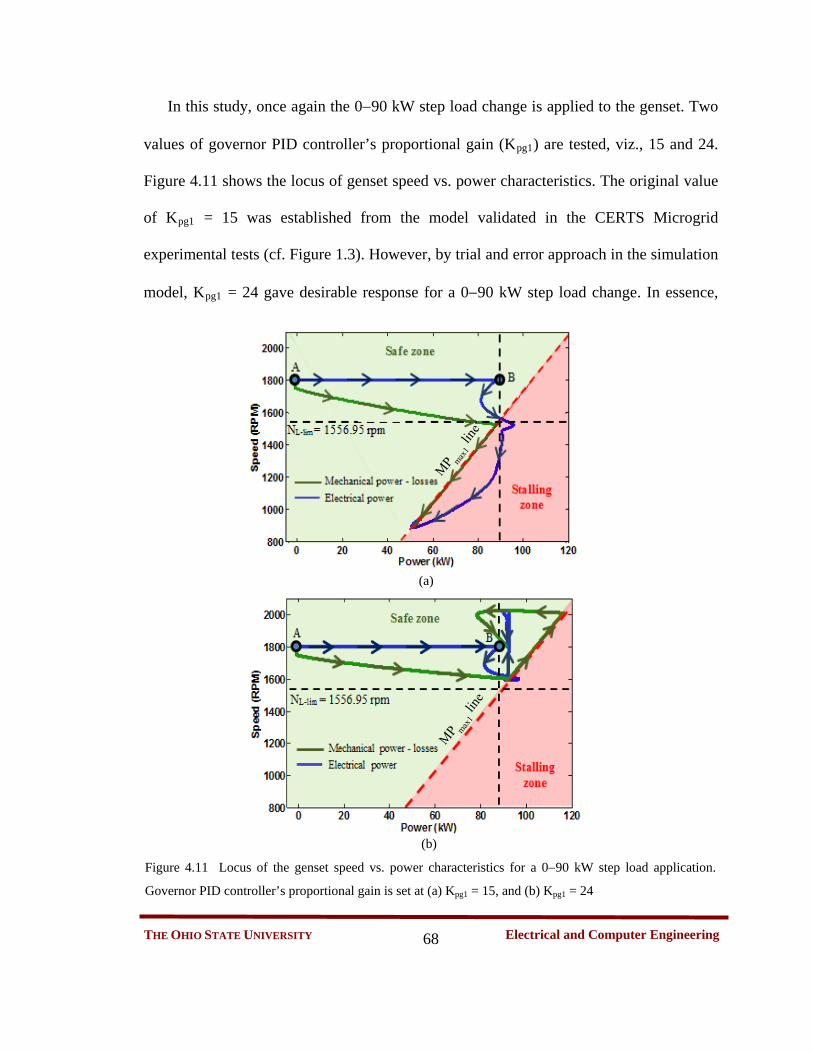
68 Electrical and Computer Engineering THE OHIO STATE UNIVERSITY
In this study, once again the 0−90 kW step load change is applied to the genset. Two
values of governor PID controller’s proportional gain (Kpg1) are tested, viz., 15 and 24.
Figure 4.11 shows the locus of genset speed vs. power characteristics. The original value
of Kpg1 = 15 was established from the model validated in the CERTS Microgrid
experimental tests (cf. Figure 1.3). However, by trial and error approach in the simulation
model, Kpg1 = 24 gave desirable response for a 0−90 kW step load change. In essence,
Figure 4.11 Locus of the genset speed vs. power characteristics for a 0−90 kW step load application.
Governor PID controller’s proportional gain is set at (a) Kpg1 = 15, and (b) Kpg1 = 24
(a)
(b)

69 Electrical and Computer Engineering THE OHIO STATE UNIVERSITY
the higher governor loop gain increased the bandwidth to produce a quicker speed
response in the genset. It helps counter the torque production delays in the natural gas
engine. The same approach can be employed in the isochronous governor of inverter-
based DER to prevent stalling of its prime-mover.
However, it should be noted that the high loop gain in engine governor controls might
not be practical or it may have adverse effects on the engine emissions. Further
experimental testing and feasibility studies are recommended in establishing the optimal
controller gains for the governor.
4.5 Summary
When multiple DERs are integrated in a microgrid, these DERs are expected to share
with each other their surplus marginal capacity so that no one will get overloaded.
However, this did not happen in a particular test carried out at the CERTS Microgrid, i.e.,
a mixed source microgrid comprising genset and inverter-based DER. It was found that
the slow acting governor controls of genset did not rescue the inverter-based DER from
its prime-mover stalling. A large load change caused voltage collapse in the inverter-
based DER and led to a cascading failure of the microgrid. The stalling problem can be
prevented in a mixed source microgrid by a coordinated control strategy, which uses
modified droop controls for the inverter-based DER. Alternatively, design changes are
suggested to the engine governor controls of DER units.
70 Electrical and Computer Engineering THE OHIO STATE UNIVERSITY
CHAPTER 5
CONCLUSION AND FUTURE WORK
5.1 Conclusion
A microgrid provides the framework for integration and coordination of distributed
energy resources (DERs). It can operate either in the grid-connected or islanded mode.
However, the islanded mode of operation presents several challenges to the microgrid
survivability. In particular, adverse conditions are observed in an islanded microgrid
when large and fluctuating loads are supplied from numerous smaller-rated DERs.
Similar conditions happen during loss of generation from a few DERs in the microgrid
causing an abrupt change in net load for the surviving DERs. If these DERs cannot
sustain the net load change, they lead the entire microgrid system to a cascading failure.
This report starts with the development of dynamic models for two kinds of prime-
mover driven DERs, viz., synchronous generator-based DER (also known as ‘genset’)
and inverter-based DER. Such models could be used in analyzing various system
scenarios of higher DER penetration, which maybe otherwise impractical to do actual
testing due to resource limitations in the field test bed.
For large and fluctuating loads close to the DER kW-rating, both the synchronous
generator-based and inverter-based DERs are found to be susceptible to stalling behavior
of their prime-movers. The root cause of stalling behavior is the slow response of engine
governor that restores the prime-mover speed following a load change. Due to the lower

71 Electrical and Computer Engineering THE OHIO STATE UNIVERSITY
Tlim line
Figure 2.2 Fuel map of GM 8.1L natural gas engine typically used in a genset [31]
inertia of DERs employed in a microgrid system, their prime-mover speed undergoes
huge swings upon a large disturbances. At lower speeds, the engine power is derated as
illustrated by the engine fuel map shown in Figure 2.2. Thus, the mechanical power
production of engine is limited by the MPmax line. The engine fuel map limit (MPmax line)
is the hardware limit for mechanical power production from engine. Any electrical load
demand exceeding the MPmax value would result in prime-mover stalling.
It is found that the prime-mover stalling in genset causes a frequency collapse in the
microgrid. By contrast, the same condition in inverter-based DER results in a voltage
collapse. This is because the inverter-based DER has an additional power conditioning
stage after the synchronous generator.
When multiple DERs are integrated in a microgrid, these DERs are expected to share
with each other their surplus marginal capacity so that no one will get overloaded. Two

72 Electrical and Computer Engineering THE OHIO STATE UNIVERSITY
microgrid case studies in Chapter 3 demonstrated this fact. However, it did not work out
in a particular test carried out at the CERTS Microgrid, i.e., a mixed source microgrid
comprising genset and inverter-based DER (cf. Chapter 4). It was found that the slow
acting governor controls of genset did not rescue the inverter-based DER from its prime-
mover stalling. This caused a voltage collapse in the inverter-based DER and led to a
cascading failure of the microgrid. Graphical and analytical methods are proposed in this
report to analyze the microgrid operation and performance under the boundary
conditions.
To prevent the prime-mover stalling in DERs, design changes are suggested to engine
governor controls. Alternatively, for an inverter-based DER operating in a mixed source
microgrid, a modified active power-frequency (P-ω) droop controller can be a viable
option. The ultimate goal is to improve the coordination between DERs in the microgrid.
5.2 Suggested Future Work
5.2.1 Feasible solutions for prevention of prime-mover stalling in DERs
One of the critical problems encountered in an islanded microgrid is the DER prime-
mover stalling even a single DER in the microgrid experiencing this problem can
cause the collapse of the entire microgrid system. To avoid this problem in a microgrid,
the CERTS Pmax controls can be applied. It may need adjustments to the existing
approach to achieve a feasible solution. Otherwise, two alternative strategies were
presented in Chapter 4 with promising simulation results. However, experimental tests
73 Electrical and Computer Engineering THE OHIO STATE UNIVERSITY
are essential to find practical and widely deployable solutions that are easy to implement
in commercial off-the-shelf DER equipment.
5.2.2 Role of smart loads and energy storage in microgrid applications
Smart loads are the variable loads that can be shed and restored in a flexible manner.
Initial studies showed that the smart loads and energy storage could provide frequency
regulation in the microgrid. Therefore, they can be effective in solving the prime-mover
stalling of DERs in microgrid. Further studies are necessary to find economically viable
solutions to install smart loads or energy storage in the microgrid.
5.2.3 Large scale microgrid simulation studies
The simulation studies carried out so far studied system integration problems in
microgrids comprising two or three DERs, smart loads and energy storage. However, the
ultimate aim is to develop modular and scalable microgrid solutions deployable in
various communities. Hence, it is imperative to conduct simulation studies on a
benchmark distribution system such as 33-bus or 69-bus system. This would help in easy
evaluation and integration of developed solutions by the broader research community.
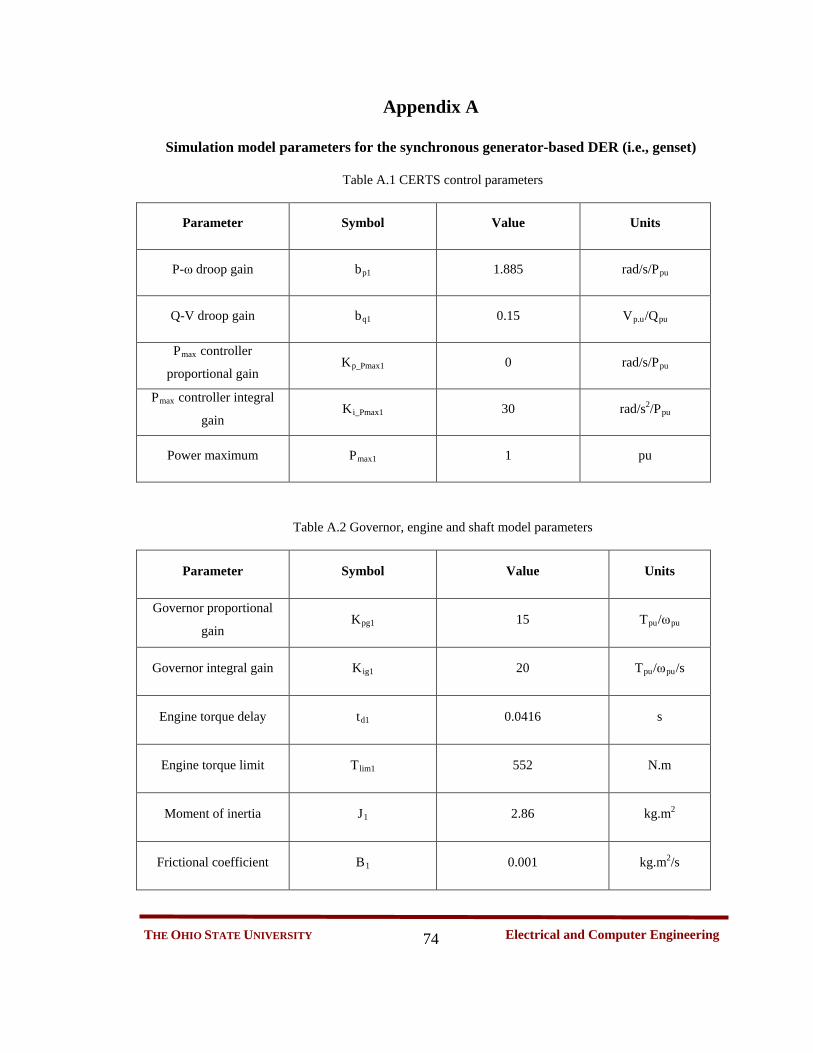
74 Electrical and Computer Engineering THE OHIO STATE UNIVERSITY
Appendix A
Simulation model parameters for the synchronous generator-based DER (i.e., genset)
Table A.1 CERTS control parameters
Parameter Symbol Value Units
P-ω droop gain bp1 1.885 rad/s/Ppu
Q-V droop gain bq1 0.15 Vp.u/Qpu
Pmax controller
proportional gain Kp_Pmax1 0 rad/s/Ppu
Pmax controller integral
gain Ki_Pmax1 30 rad/s2/Ppu
Power maximum Pmax1 1 pu
Table A.2 Governor, engine and shaft model parameters
Parameter Symbol Value Units
Governor proportional
gain Kpg1 15 Tpu/ωpu
Governor integral gain Kig1 20 Tpu/ωpu/s
Engine torque delay td1 0.0416 s
Engine torque limit Tlim1 552 N.m
Moment of inertia J1 2.86 kg.m2
Frictional coefficient B1 0.001 kg.m2/s

75 Electrical and Computer Engineering THE OHIO STATE UNIVERSITY
Table A.3 AC8B exciter model parameters
Parameter Symbol Value Units
Exciter time constant τe1 0.1 s
Exciter constant related
to self-excited field Ke1 1 NA
Exciter saturation
function Se1 0 NA
DVR proportional gain Kpe1 60 Vpu/ Vpu
DVR integral gain Kie1 40 Vpu/ Vpu/s
DVR derivative gain Kde1 0.2 Vpu.s/ Vpu
Table A.4 Synchronous generator model parameters
Parameter Symbol Value Units
Rated apparent power Srat1 225 kVA
Rated voltage Vll1 480 V
Synchronous speed Ns 1800 rpm
Synchronous reactance Xd 2.877 pu
Transient reactance Xd’ 0.184 pu

76 Electrical and Computer Engineering THE OHIO STATE UNIVERSITY
Appendix B
Simulation model parameters for the inverter-based DER
Table B.1 Parameters of CERTS controls
Parameter Symbol Value Units
P-ω droop gain bp2 3.77 rad/s/Ppu
Q-V droop gain bq2 0.15 Vp.u/Qpu
Pmax controller
proportional gain Kp_Pmax2 0 rad/s/Ppu
Pmax controller integral
gain Ki_Pmax2 30 rad/s2/Ppu
Power maximum Pmax2 1 pu
Table B.2 Governor, engine and shaft model parameters
Parameter Symbol Value Units
Governor proportional
gain Kpg2 3.7 Tpu/ωpu
Governor integral gain Kig2 5 Tpu/ωpu/s
Engine torque delay td2 0.0416 s
Engine torque limit Tlim2 398 N.m
Moment of inertia J2 1 kg.m2
Frictional coefficient B2 0.001 kg.m2/s

77 Electrical and Computer Engineering THE OHIO STATE UNIVERSITY
Table B.3 Permanent magnet synchronous generator model parameters
Parameter Symbol Value Units
Rated apparent power Srated2 125 kVA
Rated voltage Vll2 600 V
Rated RPM Nr 3000 rpm
EMF constant Ke 1.32 V/rad/s
Table B.4 Filter and transmission line parameters
Parameter Symbol Value Units
Filter reactance XL 3 %
Transformer reactance XT 5 %
Cable reactance Xcab1 0.1 %
Cable reactance Xcab2 2 %

78 Electrical and Computer Engineering THE OHIO STATE UNIVERSITY
References
[1] R. H. Lasseter, J. H. Eto, B. Schenkman, J. Stevens, H. Vollkommer, D. Klapp, E.
Linton, H. Hurtado, and J. Roy, “CERTS Microgrid Laboratory Test Bed,” IEEE
Trans. Power Deliv., vol. 26, no. 1, pp. 325–332, Jan. 2011.
[2] R. H. Lasseter and P. Piagi, “Microgrid: a conceptual solution,” in 2004 IEEE 35th
Annual Power Electronics Specialists Conference, 2004, vol. 6, pp. 4285–4290.
[3] H. Nikkhajoei and R. H. Lasseter, “Distributed generation interface to the CERTS
microgrid,” IEEE Trans. Power Deliv., vol. 24, no. 3, pp. 1598–1608, 2009.
[4] “Inverter-Based Cogeneration InVerdẽ, INV-100.” [Online]. Available:
http://www.tecogen.com/products-cogeneration-inv-100.htm. [Accessed: 12-Apr-
2016].
[5] “InVerdẽ INV-100 CHP Module,” Operation & Maintenance Manual. TECOGEN
Inc., Waltham, MA, 2009.
[6] D. Klapp, R. Zimmerly, and J. Howard, “CERTS Microgrid, Tecogen InVerdẽ
INV 100 Test Report,” 2012. [Online]. Available:
http://energy.lbl.gov/ea/certs/pdf/aep-tecogen-inverde-100.pdf. [Accessed: 11-Apr-
2016].
[7] S. Krishnamurthy, T. M. Jahns, and R. H. Lasseter, “The operation of diesel
gensets in a CERTS microgrid,” in 2008 IEEE Power and Energy Society General
Meeting, 2008.
[8] A. Gangopadhyay and P. Meckl, “Modeling, validation and system identification

79 Electrical and Computer Engineering THE OHIO STATE UNIVERSITY
of a natural gas engine,” in Proceedings of the 1997 American Control
Conference, 1997, vol. 1, pp. 294–298.
[9] “IEEE Recommended Practice for Excitation System Models for Power System
Stability Studies,” IEEE Std 421.5-2005. pp. 1–85, 2006.
[10] “DECS 250,” Instruction Manual for Digital Excitation Control System. Basler
Electric, Highland, IL.
[11] “Synchronous Generator - Typical Dynamic Characteristics,” 431CSL6204
Generator. [Online]. Available:
http://www.marathonelectric.com/generators/docs/perf/431CSL6204T60.pdf.
[Accessed: 12-Apr-2016].
[12] A. A. Renjit, M. S. Illindala, and D. A. Klapp, “Graphical and Analytical Methods
for Stalling Analysis of Engine Generator Sets,” IEEE Trans. Ind. Appl., vol. 50,
no. 5, pp. 2967–2975, Sep. 2014.
[13] A. A. Renjit, M. S. Illindala, R. H. Lasseter, M. J. Erickson, and D. Klapp,
“Modeling and control of a natural gas generator set in the CERTS microgrid,” in
Energy Conversion Congress and Exposition (ECCE), 2013 IEEE, 2013, pp.
1640–1646.
[14] A. A. Renjit, M. S. Illindala, and D. A. Klapp, “Modeling and analysis of the
CERTS microgrid with natural gas powered distributed energy resources,” in
Industrial & Commercial Power Systems Technical Conference (I&CPS), 2015
IEEE/IAS 51st, 2015, pp. 1–8.
[15] M. J. Ryan and R. D. Lorenz, “A ‘power-mapping’ variable-speed control

80 Electrical and Computer Engineering THE OHIO STATE UNIVERSITY
technique for a constant-frequency conversion system powered by a IC engine and
PM generator,” in 2000 IEEE Industry Applications Society Annual Meeting, 2000,
vol. 4, pp. 2376–2382.
[16] M. Kimura, H. Koharagi, K. Imaie, S. Dodo, H. Arita, and K. Tsubouchi, “A
permanent magnet synchronous generator with variable speed input for co-
generation system,” in 2001 IEEE Power Engineering Society Winter Meeting.
Conference Proceedings, 2001, vol. 3, pp. 1419–1424.
[17] Hyunjae Yoo, Byung-Geuk Cho, Seung-Ki Sul, Sang-Min Kim, and Yongho Park,
“A power flow control strategy for optimal fuel efficiency of a variable speed
engine-generator based series hybrid electric vehicle,” in 2009 IEEE Energy
Conversion Congress and Exposition, 2009, pp. 443–450.
[18] A. R. Cooper, D. J. Morrow, and K. D. R. Chambers, “Development of a diesel
generating set model for large voltage and frequency transients,” in IEEE PES
General Meeting, 2010, pp. 1–7.
[19] G. Quionez-Varela and A. Cruden, “Development of a Small-Scale Generator Set
Model for Local Network Voltage and Frequency Stability Analysis,” IEEE Trans.
Energy Convers., vol. 22, no. 2, pp. 368–375, Jun. 2007.
[20] K. D. R. Chambers, D. J. McGowan, and D. J. Morrow, “A Digital Load Relief
Scheme for a Diesel Generating Set,” in 2007 IEEE Power Engineering Society
General Meeting, 2007, pp. 1–7.
[21] C. L. Haller, D. L. Harris, and R. T. Fink, “Modeling of Emergency Diesel
Generator and Governor Transient Response Using MATLAB/SIMULINK,” SAE

81 Electrical and Computer Engineering THE OHIO STATE UNIVERSITY
Technical Paper, 1995.
[22] A. Mondal, D. A. Klapp, M. S. Illindala, and J. H. Eto, “Modeling, analysis and
evaluation of smart load functionality in the CERTS Microgrid,” in Energy
Conversion Congress and Exposition (ECCE), 2014 IEEE, 2014, pp. 4628–4634.
[23] A. Mondal, M. S. Illindala, A. A. Renjit, and A. S. Khalsa, “Analysis of limiting
bounds for stalling of natural gas genset in the CERTS microgrid test bed,” in
Power Electronics, Drives and Energy Systems (PEDES), 2014 IEEE International
Conference on, 2014, pp. 1–5.
[24] L. M. Tolbert, W. A. Peterson, M. B. Scudiere, C. P. White, T. J. Theiss, J. B.
Andriulli, C. W. Ayers, G. Farquharson, G. W. Ott, and L. E. Seiber, “Electronic
power conversion system for an advanced mobile generator set,” in Industry
Applications Conference, 2001. Thirty-Sixth IAS Annual Meeting. Conference
Record of the 2001 IEEE, 2001, vol. 3, pp. 1763–1768.
[25] S.-H. Lee, J.-S. Yim, J.-H. Lee, and S.-K. Sul, “Design of speed control loop of a
variable speed diesel engine generator by electric governor,” in Industry
Applications Society Annual Meeting, 2008. IAS’08. IEEE, 2008, pp. 1–5.
[26] J. Leuchter, V. Ŕeřucha, Z. Krupka, and P. Bauer, “Dynamic behavior of mobile
generator set with variable speed and diesel engine,” in Power Electronics
Specialists Conference, 2007. PESC 2007. IEEE, 2007, pp. 2287–2293.
[27] R. Panora, J. E. Gehret, M. M. Furse, and R. H. Lasseter, “Real-World
Performance of a CERTS Microgrid in Manhattan,” IEEE Trans. Sustain. Energy,
vol. 5, no. 4, pp. 1356–1360, Oct. 2014.

82 Electrical and Computer Engineering THE OHIO STATE UNIVERSITY
[28] A. A. Renjit, “Modeling, Analysis and Control of Mixed Source Microgrid,” Ph.D.
Dissertation, Electrical and Computer Engineering, The Ohio State University,
Columbus, OH, 2015.
[29] P. C. Krause, O. Wasynczuk, and S. D. Sudhoff, Analysis of Electric Machinery
and Drive Systems. Wiley-IEEE Press, 2002.
[30] A. E. Fitzgerald, C. Kingsley, and S. D. Umans, Electric Machinery, 6th ed.
McGraw-Hill, New York, NY, 2003.
[31] “Datasheet of GM 8.1L Vortec Engine.” [Online]. Available:
http://www.rotatingright.com/pdf/8.1 Litre Brochure.pdf. [Accessed: 12-Apr-
2016].
[32] A. Mondal, M. Illindala, A. Khalsa, D. Klapp, and J. Eto, “Design and Operation
of Smart Loads to Prevent Stalling in a Microgrid,” IEEE Trans. Ind. Appl., vol.
52, no. 2, pp. 1–1, 2016.
[33] A. J. Wood and B. F. Wollenberg, Power generation, operation, and control. John
Wiley & Sons, New York, NY, 2012.
[34] A. D. Paquette, M. J. Reno, R. G. Harley, and D. M. Divan, “Sharing Transient
Loads : Causes of Unequal Transient Load Sharing in Islanded Microgrid
Operation,” IEEE Ind. Appl. Mag., vol. 20, no. 2, pp. 23–34, Mar. 2014.
[35] D. J. McGowan, D. J. Morrow, and M. McArdle, “A digital PID speed controller
for a diesel generating set,” in 2003 IEEE Power Engineering Society General
Meeting, 2003, vol. 3, pp. 1472–1477.