certification of appraisal -...
TRANSCRIPT

CERTIFICATION OF APPRAISAL
Each person signing below certifies to the best of their personal knowledge and belief:
1. The statements of fact contained in this report are true and correct.
2. The reported analyses, opinions, and conclusions are limited only by the reported
assumptions and limiting conditions, and are our personal, impartial, and unbiased
professional analyses, opinions, and conclusions.
3. We have no present or prospective interest in the property that is the subject of this report,
and no personal interest with respect to the parties involved.
4. We have no bias with respect to the property that is the subject of this report or to the parties
involved with this assignment.
5. The engagement for this assignment was not contingent upon developing or reporting
predetermined results.
6. Our compensation for completing this assignment is not contingent upon the development or
reporting of a predetermined value or direction in value that favors the cause of the client, the
amount of the value opinion, the attainment of a stipulated result, or the occurrence of a
subsequent event directly related to the intended use of this appraisal.
7. The reported analyses, opinions, and conclusions were developed, and this report has been
prepared, in conformity with the requirements of the Code of Professional Ethics & Standards
of Professional Appraisal Practice of the Appraisal Institute, which include the Uniform
Standards of Professional Appraisal Practice.
8. Adam Zimmerman has made a personal inspection of the property that is the subject of this
report.
9. No one has provided significant real property appraisal assistance to the person(s) signing
this report.
10. We have experience in appraising properties similar to the subject and are in compliance with
the Competency Rule of USPAP.
11. The appraiser(s) has not provided any appraisal related services at the subject property
during the previously 36 months.
12. The use of this report is subject to the requirements of the Appraisal Institute relating to review
by its duly authorized representatives.
13. As of the date of this report, Adam Zimmerman has completed the standards and ethics
requirements for candidates of designation of the Appraisal Institute.
14. The appraisal assignment was not based on a requested minimum value, a specific valuation,
or the approval of a loan.
HILCO REAL ESTATE APPRAISAL, LLC
Adam Zimmerman
Vice President
MS Certified General Appraiser #TG-3679

AERIAL PHOTO
EXECUTIVE SUMMARY Location: The site is located at 7276 Casino Strip Resort Blvd. in
Robinson, Tunica County County, MSA 38664.
Property Description: The subject property is considered a limited service hotel,
operating under the Days Inn brand. The property offers 66
guestrooms and was built in 1994. The subject site is comprised
of one, 1.50-acre parcel.
Assessor’s Parcel Number(s): 3104180000000100

Interest Appraised: Fee Simple, Going Concern
Date of Value(s): January 23, 2018
Date of Inspection: January 29, 2018
Ownership:
Jasveer S Brar
Highest and Best Use Opinion
If Vacant: Future Hotel or Commercial development
As Improved: Current use as a hotel
Site & Improvements
Zoning: None, Tunica County
Land Area: 1.50 acres – Assessor’s Parcel Map
Number of Stories: 2
Year Built: 1994
Type of Construction: Masonry: 2 story hotel
Gross Building Area: 35,720 SF
Number of Rooms: 66 rooms
Amenities: Breakfast room
Parking:
84 spaces
EXECUTIVE SUMMARY
EXTRAORDINARY ASSUMPTIONS & HYPOTHETICAL CONDITIONS
The value conclusion is subject to the general assumptions and limiting conditions and certifications. In
addition, the following extraordinary assumptions and hypothetical conditions, if any, are summarized
below, which might affect the assignment results. Any changes from these assumptions may affect market
value and we reserve the right to revise our analysis. Use of these extraordinary assumptions may have
affected the assignment results.
Extraordinary Assumptions
The square footages of the building area and other information such as parking count were obtained from
the Harris County Records and assumed accurate. We reserve the right to amend our value conclusion if
these assumptions are later proven incorrect.
It is our understanding that the subject is currently in violation of its franchise agreement and has been
removed from the Choice Hotel's web site. We also understand that the subject needs a PIP (Property
Improvement Plan) to remove it from non-performing status. We do not know the PIP amount, but estimate
it could exceed $500,000, given the subject's below brand standards. We recommend a review of any PIP
information provided by Choice Hotels.

We were not provided signicant financials. We estimated the subject's ADR and Occupancy by using
market based data such as an STR Trend report. We did present an Income Capitalization Analysis
(ERRM) as a general valuation tool, but projecting ADR, Occupancy, Rev Par and operating expenses
as well as selecting discount rates and cap rates without knowing any current or historical operating
income and expenses, any required capital expenditures, or understanding the franchise agreement is
highly speculative. We assume the subject is underperforming based on its market share, but we are
uncertain as to the amount of capital needed (without understanding financials, condition and spending
requirements) to stabilize the hotel. We were unable to complete a reliable penetration analysis. If full
recent financials become available, we reserve the right to modify our analysis.
We assume the property is and will continue to be managed by a competent management group, typically
provided for similar hotels.
We estimated (by allocation) the value of the FF&E. We do not know the current condition of the FF&E
(Case and soft goods) and have estimated depreciation based on similar aged hotel valuations we have
completed.
Hypothetical Conditions
None
TABLE OF CONTENTS
INDTRODUCTION ................................................................................................................. 1
REGIONAL ANALYSIS .......................................................................................................... 5
NEIGHBORHOOD ANALYSIS ............................................................................................... 8
SITE DESCRIPTION ........................................................................................................... 14
IMPROVEMENTS DESCRIPTION ...................................................................................... 16
REAL ESTATE TAXES ........................................................................................................ 21
ZONING ............................................................................................................................... 21
HOTEL MARKET ANALYSIS ............................................................................................... 22
HIGHEST AND BEST USE .................................................................................................. 31
VALUATION PROCESS ...................................................................................................... 33
INCOME CAPITALIZATION APPROACH............................................................................ 36
SALES COMPARISON APPROACH ................................................................................... 40
RECONCILIATION AND FINAL VALUE OPINION .............................................................. 46
ASSUMPTIONS AND LIMITING CONDITIONS .................................................................. 49
ADDENDA ITEMS


INTRODUCTION
Hilco Real Estate Appraisal, LLC Page 1
INDTRODUCTION Identification of Subject Property
Property Description: The subject property is a limited-service Days Inn hotel that opened in
1994 as a Knights Inn and was converted to a Days Inn in 2008. The
property features 66 rooms. The hotel offers complimentary hot
breakfast. Situated on a 1.50 acre site, the property is located in the
Tunica Resort Hotel Market.
Address: 7276 Casino Strip Resort Blvd., Robinson,
Tunica County County, MSA, 38664
Assessor’s Parcel No.: 3104180000000100
Description of Property Interest Appraised
Interest Appraised: Fee Simple, Going Concern Interest
Property Ownership and Three Years Sales History
Current Ownership:
Management/Franchise
Agreements:
Sale History:
The subject is currently owned by Jasveer S Brar
The subject is franchised under the Days Inn brand. We were not
provided a copy of the franchise agreement. The subject may be in
violation of the agreement.
There have been no other transactions that we are aware of in the last
three years. In addition, to the best of our knowledge, the property is not
currently on the market for sale.
Intended Use and Users of the Appraisal
This appraisal is to be used by the Client, Three River Planning & Development District, for mortgage
lending purposes. The intended user(s) is Three River Planning & Development District. All others
reading or relying on this appraisal report are considered unintended users of this appraisal. The
appraisal cannot be used for any other reason including appealing tax assessments, litigation, settling
an estate, etc. Should anyone other than the client read or rely on this report, no fiduciary obligation is
owed by the appraisers to that party. Any additional work will be billed at an hourly rate, for expert
witness testimony, preparation for testimony, and any other work deemed necessary.
INTRODUCTION
Hilco Real Estate Appraisal, LLC Page 2
Dates of Inspection and Valuation
The value conclusion reported herein is as of January 23, 2018, corresponding with the date of
inspection, January 29, 2018, by Adam Zimmerman.
Property Rights Appraised
Per our agreement for services, we are appraising the Fee Simple, Going Concern interest.
The following definition is from the Dictionary of Real Estate Appraisal, Sixth Edition (2015), published
by the Appraisal Institute.
Fee Simple Interest: Absolute ownership unencumbered by any other interest or estate, subject only to
the limitations imposed by the governmental powers of taxation, eminent domain, police power, and
escheat.
With respect to the subject property, the property rights valued include all items of personal property,
including furniture, fixtures, and equipment, and licenses and agreements required to operate the
property and related facilities. The “business assets” or business component is an integrated constituent
of value and includes “tangible and intangible resources that are employed by a business enterprise in
its operations.”
Scope of the Appraisal
The scope of an appraisal is defined as “the amount and type of information researched and the analysis
applied in an assignment” (USPAP). The scope of this assignment involves:
• Research and analysis sufficient to form a credible opinion of value,
• Presentation of our research, analysis and final opinions in a report format.
In fulfillment of our agreement for services and the professional requirements noted below, our appraised
value is based on a combination of primary and secondary data research. The depth of our research
and analysis is based on the significance of each issue to the appraisal. The results of our research
and analysis are described throughout the following report. In summary, during the course of this
assignment, we:
• Requested subject property information and reviewed the information that was made available
to us. Researched public source and vendor service based subject information. Conducted an
appraisal inspection of the subject property, made field notes and took photographs.
• Drove the subject’s local area to assess development trends, transportation patterns, quality and
condition of improvements, access to services, adverse influences, etc.
• Gathered published information on key economic, social, governmental and environmental
factors in the region and local area that influence the subject’s value.
• Researched the subject’s zoning designation and key development restrictions.
• Formed an opinion of the subject’s Highest and Best Use, and determined which approaches to
value were applicable and/or necessary.

INTRODUCTION
Hilco Real Estate Appraisal, LLC Page 3
• Investigated and selected the most relevant and reliable improved sales for use in the Sales
Comparison Approach.
• Investigated and selected the most relevant and reliable rent comparables, expense data and
investment rates for use in the Income Capitalization Approach.
• Considered the input gathered from our interviews of buyers, sellers, brokers, property
developers and public officials, as applicable in each approach. Concluded a final opinion of
value after reconciling the indications from the approaches employed.
Additionally, this appraisal assignment was prepared to conform to the applicable professional
requirements set forth under:
• The most recent edition of the Uniform Standards of Professional Appraisal Practice (USPAP).
• The current Code of Professional Ethics of the Appraisal Institute
• The Financial Institutions Reform, Recovery and Enforcement Act of 1989 (FIRREA), Title XI
Regulations.
• Three River Planning & Development District’s guidelines and required scope of work.
Definition of Market Value
The most probable price which a property should bring in a competitive and open market
under all conditions requisite to a fair sale, the buyer and seller, each acting prudently and
knowledgeably, and assuming the price is not affected by undue stimulus. Implicit in this
definition is the consummation of a sale as of a specified date and the passing of title from
seller to buyer under conditions whereby:
1. Buyer and seller are typically motivated;
2. Both parties are well informed or well advised, and acting in what they consider their own best
interest;
3. A reasonable time is allowed for exposure in the open market;
4. Payment is made in terms of cash in US dollars or in terms of financial arrangements
comparable thereto; and
5. The price represents the normal consideration for the property sold unaffected by special or
creative financing or sales concessions granted by anyone associated with the sale.1
Definitions of Other Key Terms
Definitions of key appraisal terms are included in the glossary in the addenda.
Significant Appraisal Assistance or Contribution
No other individuals have provided significant real property appraisal assistance to the persons signing
this report in the form of property inspection, research and general report preparation.
1 Source: OCC, 12 CFR Part 34, Subpart C-Appraisals, 34.42 Definitions (g)
INTRODUCTION
Hilco Real Estate Appraisal, LLC Page 4
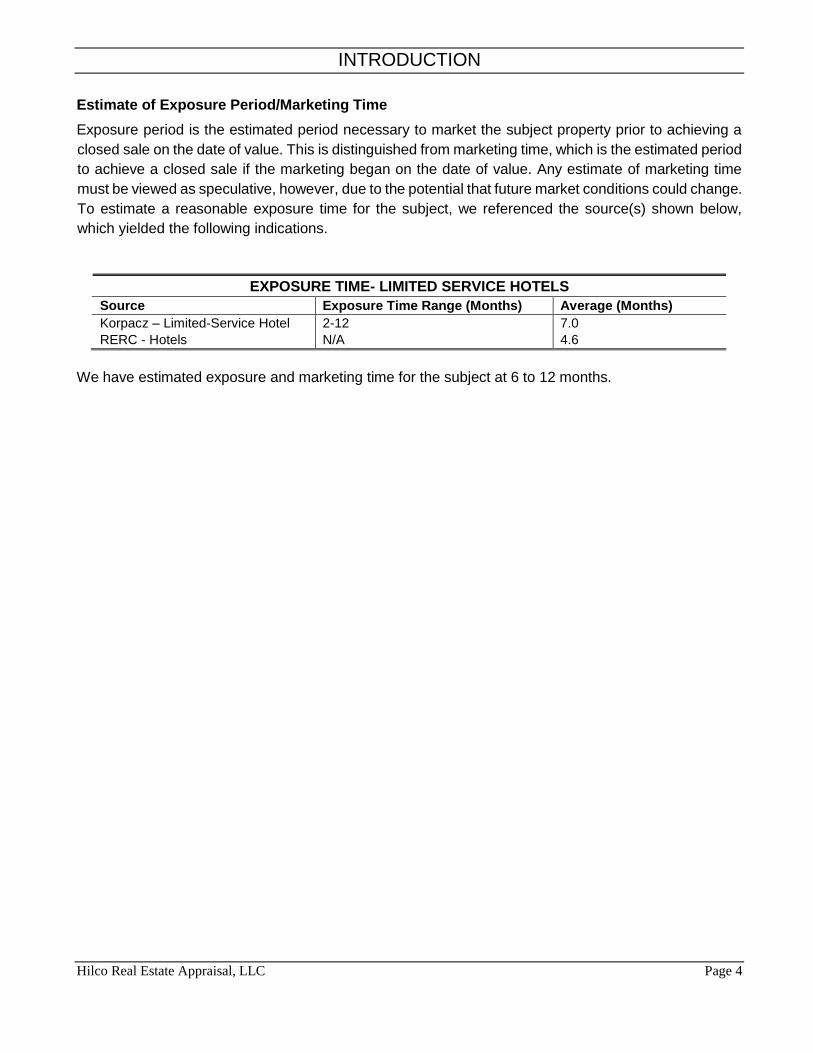
Estimate of Exposure Period/Marketing Time
Exposure period is the estimated period necessary to market the subject property prior to achieving a
closed sale on the date of value. This is distinguished from marketing time, which is the estimated period
to achieve a closed sale if the marketing began on the date of value. Any estimate of marketing time
must be viewed as speculative, however, due to the potential that future market conditions could change.
To estimate a reasonable exposure time for the subject, we referenced the source(s) shown below,
which yielded the following indications.
EXPOSURE TIME- LIMITED SERVICE HOTELS
Source Exposure Time Range (Months) Average (Months)
Korpacz – Limited-Service Hotel
RERC - Hotels 2-12 N/A
7.0 4.6
We have estimated exposure and marketing time for the subject at 6 to 12 months.

Hilco Real Estate Appraisal, LLC Page 5
REGIONAL ANALYSIS
The Memphis–Forrest City Combined Statistical Area, TN–MS–AR (CSA) is the commercial and cultural
hub of The Mid-South or Ark-Miss-Tenn. The census defined combined statistical area covers ten
counties in three states – Tennessee, Mississippi, and Arkansas. As of census 2010 the MSA had a
population of 1,324,108. The Forrest City Micropolitan area was added to the Memphis area in 2012 to
form the Memphis–Forrest City Combined Statistical area and had a population of 1,369,548 according
to census estimates. The greater Mid-South area as a whole has a population of 2.4 million according
to 2013 census estimates. This area is covered by Memphis local news channels and includes the
Missouri Bootheel, Northeast Arkansas, West Tennessee, and North Mississippi
RELATIVE EMPLOYMENT PERFORMANCE (JAN 2007=100)
REGIONAL ANALYSIS
Regional Map

MOODY’S ANALYTICS / Précis® U.S. Metro / December 2017
MOODY'S ANALYTICS / Book / Copyright © 2018, Moody's Analytics, Inc. All Rights Reserved.
UNITED STATES
14
EMPLOYMENT GROWTH RATE
2016-2018 2016-2021
1.4%
0.9%
GROSS DOMESTIC PRODUCT
2016-2018 2016-2021
2.6% 2.1% Source: Moody’s Analytics
STRENGTHS & WEAKNESSES ANALYSIS STRENGTHS
» Very productive workforce. » Labor market attracts skilled and unskilled
immigrants. » High innovation and entrepreneurship. » Mobile labor force, flexible labor system.
WEAKNESSES » Many labor market nonparticipants. » Large budget, current account deficits. » Skewed income and wealth
distribution. » Polarized and fractured
political system.
The sweeping changes to the tax code negoti- cause insurance premiums to increase, knocking ated by the Trump administration and Republi- 13 million off insurance rolls. Also, the expiracan Congress will significantly impact the near- tion of the individual tax cuts in 2025 results in a term economic outlook. The $1.5 trillion, 10-year higher tax liability for the two-thirds of taxpayers tax cut will juice-up growth through the remain- making less than $75,000 a year. der of this decade, but will result in meaningfully Individuals in high-tax states in the Northeast weaker growth at the start of the next decade. and California are also at risk of paying more Longer run, the cuts will add little to the econo- in taxes as the legislation scales back the demy but will add significantly to the government’s ductions for state and local income, sales, and deficits and debt load. property taxes. This is even more likely for home-
Winners and losers. Businesses are the owners in these areas who have large mortgages, biggest winners of the tax cuts. Larger C-corpo- since the legislation limits the mortgage interest rations are the beneficiaries of $650 billion in tax deduction to mortgage debt less than $750,000. cuts over the next decade, as their top marginal Overheating threat. The deficit-financed rate is permanently reduced from 35% to 21% tax cuts will act like fiscal stimulus, temporarily (see Chart 1). Cash-rich multinational firms en- pumping up growth. Based on simulations of the joy a much lower tax rate on earnings repatri- Moody’s Analytics macro model, the tax legislaated from overseas and the move from a global tion will lift real GDP growth by 0.4 percentage taxation system to a territorial one. Smaller S- point in 2018 and 0.2 percentage point in 2019. corporations and other pass-through entities Without tax cuts, the economy was set to grow will enjoy a lower marginal rate, giving them a by 2.5% per annum through the remainder of $250 billion tax break through 2025 when this the decade, but with the cuts, growth will be cut expires along with the rest of the tax cuts 2.9% per annum.
for individuals. The problem is that the economy is arguably High-income and wealthy households are also already operating beyond full employment.
The winners. Of the $1.1 trillion in tax cuts going to in- unemployment rate is just over 4%, well below dividuals over the next decade, more than three- most estimates of the full-employment unemquarters goes to taxpayers who make more than ployment rate, including the Moody’s Analytics $200,000 a year in taxable income. For context, estimate of 4.5% (see Chart 2). Even without this group accounts for just over one-twentieth tax cuts, unemployment was set to fall below of all taxpayers. Wealthy households also benefit 4%, but with them it could fall into the low-3% from a doubling of the estate tax exemption, and range. a rarefied group of private equity managers will Wage and price pressures have been largely continue to benefit from the special tax treat- dormant, but this will not last, and the Federal ment of carried interest. Reserve will have little choice but to normal-
Lower-income taxpayers struggling to hold on ize monetary policy more aggressively. Fed to their health insurance will likely be hurt. They policymakers are currently anticipating three benefit from the doubling of the standard deduc- 0.25-point rate hikes in 2018 and about the tion under the law. But the legislation ends the same in 2019, but four rate hikes each year now individual mandate for health insurance, which seems more likely.
the Congressional Budget Office concludes will (Continued next page)
CURRENT EMPLOYMENT TRENDS % CHANGE YR AGO, 3-MO MA
Nov 16 May 17 Nov 17 Total 1.7
1.5 1.4 Construction 3.2 2.6 2.8 Manufacturing -0.2 0.4 1.3 Trade 1.2 0.4 0.1 Trans/Utilities 1.8 1.6 1.7 Information 0.6 -1.3 -2.5 Financial Activities 2.1 2.1 1.8 Prof & Business Svcs. 2.8 3.2 2.7 Edu & Health Svcs. 2.6 2.3 2.0 Leisure & Hospitality 2.5 2.0 1.7 Other Services 1.5 1.1 1.3 Government 1.1 0.7 0.1
FORECAST RISKS
SHORT TERM LONG TERM UPSIDE
» Low energy prices and rising wages act as tailwinds for consumer spending.
» Long-term interest rates remain low for much longer, fueling housing’s recovery and spurring more business investment.
DOWNSIDE » Weak global demand and high dollar detract from
exports longer than expected. » Household formation remains subdued, hurting
the housing recovery.
MOODY’S
RATING Aaa
2011 2012 2013 2014 2015 2016 INDICATORS 2017 2018 2019 2020 2021 2022 15,021 15,355 15,612 16,013 16,472 16,716 Gross domestic product (C09$ bil) 17,098 17,585 17,966 18,145 18,588 19,059
1.6 2.2 1.7 2.6 2.9 1.5 % change 2.3 2.8 2.2 1.0 2.4 2.5
MOODY’S ANALYTICS / Précis® U.S. Metro / December 2017
MOODY'S ANALYTICS / Book / Copyright © 2018, Moody's Analytics, Inc. All Rights Reserved.
131.9 134.2 136.4 138.9 141.8 144.3 Total employment (mil) 146.5 148.5 149.7 149.8 150.7 152.3 1.2 1.7 1.6 1.9 2.1 1.8 % change 1.5 1.4 0.9 0.0 0.6 1.1 8.9 8.1 7.4 6.2 5.3 4.9 Unemployment rate (%) 4.3 3.8 3.8 4.6 5.0 4.9 6.2 5.0 1.1 5.3 5.0 2.4 Personal income growth (%) 3.1 4.5 4.9 4.1 3.8 3.9 311.7 314.0 316.2 318.6 320.9 323.1 Population (mil) 325.4 327.7 330.0 332.0 334.1 336.3 0.434 0.537 0.620 0.647 0.712 0.784 Single-family starts (mil) 0.855 1.103 1.336 1.343 1.397 1.430 0.178 0.247 0.308 0.355 0.395 0.393 Multifamily starts (mil) 0.372 0.386 0.392 0.357 0.397 0.458 1,428 2,051 1,844 1,267 1,677 1,894 Mortgage originations ($ bil) 1,608 1,489 1,429 1,320 1,470 1,625 1,363 1,181 1,039 910 820 771 Personal bankruptcies (ths) 771 766 785 869 1,015 1,185 0.1 0.1 0.1 0.0 0.1 0.3 91-day Treasury bill (%) 0.9 1.7 3.0 3.4 3.1 2.6 2.8 1.8 2.3 2.5 2.1 1.8 10-year Treasury bond (%) 2.3 3.3 4.2 4.3 4.1 4.2
22 / 38
PRÉCIS® U.S. METRO • United States
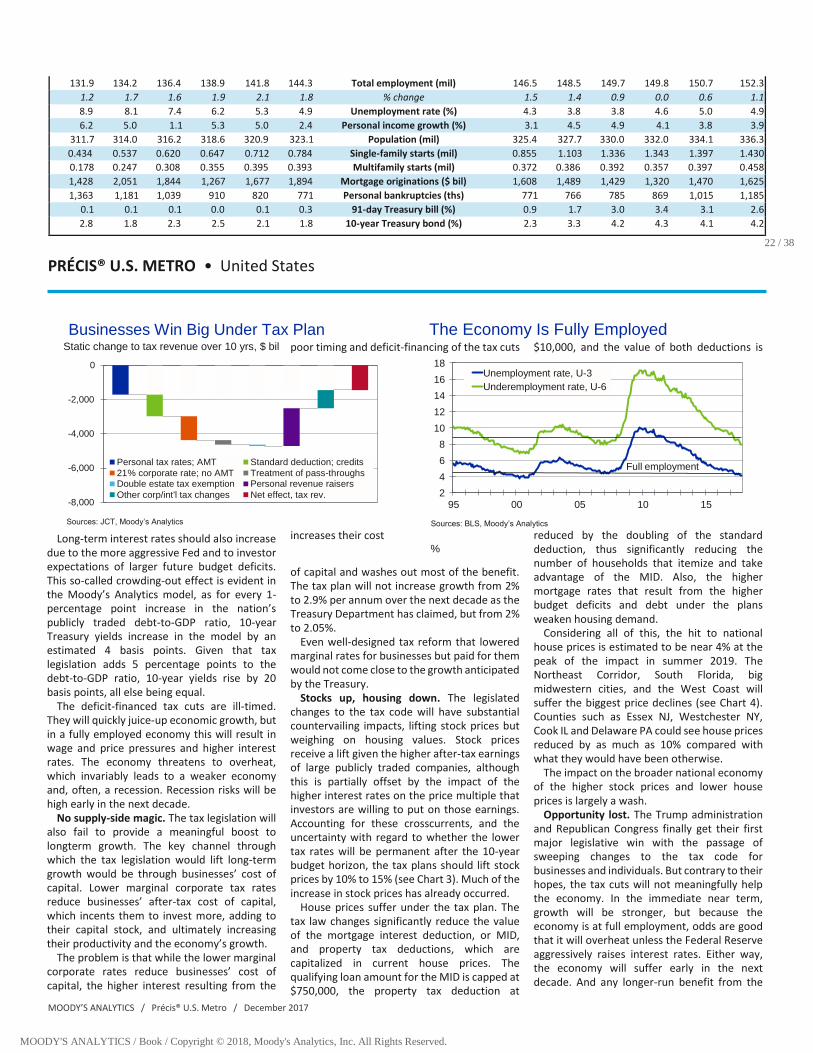
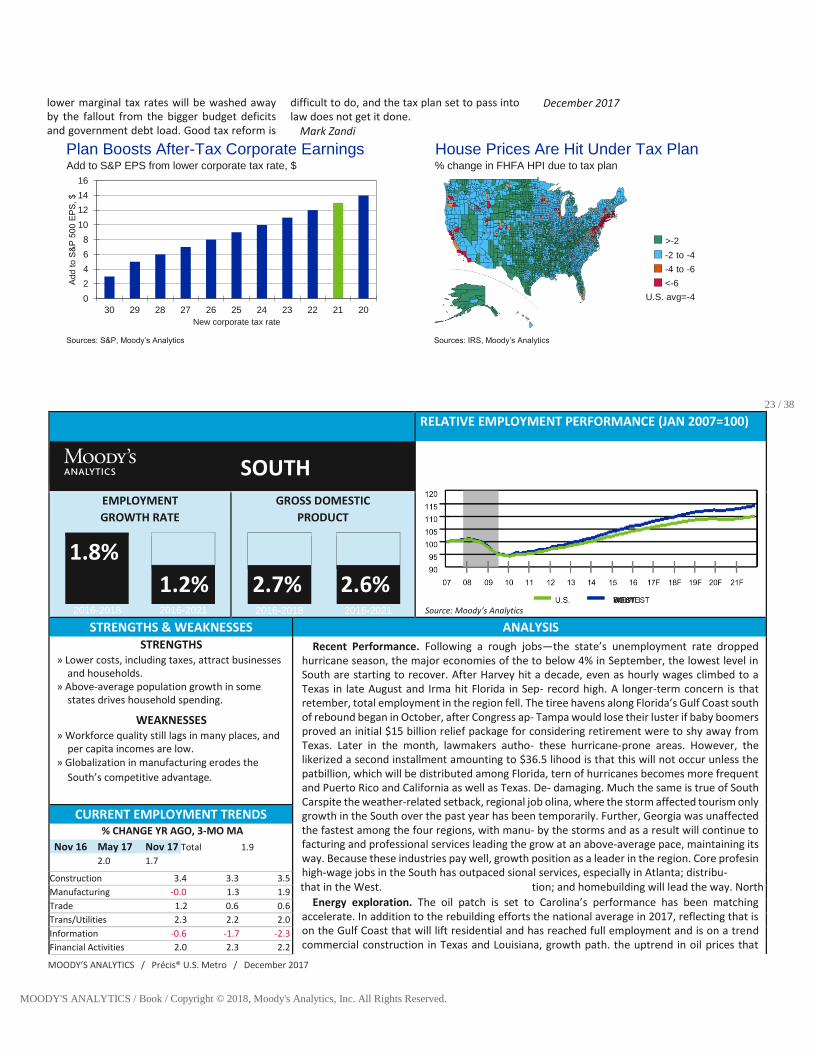
Businesses Win Big Under Tax Plan The Economy Is Fully Employed Static change to tax revenue over 10 yrs, $ bil
Long-term interest rates should also increase due to the more aggressive Fed and to investor expectations of larger future budget deficits. This so-called crowding-out effect is evident in the Moody’s Analytics model, as for every 1-percentage point increase in the nation’s publicly traded debt-to-GDP ratio, 10-year Treasury yields increase in the model by an estimated 4 basis points. Given that tax legislation adds 5 percentage points to the debt-to-GDP ratio, 10-year yields rise by 20 basis points, all else being equal.
The deficit-financed tax cuts are ill-timed. They will quickly juice-up economic growth, but in a fully employed economy this will result in wage and price pressures and higher interest rates. The economy threatens to overheat, which invariably leads to a weaker economy and, often, a recession. Recession risks will be high early in the next decade.
No supply-side magic. The tax legislation will also fail to provide a meaningful boost to longterm growth. The key channel through which the tax legislation would lift long-term growth would be through businesses’ cost of capital. Lower marginal corporate tax rates reduce businesses’ after-tax cost of capital, which incents them to invest more, adding to their capital stock, and ultimately increasing their productivity and the economy’s growth.
The problem is that while the lower marginal corporate rates reduce businesses’ cost of capital, the higher interest resulting from the
poor timing and deficit-financing of the tax cuts
increases their cost %
of capital and washes out most of the benefit. The tax plan will not increase growth from 2% to 2.9% per annum over the next decade as the Treasury Department has claimed, but from 2% to 2.05%.
Even well-designed tax reform that lowered marginal rates for businesses but paid for them would not come close to the growth anticipated by the Treasury.
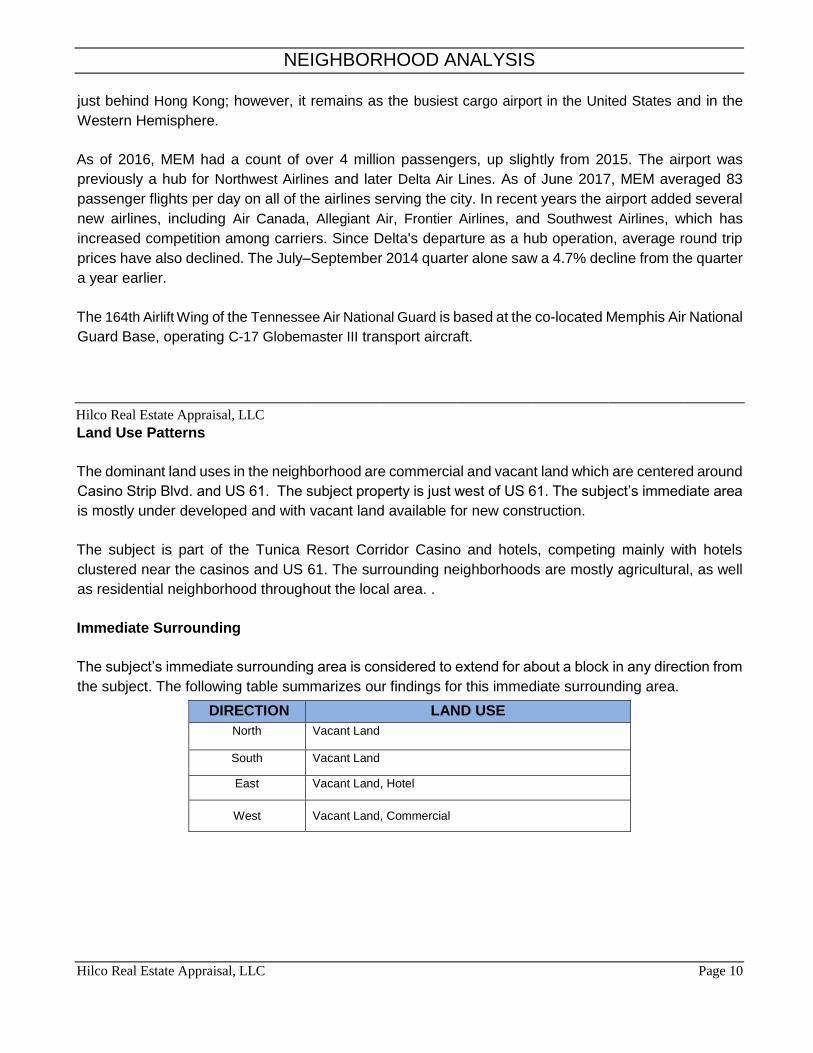
Stocks up, housing down. The legislated changes to the tax code will have substantial countervailing impacts, lifting stock prices but weighing on housing values. Stock prices receive a lift given the higher after-tax earnings of large publicly traded companies, although this is partially offset by the impact of the higher interest rates on the price multiple that investors are willing to put on those earnings. Accounting for these crosscurrents, and the uncertainty with regard to whether the lower tax rates will be permanent after the 10-year budget horizon, the tax plans should lift stock prices by 10% to 15% (see Chart 3). Much of the increase in stock prices has already occurred.
House prices suffer under the tax plan. The tax law changes significantly reduce the value of the mortgage interest deduction, or MID, and property tax deductions, which are capitalized in current house prices. The qualifying loan amount for the MID is capped at $750,000, the property tax deduction at
$10,000, and the value of both deductions is
reduced by the doubling of the standard deduction, thus significantly reducing the number of households that itemize and take advantage of the MID. Also, the higher mortgage rates that result from the higher budget deficits and debt under the plans weaken housing demand.
Considering all of this, the hit to national house prices is estimated to be near 4% at the peak of the impact in summer 2019. The Northeast Corridor, South Florida, big midwestern cities, and the West Coast will suffer the biggest price declines (see Chart 4). Counties such as Essex NJ, Westchester NY, Cook IL and Delaware PA could see house prices reduced by as much as 10% compared with what they would have been otherwise.
The impact on the broader national economy of the higher stock prices and lower house prices is largely a wash.
Opportunity lost. The Trump administration and Republican Congress finally get their first major legislative win with the passage of sweeping changes to the tax code for businesses and individuals. But contrary to their hopes, the tax cuts will not meaningfully help the economy. In the immediate near term, growth will be stronger, but because the economy is at full employment, odds are good that it will overheat unless the Federal Reserve aggressively raises interest rates. Either way, the economy will suffer early in the next decade. And any longer-run benefit from the
Sources: JCT, Moody’s Analytics
-8,000
-6,000
-4,000
-2,000
0
Personal tax rates; AMT Standard deduction; credits 21 % corporate rate; no AMT Treatment of pass-throughs Double estate tax exemption Personal revenue raisers Other corp/int'l tax changes Net effect, tax rev. 2
4 6 8
10 12 14 16 18
95 00 05 10 15
Unemployment rate, U-3 Underemployment rate, U-6
Sources: BLS, Moody’s Analytics
Full employment
MOODY’S ANALYTICS / Précis® U.S. Metro / December 2017
MOODY'S ANALYTICS / Book / Copyright © 2018, Moody's Analytics, Inc. All Rights Reserved.
lower marginal tax rates will be washed away by the fallout from the bigger budget deficits and government debt load. Good tax reform is
difficult to do, and the tax plan set to pass into law does not get it done.
Mark Zandi
December 2017
Plan Boosts After-Tax Corporate Earnings Add to S&P EPS from lower corporate tax rate, $
House Prices Are Hit Under Tax Plan % change in FHFA HPI due to tax plan
Sources: S&P, Moody’s Analytics Sources: IRS, Moody’s Analytics
23 / 38
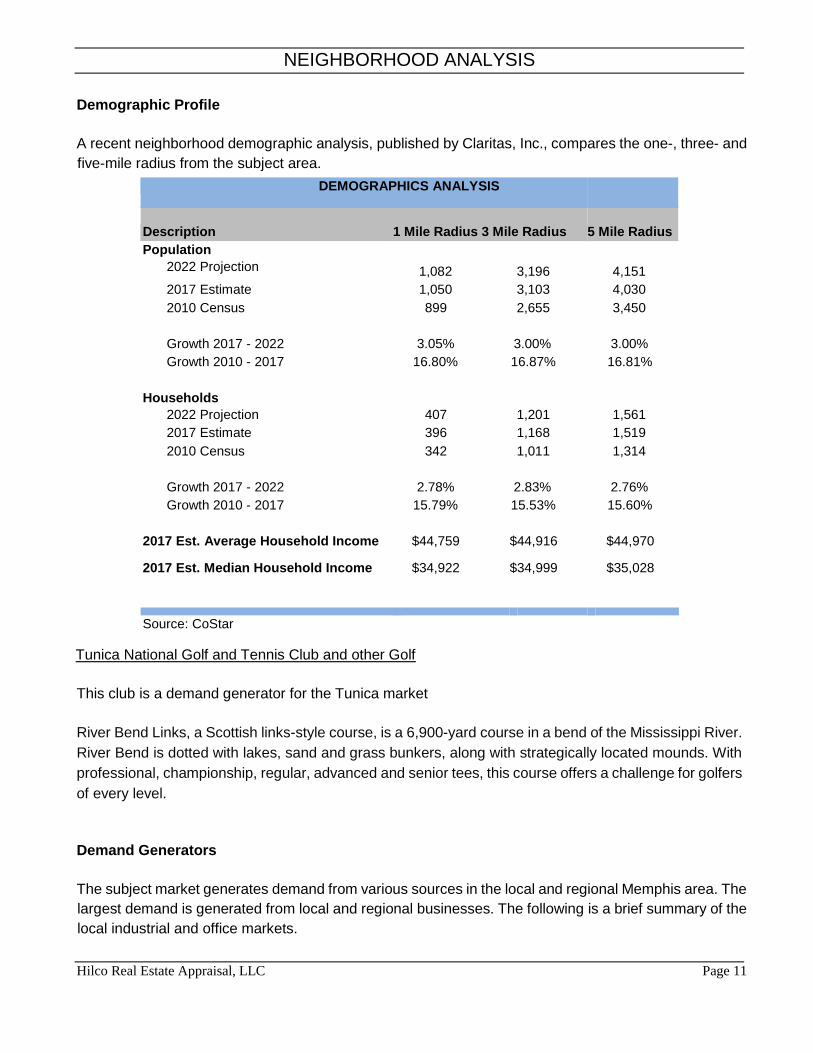
RELATIVE EMPLOYMENT PERFORMANCE (JAN 2007=100)
SOUTH
Source: Moody’s Analytics
EMPLOYMENT GROWTH RATE
2016-2018 2016-2021
1.8%
1.2%
GROSS DOMESTIC PRODUCT
2016-2018 2016-2021
2.7% 2.6%
STRENGTHS & WEAKNESSES ANALYSIS STRENGTHS
» Lower costs, including taxes, attract businesses and households.
» Above-average population growth in some states drives household spending.
WEAKNESSES » Workforce quality still lags in many places, and
per capita incomes are low. » Globalization in manufacturing erodes the
South’s competitive advantage.
Recent Performance. Following a rough jobs—the state’s unemployment rate dropped hurricane season, the major economies of the to below 4% in September, the lowest level in South are starting to recover. After Harvey hit a decade, even as hourly wages climbed to a Texas in late August and Irma hit Florida in Sep- record high. A longer-term concern is that retember, total employment in the region fell. The tiree havens along Florida’s Gulf Coast south of rebound began in October, after Congress ap- Tampa would lose their luster if baby boomers proved an initial $15 billion relief package for considering retirement were to shy away from Texas. Later in the month, lawmakers autho- these hurricane-prone areas. However, the likerized a second installment amounting to $36.5 lihood is that this will not occur unless the patbillion, which will be distributed among Florida, tern of hurricanes becomes more frequent and Puerto Rico and California as well as Texas. De- damaging. Much the same is true of South Carspite the weather-related setback, regional job olina, where the storm affected tourism only growth in the South over the past year has been temporarily. Further, Georgia was unaffected the fastest among the four regions, with manu- by the storms and as a result will continue to facturing and professional services leading the grow at an above-average pace, maintaining its way. Because these industries pay well, growth position as a leader in the region. Core profesin high-wage jobs in the South has outpaced sional services, especially in Atlanta; distribu-
that in the West. tion; and homebuilding will lead the way. North Energy exploration. The oil patch is set to Carolina’s performance has been matching
accelerate. In addition to the rebuilding efforts the national average in 2017, reflecting that is on the Gulf Coast that will lift residential and has reached full employment and is on a trend commercial construction in Texas and Louisiana, growth path. the uptrend in oil prices that
CURRENT EMPLOYMENT TRENDS % CHANGE YR AGO, 3-MO MA
Nov 16 May 17 Nov 17 Total 1.9
2.0 1.7
Construction 3.4 3.3 3.5 Manufacturing -0.0 1.3 1.9 Trade 1.2 0.6 0.6 Trans/Utilities 2.3 2.2 2.0 Information -0.6 -1.7 -2.3 Financial Activities 2.0 2.3 2.2
0 2 4 6 8
10 12 14 16
30 29 28 27 26 25 24 23 22 21 20 New corporate tax rate
>-2 -2 to -4 -4 to -6 <-6
U.S. avg=-4

MOODY’S ANALYTICS / Précis® U.S. Metro / December 2017
MOODY'S ANALYTICS / Book / Copyright © 2018, Moody's Analytics, Inc. All Rights Reserved.
Prof & Business Svcs. 2.4 3.1 2.7 began in August will Stimulus elsewhere in the South. In the reboost drilling throughout the subregion. Since gion’s midsection, Tennessee has been slowing reaching a trough in the middle of August, West but should get a temporary boost as demand Texas Intermediate has risen by about $15 per rises to replace motor vehicles destroyed by hurbarrel to $57, the highest level since early 2015. ricane flooding. Kentucky and Alabama, whose Internal political struggles in Saudi Arabia, rising performance has been steadier, will similarly tension between that nation and Iran, and pos- benefit. In Virginia, the likelihood of increased sible new U.S. sanctions on Iran together imply federal defense spending should lift militarythat prices will not quickly fall back. Active drill related industries in Northern Virginia and rigs have begun to rise in the fourth quarter in Virginia Beach. Texas, Louisiana and Oklahoma following a Having weathered the hurricanes, the three-month downtrend. South should remain the near-term regional
Southeast growth is steady. Because Ir- leader as the oil patch rebounds. Texas will ma’s impact on the Southeast was less damag- vie with the Southeast for the regional lead. ing than Harvey’s on Texas, steady growth there Longer term, the South will derive support should continue. After dipping in August prior from demographics, the energy industry, to the storm, the labor force in Florida actu- and low business costs. ally rebounded later in September. These ad- Ed Friedman ditional
workers had no trouble finding decent December 2017
Edu & Health Svcs. 2.9 2.7 2.2 Leisure & Hospitality 3.0 2.1 1.6 Other Services 1.9 1.8 2.5 Government 1.3 0.8 0.8
FORECAST RISKS
SHORT TERM LONG TERM UPSIDE
» Stronger than expected rebound in the oil patch lifts entire region.
» Low costs enable some reshoring of manufacturing.
DOWNSIDE » In-migration to the Southeast rebounds less
than anticipated. » Decline in U.S. vehicle sales slows growth in the
Mid-South auto-producing states.
COST OF
DOING BUSINESS 97%
2011 2012 2013 2014 2015 2016 INDICATORS 2017 2018 2019 2020 2021 2022 4,600.3 4,703.7 4,812.9 4,929.8 5,080.1 5,128.9 Gross regional product (C09$ bil) 5,250.6 5,422.1 5,581.6 5,672.2 5,863.6 6,061.6
44,016 44,844 45,705 46,745 47,830 48,714 Total employment (ths) 49,597 50,448 51,048 51,236 51,722 52,461 1.4 1.9 1.9 2.3 2.3 1.8 % change 1.8 1.7 1.2 0.4 0.9 1.4 8.7 7.7 6.9 5.9 5.2 5.0 Unemployment rate (%) 4.4 3.7 3.8 4.5 4.9 4.9 6.6 5.0 1.0 6.1 4.8 1.8 Personal income growth (%) 3.5 5.1 5.4 4.6 4.9 5.0 108,690 109,857 110,919 112,135 113,430 114,670 Population (ths) 116,044 117,500 118,973 120,419 121,841 123,309 594.0 654.6 588.8 713.0 818.3 778.8 Net migration (ths) 951.0 1,040.8 1,066.7 1,050.1 1,037.7 1,096.1 216,101 263,641 315,269 328,063 362,601 389,925 Single-family permits (#) 419,333 497,173 600,604 628,810 656,505 665,990 83,519 141,025 152,063 165,732 182,944 177,061 Multifamily permits (#) 161,862 131,441 137,025 136,360 165,732 189,804 267 266 275 289 306 326 House price (1980Q1=100) 347 362 368 372 379 388 372 522 503 367 470 525 Mortgage originations ($ mil) 466 443 430 396 433 475 4,753.0 5,438.8 5,787.9 6,163.4 6,475.1 6,530.1 New vehicle registrations (ths) 6,070.1 6,315.5 6,251.7 6,046.0 6,149.8 6,570.7 455,228 406,310 370,059 340,879 310,963 294,152 Personal bankruptcies (#) 289,257 282,700 288,351 307,962 361,590 436,014
20 / 38

Hilco Real Estate Appraisal, LLC Page 6
REGIONAL ANALYSIS
As additional supporting documentation for the previously presented information, the following items are
retained in our files: 1.) a User’s Guide related to the previously presented statistical and economic
information; 2.) a Five-Year Forecasted Employment Growth Rankings for all MSAs within the U.S.; 3.)
the Forecast Assumptions related to projections presented on the preceding pages; 4.) Employment
Growth Rankings for all MSAs within the U.S.; 5.) Population Growth Rankings for all MSAs within the
U.S.; 6.) Absolute Change in Employment & Population projections for all MSAs within the U.S.; 7.) Risk-
Adjusted Return for each MSA within the U.S.
Key Comparisons and Projections
The following information is taken from the previously presented economic and statistical data provided
by Economy.com as of December 2017. Robinsonville,, MS is in Tunica County, MS which is part of
the Memphis MSA as determined by Economy.com.
UNITED STATES SOUTH
Total Employment
146,400,000 49,600,000
Employment Change %
1.5 1.8
Unemployment Rate %
4.4 4.6
Personal Income Growth
3.8 4.0
Strengths
• Very productive workforce. • Lower costs, including taxes,
attract businesses and
households.
• Labor market attracts skilled and unskilled immigrants.
• High innovation
and entrepreneurship. • Mobile labor force, flexible
labor system.
•
Above-average population
growth in some states drives
related household spending.
Weaknesses
• Many labor market
nonparticipants. • Workforce quality still lags in
many places, and per capita
incomes are low.

Page 7
• Large budget,
current account deficits.
• Skewed income and wealth
distribution. • Polarized and fractured
political system
•
Globalization in manufacturing
erodes the South’s competitive
advantage.
REGIONAL ANALYSIS
National Outlook
“Regardless of what is happening around the globe—and a lot seems to be happening—the U.S.
economy continues to plug away. The U.S. economic expansion is eight years old and counting, and
growth remains remarkably stable.
Real GDP growth ebbs and flows on a quarterly basis, but that seems mostly due to the Bureau of
Economic Analysis’ problems measuring GDP. Abstracting from the quarterly ups and downs, it has
been growing at a 2% annualized pace since the expansion began, and that is what it likely grew during
the first half of this year.
Job growth has been equally unwavering. There have been months with soft employment gains and
others with strong gains, but this too can be chalked up mostly to measurement issues and transitory
events, like weather. Looking through monthly noise, job additions have averaged just under 200,000
per month since job gains resumed—about the size of gains enjoyed so far this year.
A boring economy is exactly what global investors hope for, and one reason they have been bidding up
asset prices. Stock prices are at record highs, credit spreads in the bond market are narrow, and
capitalization rates in real estate markets are low. There are other reasons for the investor euphoria—
easy global monetary policy quickly comes to mind—but investors are feasting on businesses’ steadyas-
she-goes revenue growth, costs, and profitability. A better global economy and more stable dollar mean
that the U.S. trade deficit, which had been a significant drag on U.S. growth, is leveling off and soon may
even improve a bit. It is a pleasant surprise how quickly the weight on the U.S. economy from global
trade has lifted.
The economy continues to expand at a pace above its potential, and any remaining unused labor and
other capacity is quickly being put to use. But this bears close watching, the outlook for inflation and
interest rates are particularly difficult to get right.” (Precis: Metro December 2017 Moody's Analytics
Economy.com)
South Region Outlook
“The South will be the near-term regional leader as the oil patch rebounds. Texas will vie with the
Southeast for the lead within the region. Longer term, the South will derive support from demographics,
the energy industry, and low business costs.” (Precis: Metro December 2017 Moody's Analytics
Economy.com)

NEIGHBORHOOD ANALYSIS
Hilco Real Estate Appraisal, LLC Page 8
Hilco Real Estate Appraisal, LLC
NEIGHBORHOOD ANALYSIS
Location
Casino gambling's effect on the local economy has spurred population growth in unincorporated parts
of the county outside Tunica proper. Since 1990, the town's name has been popularly associated with
several casinos located near the Mississippi River. However, the current group of casinos is located
from the community of Tunica Resorts, 10 miles north of the town of Tunica, and extending to the DeSoto
County line.
Neighborhood Map

Page 9
Tunica Resorts was originally named "Robinsonville", but the name was changed in 2005 to eliminate
confusion over the location of the casinos, which have always used the name "Tunica" as an identifier.
The success of these gaming houses in northern Tunica County came at the expense of the area's first
group of casinos in the early 1990s, located just northwest of Tunica proper, in an area known as Mhoon
Landing. This now comprises the current census-designated place of North Tunica. These casinos were
closed or moved as larger resorts opened closer to Memphis to attract its larger residential base.
Unlike the area including casinos along Mississippi's Gulf Coast region, Tunica was not in the path of
Hurricane Katrina. As a result, some of the regular Gulf Coast customer traffic from casinos drifted
northward to Tunica County while repairs and reconstruction were underway in the Gulf Coast locations.
Though the casinos lie outside the town limits, the benefits of tax revenue generated have also aided
the town. Major improvements to the public school system and downtown district are among the most
NEIGHBORHOOD ANALYSIS
visible aspects. Long-term effects include major highway improvements on U.S. Route 61 and a
muchdiscussed potential expansion of Tunica Municipal Airport.
Transportation/Access/Visibility
According to the U.S. Census Bureau, the county has a total area of 481 square miles, of which 455
square miles is land and 26 square miles is water.
Major highways
Interstate 69
U.S. Route 61
Mississippi Highway 3
Mississippi Highway 4
Airports
Memphis International Airport is a civil-military airport seven miles southeast of downtown Memphis in
Shelby County, Tennessee, United States.
Memphis International Airport is home to the FedEx Express global hub, which processes many of the
company's packages. Nonstop FedEx destinations from Memphis include cities across the continental
United States, Canada, Europe, the Middle East, Asia, and South America. From 1993 to 2009, Memphis
had the largest cargo operations of any airport worldwide. MEM dropped to the second position in 2010,
NEIGHBORHOOD ANALYSIS
Hilco Real Estate Appraisal, LLC Page 10
just behind Hong Kong; however, it remains as the busiest cargo airport in the United States and in the
Western Hemisphere.
As of 2016, MEM had a count of over 4 million passengers, up slightly from 2015. The airport was
previously a hub for Northwest Airlines and later Delta Air Lines. As of June 2017, MEM averaged 83
passenger flights per day on all of the airlines serving the city. In recent years the airport added several
new airlines, including Air Canada, Allegiant Air, Frontier Airlines, and Southwest Airlines, which has
increased competition among carriers. Since Delta's departure as a hub operation, average round trip
prices have also declined. The July–September 2014 quarter alone saw a 4.7% decline from the quarter
a year earlier.
The 164th Airlift Wing of the Tennessee Air National Guard is based at the co-located Memphis Air National
Guard Base, operating C-17 Globemaster III transport aircraft.
Hilco Real Estate Appraisal, LLC
Land Use Patterns
The dominant land uses in the neighborhood are commercial and vacant land which are centered around
Casino Strip Blvd. and US 61. The subject property is just west of US 61. The subject’s immediate area
is mostly under developed and with vacant land available for new construction.
The subject is part of the Tunica Resort Corridor Casino and hotels, competing mainly with hotels
clustered near the casinos and US 61. The surrounding neighborhoods are mostly agricultural, as well
as residential neighborhood throughout the local area. .
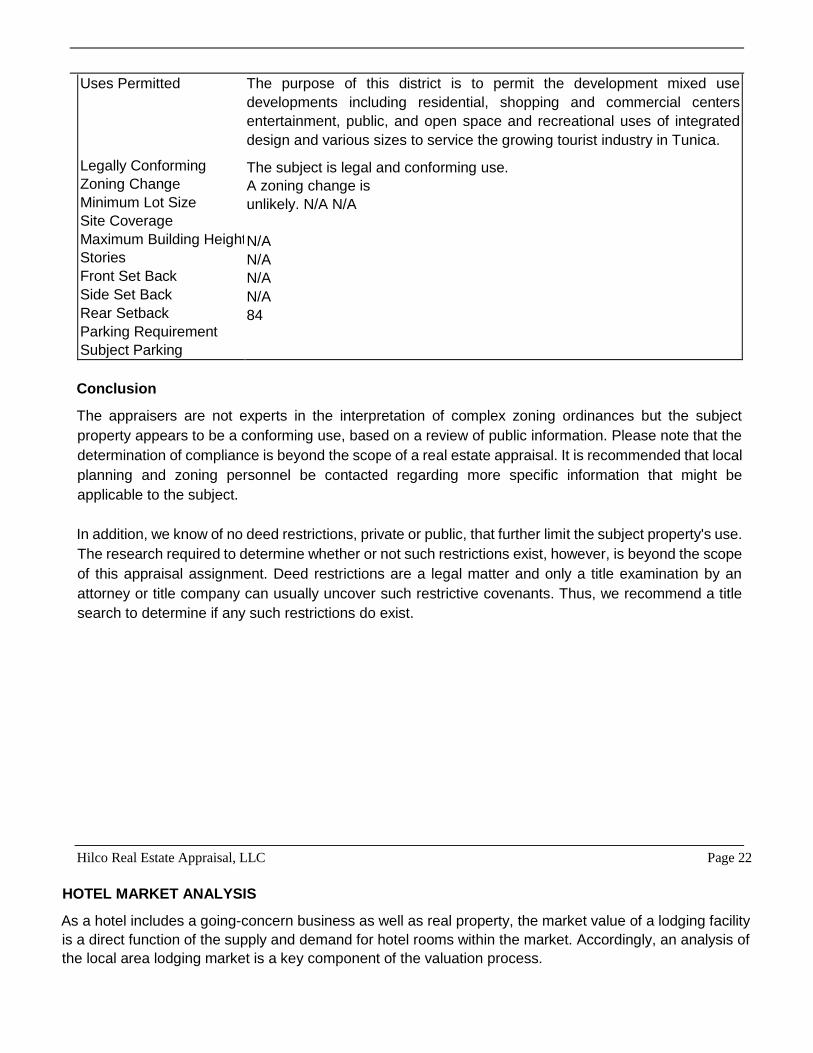
Immediate Surrounding
The subject’s immediate surrounding area is considered to extend for about a block in any direction from
the subject. The following table summarizes our findings for this immediate surrounding area.
DIRECTION LAND USE
North Vacant Land
South Vacant Land
East Vacant Land, Hotel
West Vacant Land, Commercial
NEIGHBORHOOD ANALYSIS
Hilco Real Estate Appraisal, LLC Page 11
Demographic Profile
A recent neighborhood demographic analysis, published by Claritas, Inc., compares the one-, three- and
five-mile radius from the subject area.
DEMOGRAPHICS ANALYSIS
Description 1 Mile Radius 3 Mile Radius 5 Mile Radius
Population 2022 Projection 1,082 3,196 4,151
2017 Estimate 1,050 3,103 4,030
2010 Census 899 2,655 3,450
Growth 2017 - 2022 3.05% 3.00% 3.00%
Growth 2010 - 2017 16.80% 16.87% 16.81%
Households 2022 Projection 407 1,201 1,561
2017 Estimate 396 1,168 1,519
2010 Census 342 1,011 1,314
Growth 2017 - 2022 2.78% 2.83% 2.76%
Growth 2010 - 2017 15.79% 15.53% 15.60%
2017 Est. Average Household Income $44,759 $44,916 $44,970
2017 Est. Median Household Income $34,922 $34,999 $35,028
Source: CoStar
Tunica National Golf and Tennis Club and other Golf
This club is a demand generator for the Tunica market
River Bend Links, a Scottish links-style course, is a 6,900-yard course in a bend of the Mississippi River.
River Bend is dotted with lakes, sand and grass bunkers, along with strategically located mounds. With
professional, championship, regular, advanced and senior tees, this course offers a challenge for golfers
of every level.
Demand Generators
The subject market generates demand from various sources in the local and regional Memphis area. The
largest demand is generated from local and regional businesses. The following is a brief summary of the
local industrial and office markets.

NEIGHBORHOOD ANALYSIS
Hilco Real Estate Appraisal, LLC Page 12
Office Market Overview
The Memphis Office market ended the fourth quarter 2017 with a vacancy rate of 12.2%. The vacancy
rate was up over the previous quarter, with net absorption totaling a positive 316,197 square feet in the
fourth quarter. Rental rates ended the four quarter at $17.45, a decrease over the previous quarter. A
total of 888,375 square feet delivered to the market, with 531,559 square feet still under construction at
the end of the quarter.
Total Office Submarket Statistics Year-End 2017
Market
Existing Inventory Vacancy YTD Net
Absorption YTD
Deliveries Under
Const SF Quoted
Rates
# Blds Total RBA Direct SF Total SF Vac % 385 Corridor 349 7,630,530 719,932 745,177 9.8% 53,897 122,112 9,400 $18.30 Airport 262 6,681,143 1,408,237 1,408,237 21.1% 55,192 0 0 $13.77 DeSoto County 356 2,122,219 130,394 137,594 6.5% (36,150) 800 0 $15.89 Downtown 277 10,680,656 1,708,982 1,714,753 16.1% (76,556) 45,000 328,000 $17.15 East 551 13,760,854 1,307,413 1,339,584 9.7% 5,389 163,805 159,909 $20.77 Fayette County 55 408,675 15,317 15,317 3.7% (7,017) 0 0 $14.07 Marshall County 20 209,212 1,038 1,038 0.5% (1,038) 0 0 $0.00 Midtown 408 4,555,617 369,761 369,761 8.1% 461,595 552,258 0 $15.35 North 247 2,160,947 174,657 174,657 8.1% (67,816) 0 0 $15.74 Northeast 291 4,425,695 513,547 514,797 11.6% (73,047) 0 34,250 $16.95 Tate County 42 154,135 7,250 7,250 4.7% (5,950) 0 0 $12.37 Tipton County 45 191,710 21,963 21,963 11.5% 7,698 4,400 0 $8.25 Tunica County 20 74,219 0 0 0.0% 0 0 0 $0.00 Totals 2,923 53,055,612 6,378,491 6,450,128 12.2% 316,197 888,375 531,559 $17.45 Source: CoStar Property®
The subject’s submarket, highlighted in yellow, is the smallest market in Memphis with limited data.
Other Regional Demand Generators
In addition to commercial corporate demand, the subject market wide generates a significant demand
from meeting and group business, and leisure travelers. The meeting and group demand is generated
by corporate businesses in addition to sports, teams, weddings, reunions, and religious meetings. The
subject is located less than 30 miles from the Memphis International Airport. The following are a few
highlights of the local attractions/facilities in this market.
Blues Hall of Fame Museum
Opened in May of 2015, the Blues Hall of Fame Museum is a Memphis gem for both serious blues fans
and casual visitors. With robust exhibits and in-depth history, the museum exposes, educates, and
entertains visitors with all that is blues culture while highlighting our over 400 inductees in five key
categories: Performer, Individual, Album, Single, and Literature.
National Civil Rights Museum
The National Civil Rights Museum is a complex of museums and historic buildings in Memphis,
Tennessee; its exhibits trace the history of the Civil Rights Movement in the United States from the 17th

NEIGHBORHOOD ANALYSIS
Hilco Real Estate Appraisal, LLC Page 13
century to the present. The museum is built around the former Lorraine Motel, where Rev. Martin Luther
King, Jr. was assassinated on April 4, 1968. Two other buildings and their adjacent property, also
connected with the King assassination, have been acquired as part of the museum complex.
The museum re-opened in 2014 after renovations that increased the number of multi-media and
interactive exhibits, including numerous short movies to enhance features. The museum is owned and
operated by the Lorraine Civil Rights Museum Foundation, based in Memphis. The Lorraine Motel is
owned by the Tennessee State Museum and leased long term to the Foundation to operate as part of the
museum complex.
COLLEGES & UNIVERSITIES
Colleges and universities located in the city include the University of Memphis, including University of
Memphis Cecil C. Humphreys School of Law, Rhodes College, Christian Brothers University, Memphis
College of Art, LeMoyne–Owen College, Baptist College of Health Sciences, Memphis Theological
Seminary, Harding School of Theology, Embry–Riddle Aeronautical University, Worldwide (Memphis
Campus), Reformed Theological Seminary (satellite campus), William R. Moore College of Technology,
Southern College of Optometry, Southwest Tennessee Community College, Tennessee Technology
Center at Memphis, Visible Music College, Mid-America Baptist Theological Seminary, and the University
of Tennessee Health Science Center. Memphis also has campuses of several forprofit post-secondary
institutions, including Concorde Career College, ITT Technical Institute, Remington College, Vatterott
College, and University of PhoenixHealth Care.
Conclusion
The subject property is located within the Tunica Resort and is part of the Casino hotel corridor. Regional
and local access is good. The subject property is compatible to the adjacent uses. The regional has
been affected by the most recent hurricane and new Casinos entering the outside of the immediate
market. Revenues appear to be declining.

Hilco Real Estate Appraisal, LLC Page 14
SITE DESCRIPTION
SITE DESCRIPTION
The subject site is comprised of one rectaangular-shaped interior shaped parcel, located along the south
side of Casino Strip Resort Blvd. in Robinsonville, MS.
TAX MAP
Shape: Irregular
Topography: The subject is generally level at curb grade.
Land Area: The hotel site sits on 1.50 acres, or 65,340 square foot. The land area is based on the
assessor’s parcel map. It is noted that we relied on this information
and assume that it is accurate. We reserve the right to amend the
land area should this assumption be determined to be incorrect.
Zoning: None
Frontage, Access, Visibility: The subject site is comprised of one rectaangular-shaped interior shaped
parcel, located along the south side of Casino Strip Resort Blvd. in
Robinsonville, MS. The access and visibility is considered

Hilco Real Estate Appraisal, LLC Page 15
average, with access provided by curb cuts on Casinoa Strip Road
and Commercial Road.
SITE DESCRIPTION
Soil Conditions: For the purposes of our analysis, we have assumed that no soil
conditions exist. We are not qualified to render a technical opinion
regarding soil conditions. Therefore, it is assumed that the load-
bearing capacity is sufficient to support any reasonably probable
improvements.
Utilities All necessary and typical public utilities are assumed to be installed
to the subject sites.
Land Use Restrictions: The appraisers were not provided with a title report. The
appraisers have assumed that no easements or encroachments
affecting value have been created in the intervening years. In the
performance of the appraisal, the appraisers were not made aware
of any other easements or encroachments that would have an
adverse effect on the subject site, other than typical utility
easements. However, it is suggested that a legal opinion be
obtained to ensure that no adverse easements or encroachments
exist.
Drainage: Drainage is via flow gutters. During our inspection of the site, we
observed no drainage problems and assume that none exist.
Flood Hazard: The subject is located in an X flood zone which is outside the 500
year floodplain boundaries as noted by the map panel # 280236
0085 D dated August 16, 2008.
Hazardous Substances: There were no hazardous substances observed or discovered
during our routine appraisal investigation. The subject was
appraised as if no hazardous substances are present. However,
we are not trained to perform technical environmental inspections.
If the client is concerned about this issue, we recommend the
services of a professional engineer for this purpose.
Overall Functionality:
The subject site has a typical shape, size and utility for the local
area. No significant issues that would currently limit the utility of
the site were discovered. The subject site is appraised “As-Is”, fully
functional for its highest and best use.

IMPROVEMENTS DESCRIPTION
Hilco Real Estate Appraisal, LLC Page 16
IMPROVEMENTS DESCRIPTION
The subject property is a limited-service Days Inn hotel that opened in 1994 as a Knights Inn and was
converted to a Days Inn in 2008. The property features 66 rooms. The hotel offers complimentary hot
breakfast. Situated on a 1.50 acre site, the property is located in the Tunica Resort Hotel Market.
The following is a description of the subject’s improvements and basic construction features based on
our inspection.
Infrastructure and Site Improvements
The hotel is a 2-story, interior corridor, limited-service hotel. The guestrooms are located on floors 1
through 2. The lobby is located at the front building, along with the breakfast seating. Parking surrounds
the buildings to the south, east and west.
Number of Rooms Guestroom Configuration
66 Rooms
66 Total
Seating Capacity Food & Beverage Facilities C omments
20 Breakfast Area
Indoor Meeting & Banquet Facilities Square Footage C omments
Total 0
Amenities & Services
Complimentary Breakfast
FACILITIES SUMMARY
( Estimated )

IMPROVEMENTS DESCRIPTION
Hilco Real Estate Appraisal, LLC Page 17
The following table summarizes the general construction characteristics of the improvements. We have
estimated certain items below including construction materials, based on our knowledge of other
prototypical construction.
BUILDING SUMMARY - GENERAL CONSTRUCTION
Property Type Limited-Service
Guest Room Corridors Interior Corridor
Foundation Concrete slab, with cast-in-place perimeter and interior colums
and grade beams
Structure/Exterior Walls Masonry + Frame
Roof Pitched Shingles Composite Membrane Cover
Electrical Assumed to comply with City building codes Plumbing Assumed to
comply with City building codes
Windows Anodized aluminum with fixed insulated glazing. Single Pane
Exterior Doors Metal.
Elevators One
Life Safety Systems Fire Sprinklers and smoke detectors
Ceilings Textured and/or painted gypsum board or suspended
acoustical tile.
Floors Common areas have a combination of ceramic tile and carpet
flooring. Guestrooms are assumed to have commercial grade
carpet and ceramic tiles.
Interior walls Walls are generally textured and painted drywall or vinyl wall
covering on gypsum board
HVAC Roof-mounted Individual systems
Parking 84 parking spaces
Actual Age 24 years Effective Age 20 years
Total Economic Life 50 years Remaining
Economic Life 30 years
Overall Condition Average
Source: Property management; Hilco Real Estate Appraisal, LLC
The hotel's exterior was in average condition upon inspection, and no major problems were observed.

IMPROVEMENTS DESCRIPTION
Hilco Real Estate Appraisal, LLC Page 18
Lobby Area
The lobby is located at the entrance of the hotel, through two double glass doors, one automatic. The
front desk immediately greets the guests to the left, and there are seats for waiting. The lobby appeared
in average condition
Restaurant/Lounge/Breakfast Buffet Areas
The hotel offers a free hot breakfast buffet. This area is sit up to about 15 guests. There is a small
kitchenette at the back with a cooler.
Guestrooms
The hotel features queen/queen or king guestroom
configurations, about 350 square foot of living area. The
rooms offer typical amenities for this product type, including a mini refrigerator, and microwave (first floor
rooms only). There are 2 handicap rooms available in both King configurations.
We inspected three guestrooms. The guestroom is furnished
with a table and chairs. The guest bath is has a shower/tub
combo. The bedroom includes nightstands, lighting, and a
either a flat screen television or older model. In room
amenities include high-speed internet access.
The corridors are adequate and functional, adequate width
permitting the
passage of
housekeeping
carts.
Recreational
Facilities
The subject does not feature any recreational facilities.

IMPROVEMENTS DESCRIPTION
Hilco Real Estate Appraisal, LLC Page 19
Back-of-the-House
The subject property is served by the necessary back-of-the-house space, such as administrative offices
and laundry facilities (one commercial washer and two dryers).
Utilities
All utilities are available to site.
Functional Utility
The existing improvements appear to offer a typical limited
service hotel with regard to layout, construction materials and
overall design. In general it is typical of hotel of this size and
competitive with other similar brands. In general, the
improvements are considered adequately functional in terms of utility.
ADA Compliance
The Americans with Disabilities Act (ADA) became effective January 26, 1992. We have not made, nor
are we qualified by training to make, a specific compliance survey and analysis of this property to
determine whether or not it is in conformity with the various detailed requirements of the ADA. It is
possible that a compliance survey and a detailed analysis of the requirements of the ADA could reveal
that the property is not in compliance with one or more of the requirements of the Act. If so, this fact could
have a negative effect upon the value of the property. Since we have not been provided with the results
of a survey, we did not analyze the results of possible non-compliance.
Furniture, Fixtures and Equipment (Personal Property) The
subject’s FF&E are detailed later in the report.
Environmental Issues
We did not observe any potentially hazardous materials such as lead paint, asbestos, urea formaldehyde
foam insulation, or other potentially hazardous construction materials on or in the improvements.
However, it is noted that we did not search for such materials and are not qualified to detect such
materials. The existence of said hazardous materials (if any) may have an effect on the value of the
property. Therefore, for the purpose of this appraisal, we have specifically assumed that the property is
not affected by any hazardous materials that may be present on or in the improvements. We strongly
recommend that a qualified environmental engineering firm be retained by the Client prior to making a
business decision.
Deferred Maintenance
Deferred maintenance is curable, physical deterioration that should be corrected immediately. While the
immediacy of need is inherent and exists, it does not necessarily suggest inadequate maintenance in the
past. Our limited observation of the property indicated no significant items of deferred maintenance in
the common area.

IMPROVEMENTS DESCRIPTION
Hilco Real Estate Appraisal, LLC Page 20
Capital Expenditures
Our analysis specifically assumes that the hotel will require ongoing refurbishments in order to maintain
and upkeep to current standards, as well as its RevPAR position in this market, as forecast in this report.
In order to ensure that the subject property is maintained in a competitive position throughout the holding
period, we have deducted a reserve for replacement equal to 4.0% of total revenues per year. This is in-
line with the requirements from the market. The reserve is assumed to be adequate to fund all future
capital expenditures.
Conclusion
The existing improvements maintain average overall design and functional utility. Furthermore, there
were no signs of major deferred maintenance upon limited inspection and we are unaware of any major
planned capital improvements (exclusive of a required PIP that has not been completed). Consequently,
there are no known factors that could be considered to adversely impact the marketability of the
improvements.

Hilco Real Estate Appraisal, LLC Page 21
REAL ESTATE TAXES
REAL ESTATE TAXES
The site and improvements are identified by the Tunica County Assessor’s Office as parcel number:
3104180000000102
All property, real and personal, is appraised at true value then assessed at a percentage of true value
according to its type and use. Assessment ratios are 10%, 15%, and 30%. All ad valorem taxes are
assessed by local taxing authorities except that the Tax Commission assesses all public service
corporations (railroads, pipelines, electric power and light companies, private railcars, telephone and
telegraph companies, and other such companies) and provides to the tax assessor uniform assessment
schedules for motor vehicle and mobile homes. All ad valorem taxes are collected by the local county
and/or municipal tax collectors. Ad valorem taxes are payable on or before February 1 of the following
year of assessment except on motor vehicles which are paid at the time they are registered for road and
bridge privilege taxes. Mobile homes must be registered within 7 days of either purchase or movement
into the state and the ad valorem taxes are to be paid within 90 days.
The following presents a summary of the subject’s 2017 assessment (market value and effective tax rate)
and tax liability:
Assessor’s ID No. 3104180000000100
Land $75,000
Improvements
Total
$1,607,420
$1,682,420
Effective Tax Rate
Total Taxes
0.015248
$25,653
Thus, the subject’s 2017 total tax liability is $25,652.70. The real property assessed value is $252,363 with
a 15 percent ratio, implying a market value of $1,682,420.
In the forthcoming Income Capitalization Approach, we have forecast the subject’s assessment and
corresponding real estate tax liability to increase and stabilize at a two percent increased amount or
$26,000 as rounded.
ZONING
ZONING
The applicable zoning information for the subject is summarized as follows:
ZONING SUMMARY
Current Zoning None
Uses Permitted
Legally Conforming
Zoning Change
Minimum Lot Size
Site Coverage
Maximum Building Height 5
Stories
Front Set Back
Side Set Back
Rear Setback
Parking Requirement
Subject Parking
The purpose of this district is to permit the development mixed use
developments including residential, shopping and commercial centers
entertainment, public, and open space and recreational uses of integrated
design and various sizes to service the growing tourist industry in Tunica.
The subject is legal and conforming use.
A zoning change is
unlikely. N/A N/A
N/A
N/A
N/A
N/A
84
Conclusion
The appraisers are not experts in the interpretation of complex zoning ordinances but the subject
property appears to be a conforming use, based on a review of public information. Please note that the
determination of compliance is beyond the scope of a real estate appraisal. It is recommended that local
planning and zoning personnel be contacted regarding more specific information that might be
applicable to the subject.
In addition, we know of no deed restrictions, private or public, that further limit the subject property's use.
The research required to determine whether or not such restrictions exist, however, is beyond the scope
of this appraisal assignment. Deed restrictions are a legal matter and only a title examination by an
attorney or title company can usually uncover such restrictive covenants. Thus, we recommend a title
search to determine if any such restrictions do exist.
Hilco Real Estate Appraisal, LLC Page 22
HOTEL MARKET ANALYSIS
As a hotel includes a going-concern business as well as real property, the market value of a lodging facility
is a direct function of the supply and demand for hotel rooms within the market. Accordingly, an analysis of
the local area lodging market is a key component of the valuation process.

HOTEL MARKET ANALYSIS
Hilco Real Estate Appraisal, LLC Page 23
Presented in this section is a discussion on the subject’s competitive market and the historical and projected
performance of the subject. The national market overview is taken directly from Marcus & Millichap’s Mid-
Year 2017 Hotel Research Report.
National Market Overview
The U.S. hospitality sector has recorded increases in
occupancy and revenue metrics during the year ending in June
as room demand remained healthy. Employment growth
nationwide and the rising median household income will
support travel in the near future. Both domestic and
international travel continue to rise, further benefiting room
demand. Potential headwinds do exist including the growing
construction pipelines in many major markets that may place
downward pressure on occupancy, the average daily rate and
RevPAR this year and into 2018. During the last 12-month
period, hiring in office-using sectors rose 2.4 percent
nationwide as 734,000 workers were added to staffs. Healthy
job growth and a tight employment rate of 4.4 percent bolstered medium household incomes by 2.8 percent
during this time. The rising incomes may spur additional leisure travel while increased jobs may further
business travel. Domestic and international passenger travel in the United States rose 3.8 percent during
2016. In particular, international travel provides hotel operators opportunities for stronger demand drivers
as passengers more than doubled in the last three years. Texas and California have more than 20,000
rooms each that are expected to break ground in the next 12 months. The increased supply may place
downward pressure on occupancy in the coming years.
Investors increasingly targeting hotels as demand drivers improve.
Hotel operations that spur revenue growth have kept buyers active in this sector. Transaction velocity rose
roughly 10 percent nationwide as demand picked up for
properties in many of the country’s smaller markets. On
average, hotel assets changed hands for nearly $100,000
per key, down slightly year over year as fewer properties in
upper chain scales changed hands. Among chain scales,
lower-tier hotels garnered significant investor attention.
Trades increased considerably for economy and upper
midscale assets during the previous four quarters. Demand
for upscale assets held steady with the majority of trades in

HOTEL MARKET ANALYSIS
Hilco Real Estate Appraisal, LLC Page 24
Marriott and Hilton branded properties. Several regions posted significant increases in transaction volume
during the last 12 months. The Carolinas and the Central Midwest region led the nation, with the Mid Atlantic,
Mid South and Southwest regions following. In prior years, coastal regions typically led sales volume. Sales
velocity picked up for independent properties during the year ending in June as buyers widened their
acquisition expectations. The increased demand for soft brand hotels may further intensify bidding for their
properties moving forward as visitors seek experience oriented hotels.
Hotel construction pipeline on the rise.
Roughly 111,000 rooms in more than 950 hotel projects were completed nationwide during the last 12
months up to June. Moving forward, nearly 187,000 rooms are under development and an additional
222,000 are expected to break ground in the next four quarters. The growing supply additions may place
downward pressure in occupancy over the coming year. The metros of Houston and New York City received
the largest number of rooms as 4,200 and 5,400 rooms were completed within July to June, respectively.
Hilton Worldwide and Marriott International boosted their inventory during the last 12 months. Both
companies averaged between 27 percent and 28 percent increases of new hotel rooms over all supply
additions. Among chain scales, the bulk of new completions were in the upscale and upper midscale
segments with a combined total of 77,000 rooms. Roughly 10,500 unaffiliated rooms were also constructed
during this time.
Occupancy climbs amid healthy room demand.
Since last June, demand for hotel rooms continued
to outpace supply growth, lifting occupancy in the
United States 50 basis points to 73.4 percent at the
end of the second quarter. First half occupancy rose
40 basis points from the same time period last year
to 65.3 percent. Large markets
that
demonstrated significant occupancy increases from
last year include Norfolk-Virginia Beach, Orlando and Atlanta. On the other hand, mounting supply pressures
in metros including Dallas, Houston and Nashville weighed on vacancy improvement in the last 12 months.
Nearly all hotel chain scales posted occupancy improvements over the year ending in June. Economy chains
boasted the greatest improvement with occupancy increasing 90 basis points to 65.4 percent. The upscale
segment posted the only occupancy decrease as the rate ticked down 20 basis points year over year to
80.5 percent. Based on location, occupancy in properties in proximity to major thoroughfares climbed 100
basis points during the previous four quarters to 66.6 percent. Room demand in these hotels typically comes
from travelers passing by. The highest occupancy rate remains in urban hotels at 80.4 percent, up 50 basis
points year over year.
Room demand drives increases in revenue metrics.

HOTEL MARKET ANALYSIS
Hilco Real Estate Appraisal, LLC Page 25
Rising occupancy nationwide is driving growth in revenue metrics. During the year ending in the second
quarter, the average daily rate advanced 2.1 percent to $129.12. The increase in ADR and occupancy
generated a 2.8 percent rise in RevPAR during this time to $94.73. ADR and RevPAR in independent hotels
outperformed all other chain scales, rising 2.7 percent and 3.9 percent, respectively. Economy hotels
followed as strong occupancy improvement and a 2.2 percent increase in ADR drove a 3.5 percent climb in
RevPAR during the last 12 months. Despite higher occupancy in urban areas, suburban hotels outperformed
their counterparts in ADR and RevPAR growth during the previous four quarters. ADR in urban hotels rose
0.3 percent while RevPAR inched up 0.9 percent during this time. In the suburbs, ADR climbed 2.3 percent
and RevPAR posted a 2.8 percent advance. Major markets with RevPAR growth near or above 10 percent
include Norfolk- Virginia Beach, Orlando, and San Diego.
2017 National Forecast
The U.S. economy has proved resilient throughout this cycle, hurdling numerous obstacles ranging from a
federal government shutdown to financial markets’ susceptibility to periodic bouts of volatility. Events abroad
also periodically weigh on the outlooks of U.S. business and consumers, and the effects of the Brexit vote
have clearly yet to entirely play out. However, a decline in travel from the U.K. and countries in the Euro
zone could become more evident in bookings at U.S. hotels in the coming months. Against the backdrop of
a choppy pattern of domestic economic growth and international uncertainty, the U.S. hotel sector will post
modest gains in all key performance measures this year. Room demand will grow 2.0 percent in 2016 to
offset an increase in construction, yielding a 30-basis-point rise in annual occupancy to 65.8 percent.
Revenue measures will gain traction through the peak summer travel season and early fall, with ADR and
RevPAR forecast to gain 4.1 percent and 4.5 percent, respectively. Over the near term, rising completions
will slow occupancy growth and further compress gains in RevPAR.
The unanticipated outcome of the Brexit vote disrupted the Federal Reserve’s campaign to normalize
monetary policy. As expected, the central bank did not elect to raise its short-term lending benchmark at its
July meeting, and prospects of a rate increase in September have also diminished. A flight-to-safety bid into
the 10-year U.S. Treasury in the days following the out-come in the U.K. lowered the yield on the 10year to
the mid1 percent range and reduced the 10-year Treasury swap rate.
Spreads on CMBS widened in the wake of Brexit but retraced to near pre-vote levels in the ensuing days.
CMBS lenders continue to compete with local, regional and large national banks in the hotel sector. The
minimum loan threshold starts at $5 million, and rates begin at roughly 325 basis points above the 10-year
U.S. Treasury swap rate for top brands in the largest markets, and select well-sponsored transactions in
secondary markets. Terms are five or 10 years, and leverage is capped at 70 percent.
Banks continue to monitor the concentration of hotel loans on their books as demand in some segments of
the economy wanes. Local and regional banks will loan a maximum of $10 million for hotel transactions,
while large national banks can provide up to $30 million. Leverage on senior debt can reach 65 percent for
the best transactions. Loan terms vary from three to seven years at rates that typically range from 250 to
300 basis points above the corresponding U.S. Treasury yield or the U.S. prime rate. Non-recourse financing
is also provided to qualified borrowers in select circumstances.

HOTEL MARKET ANALYSIS
Hilco Real Estate Appraisal, LLC Page 26
SUPPLY & DEMAND ANALYSIS
The subject property is located in the Tunica Resort market. The subject is a 66-room, limited-service hotel
that caters mainly to the leisure hotel demand. The subject competes with other flagged and independent
properties near the Tunica Casino Corridor. The subject property competes directly with six other hotels in
the market, as shown below. A 2017 estimate, historical performance and a summary description of the
competitive hotels are outlined in the following pages.
2017 Competitive Hotel Supply
Year Property Open
No. Rooms
Estimated 2017
Average
Occupancy
Rate Days Inn Robinsonville 1994 66 20.0% $62.00 Motel 6 Tupelo 1986 92 45.0% $50.00 Best Western Tunica Resort 1994 80 58.0% $70.00 Americas Best Value Inn Tunica Resort 1995 100 25.0% $50.00 Key West Inn Tunica County 1995 42 30.0% $55.00 Quality Inn Robinsonville 1993 107 20.0% $50.00 Micro Hotel & Suites 2005 102 35.0% $50.00 Average 589 33.1% $55.87
Competitive Supply Map

HOTEL MARKET ANALYSIS
Hilco Real Estate Appraisal, LLC Page 27
Historical Performance of the Competitive Market
Smith Travel Research (STR), an independent research firm that is recognized by the lodging industry
as the standard source of reliable data, provided operating statistics on the subject’s hotel market. The
following table presents the historical performance for the subject’s competitive set.
It is important to note some limitations of the STR data. Hotels are occasionally added to or removed
from the sample and not every property reports data in a consistent and timely manner; these factors
can influence the overall quality of the information by skewing the results. These inconsistencies may
also cause the STR data to differ from the results of our competitive survey. Nonetheless, STR data
provide the best indication of aggregate growth or decline in existing supply and demand; thus, these
trends have been considered in our analysis.
The Tunica hotel market has been hard hit by Casino competition and declining revenues. The most
recent data does reflect a near term rebound in the market. The market is still cautiously pessimistic,
until a warmer weather/summer rebound.
Additions to Supply
Our fieldwork did not reveal an competitive property under construction. We have also implicitly included
the possibility of new supply in our conclusion of a stabilized occupancy rate for the subject property.
While we have taken reasonable steps to determine the potential of new supply within the market, it is
impossible to determine every property that will be developed in the future, or what their impact in the
market will be. Depending on the outcome of future hotel development projects, the value of the subject
property may be positively or negatively affected.
$20.81 2015 $57.16 36.4 % $56.81 % $19.94 -3.6 % -0.6 % 2016 -4.2 35.1 %
2017 % % $18.65 -2.6 % -4.0 33.7 -6.5 % $55.35
-2.5 -1.1 % -3.4 % %
Source: Smith Travel Research
Historical Performance by the Competitive Market
Year Market
Occupancy % Change RevPAR % ChangeADR % Change
Avg Annual % Change
HOTEL MARKET ANALYSIS
Hilco Real Estate Appraisal, LLC Page 28
Demand Analysis
A lodging market’s demand is perceived as being generated by several major segments, each of which
makes use of lodging accommodations for different reasons. The competitive market generates its
demand mainly from transient corporate and leisure segments, followed by group and contract demand.
Transient corporate demand is generated by the surrounding commercial office users and local
corporations. Transient leisure visitors to the area make up the remaining of the transient demand. Group
demand is generated by local corporations and SMERF guests. The primary corporate demand is the
Monday through Thursday business guests. Demand on the weekends is generated mostly from social
groups and the leisure segment.
The market’s demand mix comprises primarily of leisure demand, with this segment representing more
than 75 percent of the total demand. The remaining portions are comprised of mostly group demand
and some corporate or transient demand. The demand mix of the subject property is similar from the
market wide mix in that it accommodates more leisure (Casino and golf) demand, and a lesser amount
of corporate demand.
Transient / Corporate Demand Segment
This segment is concentrated in weekdays and consists of individuals traveling to conduct business with
corporate offices or headquarters in the area. Room rates are often discounted for corporate customers,
as they tend to spend more money on other services within the hotel.
The commercial segment includes numerous smaller classifications; however, the primary categories
considered in this analysis are individual business travelers and high-volume corporate accounts. Most
individual business travelers are visiting firms in the immediate area or passing through en route to other
destinations. Their lodging choices are influenced by brand loyalty (and frequent traveler programs in
particular), as well as location and convenience with respect to businesses and amenities. High-volume
corporate accounts are generated by local companies; demand in this segment may include employees
of the firm or its affiliates, and often consists of training groups. These companies typically designate
hotels as “preferred” accommodations; in return, the selected lodging facilities generally offer a
significant discount from their published rates. Typically, these rates are negotiated on an annual basis,
and the size of the discount is tied to the number of room nights produced.
Commercial demand in the subject property’s market is generated by a wide variety of corporations, with
technology/manufacturing, general business, healthcare and financial companies exhibiting the largest
demand profile. Although this segment was negatively affected during the most recent economic
recession, market representatives report a recovery in commercial demand.
The total corporate demand in the subject market is indicated to be approximately five percent of the
total room nights in the market.

HOTEL MARKET ANALYSIS
Hilco Real Estate Appraisal, LLC Page 29
Group Demand
The group and meeting demand segment includes conferences, as well as a variety of corporate group
meetings. The first group includes meetings and shows booked at convention centers and other venues.
The latter groups include sales meetings, seminars, training sessions, regular business meetings and
executive conferences. This segment also includes corporate groups at negotiated rates for area
companies. Also included are SMERF groups.
Corporate groups are one of the more profitable components of this segment, because they exhibit
limited price sensitivity and they often sponsor banquets and other events that generate revenue for the
host hotel. In order to attract this segment, hotels must offer meeting and banquet facilities, as well as
an adequate number of guestrooms to house function attendees. In the subject property’s market, most
corporate group activity is generated by the same major employers that contribute high-volume
corporate accounts. This demand may take the form of training programs, sales meetings, division
conferences, and similar events with a business purpose. Corporate groups generally meet during the
work week, thus generating lodging demand on Monday through Thursday nights. The average length
of stay is two to four days, although training groups may stay longer.
Meeting and group demand growth is closely related to growth in the commercial segment. Most
meetings within the market area have a direct or indirect business purpose; the economic considerations
that have an impact on commercial travel also affect group demand. Because of its location in
Petersburg, the subject market will typically only see demand generated from compression during
Houston city-wide events. The other portion of group demand is generated from noncommercial
meetings, which are tied to the economic factors that influence leisure travel. Although commercial
demand recorded a rebound in 2017 (YTD), meeting and group demand recorded a more modest growth
trend.
The current total demand in the group segment is estimated to be approximately 15 percent to 20 percent
of the total room nights in the market.

HOTEL MARKET ANALYSIS
Hilco Real Estate Appraisal, LLC Page 30
Transient / Leisure Demand Segment
The typical traveler for this demand segment books double occupancy, desires accommodations in a
convenient location, prefers ease of access from the room to their automobile, and is typically rate
sensitive.
The leisure market segment consists of individuals and families who are spending time in the area or
passing through to other destinations. Their travel purposes may include sightseeing, recreation, visiting
friends and relatives, or numerous other non-business activities. Leisure demand is strongest Friday and
Saturday nights and all week during holiday periods and the summer months. These peak periods are
negatively correlated with commercial visitation, underscoring the stabilizing effect of capturing weekend
and summer tourist travel. The typical length of stay ranges from one to four days, depending on the
destination and travel purpose. The spring season is also a prime period for weddings and other social
activities.
Leisure demand in the subject property’s market is generated by the local sites and attractions including
the Casinos and golf. Demand is also generated from its proximity to the interstate and airport in
Memphis.
The current total demand in the leisure segment is estimated to be approximately 80 percent of the total
room nights in the market and it has been declining market wide.
SUBJECT OCCUPANCY AND AVERAGE RATE PROJECTION
The following is the subject’s occupancy, according to STR.
Historical Performance by the Subject
Year Occupancy % Change ADR % Change % ChangeRevPAR
2015 26.5% $59.59 $15.79
2016 23.7% -10.6% $60.85 2.1% $14.42 -8.7%
2017 19.5% -17.7% $61.17 0.5% $11.93 -17.3%
Avg Annual %
Change
-13.2%
1.3% -12.2%
Source: STR & Subject Ownership
The subject’s occupancy has decreased an average of 13 percent since 2015. It has slightly increased
its ADR, but RevPar is declining. The subejct’s occupancy, based on its condition, is below the market.
Occupancy Projection / Penetration Analysis
Typically, the projected market share of the subject property is based on the penetration factor applied
to each market segment. The penetration factor is the ratio between a property’s market share and its

HOTEL MARKET ANALYSIS
Hilco Real Estate Appraisal, LLC Page 31
fair share. A hotel’s fair share is equal to its total room supply divided by the total competitive room
supply. A penetration factor above or below 100% indicates a hotel’s greater or lesser ability to complete
in the marketplace. The stabilized occupancy is intended to reflect the anticipated results of the property
over its remaining economic life, given any and all changes in the life cycle of the hotel.
Average Rate Projection
Average rate, or Average Daily Rate (ADR), is calculated by dividing the total rooms revenue achieved
during a specified period by the number of rooms sold during the same period. Typically, our estimates
of ADR for the subject are based on the historical performance at the hotel, manager’s forecast,
and average rates achieved by the competitive market. For analysis purposes, we only used market
data from STR from the competitive set and attempted to reflect the subject’s market position within that
set. The average rate and the anticipated occupancy percentage are used to project rooms revenue,
which in turn provides the basis for developing an opinion of most other income and expense categories.
Although the average rate analysis presented here follows the occupancy projections, these two statistics
are highly correlated; in reality, one cannot project occupancy without making specific assumptions
regarding average rate. This relationship is best illustrated by RevPAR, which reflects a property's ability
to maximize rooms revenue. The following chart reflect the competitive set ADR and RevPAR data,
followed by a historical ADR rent for the subject property.
The operating performance of the subject property is thus projected in terms of fiscalized occupancy and
average rate, whereby resulting in the revenue per available room. Our projection is shown in the
following chart.
As shown, we estimate that the subject’s occupancy will stabilize at 20% with an ADR of $63.00 in the
third year of our projection. The estimated occupancy and ADR levels are representative of the most
likely potential operations of the subject over the projected holding period based on our analysis of the
market, as of the date of this appraisal.
We again caution the reader that these figures are based on market information and not a full
penetration analysis as we received limited historical ADR, Occupancy or RevPAR figures. We
assume new professional management and ownership will stabilize the subject.
HIGHEST AND BEST USE
HIGHEST AND BEST USE Definition of Highest and Best Use
According to The Dictionary of Real Estate Appraisal, Sixth Edition (2015), a publication of the Appraisal
Institute, the highest and best use is defined as:
“The reasonably probable and legal use of vacant land or an improved property that is
physically possible, appropriately supported, financially feasible, and that results in the
highest value. The four criteria the highest and best use must meet are legal permissibility,
physical possibility, financial feasibility, and maximum productivity. Alternatively, the probable

use of land or improved property-specific with respect to the user and timing of the use-that
is adequately supported and results in the highest present value.”
Highest and Best Use As If Vacant
Legally Permissible
The first test concerns permitted uses. According to our understanding of the zoning ordinance, noted
earlier in this report, the site may legally be improved with structures that accommodate a hotel use.
Aside from the site’s zoning and regulations, we are not aware of any legal restrictions that limit the
potential uses of the subject.
Physically Possible
The second test is what is physically possible. As discussed in the “Property Description,” the site’s size,
soil, topography, etc. do not physically limit its use. The subject site is of adequate shape and size to
accommodate hotel uses.
Financial Feasibility and Maximal Productivity
The third and fourth tests are, respectively, what is feasible and what will produce the highest net return.
After analyzing the physically possible and legally permissible uses of the property, the highest and best
use must be considered in light of financial feasibility and maximum productivity.
The hotel market is on a moderate recovery, but there is no evidence of sufficient demand that would
justify new hotel supply. Thus, in the analysis of the subject site “as though vacant”, it appears that the
highest and best use is to hold for a hotel development.
Highest and Best Use of Property As Improved
The subject property is a Days Inn hotel, which is consistent with the highest and best use as vacant
previously analyzed. The improvements have been well designed for their intended use and are
considered to be in average overall condition. The improvements currently meet the market’s
expectations for a limited service class hotel and do not suffer from any measurable functional
obsolescence. The existing improvements have an estimated 30 years of remaining economic life. As
will be indicated in the income capitalization approach, the subject is capable of producing a positive net
cash flow and continued utilization of the subject as a hotel property is financially feasible. Conversion of
the subject’s improvements to an alternative use would not currently be financially
Hilco Real Estate Appraisal, LLC Page 38

HIGHEST AND BEST USE
feasible. Overall, it appears there are no alternative uses of the existing improvements that would produce
a higher net income and/or value over time than the current use.
Based on the foregoing, the highest and best use as improved of the subject property is consistent with
its existing use as a hotel development.
Based on the type of property, the complex nature of the daily hotel operation, and the income generating
potential of the improvements, it is our opinion that the most probable purchaser would be a national or
regional investor. The timing is immediate.
Metric Conclusion
Most Probably Purchaser Regional or National Investor
Subject's Primary Appeal Cash flow and potential price appreciation
Purchaser's Main Analysis Income Approach
Purchaser's Secondary Analysis Sales Comparison Approach
Depth of Demand Adequate base of potential purchasers
Purchaser's Alternatives Competitive offerings of similar properties
Likely Purchase Terms Cash or market rate financing
Financing Availability Abundant for creditworthy buyers at historically low interest rates
Hilco Real Estate Appraisal, LLC Page 39
VALUATION PROCESS
VALUATION PROCESS Methodology
Three approaches are typically used to estimate value in an appraisal: the cost, sales comparison, and
income capitalization approaches. These approaches, more fully described in the following pages, are
related to each other, as they involve the gathering and analysis of sales, cost, and income data that
pertain to the property being appraised. In appraisal practice, an approach to value is included or
eliminated based on its applicability to the property type being valued and the quality of information
available. Each approach is discussed below, and applicability to the property is briefly addressed in the
following summary.
Cost Approach
The cost approach recognizes that a prudent investor would not ordinarily pay more for the property than
the cost to purchase the land and construct the improvements. The cost approach examines the value
of the site and the depreciated value of the improvements. The depreciated value of the improvements
is the cost to replace the improvement, less accrued depreciation resulting from all causes: physical,
functional and economic. The sum of the land value and depreciated improvement value represents the
value of the property.

Sales Comparison Approach
The sales comparison approach estimates value based on prices purchasers and sellers in the market
have agreed to for comparable improved properties. This approach is based upon the principle of
substitution, which states that prices tend to be set by the prevailing prices of equally desirable
substitutes. In conducting the sales comparison approach, we gather data on similar properties and make
adjustments for such factors as market conditions, location, conditions of sale, income characteristics,
etc. The resulting adjusted prices lead to an estimate of the value one might expect to realize if the
subject property sold.
Income Capitalization Approach
The income capitalization approach reflects the subject’s income-producing capabilities. This approach
is based on the assumption that value is created by the expectation of benefits to be derived in the future.
Specifically estimated is the amount an investor would be willing to pay to receive an income stream plus
reversion value from a property over a period of time. The two common valuation techniques associated
with the income capitalization approach are direct capitalization and the discounted cash flow (DCF)
analysis.
Hilco Real Estate Appraisal, LLC Page 40
VALUATION PROCESS
Methodology Applicable to the Subject
The valuation process is concluded by analyzing each approach to value. Each approach is judged based
on its applicability, reliability, and the quantity and quality of its data. Reconciliation to a final value
conclusion weighs the relative strengths and weaknesses of each approach.
In our valuation, we relied primarily on the Income Capitalization Approach to value. Hotel investors base
their purchase decisions on economic factors such as projected net income and return on investments.
In this instance, we do not know the subject’s historical ADR, occupancy or expenses by department and
to forecast such is highly speculative. The subject has negative NOI, is not stable and is not financially
feasible. We did not know the cost of the PIP to allow the hotel to return to the Days Inn franchise
agreement or similar brand. Thus, in valuing the subject, the traditional income capitalization approach
(direct capitalization and DCF) to value is not considered to be applicable. We used a top line forecast
and ERRM multiplier, which reflects the behavior of market participants for this type of under-performing
hotel.

The sales comparison approach is typically utilized as a check of reasonableness to the market value. It
is very difficult to find truly comparable hotels, as each hotel property is very different if stabilized and
part of an enterprise value. Although the sales comparison approach typically provides a range of values
that supports the final opinion of value and reliance on this approach beyond the establishment of broad
parameters is not often justified by the quality of the sales data. In this instance, because it is assumed
the subject is near a real property & Tangible, fee simple value with limited or no enterprise value, the
sales comparison price per room is a market metric that is relied upon. Thus, we generally do not give
the sales comparison approach strong consideration, beyond establishing a probable range of value. In
this instance, the sales utilized are rated as good indication of value and are given considerable weight.
Lastly, because the cost approach does not reflect these income-related considerations, and requires a
number of highly subjective depreciation estimates, in addition to limited comparable land sales, we did
not include a cost approach.
Hilco Real Estate Appraisal, LLC Page 41

Page 36
INCOME CAPITALIZATION APPROACH
INCOME CAPITALIZATION APPROACH
The income capitalization approach is a method of converting the anticipated economic benefits of
owning real property into a value through the capitalization process. It is based on the premise that value
is created by the expectation of future benefits. This approach requires an estimation of the net operating
income of a property. The estimated net operating income is then converted to a value indication by use
of either the direct capitalization method or the discounted cash flow analysis (yield capitalization).
Direct capitalization uses a single year's stabilized net operating income as a basis for a value indication.
It converts estimated "stabilized" annual net operating income (NOI) to a value indication by dividing the
NOI by a capitalization rate. The capitalization rate chosen includes a provision for recapture of the
investment and should reflect all factors that influence the real property value, such as tenant quality,
property condition, neighborhood change, market trends, interest rates and inflation trends. The
capitalization rate can be inferred from local market transactions, or when transaction evidence is lacking,
obtained from varies sources such as interviews with market participants, national investor surveys and
band of investment analysis.
The discounted cash flow (DCF) analysis focuses on the operating cash flows expected from the property
and the anticipated proceeds of a hypothetical sale at the end of an assumed holding period. These
amounts are then discounted to their present value. The discounted present values of the income stream
and the reversion are added to obtain a value indication. Because benefits to be received in the future
are worth less than the same benefits received in the present, the DCF analysis weights income projected
in the early years of the holding period more heavily than the income and the sale proceeds received in
the latter half of the projection period.
The subject is a select-service hotel property, operating as a Days Inn brand, but suspended the
corporate web site (Choice Hotels) for violation of the franchise agreement.
The market would consider the both a Rooms Revenue Multiplier (ERRM) method and if the cost of the
PIP were known, the discounted cash flow analysis method as most reliable for this type of asset.
However, we were not provided recent or full financials or PIP requirement to determine a reasonable
net operating forecast. Most potential buyers perform their own modeling (typically a ERRM multiplier
based on top line revenue), based on the required PIP, repairs needed, a change in the franchise
agreement and possible flag change or conversation to an independent hotel. That is a highly speculative
model, without knowing additional inputs.

Page 37
Hilco Real Estate Appraisal, LLC
INCOME CAPITALIZATION APPROACH Subject’s Historical Operating Expense
We typically analyze provided operating statements consisting of ADR, rooms revenue, occupancy and
income/expenses from at least three prior fiscal years and the current YTD and the trailing 12 months.
The expenses are organized into typical hotel departments. Because only limited and incomplete
income and operating expenses were provided, and given the negative NOI and limited ADR and
occupancy in the market, we have not forecast the hotel’s expense levels.
Hilco Real Estate Appraisal, LLC
INCOME CAPITALIZATION APPROACH
GROSS INCOME MULTIPLER TECHNIQUE (ERRM)
Discussions with brokers and market participants indicate that when a hotel is not stabilized or does not
have recurring positive net cash flow like the subject, buyers are using a gross income multiplier or ERRM
(rooms revenue) technique to estimate value for acquisition. ERRM multipliers vary based on asset
location, condition, revenue mix, and potential operational efficiencies. Buyers view these assets as
somewhat distressed with the objective to improve revenues and reduce expenses to create positive
cash flow. One ERRM multiplier is available for one of the comparable sales and remaining are
supplemental sales of limited-service hotels in the regional marketplace. :
Conclusion
The subject property is currently not profitable. Market participants view the asset as having upside
potential due to potential improved operations. The ERRM multipliers for assets in similar economic
positions range from 1.88 to 3.80.
Based on our data set and in consideration of the subject property’s physical and economical
characteristics, we have estimated a ERRM of 3.0 for the subject property and conclude a value by the
ERRM Multiplier Technique as follows:
ERRM MULTIPLIER TECHNIQUE

Page 38
Hilco Real Estate Appraisal, LLC

Page 39
INCOME CAPITALIZATION APPROACH
CONCLUSION OF INCOME CAPITALIZATION APPROACH
The conclusions derived through the valuation methods employed within this approach are as follows:
The discounted cash flow method was considered but not utilized. The direct capitalization method was
not utilized, given the negative NOI. The ERRM multiplier method was used to estimate the in-place rooms
revenue.
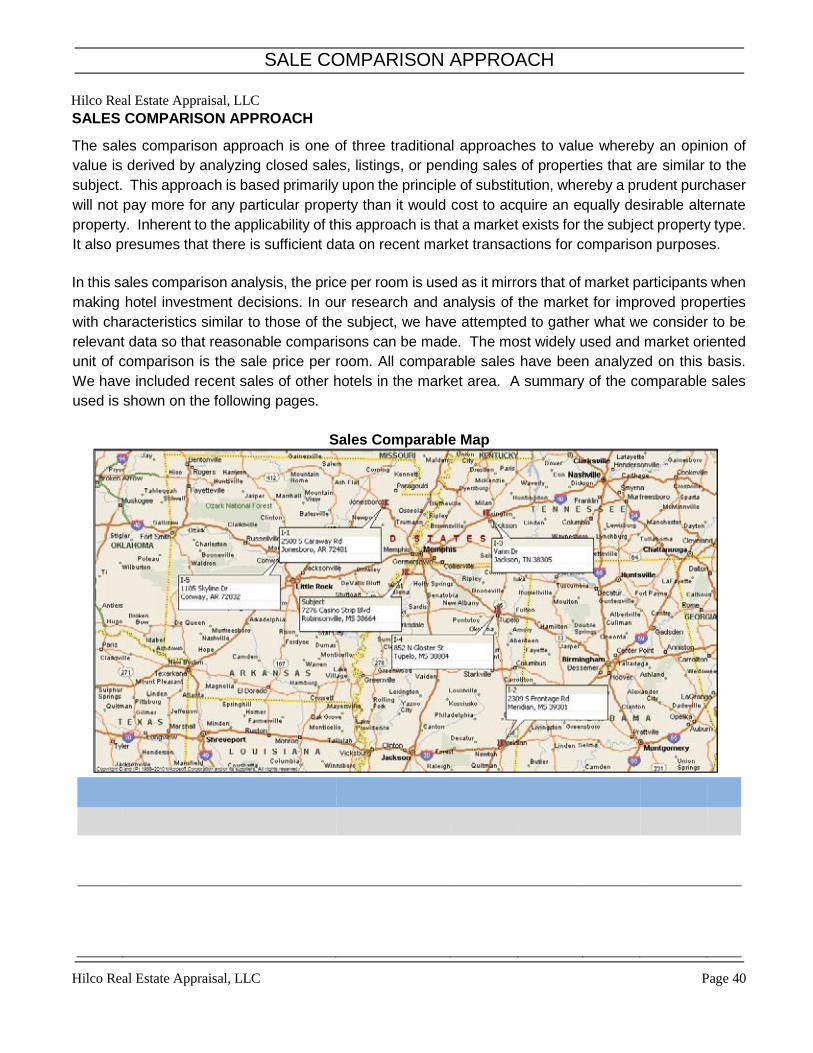
SALE COMPARISON APPROACH
Hilco Real Estate Appraisal, LLC Page 40
Hilco Real Estate Appraisal, LLC
SALES COMPARISON APPROACH
The sales comparison approach is one of three traditional approaches to value whereby an opinion of
value is derived by analyzing closed sales, listings, or pending sales of properties that are similar to the
subject. This approach is based primarily upon the principle of substitution, whereby a prudent purchaser
will not pay more for any particular property than it would cost to acquire an equally desirable alternate
property. Inherent to the applicability of this approach is that a market exists for the subject property type.
It also presumes that there is sufficient data on recent market transactions for comparison purposes.
In this sales comparison analysis, the price per room is used as it mirrors that of market participants when
making hotel investment decisions. In our research and analysis of the market for improved properties
with characteristics similar to those of the subject, we have attempted to gather what we consider to be
relevant data so that reasonable comparisons can be made. The most widely used and market oriented
unit of comparison is the sale price per room. All comparable sales have been analyzed on this basis.
We have included recent sales of other hotels in the market area. A summary of the comparable sales
used is shown on the following pages.
Sales Comparable Map

SALE COMPARISON APPROACH
Hilco Real Estate Appraisal, LLC Page 41

SALE COMPARISON APPROACH
Hilco Real Estate Appraisal, LLC Page 42

SALE COMPARISON APPROACH
Hilco Real Estate Appraisal, LLC Page 43
ADJUSTMENT PROCESS
The sales that we have utilized represent the best available information that could be compared to the
subject property. The major elements of comparison for an analysis of this type include the property rights
conveyed, the financial terms incorporated into a particular transaction, the conditions or motivations
surrounding the sale, changes in market conditions since the sale, the location of the real estate, its
physical traits and the economic characteristics of the property.
The first adjustment made to the market data takes into account differences between the subject property
and the comparable property sales with regard to the legal interest transferred. Advantageous financing
terms or peculiar conditions of sale are then adjusted to reflect a normal market transaction. Next,
changes in market condition must be accounted for, thereby creating a time adjusted normal unit of
comparison. Lastly, adjustments for location, the physical traits and the economic characteristics of the
market data are made in order to generate a final adjusted unit rate that is appropriate for the subject
property.
Please note that circumstances surrounding a sale of a hotel property are complex including
circumstances such as financing, tax considerations, partial interests, duress, and specific deal structure,
result in disparities between the actual sales price and true market value. It is usually very difficult to
obtain these specifics and often considered confidential information. In practice, it is very difficult to
quantify the appropriate adjustment factors accurately due to the complexity and available of such
information. In our appraisal, we try to reflect the analytical processes of typical buyers and sellers, which
most often is through an analysis of the future economic benefits. The Sales Comparison approach has
been utilized to provide a general range of values that serves as a check against the value indicated by
the Income Capitalization Approach.
Property Rights Conveyed
All of the comparable sales involved the transfer of the fee simple interest. Therefore, no adjustments
have been made.
Financing Terms
The subject is being analyzed in terms of its cash value, or cash value equivalency. All of the improved
sales are considered similar and do not require adjustment.
Conditions of Sale
The condition of sale adjustment is used to account for unusual buyer and seller motivations. For example,
if a seller must quickly dispose of a property, its price would in general be lower than if the seller was
typically motivated. Sale 5 sold as an REO asset and is adjusted upward.

SALE COMPARISON APPROACH
Hilco Real Estate Appraisal, LLC Page 44
Expenditures After Purchase
This adjustment accounts for the anticipated costs that are incurred by the buyer after the sale of the
property. The costs include, but are not limited to any number of immediate expenditures such as costs
to cure deferred maintenance, demolition or removal of any portion of the improvements, and remediation
of environmental contamination. It is necessary to account for these costs as they have an effect on the
purchase price.
Market Conditions
A market condition adjustment is required if the comparable sales transferred under different market
conditions from those applicable to the subject on the effective date of value. Generally, an adjustment
for market conditions is made if general property values have increased or decreased since the
transaction date. In order to gauge the market conditions for hotel properties we examined the general
investment parameters as reported by PWC.
According to PWC Investor Survey for the third quarter 2017, the limited service lodging market has seen
changes in fundamentals since 2015. While the PWC investor survey tracks institutional assets and
represents forecasted rates of return rather than actual activity, it does provide an overview of the
generally broad changes in market conditions. No time adjustment is warranted.
Qualitative Adjustments for Physical and Economic Factors
Each hotel is different, even hotels in the same immediate market cater towards different market demand
with varying market mix and clientele.
SUMMARY OF ADJUSTMENTS
Based on the preceding comparative analysis, the following table summarizes the adjustments applied to
each improved sale.
The market value derived by the Income Capitalization Approach of $900,000 is supported by the Sales
Comparison Approach.
In appraising lodging facilities, it is often difficult to find an adequate number of recent sales that are truly
comparable to the subject property. Although it is often necessary to consider comparable sales outside
the subject property's market area, the resulting adjustments greatly diminish the reliability of the
conclusions. Most observers of hotel transactions are unable to determine the true motivations of the
buyers and sellers. Acquiring a hotel often represents a highly ego-driven process where many external,
non-market factors influence the purchase price. Unless the appraiser can quantify these influences, there
is no way of knowing whether the purchase price paid actually reflects market value. Finally, when
appraising hotels, the degree of comparability between the subject property and a comparable sale is
usually so diverse that many subjective and unsubstantiated adjustments are required. Each adjustment
represents a potential for error and thereby diminishes the reliability of this approach. As a result of these

SALE COMPARISON APPROACH
Hilco Real Estate Appraisal, LLC Page 45
shortcomings, the use of the Sales Comparison Approach in valuing hotels is primarily limited to checking
the value indicated by the Income Capitalization Approach.
However, in this instance, given the lack of the historical detailed financials available and the subject’s
negative NOI, we have relied on the Sales Comparison Approach to reflect the subject’s value.

RECONCILIATION AND FINAL VALUE OPINION
Hilco Real Estate Appraisal, LLC Page 46
RECONCILIATION AND FINAL VALUE OPINION
Reconciliation involves the weighting of alternative value indications, based on the judged reliability and
applicability of each approach to value, to arrive at a final value conclusion. Reconciliation is required
because different value indications result from the use of multiple approaches and within the application
of a single approach. The approaches to value indicated the following:
The cost approach is based upon the proposition that the informed purchaser would pay no more for the
subject than the cost to produce a substitute property with equivalent utility. This approach is particularly
applicable when the property being appraised involves relatively new improvements that represent the
highest and best use of the land, or when relatively unique or specialized improvements are located on
the site and for which there exist few sales or leases of comparable properties.
In the sales comparison approach, the subject is compared to similar properties that have been sold
recently or for which listing prices or offers are known. Several sales of branded hotels in the subject
market were examined, and this approach was useful in providing value parameters that supported the
income capitalization approach. In this instance, because we do not know the subject’s detailed operating
income and expenses, we have given significant or most weight to this approach.
The income capitalization approach is applicable to the subject since it is an income producing property
in the open market. Market participants are primarily analyzing properties based on their income
generating capability. The income capitalization approach is typically considered the most reasonable
and substantiated primary value indicator. In this instance, we have presented the ERRM approach as a
general income model and have given it some emphasis in the final value estimate.
Based on the foregoing, the market values of the subject have been concluded as follows:
The estimates of market value include the land, the improvements, and the furniture, fixtures, and
equipment. The appraisal assumes that the hotel is open and operational.
PERSONAL PROPERTY ALLOCATION
Included in the above estimate of market value is the contributing value of the personal property at the
subject property, namely the furnishings, fixtures, and equipment (FF&E). FF&E typically includes: guest
room furnishings, front office, administrative and conference or meeting facility equipment; kitchen
restaurant and lounge equipment, service/maintenance equipment, and other items of decor. The FF&E

RECONCILIATION AND FINAL VALUE OPINION
Hilco Real Estate Appraisal, LLC Page 47
is an essential component in a hotel operation typically sold with the building. Therefore, it is considered
to be a part of the total value. In estimating the subject’s FF&E value, we considered the Development
Cost Survey (2016/17), published by HVS International.
Based on our review of the subject, we estimate that the value of the FF&E as new, is approximately
$15,000 per room, or a total of $990,000) based on 66 guest rooms. Although hotel FF&E typically have
a useful life of five to ten years, depreciation of these assets occurs at a much faster rate than straight-
line, and depreciate to some degree immediately upon being placed into service. The subject’s FF&E
has an estimated current effective age of approximately 9.5 years. Accordingly, we conclude that the
contributory value of the subject’s FF&E would be around 5% of cost, or depreciated by about 95%.
Therefore, the contributory value of the FF&E is estimated to be $49,500.
BUSINESS VALUE (GOING CONCERN)
Hotels are undisputedly a combination of business and real estate; the day-to-day operation of a hotel
represents a business over and above the real estate value. Numerous theories have been developed
in an attempt to isolate the business component of a hotel. When hotels were routinely leased to hotel
operators, separating the income and value attributable to each component was a simple matter.
However, during the 1970s, the hotel property lease was replaced with the hotel management contract.
It is widely accepted today that managing agents are hired by hotel owners to operate a property in return
for a management fee. The fee is paid to the operator as an operating expense, and what remains is net
income available to pay debt service and generate a return on the owner’s equity. Purchasers of hotels
as real estate investments are able to passively own the property by employing a managing agent, as
was the case with the property lease in earlier years.
The real and personal property components of the subject property have already been valued in this
appraisal and any business component has been accounted for through the deduction of market rate
management and franchise fees. By making these deductions, we believe that there is no business value
included in our conclusion of market value. The subject property is not encumbered with any other
material operating lease agreements.
ALLOCATION OF MARKET VALUE COMPONENTS
We have allocated the market value of the subject property into Real Property and Personal Property as
follows:
ALLOCATION OF MARKET VALUE
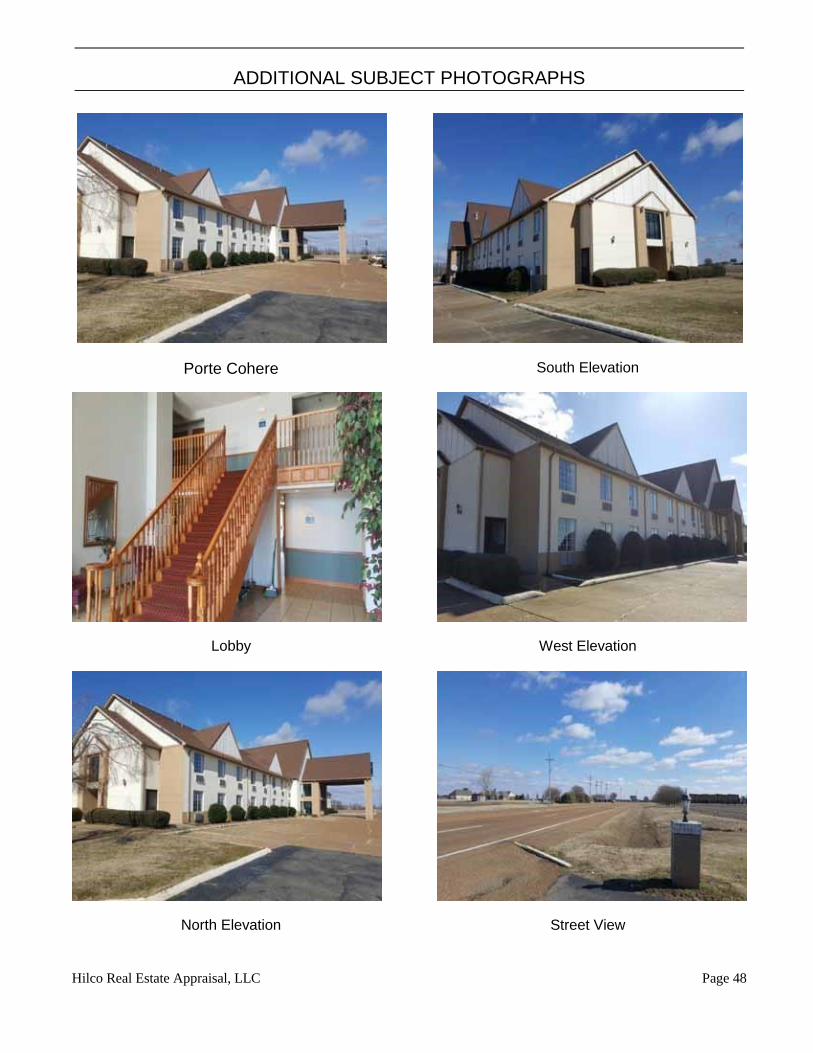
Hilco Real Estate Appraisal, LLC Page 48
ADDITIONAL SUBJECT PHOTOGRAPHS
Lobby West Elevation
North Elevation Street View
Porte Cohere
South Elevation
Hilco Real Estate Appraisal, LLC Page 49
ASSUMPTIONS AND LIMITING CONDITIONS
ASSUMPTIONS AND LIMITING CONDITIONS
“Appraisal” means the appraisal report and opinion of value stated therein, to which these Assumptions and
Limiting Conditions are annexed. “Property” means the subject of the Appraisal.
“Hilco” means Hilco Real Estate Appraisal, LLC or its subsidiary which issued the Appraisal.
“Appraiser” or “Appraisers” means the employee(s) of Hilco who prepared and signed the Appraisal.
General Assumptions
This appraisal is made subject to the following assumptions and limiting conditions:
1. No opinion is intended to be expressed and no responsibility is assumed for the legal description or for
any matters which are legal in nature or require legal expertise or specialized knowledge beyond that of a
real estate appraiser. Title to the Property is assumed to be good and marketable and the Property is
assumed to be free and clear of all liens unless otherwise stated. No survey of the Property was
undertaken.
2. The information contained in the Appraisal or upon which the Appraisal is based has been gathered from
sources the Appraiser assumes to be reliable and accurate. Some of such information may have been
provided by the owner of the Property. Neither the Appraiser nor Hilco shall be responsible for the accuracy
or completeness of such information, including the correctness of opinions, dimensions, sketches, exhibits
and factual matters.
3. The opinion of value is only as of the date stated in the Appraisal. Changes since that date in external and
market factors or in the Property itself can significantly affect property value.
4. The Appraisal is to be used in whole and not in part. No part of the Appraisal shall be used in conjunction
with any other appraisal. Publication of the Appraisal or any portion thereof without the prior written
consent of Hilco is prohibited. Except as may be otherwise stated in the letter of engagement, the Appraisal
may not be used by any person other than the party to whom it is addressed or for purposes other than
that for which it was prepared. No part of the Appraisal shall be conveyed to the public through advertising,
or used in any sales or promotional material without Hilco’s prior written consent. Reference to the
Appraisal Institute or to the MAI designation is prohibited.
5. Except as may be otherwise stated in the letter of engagement, the Appraiser shall not be required to give
testimony in any court or administrative proceeding relating to the Property or the Appraisal.
6. The Appraisal assumes (a) responsible ownership and competent management of the Property; (b) there
are no hidden or unapparent conditions of the Property, subsoil or structures that render the Property more
or less valuable (no responsibility is assumed for such conditions or for arranging for engineering studies
that may be required to discover them); (c) full compliance with all applicable federal, state and local zoning
and environmental regulations and laws, unless noncompliance is stated, defined and analyzed in the
Appraisal; and (d) all required licenses, certificates of occupancy and other governmental consents have
been or can be obtained and renewed for any use on which the value opinion contained in the Appraisal
is based.
7. The physical condition of the improvements analyzed within the Appraisal is based on visual inspection
by the Appraiser or other person identified in the Appraisal. Hilco assumes no responsibility for the
soundness of structural members nor for the condition of mechanical equipment, plumbing or electrical
components.

Hilco Real Estate Appraisal, LLC Page 50
8. The projected potential gross income referred to in the Appraisal may be based on lease summaries
provided by the owner or third parties. The Appraiser has not reviewed lease documents and assumes no
responsibility for the authenticity or completeness of lease information provided by others. Hilco
recommends that legal advice be obtained regarding the interpretation of lease provisions and the
contractual rights of parties.
ASSUMPTIONS AND LIMITING CONDITIONS
9. The projections of income and expenses are not predictions of the future. Rather, they are the Appraiser’s
opinion of current market thinking on future income and expenses. The Appraiser and Hilco make no
warranty or representation that these projections will materialize. The real estate market is constantly
fluctuating and changing. It is not the Appraiser’s task to predict or in any way warrant the conditions of a
future real estate market; the Appraiser can only reflect what the investment community, as of the date of
the Appraisal, envisages for the future in terms of rental rates, expenses, supply and demand.
10. Unless otherwise stated in the Appraisal, the existence of potentially hazardous or toxic materials which
may have been used in the construction or maintenance of the improvements or may be located at or
about the Property was not analyzed in arriving at the opinion of value. These materials (such as
formaldehyde foam insulation, asbestos insulation and other potentially hazardous materials) may
adversely affect the value of the Property. The Appraisers are not qualified to detect such substances.
Hilco recommends that an environmental expert be employed to determine the impact of these matters
on the opinion of value.
11. The author of this report is not qualified to comment on environmental issues that may affect the market
value of the property appraised, including but not limited to pollution or contamination of land, buildings,
water, groundwater or air. Unless expressly stated, the property is assumed to be free and clear of
pollutants and contaminants, including but not limited to molds or mildews or the conditions that might give
rise to either, and in compliance with all environmental condition, past, present, or future, that might affect
the market value of the property appraised. If the party relying on this report requires information about
environmental issues then that party is cautioned to retain an expert qualified in such issues. We expressly
deny any legal liability relating to the effect of environmental issues on the market value of the property
being appraised
12. Unless otherwise stated in the Appraisal, compliance with the requirements of the Americans With
Disabilities Act of 1990 (ADA) has not been analyzed in arriving at the opinion of value. Failure to comply
with the requirements of the ADA may adversely affect the value of the property. Hilco recommends that
an expert in this field be employed.
13. Additional work requested by the client beyond the scope of this assignment will be billed at our prevailing
hourly rate. Preparation for court testimony, update valuations, additional research, depositions, travel or
other proceedings will be billed at our prevailing hourly rate, plus reimbursement of expenses.
14. The reader acknowledges that Hilco has been retained hereunder as an independent contractor to perform
the services described herein and nothing in this agreement shall be deemed to create any other
relationship between us. This assignment shall be deemed concluded and the services hereunder
completed upon delivery to you of the appraisal report discussed herein.
15. This study has not been prepared for use in connection with litigation and this document is not suitable for
use in a litigation action. Accordingly, no rights to expert testimony, pretrial or other conferences,
deposition, or related services are included with this appraisal. If, as a result of this undertaking, Hilco or
any of its principals, its appraisers or consultants are requested or required to provide any litigation
services, such shall be subject to the provisions of the Hilco engagement letter or, if not specified therein,

Hilco Real Estate Appraisal, LLC Page 51
subject to the reasonable availability of Hilco and/or said principals or appraisers at the time and shall
further be subject to the party or parties requesting or requiring such services paying the thenapplicable
professional fees and expenses of Hilco either in accordance with the provisions of the engagement letter
or arrangements at the time, as the case may be.

ADDENDUM
PROFESSIONAL QUALIFICATIONS

Qualifications for Adam K. Zimmerman
2007 - Present Hilco Real Estate Appraisal, LLC, Vice President, Valuation Services
2004 - 2007 Price Associates, Inc., Appraisal Services, Chicago, IL, Senior Appraiser
1991 - 2007 Zimmerman and Weinstein, Northfield, IL, Owner

Scope of Experience:
General
Engaged exclusively in the valuation of real estate since 1991, Adam has extensive experience in valuing
a broad range of property types. Adam’s experience includes managing Hilco valuation projects for a
variety of purposes including lending support, bankruptcy, restructuring, financial accounting and
investment decision-making. Income methodologies include DCF (Excel) and Argus expertise.
He also has experience as an expert witness and has been qualified as an expert in the Circuit Court of
Lake and Cook Counties of Illinois, the U.S. Bankruptcy Court for the North District of Illinois and Cook
and Lake Counties’ property tax appeal boards. Types of reports completed range from market rent
studies/surveys and appraisal reviews, to restricted to appraisal reports.
Additional responsibilities include business development, appraisal management, production and review,
administrative duties and staff training.
Hospitality Focus
Adam has performed numerous valuations for both fee simple and going-concern hospitality assignments
for nationally flagged hotels, boutique hotels and hotel/water park (entertainment) properties across the
United States. His expertise extends to market analysis and valuation for both closed or distressed hotel
properties and fully operating and stabilized assets.
Certifications/Licenses:
Certified General Real Estate Appraiser licenses held in the states of Illinois, Ohio, Pennsylvania, Texas,
Arizona and Louisiana.
Appraisal Education:
Candidate for Designation of the Appraisal Institute Formal
Education:
Bachelor of Arts, Journalism, University of Kansas