certain orange juice from brazil - usitc · washington, dc 20436. certain orange juice from brazil....
TRANSCRIPT

Washington, DC 20436
Certain Orange Juice from Brazil
Investigation No. 731-TA-1089 (Review)
Publication 4311 April 2012
U.S. International Trade Commission

Washington, DC 20436
U.S. International Trade Commission
COMMISSIONERS Deanna
Tanner Okun, Chairman Irving A. Williamson, Vice Chairman
Daniel R. Pearson Shara L. Aranoff Dean A. Pinkert
David S. Johanson
Karen Laney Acting Director of Operations
Staff assigned
Amy Sherman, Investigator Brendan Lynch, Industry Analyst
Craig Thomsen, Economist Justin Jee, Accountant David
Goldfine, Attorney Steven Hudgens, Statistician
Elizabeth Haines, Supervisory Investigator
Address all communications to Secretary to the Commission
United States International Trade Commission

U.S. International Trade Commission
Washington, DC 20436 www.usitc.gov
Certain Orange Juice from Brazil
Investigation No. 731-TA-1089 (Review)
Publication 4311 April 2012

i
CONTENTS
Page
Determination . . . . . . . . . . . . . . . . . . . . . . . . . . . . . . . . . . . . . . . . . . . . . . . . . . . . . . . . . . . . . . . . . . 1 Views of the Commission . . . . . . . . . . . . . . . . . . . . . . . . . . . . . . . . . . . . . . . . . . . . . . . . . . . . . . . . . 3
Part I: Introduction . . . . . . . . . . . . . . . . . . . . . . . . . . . . . . . . . . . . . . . . . . . . . . . . . . . . . . . . . . . . I-1
Background . . . . . . . . . . . . . . . . . . . . . . . . . . . . . . . . . . . . . . . . . . . . . . . . . . . . . . . . . . . . . . . . . . I-1 The original investigation . . . . . . . . . . . . . . . . . . . . . . . . . . . . . . . . . . . . . . . . . . . . . . . . . . . . I-2 Subsequent proceedings . . . . . . . . . . . . . . . . . . . . . . . . . . . . . . . . . . . . . . . . . . . . . . . . . . . . . I-2
Previous and related investigations . . . . . . . . . . . . . . . . . . . . . . . . . . . . . . . . . . . . . . . . . . . . . . . . I-3 Statutory criteria . . . . . . . . . . . . . . . . . . . . . . . . . . . . . . . . . . . . . . . . . . . . . . . . . . . . . . . . . . . . . . I-3 Summary data . . . . . . . . . . . . . . . . . . . . . . . . . . . . . . . . . . . . . . . . . . . . . . . . . . . . . . . . . . . . . . . . I-5 Commerce’s reviews . . . . . . . . . . . . . . . . . . . . . . . . . . . . . . . . . . . . . . . . . . . . . . . . . . . . . . . . . . . I-9
Administrative reviews . . . . . . . . . . . . . . . . . . . . . . . . . . . . . . . . . . . . . . . . . . . . . . . . . . . . . . I-9 Results of five-year review . . . . . . . . . . . . . . . . . . . . . . . . . . . . . . . . . . . . . . . . . . . . . . . . . . . I-9
The subject merchandise . . . . . . . . . . . . . . . . . . . . . . . . . . . . . . . . . . . . . . . . . . . . . . . . . . . . . . . . I-10 Commerce’s scope . . . . . . . . . . . . . . . . . . . . . . . . . . . . . . . . . . . . . . . . . . . . . . . . . . . . . . . . . . I-10 Tariff treatment . . . . . . . . . . . . . . . . . . . . . . . . . . . . . . . . . . . . . . . . . . . . . . . . . . . . . . . . . . . . I-11
The product . . . . . . . . . . . . . . . . . . . . . . . . . . . . . . . . . . . . . . . . . . . . . . . . . . . . . . . . . . . . . . . . . . I-11 Description and applications . . . . . . . . . . . . . . . . . . . . . . . . . . . . . . . . . . . . . . . . . . . . . . . . . . I-11 Manufacturing processes . . . . . . . . . . . . . . . . . . . . . . . . . . . . . . . . . . . . . . . . . . . . . . . . . . . . . I-11
Domestic like product issues . . . . . . . . . . . . . . . . . . . . . . . . . . . . . . . . . . . . . . . . . . . . . . . . . . . . I-13 U.S. market participants . . . . . . . . . . . . . . . . . . . . . . . . . . . . . . . . . . . . . . . . . . . . . . . . . . . . . . . . I-13
U.S. producers . . . . . . . . . . . . . . . . . . . . . . . . . . . . . . . . . . . . . . . . . . . . . . . . . . . . . . . . . . . . . I-13 U.S. importers . . . . . . . . . . . . . . . . . . . . . . . . . . . . . . . . . . . . . . . . . . . . . . . . . . . . . . . . . . . . . I-15 U.S. purchasers . . . . . . . . . . . . . . . . . . . . . . . . . . . . . . . . . . . . . . . . . . . . . . . . . . . . . . . . . . . . I-16
Apparent U.S. consumption and market shares . . . . . . . . . . . . . . . . . . . . . . . . . . . . . . . . . . . . . . I-16
Part II: Conditions of competition in the U.S. market . . . . . . . . . . . . . . . . . . . . . . . . . . . . . . . . II-1 U.S. market characteristics . . . . . . . . . . . . . . . . . . . . . . . . . . . . . . . . . . . . . . . . . . . . . . . . . . . . . . II-1
Channels of distribution . . . . . . . . . . . . . . . . . . . . . . . . . . . . . . . . . . . . . . . . . . . . . . . . . . . . . . II-1 Geographic distribution . . . . . . . . . . . . . . . . . . . . . . . . . . . . . . . . . . . . . . . . . . . . . . . . . . . . . . . . II-3 Supply and demand considerations . . . . . . . . . . . . . . . . . . . . . . . . . . . . . . . . . . . . . . . . . . . . . . . . II-3
Supply . . . . . . . . . . . . . . . . . . . . . . . . . . . . . . . . . . . . . . . . . . . . . . . . . . . . . . . . . . . . . . . . . . . II-3 Demand . . . . . . . . . . . . . . . . . . . . . . . . . . . . . . . . . . . . . . . . . . . . . . . . . . . . . . . . . . . . . . . . . . II-12
Substitutability issues . . . . . . . . . . . . . . . . . . . . . . . . . . . . . . . . . . . . . . . . . . . . . . . . . . . . . . . . . . II-16 Purchaser characteristics . . . . . . . . . . . . . . . . . . . . . . . . . . . . . . . . . . . . . . . . . . . . . . . . . . . . . II-16 Knowledge of country sources . . . . . . . . . . . . . . . . . . . . . . . . . . . . . . . . . . . . . . . . . . . . . . . . II-16 Factors affecting purchasing decisions . . . . . . . . . . . . . . . . . . . . . . . . . . . . . . . . . . . . . . . . . . II-18 FCOJM vs. NFCOJ comparisons . . . . . . . . . . . . . . . . . . . . . . . . . . . . . . . . . . . . . . . . . . . . . . II-21 Comparisons of domestic products and subject imports . . . . . . . . . . . . . . . . . . . . . . . . . . . . . II-22 Comparisons of domestic products and nonsubject imports . . . . . . . . . . . . . . . . . . . . . . . . . . II-25 Comparison of subject imports and nonsubject imports . . . . . . . . . . . . . . . . . . . . . . . . . . . . . II-26
Elasticity estimates . . . . . . . . . . . . . . . . . . . . . . . . . . . . . . . . . . . . . . . . . . . . . . . . . . . . . . . . . . . . II-26 U.S. supply elasticity . . . . . . . . . . . . . . . . . . . . . . . . . . . . . . . . . . . . . . . . . . . . . . . . . . . . . . . . II-26 U.S. demand elasticity . . . . . . . . . . . . . . . . . . . . . . . . . . . . . . . . . . . . . . . . . . . . . . . . . . . . . . . II-27 Substitution elasticity . . . . . . . . . . . . . . . . . . . . . . . . . . . . . . . . . . . . . . . . . . . . . . . . . . . . . . . II-27
ii
CONTENTS
Page
Part III: Condition of the U.S. industry . . . . . . . . . . . . . . . . . . . . . . . . . . . . . . . . . . . . . . . . . . . . III-1 Overview . . . . . . . . . . . . . . . . . . . . . . . . . . . . . . . . . . . . . . . . . . . . . . . . . . . . . . . . . . . . . . . . . . . . III-1 U.S. growers . . . . . . . . . . . . . . . . . . . . . . . . . . . . . . . . . . . . . . . . . . . . . . . . . . . . . . . . . . . . . . . . . III-1
Changes experienced in operations . . . . . . . . . . . . . . . . . . . . . . . . . . . . . . . . . . . . . . . . . . . . . III-1 Anticipated changes in existing operations . . . . . . . . . . . . . . . . . . . . . . . . . . . . . . . . . . . . . . . III-2 U.S. bearing acreage, production, and yield . . . . . . . . . . . . . . . . . . . . . . . . . . . . . . . . . . . . . . III-2
U.S. extractor/processors . . . . . . . . . . . . . . . . . . . . . . . . . . . . . . . . . . . . . . . . . . . . . . . . . . . . . . . III-5 Changes experienced in operations . . . . . . . . . . . . . . . . . . . . . . . . . . . . . . . . . . . . . . . . . . . . . III-5 Anticipated changes in existing operations . . . . . . . . . . . . . . . . . . . . . . . . . . . . . . . . . . . . . . . III-6
U.S. capacity, production, and capacity utilization . . . . . . . . . . . . . . . . . . . . . . . . . . . . . . . . . . . III-7 Blending . . . . . . . . . . . . . . . . . . . . . . . . . . . . . . . . . . . . . . . . . . . . . . . . . . . . . . . . . . . . . . . . . III-8 Constraints on capacity . . . . . . . . . . . . . . . . . . . . . . . . . . . . . . . . . . . . . . . . . . . . . . . . . . . . . . III-11
U.S. producers’ shipments . . . . . . . . . . . . . . . . . . . . . . . . . . . . . . . . . . . . . . . . . . . . . . . . . . . . . . III-11 U.S. producers’ inventories . . . . . . . . . . . . . . . . . . . . . . . . . . . . . . . . . . . . . . . . . . . . . . . . . . . . . III-15 U.S. producers’ imports and purchases . . . . . . . . . . . . . . . . . . . . . . . . . . . . . . . . . . . . . . . . . . . . . III-17 U.S. employment, wages, and productivity . . . . . . . . . . . . . . . . . . . . . . . . . . . . . . . . . . . . . . . . . III-17 Financial condition of U.S. extractor/processors . . . . . . . . . . . . . . . . . . . . . . . . . . . . . . . . . . . . . III-19
Background . . . . . . . . . . . . . . . . . . . . . . . . . . . . . . . . . . . . . . . . . . . . . . . . . . . . . . . . . . . . . . . III-19 Operations on certain orange juice extractor/processors . . . . . . . . . . . . . . . . . . . . . . . . . . . . . III-19 Capital expenditures and research and development expenses . . . . . . . . . . . . . . . . . . . . . . . . III-33 Assets and return on investment . . . . . . . . . . . . . . . . . . . . . . . . . . . . . . . . . . . . . . . . . . . . . . . III-34 Operations on certain orange growers . . . . . . . . . . . . . . . . . . . . . . . . . . . . . . . . . . . . . . . . . . . III-34 Growers’ capital expenditures and research and development expenses . . . . . . . . . . . . . . . . III-36
Part IV: U.S. imports and the foreign industry . . . . . . . . . . . . . . . . . . . . . . . . . . . . . . . . . . . . . . IV-1
U.S. imports . . . . . . . . . . . . . . . . . . . . . . . . . . . . . . . . . . . . . . . . . . . . . . . . . . . . . . . . . . . . . . . . . IV-1 Overview . . . . . . . . . . . . . . . . . . . . . . . . . . . . . . . . . . . . . . . . . . . . . . . . . . . . . . . . . . . . . . . . . IV-1 Imports from subject and nonsubject countries . . . . . . . . . . . . . . . . . . . . . . . . . . . . . . . . . . . . IV-1
U.S. importers’ imports subsequent to September 30, 2011 . . . . . . . . . . . . . . . . . . . . . . . . . . . . . IV-4 U.S. importers’ inventories . . . . . . . . . . . . . . . . . . . . . . . . . . . . . . . . . . . . . . . . . . . . . . . . . . . . . . IV-5 Antidumping investigations in third-country markets . . . . . . . . . . . . . . . . . . . . . . . . . . . . . . . . . IV-7 The industry in Brazil . . . . . . . . . . . . . . . . . . . . . . . . . . . . . . . . . . . . . . . . . . . . . . . . . . . . . . . . . . IV-7
Overview . . . . . . . . . . . . . . . . . . . . . . . . . . . . . . . . . . . . . . . . . . . . . . . . . . . . . . . . . . . . . . . . . IV-7 Certain orange juice operations . . . . . . . . . . . . . . . . . . . . . . . . . . . . . . . . . . . . . . . . . . . . . . . . IV-10
Global market . . . . . . . . . . . . . . . . . . . . . . . . . . . . . . . . . . . . . . . . . . . . . . . . . . . . . . . . . . . . . . . . IV-17 Production . . . . . . . . . . . . . . . . . . . . . . . . . . . . . . . . . . . . . . . . . . . . . . . . . . . . . . . . . . . . . . . . IV-17 Demand . . . . . . . . . . . . . . . . . . . . . . . . . . . . . . . . . . . . . . . . . . . . . . . . . . . . . . . . . . . . . . . . . . IV-19
Part V: Pricing and related information . . . . . . . . . . . . . . . . . . . . . . . . . . . . . . . . . . . . . . . . . . . . V-1
Factors affecting prices . . . . . . . . . . . . . . . . . . . . . . . . . . . . . . . . . . . . . . . . . . . . . . . . . . . . . . . . . V-1 Raw materials . . . . . . . . . . . . . . . . . . . . . . . . . . . . . . . . . . . . . . . . . . . . . . . . . . . . . . . . . . . . . V-1 Exchange rates . . . . . . . . . . . . . . . . . . . . . . . . . . . . . . . . . . . . . . . . . . . . . . . . . . . . . . . . . . . . . V-2 U.S. inland transportation costs . . . . . . . . . . . . . . . . . . . . . . . . . . . . . . . . . . . . . . . . . . . . . . . . V-2 Futures market . . . . . . . . . . . . . . . . . . . . . . . . . . . . . . . . . . . . . . . . . . . . . . . . . . . . . . . . . . . . . V-3

iii
CONTENTS
Part V: Pricing and related information–Continued Page
Pricing practices . . . . . . . . . . . . . . . . . . . . . . . . . . . . . . . . . . . . . . . . . . . . . . . . . . . . . . . . . . . . . . V-4 Pricing methods . . . . . . . . . . . . . . . . . . . . . . . . . . . . . . . . . . . . . . . . . . . . . . . . . . . . . . . . . . . . V-4 Sales terms and discounts . . . . . . . . . . . . . . . . . . . . . . . . . . . . . . . . . . . . . . . . . . . . . . . . . . . . V-5 Price leadership . . . . . . . . . . . . . . . . . . . . . . . . . . . . . . . . . . . . . . . . . . . . . . . . . . . . . . . . . . . . V-6 Nonsubject country price comparisons . . . . . . . . . . . . . . . . . . . . . . . . . . . . . . . . . . . . . . . . . . V-6
Price data . . . . . . . . . . . . . . . . . . . . . . . . . . . . . . . . . . . . . . . . . . . . . . . . . . . . . . . . . . . . . . . . . . . V-6 Price trends . . . . . . . . . . . . . . . . . . . . . . . . . . . . . . . . . . . . . . . . . . . . . . . . . . . . . . . . . . . . . . . V-7 Price comparisons . . . . . . . . . . . . . . . . . . . . . . . . . . . . . . . . . . . . . . . . . . . . . . . . . . . . . . . . . . V-14
Appendixes
A. Federal Register notices and the Commission’s statement on adequacy . . . . . . . . . . . . . . . . . . A-1 B. Hearing witnesses . . . . . . . . . . . . . . . . . . . . . . . . . . . . . . . . . . . . . . . . . . . . . . . . . . . . . . . . . . . . B-1 C. Summary data . . . . . . . . . . . . . . . . . . . . . . . . . . . . . . . . . . . . . . . . . . . . . . . . . . . . . . . . . . . . . . . C-1 D. Responses of U.S. extractor/processors, U.S. growers, U.S. importers, and U.S. purchasers concerning the significance of the antidumping duty finding and the likely effects of revocation D-1 E. Monthly price and quantity data . . . . . . . . . . . . . . . . . . . . . . . . . . . . . . . . . . . . . . . . . . . . . . . . E-1
Note.--Information that would reveal confidential operations of individual concerns may not be published and therefore has been deleted from this report. Such deletions are indicated by asterisks.


1
UNITED STATES INTERNATIONAL TRADE COMMISSION
Investigation No. 731-TA-1089 (Review)
CERTAIN ORANGE JUICE FROM BRAZIL
DETERMINATION
On the basis of the record1 developed in the subject five-year review, the United States International Trade Commission (Commission) determines, pursuant to section 751(c) of the Tariff Act of 1930 (19 U.S.C. ' 1675(c)), that revocation of the antidumping duty order on certain orange juice from Brazil would not be likely to lead to continuation or recurrence of material injury to an industry in the United States within a reasonably foreseeable time.
BACKGROUND
The Commission instituted this review on February 1, 2011 (76 FR 5822, February 2, 2011) and
determined on May 9, 2011 that it would conduct a full review (76 FR 30197, May 24, 2011). Notice of the scheduling of the Commission=s review and of a public hearing to be held in connection therewith was given by posting copies of the notice in the Office of the Secretary, U.S. International Trade Commission, Washington, DC, and by publishing the notice in the Federal Register on July 14, 2011 (76 FR 43344, July 20, 2012). The hearing was held in Washington, DC, on January 24, 2012, and all persons who requested the opportunity were permitted to appear in person or by counsel.
1 The record is defined in sec. 207.2(f) of the Commission=s Rules of Practice and Procedure (19 CFR ' 207.2(f)).


3
VIEWS OF THE COMMISSION
Based on the record in this five-year review, we determine under section 751(c) of the Tariff Act of 1930, as amended (the Act), that revocation of the antidumping duty order on certain orange juice from Brazil is not likely to lead to continuation or recurrence of material injury to an industry in the United States within a reasonably foreseeable time.
I. BACKGROUND
On February 8, 2006, the Commission, by a three-to-three vote, found that an industry in the
United States was materially injured by reason of imports of certain orange juice from Brazil that were sold at less than fair value.1 In subsequent remand proceedings ordered by the U.S. Court of International Trade (“CIT”), the Commission, again by a three-to-three vote, reached an affirmative determination.2
The Commission instituted this review on February 1, 2011.3 Five entities filed responses to the notice of institution: (1) Florida Citrus Mutual (“FCM”), Citrus World, Inc, (“Citrus World”) and Peace River Citrus Products, Inc. (“Peace River”); (2) Southern Gardens Citrus Processing Corp. (“Southern Gardens”); (3) Fischer S.A. Comercio, Industria and Agricultura (“Fischer”); (4) Louis Drefyus Citrus, Inc. and Louis Dreyfus Commodities Agroindustrial S.A. (“Louis Dreyfus”); and (5) Cutrale USA and Citrus Products (“Cutrale”).4 The Commission found that both the domestic interested party group response and the respondent interested party group response to the notice of institution were adequate and, therefore, determined that it would conduct a full review.5 6
In this five-year review, the domestic interested parties FCM, Citrus World, Peace River, and Southern Gardens appeared at the hearing and filed briefs.7 Respondents Louis Dreyfus, Cutrale, and Citrosuco North America, Inc. (“Citrosuco”) (hereafter collectively referred to as “Respondents”)
1Certain Orange Juice from Brazil, Inv. No. 731-TA-1089 (Final), USITC Pub. 3838 (March 2006) (“Original Determination”).
2Respondent Tropicana Products, Inc. (“Tropicana”), an importer and domestic producer of certain orange juice, appealed the Commission’s affirmative determination to the CIT. On April 12, 2007, the CIT remanded the case to the Commission. Tropicana Products, Inc. v. United States, 484 F.Supp. 1330 (CIT 2007) (“Tropicana I”). In the first remand, the Commission reached an affirmative determination. Certain Orange Juice from Brazil, Inv. No. 731-TA-1089 (Final) (First Remand), USITC Pub. 3930 (June 2007). On September 19, 2007, the CIT remanded the case to the Commission for a second time. Tropicana Products, Inc. v. United States, 2007 WL 2717874 (CIT 2007) (“Tropicana II”). In the second remand, the Commission again reached an affirmative determination. Certain Orange Juice from Brazil, Inv. No. 731-TA-1089 (Final) (Second Remand), USITC Pub. 3958 (October 2007). On February 5, 2008, the CIT affirmed the Commission’s affirmative second remand determination in Tropicana Products, Inc. v. United States, Court No. 06-00109 (Slip Op. 08-17) (“Tropicana III”).
3Confidential Staff Report/Public Staff Report (“CR/PR”) at I-1 & n.2. 4CR/PR at I-1 & n. 2. 5Orange Juice From Brazil; Notice of Commission Determination To Conduct a Full Five-Year Review
Concerning the Antidumping Duty Order On Orange Juice From Brazil, 76 FR 30197 (May 24, 2011). 6Commerce conducted an expedited review of the antidumping duty order and issued the final
results of its sunset review on May 26, 2011. 76 Fed. Reg. 30655 (May 26, 2011). 7Domestic producer Tropicana Products, Inc. (“Tropicana”) submitted a two-page statement of information
to the Commission on January 20, 2012. Tropicana ***. CR/PR at Table I-5. In the original investigation, the majority of the processing segment of the U.S. industry opposed the petition. In these reviews, processors that account for *** percent of domestic production opposed the continuation of the order. CR/PR at Table I-5.

4
participated in the hearing and filed briefs. Importer/purchaser The Coca-Cola Company also participated in the hearing and filed briefs.8
The Commission sent producer questionnaires to 25 extractors/processors of orange juice, eight of which provided the Commission with usable responses. The eight responding firms providing usable responses are believed to account for virtually all U.S. orange juice production in crop year (“CY”) 2010/11.9 The Commission sent grower questionnaires to 410 growers of oranges used for the production of orange juice, 19 of which provided the Commission with usable responses.10
The Commission sent importer questionnaires to 36 firms believed to be importers of the subject merchandise and to all U.S. extractors/processors of orange juice. Usable questionnaire responses were received from nine firms, accounting for virtually all imports from Brazil during the period of review.11
The Commission sent foreign producer questionnaires to 23 Brazilian firms believed to process and/or export orange juice. Questionnaire responses were received from four subject producers of orange juice and one Brazilian nonsubject producer that are believed to have accounted for 90 percent of Brazilian orange juice production in CY 2010/11.12
II. DOMESTIC LIKE PRODUCT AND INDUSTRY
A. Domestic Like Product
In making its determination under section 751(c) of the Act, the Commission defines “the domestic like product” and the “industry.”13 The Act defines “domestic like product” as “a product which is like, or in the absence of like, most similar in characteristics and uses with, the article subject to an investigation under this subtitle.”14 The Commission’s practice in five-year reviews is to look to the like product definition from the original determination and any completed reviews and consider whether the record indicates any reason to revisit the prior findings.15
8The Minute Maid Company (“Minute Maid”), an importer of subject merchandise, is 100 percent owned by Coca-Cola. See e.g., CR/PR at Table I-6 & Minute Maid’s U.S. Importer Questionnaire at I-3.
9CR at I-17, PR at I-3. 10CR at I-17, PR at I-3. 11CR at I-19, PR at I-15. 12CR/PR at IV-10. 1319 U.S.C. § 1677(4)(A). 1419 U.S.C. § 1677(10); see, e.g., Cleo Inc. v. United States, 501 F.3d 1291, 1299 (Fed. Cir. 2007); NEC
Corp. v. Department of Commerce, 36 F. Supp. 2d 380, 383 (Ct. Int’l Trade 1998); Nippon Steel Corp. v. United States, 19 CIT 450, 455 (1995); Timken Co. v. United States, 913 F. Supp. 580, 584 (Ct. Int’l Trade 1996); Torrington Co. v. United States, 747 F. Supp. 744, 748-49 (Ct. Int’l Trade 1990), aff’d, 938 F.2d 1278 (Fed. Cir. 1991); see also S. Rep. No. 249, 96th Cong., 1st Sess. 90-91 (1979).
15See, e.g., Stainless Steel Sheet and Strip from Germany, Italy, Japan, Korea, Mexico, and Taiwan, Inv. Nos. 701-TA-382 and 731-TA-798-803 (Second Review), USITC Pub. 4244 (July 2011) at 6; Certain Carbon Steel Products from Australia, Belgium, Brazil, Canada, Finland, France, Germany, Japan, Korea, Mexico, Poland, Romania, Spain, Sweden, Taiwan, and the United Kingdom, Inv. Nos. AA1921-197 (Second Review), 701-TA-319, 320, 325-27, 348, and 350 (Second Review), and 731-TA-573-74, 576, 578, 582-87, 612, and 614-618 (Second Review), USITC Pub. 3899 (January 2007) at 31, n.117; Internal Combustion Industrial Forklift Trucks from Japan, Inv. No. 731-TA-377 (Second Review), USITC Pub. 3831 (December 2005) at 8-9; Crawfish Tail Meat from China, Inv. No. 731-TA-752 (Review), USITC Pub. 3614 (July 2003) at 4; Steel Concrete Reinforcing Bar from Turkey, Inv. No. 731-TA-745 (Review), USITC Pub. 3577 (February 2003) at 4.

5
In its expedited review of the antidumping duty order, Commerce defined the subject merchandise as follows:
Certain orange juice for transport and/or further manufacturing, produced in two different forms: (1) Frozen orange juice in a highly concentrated form, sometimes referred to as frozen concentrated orange juice for manufacture (FCOJM); and (2) pasteurized single-strength orange juice which has not been concentrated, referred to as not-from-concentrate (NFC). At the time of the filing of the petition, there was an existing antidumping duty order on frozen concentrated orange juice (FCOJ) from Brazil. See Antidumping Duty Order: Frozen Concentrated Orange Juice From Brazil, 52 FR 16426 (May 5, 1987). Therefore, the scope of the order with regard to FCOJM covers only FCOJM produced and/or exported by those companies which were excluded or revoked from the pre-existing antidumping order on FCOJ from Brazil as of December 27, 2004. Those companies are Cargill Citrus Limitada, Coinbra-Frutesp (SA), Fischer S.A. Comercio, Industria, and Agricultura, Montecitrus Trading S.A., and Sucocitrico Cutrale, S.A.
Excluded from the scope of the order are reconstituted orange juice and frozen concentrated orange juice for retail (FCOJR). Reconstituted orange juice is produced through further manufacture of FCOJM, by adding water, oils and essences to the orange juice concentrate. FCOJR is concentrated orange juice, typically at 42 Brix, in a frozen state, packed in retail-sized containers ready for sale to consumers. FCOJR, a finished consumer product, is produced through further manufacture of FCOJM, a bulk manufacturer’s product.16
As the scope definition indicates, only FCOJM produced and/or exported by five Brazilian
producers is subject to the order, while all NFC is subject merchandise. In the original investigation, the Commission addressed whether conventional FCOJM and NFC were separate domestic like products. Applying the traditional six-factor test, the Commission found that, on balance, these factors weighed in favor of finding a single domestic like product consisting of both conventional FCOJM and NFC.17
In this five-year review, both the domestic producers and the respondents agree with the single domestic like product definition used in the original investigation.18 The record in this review does not indicate any significant changes in the product at issue or any other appropriate circumstance warranting revisiting the Commission’s domestic like product definition.19 Thus, consistent with the Commission’s prior definition of the domestic like product, and given the lack of any information or argument warranting changing that definition, we again find a single domestic like product, consisting of both FCOJM and NFC orange juice, that is coextensive with Commerce’s scope. This opinion will refer to the domestic like product as “certain orange juice.”
16 Certain Orange Juice from Brazil: Final Results of the Expedited Sunset Review of the Antidumping Duty Order, 76 FR 30655 (May 26, 2011).
17All six Commissioners joined in this finding. Original Determination at 3 n.1. 18See e.g., FCM Prehearing Br. at 2; Southern Gardens Prehearing Br. at 3; Brazilian Respondents
Prehearing Br. at 3-4. 19See generally, CR at I-12 to I-16, PR at I-11 to I-13.

6
B. Domestic Industry
Section 771(4)(A) of the Act defines the relevant domestic industry as the “producers as a whole of a domestic like product, or those producers whose collective output of a domestic like product constitutes a major proportion of the total domestic production of the product.”20
In the original investigation, the Commission defined the domestic industry, in accordance with its like product definition, as all domestic extractors/processors of certain orange juice as well as orange growers.21 Both the domestic producers and the respondents agree with the definition of the domestic industry used in the original investigation.22 The record in this review indicates that the considerations that warranted inclusion of growers in the domestic industry have not changed.23 Accordingly, consistent with our definition of a single domestic like product, we define the domestic industry as all domestic extractors/processors of certain orange juice, as well as orange growers.
C. Related Parties
In the original investigation, the Commission found that four firms (Cargill Brazil, Cutrale,
Citrosuco, and Louis Dreyfus) were related parties under 19 U.S.C. § 1677(4)(B).24 Nevertheless, the Commission found that appropriate circumstances did not exist to exclude any firms from the domestic industry under the related parties provision.25
In this five-year review, Citrosuco, Cutrale USA, and Louis Dreyfus are related parties under the statute by virtue of the fact that they ***.26 Additionally, each of the three firms is a related party because *** during the period of review.27 No party has argued, however, that appropriate circumstances exist to exclude any of these firms from the domestic industry. We find that appropriate circumstances do not exist to exclude any firm from the domestic industry for the reasons discussed below.
Cutrale. Cutrale *** continuation of the order.28 In CY 2010/11, Cutrale accounted for *** percent of domestic orange juice production.29 Cutrale’s ratio of subject imports to domestic production ranged from *** percent to *** percent during the period of review.30 The company’s financial performance was *** the industry average for most of the period examined, although it was *** or ***
2019 U.S.C. § 1677(4)(A). In defining the domestic industry, the Commission’s general practice has been to include in the industry producers of all domestic production of the like product, whether toll-produced, captively consumed, or sold in the domestic merchant market, provided that adequate production-related activity is conducted in the United States. See United States Steel Group v. United States, 873 F. Supp. 673, 682-83 (Ct. Int’l Trade 1994), aff’d, 96 F.3d 1352 (Fed.Cir. 1996).
21Original Determination at 13-20, in which all six Commissioners joined. Id. at 3 n.1. 22See e.g., FCM Prehearing Br. at 2; Southern Gardens Prehearing Br. at 4; CR at I-16, PR at I-13. 23See e.g., CR at III-1 to III-8, PR at III-1 to III-5. 24Original Determination at 3 n.1., 12. 25Id. at 12-13. 26CR/PR at Table I-5. 27CR/PR at Tables I-5 & III-10. 28CR/PR at Table I-5. 29CR/PR at Table I-5. 30CR/PR at Table III-10.

7
the industry average in two years earlier in the period.31 32 33 Cutrale’s financial performance compared to the rest of the industry, however, *** just as its ratio of imports to production ***.34 Neither the financial performance data nor anything else in the record indicates that Cutrale benefitted during the period of review because of its ownership by a Brazilian producer of the subject merchandise.
Citrosuco. Citrosuco *** continuation of the order.35 In CY 2010/11, Citrosuco accounted for *** percent of domestic orange juice production.36 Citrosuco’s ratio of subject imports to domestic production *** during the period of review, and was under *** percent in each of the last three years of the period.37 Citrosuco’s ratio of subject imports to domestic production was *** percent in CY 2005/2006, *** percent in CY 2006/07, *** percent in CY 2007/08, *** percent in CY 2008/09, *** percent in CY 2009/10, and *** percent in CY 2010/11.38 The record does not reflect that Citrosuco actually derived any significant financial benefits from its corporate relationship with its Brazilian parent or from its subject imports. Although the company’s financial performance was *** in CY 2007/08 and 2008/09, it was *** the industry average in CY 2010/11, when Citrosuco was ***.39 Moreover, Citrosuco’s financial performance relative to the industry average *** in CY 2007/08 and 2008/09 when its ratio of imports to production ***.40
Louis Dreyfus. Louis Dreyfus *** continuation of the order.41 In CY 2010/11, Louis Dreyfus accounted for *** percent of domestic orange juice production.42 Its ratio of subject imports to domestic production was *** throughout the period of review except for CY 2010/11, when it was only *** percent.43 The record does not indicate that Louis Dreyfus actually derived any significant financial benefits from its affiliation with its Brazilian parent or from its small quantity of subject imports.44
Given the above, and as neither the domestic industry nor the Brazilian respondents have raised any issue regarding related parties in this five-year review, we include Citrosuco, Cutrale USA, and Louis
31CR/PR at Table III-15. 32Consistent with her practice in past investigations and reviews, Commissioner Shara L. Aranoff does not
rely on individual-company operating income margins, which reflect a domestic producer’s financial operations related to production of the domestic like product, in assessing whether a related party has benefitted from importation of subject merchandise. Rather, she determines whether to exclude a related party based principally on its ratio of subject imports to domestic production and whether its primary interests lie in domestic production or importation.
33Commissioner Pinkert does not rely upon companies’ financial performance as a factor in determining whether there are appropriate circumstances to exclude them from the domestic industry in these reviews. The record is not sufficient to infer from their profitability on U.S. operations whether they have derived a specific benefit from importing. See Allied Mineral Products v. United States, 28 CIT 1861, 1865-67 (2004).
34CR/PR at Tables III-10 & III-15. 35CR/PR at Table I-5. 36CR/PR at Table I-5. 37 CR/PR at Table III-10. 38CR/PR at Table III-10. 39CR/PR at Table III-15. 40CR/PR at Tables III-10 & III-15. 41CR/PR at Table I-5. 42CR/PR at Table I-5. 43CR/PR at Table III-10. 44CR/PR at Tables III-15 & III-19.

8
Dreyfus in the domestic industry. Accordingly, we define the domestic industry to include both orange growers and all domestic extractors/processors of certain orange juice.
III. REVOCATION OF THE ORDER ON SUBJECT IMPORTS FROM BRAZIL IS NOT
LIKELY TO LEAD TO THE CONTINUATION OR RECURRENCE OF MATERIAL INJURY WITHIN A REASONABLY FORESEEABLE TIME
A. Legal Standard In A Five-Year Review
In a five-year review conducted under section 751(c) of the Act, Commerce will revoke an
antidumping or countervailing duty order unless (1) it makes a determination that dumping or subsidization is likely to continue or recur and (2) the Commission makes a determination that revocation of the antidumping or countervailing duty order “would be likely to lead to continuation or recurrence of material injury within a reasonably foreseeable time.”45 The SAA states that “under the likelihood standard, the Commission will engage in a counterfactual analysis; it must decide the likely impact in the reasonably foreseeable future of an important change in the status quo – the revocation or termination of a proceeding and the elimination of its restraining effects on volumes and prices of imports.”46 Thus, the likelihood standard is prospective in nature.47 The U.S. Court of International Trade has found that “likely,” as used in the five-year review provisions of the Act, means “probable,” and the Commission applies that standard in five-year reviews.48 49
The Act states that “the Commission shall consider that the effects of revocation or termination may not be imminent, but may manifest themselves only over a longer period of time.”50 According to
45 19 U.S.C. § 1675a(a). 46 SAA at 883-84. The SAA states that “{t}he likelihood of injury standard applies regardless of the nature
of the Commission’s original determination (material injury, threat of material injury, or material retardation of an industry). Likewise, the standard applies to suspended investigations that were never completed.” Id. at 883.
47 Although the SAA states that “a separate determination regarding current material injury is not necessary,” it indicates that “the Commission may consider relevant factors such as current and likely continued depressed shipment levels and current and likely continued {sic} prices for the domestic like product in the U.S. market in making its determination of the likelihood of continuation or recurrence of material injury if the order is revoked.” SAA at 884.
48 See NMB Singapore Ltd. v. United States, 288 F. Supp. 2d 1306, 1352 (Ct. Int’l Trade 2003) (“‘likely’ means probable within the context of 19 U.S.C. § 1675(c) and 19 U.S.C. § 1675a(a)”), aff’d mem., 140 Fed. Appx. 268 (Fed. Cir. 2005); Nippon Steel Corp. v. United States, 26 CIT 1416, 1419 (2002) (same); Usinor Industeel, S.A. v. United States, 26 CIT 1402, 1404 nn.3, 6 (2002) (“more likely than not” standard is “consistent with the court’s opinion”; “the court has not interpreted ‘likely’ to imply any particular degree of ‘certainty’”); Indorama Chemicals (Thailand) Ltd. v. United States, Slip Op. 02-105 at 20 (Ct. Int’l Trade Sept. 4, 2002) (“standard is based on a likelihood of continuation or recurrence of injury, not a certainty”); Usinor v. United States, 26 CIT 767, 794 (2002) (“‘likely’ is tantamount to ‘probable,’ not merely ‘possible’”).
49 For a complete statement of Chairman Okun’s interpretation of the likely standard, see Additional Views of Vice Chairman Deanna Tanner Okun Concerning the “Likely” Standard in Certain Seamless Carbon and Alloy Steel Standard, Line and Pressure Pipe From Argentina, Brazil, Germany, and Italy, Invs. Nos. 701-TA-362 (Review) and 731-TA-707 to 710 (Review) (Remand), USITC Pub. 3754 (Feb. 2005).
50 19 U.S.C. § 1675a(a)(5).

9
the SAA, a “‘reasonably foreseeable time’ will vary from case-to-case, but normally will exceed the ‘imminent’ timeframe applicable in a threat of injury analysis in original investigations.”51
Although the standard in a five-year review is not the same as the standard applied in an original antidumping duty investigation, it contains some of the same fundamental elements. The statute provides that the Commission is to “consider the likely volume, price effect, and impact of imports of the subject merchandise on the industry if the orders are revoked or the suspended investigation is terminated.”52 It directs the Commission to take into account its prior injury determination, whether any improvement in the state of the industry is related to the order or the suspension agreement under review, whether the industry is vulnerable to material injury if the orders are revoked or the suspension agreement is terminated, and any findings by Commerce regarding duty absorption pursuant to 19 U.S.C.§ 1675(a)(4).53 The statute further provides that the presence or absence of any factor that the Commission is required to consider shall not necessarily give decisive guidance with respect to the Commission’s determination.54
B. Conditions of Competition
In evaluating the likely impact of the subject imports on the domestic industry if the order were
revoked, the statute directs the Commission to consider all relevant economic factors “within the context of the business cycle and conditions of competition that are distinctive to the affected industry.”55
1. The Original Investigation
In the original investigation, the Commission found that the domestic supply of orange juice was
partly, but not exclusively, a function of the size of the Florida orange crop, which fluctuated significantly during the period examined because of weather conditions, including hurricanes, near the end of the period.56 Besides crop size, the Commission emphasized that the domestic supply of orange juice was also a function of domestic inventories.57
In the original investigation, the largest source of supply of certain orange juice in the U.S. market consisted of domestic production and inventories.58 The second largest source of supply to the U.S. market was Brazil.59 Moreover, the Commission found that nonsubject imports, both from Brazil
51 SAA at 887. Among the factors that the Commission should consider in this regard are “the fungibility or differentiation within the product in question, the level of substitutability between the imported and domestic products, the channels of distribution used, the methods of contracting (such as spot sales or long-term contracts), and lead times for delivery of goods, as well as other factors that may only manifest themselves in the longer term, such as planned investment and the shifting of production facilities.” Id.
5219 U.S.C. § 1675a(a)(1). 5319 U.S.C. § 1675a(a)(1). We note that Commerce made no duty absorption findings. 5419 U.S.C. § 1675a(a)(5). Although the Commission must consider all factors, no one factor is necessarily
dispositive. SAA at 886. 5519 U.S.C. § 1675a(a)(4). 56Original Determination at 14-15. 57Id. at 15. 58Id. 59Id.

10
and from other countries, increased slightly overall during the period examined, although they had a smaller presence in the U.S. market than either the domestic like product or subject imports.60
With regard to demand, the Commission found that the United States was the largest market for orange juice in the world and that domestic demand for certain orange juice was primarily a function of demand for downstream products using FCOJM and NFC, predominantly retail orange juice.61 The record indicated that apparent U.S. consumption of the domestic like product increased modestly by 3.5 percent overall during the period examined.62
The Commission found that the domestic like product and subject imports were interchangeable.63
It also found that most retail orange juice sold in the United States consisted of a blend of domestic, Brazilian, and sometimes third country juice.64
2. The Current Review
a. Supply Conditions
As before, a key condition of competition in the U.S. market is that the supply of certain orange
juice is primarily a function of the orange crop size. Round oranges are the essential input in the production of certain orange juice and account for approximately 80 percent of the value of certain orange juice.65 Round oranges are a highly perishable product. Extractors/processors do not inventory round oranges; rather, all harvested oranges are processed promptly regardless of the immediate demand for juice. The vast majority of oranges that are processed in the United States are grown in Florida.66 Florida early season oranges (Hamlin) are typically harvested between October and December, and late season oranges (Valencia) are typically harvested between March and June.67 Processors must maintain sufficient capacity to process oranges efficiently at the peak of the harvest, leaving capacity largely idle the rest of the year. Given these constraints, the capacity utilization data for extractors/processors have limited probative value. More useful for considering domestic supply are data on bearing acreage and orange production. Bearing acreage in Florida steadily declined in each year of the period of review, from 491,000 acres in CY 2005/06 to 440,000 acres in CY 2010/11, a decline of 10.4 percent.68
Supply of certain orange juice is a function of inventories as well as crop size. Given that a certain volume of inventory must be maintained in order to meet year-round demand for orange juice due to the seasonal nature of orange production and the inherent volatility in the domestic supply of round oranges, U.S. extractor/processors of certain orange juice generally have had some ability to use
60Id. at 15-16. 61Id. 62Id. 63Id. at 36. 64Id. at 16. 65CR at II-8, PR at II-7. 66CR/PR at Table III-2. 67CR at III-19, PR at III-15. 68CR/PR at Table III-2.

11
inventories as a means of supplying the U.S. market.69 NFC can be stored in inventory for up to one year, and FCOJM can be stored for two to three years.70
In addition, orange juice processors face significant year-to-year fluctuations in the supply of round oranges. These fluctuations result from both weather conditions (e.g., freezes, hurricanes, and droughts) and other factors, including citrus diseases (e.g., citrus canker and citrus greening). During the period of review, weather and disease both played a critical role in the volume of round oranges available for processing. Florida orange groves were seriously damaged by a series of four hurricanes during CY 2005/06 and CY 2006/07.71 These hurricanes destroyed fruit, damaged and killed trees, damaged citrus grove machinery and equipment, and spread citrus canker.72 Consequently, the Florida orange crop declined from 147.7 million boxes in CY 2005/06 to 129.0 million boxes in CY 2006/07.73 The crop then rebounded somewhat with period-high crop years in CY 2007/08 (170.2 million boxes) and CY 2008/09 (162.5 million boxes).74
Toward the end of the period of review, citrus greening emerged as a critical challenge to Florida orange production because it kills trees (including young replanted trees), spreads rapidly, has no known cure, and can only be slowed through frequent and expensive pesticide treatments.75 Due mainly to citrus disease, the Florida orange crop fell to 133.7 million boxes in CY 2009/10 and 140.3 million boxes in CY 2010/11.76 Although the domestic industry is investing heavily in research to address citrus diseases, there is little prospect for significant growth in the Florida crop size in the reasonably foreseeable future and some likelihood that the crop size could decline further. Facing an increasing degree of supply insecurity and crop sizes much lower than during the original period examined, domestic processors/extractors have invested in additional capacity for stockpiling inventories of certain orange juice.77 While the Commission found in the original investigation that producers required 12 weeks of opening stocks at the start of the crop year and preferred to have 16 weeks supply on hand at that time, the record in this review indicates that producers now consider even more weeks of inventory to be essential.78 In addition, extractors/processors have increasingly turned to long-term contracts with growers, which provide incentive to growers to maintain production levels in the face of weather and disease challenges by providing protection against adverse price swings, thereby helping ensure that processors will have adequate supplies.79 Thus, during the period of review, such contracts were more prevalent in the U.S. market than they were during the original period examined.80
The U.S. market for certain orange juice is supplied by the domestic industry, subject imports, Brazilian nonsubject imports, and nonsubject imports from other sources. During the period of review, the domestic industry maintained its dominant share of the U.S market. Despite some intermediate
69CR/PR at II-7 to II-8. 70CR at III-19, PR at III-15. 71CR at II-7, PR at II-6. 72Hearing Tr. at 40, 49. 73CR/PR at Table III-2. 74CR/PR at Table III-2. 75CR at III-4, PR at III-2. 76CR/PR at Table III-2. 77CR/PR at Table III-2. 78See e.g., Hearing Tr. at 66, 75; Petitioners’ Post-Hearing Br., Answers to Commissioners Questions at p.
6. 79Hearing Tr. at 15 (Dunn); CR at V-6, PR at V-5. 80CR at V-5 to V-6, PR at V-5.
12
fluctuations, U.S. producers’ market share showed little change from CY 2005/2006, when it was 77.6 percent, to CY 2010/11, when it was 77.5 percent.81
The second largest source of supply to the U.S. market is Brazil.82 The market share of subject imports from Brazil during the period ranged from *** percent in CY 2010/11 to *** percent in CY 2007/08.83 The market share of nonsubject imports from Brazil ranged from *** percent in CY2007/08 to *** percent in CY 2009/10.84 There are seasonal differences between the orange crop harvest in the United States and that in Brazil. Due to geographic and climate differences, Brazil’s harvest season for growing oranges used for processing FCOJM and NFC differs from that in the United States. Brazil’s harvest season begins in July, three months earlier than the Florida harvest begins in the United States, and finishes in January, five months earlier than the Florida harvest ends in the United States.85 Because there is little consumption of processed orange juice in Brazil, the Brazilian industry is largely focused on export markets.86 The EU is Brazil’s largest market, and Asia has replaced the United States as its second largest market.87
During the period of review, the portion of the U.S. market not served by domestic production and Brazilian subject and nonsubject imports was supplied by nonsubject imports from other countries, principally Mexico and Costa Rica.88 The market share of non-Brazilian nonsubject imports ranged from 7.1 percent in CY 2005/06 to 12.8 percent in CY 2007/08.89
The ICE Futures U.S. futures market for FCOJM plays a role in the U.S. market for certain orange juice.90 The FCOJM futures market helps determine pricing for certain orange juice and is used to manage risk, but does not typically involve a significant amount of actual physical delivery of the product.91
81CR/PR at Table C-5. 82In May 2010, Citrosuco, which is owned by subject producer Fischer, and Citrovita Agro Industrial, Ltda.
(“Citrovita”), a Brazilian nonsubject producer, announced that they would combine operations. CR at IV-10 to IV- 11, PR at IV-10. The timetable, if any, for consummation of this transaction is not clear. CR at IV-11, PR at IV-10; Hearing Tr. at 216. Moreover, neither Citrosuco nor Citrovita has requested that Commerce institute a successor-in- interest or changed circumstances review. In light of this record, we reject as speculative the domestic interested parties’ request that we consider likely future imports from Citrovita to be subject imports. Consequently, we continue to treat imports from Citrosuco as subject imports and imports from Citrovita as nonsubject imports for purposes of this review. In support of its position on this issue, the domestic industry mistakenly relies upon the Commission’s prior determinations in Frozen Concentrated Orange Juice from Brazil, 731-TA-326 (Second Review), USITC Pub. 3760 at 13 n.84 (March 2005) and Prestressed Concrete Steel Wire Strand from Brazil, India, Japan, Korea, Mexico, and Thailand, Inv. Nos. 701-TA-432 & 731-TA-1024-1028 (Review) & AA1921-188 (Third Review), Staff Report, 2009 ITC LEXIS 2255 at *113-*114 (Nov. 2009). Unlike in Frozen Concentrated Orange Juice from Brazil and Prestressed Concrete Steel Wire Strand, where the mergers in question had already been consummated, that is not the case in this review.
83CR/PR at Table C-5. 84CR/PR at Table C-5. 85Hearing Tr. at 122-23. 86CR/PR at Table IV-7. 87CR at II-12, PR at II-9; CR/PR at Table IV-7. 88CR at II-14, PR at II-11. 89CR/PR at Table C-5. 90 CR/PR at V-3 & V-5. 91CR/PR at V-3.

13
b. Demand Conditions
Apparent U.S. consumption of certain orange juice declined by 16.5 percent overall during the period of review.92 Consumption was 1.3 billion gallons in CY 2005/06, 1.2 billion gallons in CY 2006/2007, 1.1 billion gallons in CY 2007/08, 1.2 billion gallons in CY 2008/09, and 1.1 billion gallons in CY 2009/10.93 Although low-carbohydrate diets were blamed for some decline in consumption during the original period examined, industry participants contend that apparent U.S. consumption for certain orange juice declined during the period of review, at least in part due to competing retail consumer preferences for other juice beverages in the U.S. market.94
Both the domestic industry and the Brazilian respondents indicated that, during the period of review, there was an ongoing shift in retail consumer demand from FCOJM to NFC orange juice.95 NFC is used to make “not from concentrate” retail orange juice, which is marketed to consumers as a premium product that is perceived to be fresher.96 The record reflects that U.S. consumption of NFC orange juice has increased since CY 2007/08 and that consumption of FCOJM has declined steadily since CY 2007/08.97 Nevertheless, the record also reflects that U.S. consumption of both FCOJM and NFC orange juice fluctuated significantly during the period of review, both in absolute terms and relative to each other.98
c. Substitutability and Other Conditions of Competition
There is a relatively high degree of substitutability between domestically produced certain orange
juice and subject imports from Brazil.99 Four of five extractor/processors, six of seven importers, and 17 of 20 purchasers indicated that U.S.-produced FCOJM and imports of FCOJM from Brazil are either “always” or “frequently” used interchangeably.100 With respect to NFC, four of six extractor/processors, four of five responding importers, and eight of ten responding purchasers indicated that U.S.-produced NFC and subject imports of NFC from Brazil are either “always” or “frequently” used interchangeably.101
Many extractors/processors blend their own domestic orange juice with subject imports, and the record reflects that blending is an important condition of competition in the U.S. market.102 Different
92CR/PR at Table C-5. 93CR/PR at Table C-5. 94 CR at II-19, PR at II-15. 95Hearing Tr. at 131-132. 96CR at I-12 to I-13, PR at I-11. 97CR/PR at Table I-7. As a result of the growth in the NFC market, several U.S. producers added storage
tank capacity needed for this bulkier product. See CR/PR at Table III-24. 98CR/PR at Table I-7. 99CR at II-21, PR at II-16; CR/PR at Table II-10. 100CR/PR at Table II-10. 101CR/PR at Table II-10. 102See, e.g., CR at III-12, PR at III-8; CR/PR at Table III-6. Five of eight extractor/processors reported that
blending domestically produced orange juice with imported orange juice is necessary in order to satisfy U.S. industry standards, meet supply deficiencies, or for other reasons. CR at II-15, PR at II-12. Five extractor/processors, eight of nine responding importers, and nine of 19 responding purchasers also indicated that blending is needed to achieve the necessary quantities demanded, and four extractor/processors stated that imports are necessary to meet customer quality standards. Id.

14
varieties of round oranges, or even the same variety at different stages of ripeness, can produce juice with varying color, viscosity, and other characteristics. Blending permits producers to manufacture orange juice of consistent quality to satisfy customer preferences.103 Although blending is a common practice, the goal of achieving a marketable juice product can be achieved with or without imported juice in the blend if adequate domestic supplies are available. Some processors are able to achieve their product quality and consistency goals using just domestic oranges. They or their customers market these products at retail as 100-percent Florida orange juice. At the end of the period examined, domestic producer Tropicana announced that it was switching its premium NFC product from an import/domestic blend to an all-domestic product, indicating that production of 100 percent domestic NFC is likely to increase in the reasonably foreseeable future.104
We find that these conditions of competition for certain orange juice from Brazil are likely to persist in the reasonably foreseeable future and provide us with a reasonable basis on which to assess the effects of revocation of the order.
C. Likely Volume
In evaluating the likely volume of imports of subject merchandise if the antidumping duty order
is revoked, the Commission is directed to consider whether the likely volume of imports would be significant either in absolute terms or relative to production or consumption in the United States.105 In doing so, the Commission must consider “all relevant economic factors,” including four enumerated factors: (1) any likely increase in production capacity or existing unused production capacity in the exporting country; (2) existing inventories of the subject merchandise, or likely increases in inventories; (3) the existence of barriers to the importation of the subject merchandise into countries other than the United States; and (4) the potential for product shifting if production facilities in the foreign country, which can be used to produce the subject merchandise, are currently being used to produce other products.106
1. The Original Investigation
In the original investigation, the Commission found that the volume of Brazilian subject imports
was significant, both in absolute terms and relative to domestic production and consumption.107 By quantity, subject imports increased by 122.0 million gallons, or 111.2 percent, during the period examined.108 Subject imports’ share of the U.S. market more than doubled during the period examined, climbing from 7.6 percent in CY 2001/02 to 15.4 percent in CY 2004/05, while domestic producers’ share of the U.S. market fell by 10.7 percentage points overall during the period.109 Although nonsubject imports’ share of the U.S. market increased by 2.8 percentage points overall during the period, the
103See, e.g., CR at III-12, PR at III-8. 104Letter from Tropicana Products, Inc. (Jan. 20, 2012) at 1. 10519 U.S.C. § 1675a(a)(2). 10619 U.S.C. § 1675a(a)(2)(A-D). 107USITC Pub. 3838 at 17. 108Id. at 17. 109Id. at 18.
15
Commission found that subject imports gained far more market share at the expense of the domestic industry than did nonsubject imports.110 111 112
2. The Current Review
The quantity of subject imports fell overall by *** percent during the period of review.113 The
quantity of subject imports increased from *** million gallons in CY 2005/06 to its peak levels in CY 2006/07 (*** million gallons) and CY 2007/08 (*** million gallons).114 Subject imports dropped to *** million gallons in CY 2008/09, increased to *** million gallons in CY 2009/10, and then dropped to *** million gallons in CY 2010/11, a period low.115 Subject import market share increased from *** percent in CY 2005/06 to *** percent in CY 2006/07, and increased again to *** percent in CY 2007/08.116
Subject import market share dropped to *** percent in CY 2008/09, recovered slightly to *** percent in CY 2009/10, and then fell to *** percent in CY 2010/11, a period low.117 In sum, the subject imports maintained a presence in the U.S. market during the period of review, at times at levels higher than those observed during the original investigation.118 Recent levels, however, are considerably below those deemed to be significant during the original investigation and are also below those observed earlier in the period of review.
Several considerations lead us to conclude that, upon revocation of the order, subject import volumes will not likely increase significantly from their most recent levels. First, during the latter portion of the period of review, subject producers faced significant supply constraints. The Brazilian orange juice industry, like the U.S. industry in Florida, has been affected by citrus disease, including citrus greening,
110Id. at 19. 111In the original investigation, the three dissenting Commissioners (then Vice-Chairman Okun and
Commissioners Hillman and Pearson) found that subject imports supplemented and complemented domestic production and therefore were not significant relative to production. They found that the increase in subject imports enabled U.S. processors both to meet U.S. demand and maintain acceptable inventory levels, and that the level of subject imports was inversely related to the level of U.S. production. See, e.g., Original Determination, Dissenting Views at 59-63.
112To a large extent, the Court’s remand instructions in Tropicana I focused upon the Commission’s discussion in its original determination regarding the concept of “residual demand” in its volume analysis. On remand, the Commission defined residual demand as “the difference between demand . . . and production plus available inventories.” First Remand Determination at 5. In short, the Commission found that the volume of subject imports entering the U.S. market during that crop year (i.e., CY 2004/05), as in every other year of the period of investigation, was higher than necessary to meet residual demand and limited the ability of domestic producers to sell their available supply, inclusive of inventories, in the domestic market at non-suppressed prices. Id. at 11. It therefore found that the increase in the volume of low-priced subject imports in excess of U.S. apparent consumption growth, in the absence of any residual demand that needed to be met by subject imports, was significant. Id. at 11- 12. The Court sustained the Commission’s analysis of the residual demand issue in Tropicana II. Id. at 13-15.
113CR/PR at Table C-5. 114CR/PR at Table C-5. 115CR/PR at Table C-5. 116CR/PR at Table C-5. 117CR/PR at Table C-5. 118 During the original investigation, the market share of subject imports from Brazil peaked at 15.9 percent
in CY 2002/03. During the period of review, notwithstanding the presence of the antidumping duty order, subject import market share exceeded the level in the original investigation both in CY 2006/07 (*** percent) and CY 2007/08 (*** percent). CR/PR at Table I-2.

16
and adverse weather events.119 The area planted for growing orange bearing trees in Brazil declined between CY 2005/2006 and CY 2011/12, and it is projected to remain at period lows in CY 2012/13.120
The Brazilian orange crop, after rising from CY2005/06 through CY2007/08, fell sharply in CY2008/09, remained low the following year, then reached a period low in CY2010/11.121 The record reflects that Brazilian producers were so short of supply in CY 2009/10 that they exported a considerable volume of their U.S. inventories to Europe and Asia to meet commitments to customers in those markets.122 The result of these reduced harvests and Brazilian producers’ efforts to meet their global supply commitments was that Brazilian producers began the current crop year in July 2011 with very low stocks of FCOJM.123
Domestic producers argue that there is no current shortage in Brazilian supply, as evidenced by the CY2011/12 Brazilian bumper crop and the projected size of the CY 2012/13 crop.124 Although the CY 2011/12 Brazilian crop was large, a significant portion of the CY 2011/12 crop is necessarily being used in Brazil to rebuild inventories, following record low stock levels in CY 2010/11 that sank to as low as seven weeks of supply. Official projections of the Brazilian CY 2012/13 crop are for a somewhat smaller harvest, and we decline to give weight to domestic producers’ speculation that these official projections are understated.125 Rather, considering the prevalence of citrus greening in Brazil and the decline in orange acreage planted, we find it likely that subject orange juice production in Brazil is not likely to increase significantly in the reasonably foreseeable future.
Given the importance of adequate round orange supply to production of orange juice, we do not find that current Brazilian orange juice processing capacity is an indication of likely subject import volumes.126 127 The capacity utilization of subject Brazilian extractors/processors declined by 11.9 percentage points during the period of review, falling from 69.2 percent in CY 2005/06 to 57.3 percent in CY 2010/11.128 Nevertheless, we do not agree with the domestic industry that this increase in unused capacity makes significant additional subject import volumes likely.129 Excess processing capacity is not a relevant concern in the orange juice industry. As discussed above with regard to the conditions of competition, extractors/processors do not inventory round oranges; rather, all harvested oranges are processed regardless of the immediate demand for juice. Because of limitations in the round orange
119CR/PR at IV-7; Hearing Tr. at 77-78. 120The area planted in Brazil for growing orange trees fell slightly from 2.1 million acres in CY 2005/06 to
2.0 million acres in CY 2011/12. It is also projected to be 2.0 million acres in CY 2012/13. CR/PR at Table IV-4. 121CR/PR at Table IV-4. 122Hearing Tr. at 182. 123CR/PR at Table IV-4. 124CR/PR at Table IV-4. 125CR/PR at Table IV-4; Respondents’ Posthearing Br. at 9; Respondents Prehearing Br. at 43-44. 126The number of orange bearing trees in Brazil ranged from 214 million trees to 223 million trees during
the period of review and is projected to be 221 million trees in CY 2011/12. CR/PR at Table IV-4. 127The domestic industry further argues that the volume of subject imports from Brazil is likely to be
significant upon revocation of the order because the Brazilian orange crop peaked at the end of the period of review in CY 2011/12 and it is projected to be at near-peak levels in CY 2012/13. See e.g., FCM, Citrus World, and Peace River Prehearing Br. at 7-11. As discussed above, the record reflects that the Brazilian orange crop is projected to be approximately 12.1 percent lower in CY 2012/13, at 445 million boxes, than it was in CY 2011/12, at 506 million boxes. CR/PR at Table IV-4. Moreover, the Brazilian orange crop was below these levels in CY 2005/06 (406 million boxes), CY 2008/09 (413 million boxes), and CY 2009/10 (417 million boxes). Id.
128CR/PR at Table IV-7. 129See e.g., FCM, Citrus World, and Peace River Prehearing Br. at 9-10.
17
supply, total supplies of FCOJM in Brazil increased only very modestly during the period of review, and production by the subject producers declined.130 Because of limited round orange supply, subject producers are unlikely to be able to increase orange juice production appreciably in the reasonably foreseeable future. Consequently, Brazilian orange juice processors/extractors’ unused capacity has limited probative value for our analysis of likely import volume.
Second, current low levels of inventories of subject Brazilian orange juice are not likely to serve as a source of significantly increased subject imports. Although they fluctuated considerably during the period of review, Brazilian subject producers’ inventories declined by approximately 28.2 percent between CY 2005/06 and CY 2010/11.131 Moreover, the Brazilian industry’s inventories declined by approximately 44.1 percent between CY 2009/10 and CY 2010/11 and were at period-low levels.132
Given the current low levels of inventories and likely flat or declining orange production in Brazil, along with the need to maintain sufficient inventories to meet demand in all of their global markets, the Brazilian subject producers are likely to attempt to replenish and rebuild inventories – which are needed outside the peak orange processing season – rather than increase their exports significantly to the U.S. market in the short term.133
Third, subject import volume is unlikely to increase significantly upon revocation because the Brazilian industry is largely focused on export markets in the EU and Asia.134 The EU is by far Brazil’s largest export market, and Brazilian exports to Asia have replaced the United States as Brazil’s second largest export market.135 During the period of review, Brazilian subject producers shipped increasing volumes to the EU market. By quantity, Brazilian subject producers’ exports to the EU increased from 980.6 million pounds SE in CY 2005/06 to 993.0 million pounds SE in CY 2009/10.136 As a ratio to total shipments, Brazilian subject producers’ exports to the EU increased from 68.1 percent in CY 2005/06 to 70.4 percent in CY 2010/11.137 Brazilian subject producers submitted evidence of the growing importance of the EU market by using one-year contracts for that market.138 Moreover, prices for certain orange juice are higher in the EU market than in the United States, thereby giving Brazilian subject
130Subject producers’ end-of-period inventories were 267.4 million pounds SE in CY 2005/06, 241.8 million pounds SE in CY 2006/07, 408.0 million pounds SE in CY 2007/08, 374.9 million pounds SE in CY 2008/09, 343.8 million pounds SE in CY 2009/10, and 192.0 million pounds SE in CY 2010/11. CR/PR at Table IV-7.
131CR/PR at Table IV-7. 132CR/PR at Table IV-7. 133CR/PR at Tables IV-4 & IV-7. 134CR/PR at Table IV-7. 135CR at II-12, PR at II-9; CR/PR at Table IV-7. In the final year of the period of review, Brazilian subject
producers’ exports to Asia as a ratio to total shipments were 15.1 percent, while their exports to the United States were 8.7 percent of their total shipments. CR/PR at Table IV-7.
136CR/PR at Table IV-7. By value, Brazilian subject producers’ exports to the EU increased from $640.9 million in CY 2005/06 to $875.1 million in CY 2009/10. CR/PR at Table IV-7.
137End-of-period inventories were 267.4 million pounds SE in CY 2005/06, 241.8 million pounds SE in CY 2006/07, 408.0 million pounds SE in CY 2007/08, 374.9 million pounds SE in CY 2008/09, 343.8 million pounds SE in CY 2009/10, and 192.0 million pounds SE in CY 2010/11. As a ratio to production, such inventories were 19.8 percent in CY 2005/06, 16.8 percent in CY 2006/07, 28.0 percent in CY 2007/08, 29.6 percent in CY 2008/09, 25.5 percent in CY 2009/10, and 16.3 percent in CY 2010/11. CR/PR at Table IV-7.
138Hearing Tr. at 209 (Kalik) & Respondents Posthearing Br. at 12. Brazilian producers’ decision to bear the cost of exporting product stored in the United States to meet commitments in Europe during CY 2010/11 provides additional evidence of their commitment to European customers. See e.g., Hearing Tr. at 28 (Casper).

18
producers further incentive to remain committed to the EU market rather than to direct additional subject imports to the United States.139
Another reason that the subject imports will likely remain constrained is that subject producers maintain significant processing operations in the United States.140 As discussed above, the three major Brazilian subject producers (Cutrale, Fischer, and Louis Dreyfus) have wholly-owned or related U.S. processing affiliates.141 The U.S. affiliates of these Brazilian subject producers accounted for approximately *** percent of domestic production of certain orange juice in CY 2010/11.142 During the period of review, Brazilian firms also made substantial investments in their affiliates’ U.S. operations by investing in tank farms, vessels, and other infrastructure.143 144 Many of these investments target the NFC segment of the market, which is served only in a limited manner by subject imports. Citrosuco invested more than $200 million in its Florida processing and storage capacity for NFC, and reported that its imports were ***145 Cutrale also invested in an NFC tank farm in Florida. Coca-Cola reported a contract with Cutrale from an additional 31.5 million gallons of NFC storage for Florida Valencia juice, along with long-term contracts with Florida orange growers and assistance with grove development in the state.146
Finally, in December 2011, the U.S. Food and Drug Administration (FDA) reported that trace amounts of the banned fungicide carbendazim had been found in orange juice from Brazil. The FDA is currently testing both imported and domestic juice, and it will deny entry to shipments that test positive for carbendazim.147 The shipments that have been detained and/or refused entry into the U.S. market include both Brazilian FCOJM and NFC.148 As of February 16, 2012, 12 of 13 shipments of Brazilian orange juice to the United States tested positive (10 parts per billion or more) for carbendazim and were detained and/or refused entry into the U.S. market.149 Although the dimensions of this issue are still evolving, we determine that these current developments serve as a disincentive to significantly increased subject import volume.
In support of its argument that the volume of subject imports is likely to be significant upon revocation, the domestic parties have identified newly emerging regions for orange harvesting in Brazil. They point to an investment program by the Brazilian government encouraging Brazilian orange growers
139Hearing Tr. at 88-90. We recognize that *** Thus, this change would not represent any increase in the total volume of imports into the United States. See e.g., CR at D-16-17.
140Commissioner Pinkert does not join this paragraph. 141CR/PR at Table IV-3. 142CR/PR at Table I-5. 143CR at II-19 to II-20, PR at II-15; CR/PR at Tables III-4 & III-24; CR at III-9, PR at III-5 to III-6. U.S.
importers of subject juice from Brazil have also made substantial investments in the U.S. industry. See e.g., Hearing Tr. at 174-75 (Mr. Horrisberger discussing Coca-Cola’s commitments to the U.S. industry).
144We note that the record does not suggest the possibility of product shifting by subject producers in Brazil. Additionally, there are no antidumping duty orders or investigations in any other country concerning orange juice from Brazil. CR/PR at IV-7.
145CR/PR at Table III-10; Hearing Tr. at 159. 146CR/PR at Table III-4; CR at III-9; Hearing Tr. at 153, 173-74. 147CR/PR at IV-1 n. 4. 148Id. 149 U.S. Food and Drug Administration, Carbendazim in Orange Juice Products,
http://www.fda.gov/Food/FoodSafety/ProductSpecificInformation/ucm287783.htm, (EDIS Document ID 462625, Feb. 23, 2012).

19
to begin growing and processing oranges in semi-arid regions of Northeastern Brazil as soon as March 2012.150 Brazilian producers claim that the investment program at issue is directed mainly to the production of oranges for fresh consumption rather than for processing into juice.151 Regardless of the intended use of these oranges, we note that the record indicates that it takes between three and five years to harvest oranges from newly planted trees, which is beyond a reasonably foreseeable time frame.152
The domestic industry also argues that a special line of credit program (“Linha Especial de Credito”) (“LEC”) established by the Brazilian government in June 2011 will likely result in significant volumes of subject imports upon revocation.153 Under the LEC program, participating Brazilian orange juice processors are granted up to $50 million, with an annual interest rate of 6.75 percent, to purchase oranges that will be processed in the 2011/12 season.154 The LEC program was created to encourage the storage of juice until at least July 2012 and is intended to minimize the negative effects of supply peaks that lead to plunges in the value of orange juice and fruit.155 Brazilian processors have utilized this program for approximately 100,000 metric tons of frozen orange juice.156 The program is in place for one year and is not expected to be renewed.157 Given that the LEC program is set to expire in July 2012, it is not designed to encourage exports, and Brazilian producers have been replenishing their depleted inventories under the program, we do not find that it would likely result in significant subject import volumes upon revocation.158 159
For all these reasons, and particularly in light of the significant supply constraints in Brazil, the demonstrated commitment by Brazilian subject producers to other export markets, including the EU and Asia, the low current inventory levels held by Brazilian subject producers, and the uncertainty surrounding the implications of the FDA action on carbendazim, we find that, upon revocation, subject imports from Brazil are not likely to increase significantly from current levels, which are considerably below the peak levels deemed significant during the original investigation.
at 12-14. 150See, e.g., FCM, Citrus World, and Peace River Posthearing Br. at 6-7; Southern Gardens Posthearing Br. 151Hearing Tr. at 242 (Freeman). 152See e.g., Hearing Tr. at 84-85. 153See, e.g., Respondents’ Posthearing Br. at 8; FCM, Peace River, and Citrus World Prehearing Br., Ex. 4,
“Brazil Citrus Annual 2011,” USDA Foreign Agricultural Service GAIN Report at 5, December 7, 2011. 154CR/PR at IV-7. 155CR/PR at IV-7. 156See e.g., FCM, Peace River, and Citrus World Prehearing Br., Ex. 4, “Brazil Citrus Annual 2011,”
USDA Foreign Agricultural Service GAIN Report at 5, December 7, 2011. 157CR/PR at IV-7. 158Several parties have presented analyses concerning “residual demand” in the U.S. market. See e.g.,
FCM, Citrus World, and Peace River Posthearing Br. at 8 & Answers to Commissioners’ Questions at 38-40; Coca- Cola Prehearing Br. at 1-4. Although the Commission examined this concept in its original present injury analysis (with the dissenting Commissioners not relying on it), we do not find it to be a useful analytic tool in this review in which we must assess likely future developments upon revocation of the order.
159Commissioners Aranoff and Pinkert do not join the preceding footnote. With respect to measuring and considering residual demand, the record here indicates that (1) our analysis should center on FCOJM, the domestic production of which is less insulated from the impact of subject import competition than is the domestic production of NFCOJ and (2) subject imports of FCOJM have not been in excess of residual demand in the United States during the period of review. See e.g., Staff Residual Demand Calculations (EDIS Doc. No. 476907).

20
D. Likely Price Effects
In evaluating the likely price effects of subject imports if the antidumping duty order is revoked, the Commission is directed to consider whether there is likely to be significant underselling by the subject imports as compared to domestic like products and whether the subject imports are likely to enter the United States at prices that otherwise would have a significant depressing or suppressing effect on the price of the domestic like products.160
1. The Original Investigation
In the original investigation, the Commission found that there was significant underselling by
Brazilian subject imports.161 Although there was evidence of a mixed pattern of overselling and underselling, the Commission found the underselling to be significant in light of the fact that it was concentrated in the higher-volume FCOJM product.162 Because of this underselling, the Commission found that the subject imports suppressed domestic price increases, which otherwise would have occurred, to a significant degree.163 The Commission relied on evidence in the record demonstrating that the domestic industry was in a “cost-price” squeeze during the entire period examined because it was unable to recoup its rising production costs through higher prices on its sales of the domestic like product.164 The Commission found that the domestic industry’s cost-price squeeze was attributable to the significant volume of Brazilian subject imports entering the United States at lower-than-market prices, especially since the domestic industry’s cost-price squeeze accelerated in the final year of the period examined, when Brazilian subject imports peaked.165 166
2. The Current Review
In this five-year review, the Commission collected monthly pricing data on both FCOJM
(Product 1) and NFC (Product 2).167 During the period of review, subject imports undersold the domestic
16019 U.S.C. § 1675a(a)(3). The SAA states that “[c]onsistent with its practice in investigations, in considering the likely price effects of imports in the event of revocation and termination, the Commission may rely on circumstantial, as well as direct, evidence of the adverse effects of unfairly traded imports on domestic prices.” SAA at 886.
161Original Determination at 23. 162Original Determination at 23-24. 163Original Determination at 23. 164Id. 165Id. at 24. 166In the original investigation, the three dissenting Commissioners (then Vice-Chairman Okun and
Commissioners Hillman and Pearson) found that the U.S. price for certain orange juice was significantly influenced by the price of FCOJ on the futures market. They found that U.S. prices generally fluctuated but moved in tandem with the futures price. They also found that underselling of FCOJ was significant, but that subject imports did not depress U.S. prices to a significant degree. They noted that the volume of subject imports declined during the period when U.S. prices declined. They also found that any cost-price squeeze was likely the result of a lower volume of sales caused by the impact of the 2004 Florida hurricanes. See, e.g., Original Determination, Dissenting Views at 63-71.
167CR at V-8, PR at V-6.

21
like product in 45 of 141 available price comparisons, i.e., in 32 percent of price comparisons.168 169 In light of this information and the data collected in the original investigation showing mixed overselling and underselling without the discipline of the order, we find that there will likely continue to be a mixed pattern of overselling and underselling by subject imports upon revocation.
During the period of review, the price of certain orange juice in the U.S. market was affected by factors unrelated to subject imports. The absence of a relationship between subject imports and orange juice prices was particularly evident during the latter portion of the period of review when supply constraints limited the supply of round oranges from Florida. In general, the size of the Florida orange crop influenced the FCOJM futures market price, which in turn influenced the price for certain orange juice in the U.S. market.170 The pricing data collected during the period of review demonstrate that the correlation between futures prices and prices for the domestic like product is considerably stronger than the correlation between prices for subject imports and prices for the domestic like product.171 In other words, the reduced supply of the Florida orange crop during the period of review correlated with higher FCOJM futures prices, which in turn correlated with overall higher prices for certain orange juice.172
Although we do not find that the size of the Brazilian orange crop has no effect on U.S. prices for certain orange juice, and are mindful of the fact that the antidumping order was in place during the review period, the record indicates that the size of the Brazilian orange crop and the volume of subject imports have not shown the same type of inverse correlation to futures prices as the size of the domestic crop, and thus appear to have been less significant in the market. The record reflects that, as of January 2012, FCOJM futures prices had reached record-high levels.173 In light of likely constraints on the supply of oranges in both Florida and Brazil, the effects on certain orange juice prices in the United States of the FDA’s
168FCOJM subject imports from Brazil were priced higher than U.S. orange juice in 39 of 69 pricing comparisons by an average margin of 18.2 percent. NFC imports from Brazil were priced higher than U.S. orange juice in 57 of 72 comparisons by an average margin of 14.9 percent. CR/PR at Table V-4. Most of the underselling by subject imports occurred in the first three years of the period of review (i.e., CY 2005/06, CY 2007/08, and CY 2008/09). CR/PR at Table V-4.
169Quarterly pricing data were revised by ***. The domestic industry called into question *** revised pricing data, arguing that its accuracy has not been established. The Commission, however, finds *** revised data to be reliable because it reflects adjustments made for adding in the value of the tariffs applied to the subject orange juice from Brazil and various other costs, including transportation costs. If *** revised data were adjusted by only the amount of the tariff, as requested by the domestic industry, there would still be 60 quarters of overselling, compared with 81 quarters of underselling. If *** data were removed altogether from the data set (as requested in the alternative by the domestic industry), there would still be 47 quarters of overselling compared with 34 quarters of underselling. In other words, regardless of whether *** data are revised by the amount of the tariff or removed from the data set completely, the record reflects that there is still a mixed pattern of overselling and underselling. Accordingly, on this record, we cannot find evidence of likely significant price depression or suppression.
170CR/PR at V-1 & Figure V-1; CR at V-4, PR at V-3 to V-4. During the period of review, U.S. FCOJM futures prices were more highly correlated with domestic pricing data than subject import pricing data collected in this review and more highly correlated with FCOJM prices than NFC prices. CR at V-4, PR at V-3 to V-4.
171CR at V-9, PR at V-7. Prices of domestic products 1 and 2 generally increased between October 2005 and mid-2007, declined through the end of 2008, and then increased through September 2011. Prices of imported subject Brazilian products 1 and 2 also generally increased through early- to mid-2007, but, after a few months of decline, remained relatively stable through early- to mid-2010. Beginning in mid-2010, prices for imported subject Brazilian product 1 generally increased, while prices for product 2 increased until February 2011, decreased through July 2011, and were higher in August and September 2011 than in July 2011. CR at V-9, PR at V-7.
172CR at V-9, PR at V-7. 173CR/PR at V-4.
22
carbendazim testing, increasing U.S. prices for certain orange juice during the period of review, and current record-high FCOJM futures prices, we do not find it likely that subject imports, which are not likely to increase significantly from their current levels, would have significant price-depressing effects upon revocation.
We also do not find that subject imports would likely have significant price-suppressing effects upon revocation.174 The domestic industry’s ratio of cost of goods sold (“COGS”) to net sales fluctuated during the period of review. During CY 2010/11, the ratio of COGS to net sales was 88.2 percent, which was more favorable to the domestic industry than the 90.9 percent ratio in CY 2005/06, or the 96.4 percent ratio in CY 2004/05, the final year of the period examined in the original investigation.175 We recognize that the domestic industry is experiencing increased costs, in particular as related to citrus greening. Nevertheless, in light of the limited correlation between subject import volumes and domestic price levels, and our finding that subject import volume is unlikely to increase significantly from current levels, revocation is unlikely to result in significant price declines for the domestic like product, notwithstanding that some continued underselling is likely.
Thus, for the above reasons, we find that revocation of the antidumping duty order would not likely lead to significant underselling of the domestic like product by the subject imports, or to likely significant price depression or suppression, within a reasonably foreseeable time.
E. Likely Impact of Subject Imports176
In evaluating the likely impact of imports of subject merchandise if the antidumping duty order is
revoked, the Commission is directed to consider all relevant economic factors that are likely to have a bearing on the state of the industry in the United States, including but not limited to: (1) likely declines in output, sales, market share, profits, productivity, return on investments, and utilization of capacity; (2) likely negative effects on cash flow, inventories, employment, wages, growth, ability to raise capital, and investment; and (3) likely negative effects on the existing development and production efforts of the industry, including efforts to develop a derivative or more advanced version of the domestic like product.177
All relevant economic factors are to be considered within the context of the business cycle and the conditions of competition that are distinctive to the industry.178 As instructed by the statute, we
174Commissioner Pinkert notes that his conclusion with respect to price suppression centers on the Commission’s finding with respect to likely volume.
175CR/PR at Tables I-2 & III-12. 176Section 752(a)(6) of the Tariff Act states that “the Commission may consider the magnitude of the margin
of dumping or the magnitude of the net countervailable subsidy” in making its determination in a five-year review. 19 U.S.C. § 1675a(a)(6). The statute defines the “magnitude of the margin of dumping” to be used by the Commission in five-year reviews as “the dumping margin or margins determined by the administering authority under section 1675a(c)(3) of this title.” 19 U.S.C. § 1677(35)(C)(iv). See also SAA at 887. In its final determination in the review of the antidumping duty order, Commerce determined that revocation of the order would likely result in dumping margins of 12.46 percent for Fischer, S.A.; 60.29 percent for Montecitrus Trading, S.A.; 19.19 percent for Sucocitrico Cutrale, S.A.; and 16.51 for all others. CR/PR at Table I-4.
17719 U.S.C. § 1675a(a)(4). 17819 U.S.C. § 1675a(a)(4). Section 752(a)(6) of the Act states that “the Commission may consider the
magnitude of the margin of dumping” in making its determination in a five-year review. 19 U.S.C. § 1675a(a)(6). The statute defines the “magnitude of the margin of dumping” to be used by the Commission in five-year reviews as “the dumping margin or margins determined by the administering authority under section 1675a(c)(3) of this title.” 19 U.S.C. § 1677(35)(C)(iv). See also SAA at 887. Commerce has not made any duty absorption findings with respect to the subject antidumping duty order.

23
have considered the extent to which any improvement in the state of the domestic industry is related to the order at issue and whether the industry is vulnerable to material injury if the orders are revoked.179
1. The Original Investigation
In the original investigation, the Commission found that subject imports adversely affected the
domestic industry by rendering it unable to cover its production costs sufficiently despite increasing apparent U.S. consumption. The Commission found that domestic processors’ financial indicators worsened substantially over the period examined, with processors experiencing declining net sales, deteriorating profitability, and operating losses.”180 As the Commission found, domestic processors also experienced declines in cash flow, return on investment, capital expenditures, and worker productivity.181
In addition, domestic growers experienced deteriorating profitability during the period examined, with declining operating income and net sales.182 The Commission found that, in light of their increased market share and significant volume and price effects, subject imports had a significant adverse impact on the domestic industry.183
2. The Current Review
Because the domestic industry includes both growers and processors, our assessment of the
industry’s vulnerability necessarily includes both of these sectors of the U.S. market for certain orange juice. Although U.S. orange growers’ production declined overall during the period of review and was well below the levels of the period examined in the original investigation, this was largely a function of disease and weather-related events, as discussed above.184 The decline in production by growers resulted
179The SAA states that in assessing whether the domestic industry is vulnerable to injury if the order is revoked, the Commission “considers, in addition to imports, other factors that may be contributing to overall injury. While these factors, in some cases, may account for the injury to the domestic industry, they may also demonstrate that an industry is facing difficulties from a variety of sources and is vulnerable to dumped or subsidized imports.” SAA at 885.
180Original Determination at 27. 181Id. at 27. 182Id. 183In the original investigation, the three dissenting Commissioners (then Vice-Chairman Okun and
Commissioners Hillman and Pearson) found that subject imports did not have a significant adverse impact on the domestic industry nor did they threaten the domestic industry with material injury. In reaching this conclusion, they found that the industry remained profitable throughout the period examined. They also found that the financial performance of the domestic industry was heavily dependent on the availability of oranges for processing and that the production and shipments of the domestic industry were constrained by the orange harvest. They noted that the Florida orange groves were significantly damaged by a series of hurricanes in CY 2004/05, and that the decline in the profitability of the U.S. extractor/processors was due primarily to changes in the size of the U.S. orange crop. They found that Brazilian subject imports did not threaten the domestic industry with material injury because orange crop yield in Brazil was expected to decline; Brazil’s main export market was the EU and exports to that market had been stable; and imports from Brazil to the United States increased only to fill production declines in the United States. See e.g., Original Determination, Dissenting Views at 71-82.
184Total orange production by Florida orange growers was 147.7 million boxes in CY 2005/06, 129.0 million boxes in CY 2006/07, 170.2 million boxes in 2007/08, 162.5 million boxes in CY 2008/09, 133.7 million boxes in CY 2009/10, and 140.3 million boxes in CY 2010/11. Processed orange production by Florida orange growers was 140.4 million boxes in CY 2005/06, 122.6 million boxes in CY 2006/07, 164.3 million boxes in CY

24
in less available supply of round oranges for U.S. processors, which in turn experienced declines in their production and shipments of certain orange juice during the period of review.185 Although U.S. processors’ capacity utilization fluctuated and was at a near-period-low level in CY 2010/11,186 we do not find these data to be probative of the domestic industry’s overall condition because, as discussed above, they mainly reflect the smaller Florida orange crop during the period of review. Similarly, although U.S. processors’ market share fluctuated during the period of review,187 this largely reflected less available supply of oranges for processing into certain orange juice in those particular crop years. By the final year of the period of review, U.S. processors’ end-of-period inventories fell to period-low levels, which indicates that the declines in U.S. processors’ production and shipments were largely due to supply constraints for oranges available for processing rather than weakness in the domestic industry.188
In fact, because of higher prices, U.S. processors’ profitability improved during the period of review, especially in the latter part of the period. By the final year of the period, U.S. processors’ operating income, net sales (by value), and operating income as a ratio to net sales each climbed to near period-high levels.189 190 U.S. processors’ U.S. shipments (by value) were at their second-highest level for
2007/08, 155.6 million boxes in CY 2008/09, 127.8 million boxes in CY 2009/10, and 134.4 million boxes in CY 2010/11. CR/PR at Table III-2. We note that the record contains limited other data from U.S. orange growers. The Commission issued grower questionnaires to 410 growers of oranges used for the production of certain orange juice, 19 of which provided the Commission with information. CR/PR at III-1; CR at I-17. The growers that submitted questionnaire responses accounted for approximately 9.0 percent of U.S. production of oranges in CY 2010/11. CR/PR at III-1.
185U.S. processors’ production was 1.2 billion pounds SE in CY 2005/06, 964.3 million pounds SE in CY 2006/07, 1.3 billion pounds SE in CY 2007/08, 1.2 billion pounds SE in CY 2008/09, and 1.0 billion pounds SE in CY 2009/10 and CY 2010/11. CR/PR at Table C-6.
186U.S. processors’ production capacity was 1.5 billion pounds SE in CY 2005/06 and CY 2006/07, 1.6 billion pounds SE in CY 2007/08, and 1.5 billion pounds SE in CY 2008/09, CY 2009/10, and CY 2010/11. U.S. processors’ capacity utilization was 77.4 percent in CY 2005/06, 64.2 percent in CY 2006/07, 82.2 percent in CY 2007/08, 76.4 percent in CY 2008/09, 66.0 percent in CY 2009/10, and 66.8 percent in CY 2010/11. CR/PR at Table C-6.
187As discussed above, U.S. processors’ market share was 77.6 percent in CY 2005/06, 68.4 percent in CY 2006/07, 65.8 percent in CY 2007/08, 74.8 percent in CY 2008/09, 72.7 percent in CY 2009/10, and 77.5 percent in CY 2010/11. CR/PR at Table C-5.
188U.S. processors’ ending stocks were 459.0 million gallons SSE in CY 2005/06, 379.6 million gallons SSE in CY 2006/07, 653.2 million gallons SSE in CY 2007/08, 700.6 million gallons SSE in CY 2008/09, 564.3 million gallons SSE in CY 2009/10, and 407.7 million gallons SSE in CY 2010/11. CR/PR at Table C-5.
189U.S. processors’ operating income was $13.8 million in CY 2005/06, $21.8 million in CY 2006/07, $93.0 million in CY 2007/08, $46.2 million in CY 2008/09, $16.0 million in CY 2009/10, and $92.0 million in CY 2010/11. As a ratio to net sales, U.S. processors’ operating income was 1.4 percent in CY 2005/06, 1.8 percent in CY 2006/07, 9.5 percent in CY 2007/08, 4.6 percent in CY 2008/09, 1.3 percent in CY 2009/10, and 6.8 percent in CY 2010/11. By value, U.S. processors’ net sales were $1.0 billion in CY 2005/06, $1.2 billion in CY 2006/07, $982.9 million in CY 2007/08, $1.0 billion in CY 2008/09, $1.2 billion in CY 2009/10, and $1.3 billion in CY 2010/11. By quantity, U.S. processors’ net sales were 604.3 million pounds SE in CY 2005/06, 529.0 million pounds SE in CY 2006/07, 494.9 million pounds SE in CY 2007/08, 603.2 million pounds SE in CY 2008/09, 621.4 million pounds SE in CY 2009/10, and 557.1 million pounds SE in CY 2010/11. CR/PR at Table C-6.
190CR/PR at Table C-6. Our assessment of U.S. processors’ financial performance during the period of review includes the data for Citrus World, the only cooperative among the processors/extractors of certain orange juice. If the data of Citrus World were excluded on the basis that it seeks to pass all profits back to its grower members, the processing segment of the U.S. industry would show *** over the period of review. Tables III-12B & III-20B (EDIS Doc. No. 476612).

25
the period of review in CY 2010/11 despite the fact that the quantity of U.S. shipments that year was at a period low.191 192 193
Based on the foregoing, we conclude that, notwithstanding the effects of the hurricanes and the spread of citrus disease during the period of review, the domestic industry is not vulnerable or in a weakened state. Although the domestic industry argued that it is rendered vulnerable due to declining demand, there was not a positive correlation between apparent U.S. consumption of certain orange juice and the condition of the domestic industry during the period of review. At the beginning of the period in CY 2005/06, U.S. processors had their lowest operating income when demand peaked.194 By contrast, at the end of the period in CY 2010/11, domestic processors enjoyed near period-high profitability when demand plummeted to a period-low level.195 Moreover, during the period of review, demand trends were more favorable in the NFC sector of the market, in which the domestic industry had a market share that typically exceeded 90 percent, and in which the industry achieved higher operating margins.196 In addition, the record reflects that the domestic industry was able to achieve some export growth during the period of review, notwithstanding declines in demand.197
191 By value, U.S. processors’ U.S. shipments were $1.7 billion in CY 2005/06, $2.0 billion in CY 2006/07, $1.6 billion in CY 2007/08, $1.5 billion in CY 2008/09, $1.7 billion in CY 2009/10, and $1.8 billion in CY 2010/11. By quantity, U.S. processors’ U.S. shipments were 1.1 billion pounds SE in CY 2005/06, 1.0 billion pounds SE in CY 2006/07 and CY 2007/08, 1.1 billion pounds SE in CY 2008/09 and CY 2009/10, and 1.0 billion pounds SE in CY 2010/11. CR/PR at Table C-6.
192 We note that other performance indicia for U.S. processors generally improved overall during the period of review. U.S. processors’ capital expenditures increased from $40.0 million in CY 2005/06 to $47.0 million in CY 2010/11. Although the number of production related workers (“PRWs”) declined from 2,697 workers in CY 2005/06 to 2,574 workers in CY 2010/11, hourly wages for PRWs increased from $19.49 per hour in CY 2005/06 to $22.28 per hour in CY 2010/11. Similarly, total wages paid to PRWs increased from $138.2 million in CY 2005/06 to $157.2 million in CY 2010/11. The number of hours worked by PRWs was 7.1 million hours in both CY 2005/06 and CY 2010/11. CR/PR at Table C-6.
193As discussed above, the 19 growers that submitted questionnaire responses accounted for approximately 9.0 percent of U.S. production of oranges in CY 2010/11. CR/PR at III-1. Moreover, only 11 growers submitted usable information concerning their financial condition. CR/PR at III-49, PR at III-34. Given the extremely limited number of questionnaire responses received by the Commission from orange growers, such responses do not fully represent the operational results of that sector of the U.S. market. U.S. growers’ net sales and operating income fluctuated during the period of review. U.S. growers’ operating income was $5.1 million in CY 2005/06, $24.1 million in CY 2006/07, $29.7 million in CY 2007/08, $11.0 million in CY 2008/09, $14.1 million in CY 2009/10, and $17.4 million in CY 2010/11. U.S. growers’ net sales (by value) were $91.0 million in CY 2005/06, $119.5 million in CY 2006/07, $138.8 million in CY 2007/08, $122.3 million in CY 2008/09, $106.5 million in CY 2009/10, and $116.7 million in CY 2010//11. U.S. growers net sales’ (by quantity) were 11.2 million boxes in CY 2005/06, 11.0 million boxes in CY 2006/07, 14.4 million boxes in CY 2007/08 and CY 2008/09, 11.2 million boxes in CY 2009/10, and 11.2 million boxes in CY 2010/11. CR/PR at Table III-26.
194CR/PR at Tables C-5 & C-6. 195CR/PR at Table C-5 & C-6. 196CR/PR at Tables C-1 to C-4 & C-6. With respect to NFC orange juice, U.S. apparent consumption
dropped by 14.0 percent between CY 2005/06 and 2010/11. By contrast, U.S. apparent consumption for FCOJM dropped by 19.2 percent between CY 2005/06 and CY 2010/11. CR/PR at Tables C-1 & C-3.
197By quantity, U.S. export shipments increased from 54.2 million pounds SE in CY 2005/06 to 66.2 million pounds SE in CY 2010/11. By value, U.S. export shipments increased from $62.0 million in CY 2005/06 to $116.9 million in CY 2010/11. CR/PR at Table C-6. We also note that, at the hearing, there was witness testimony indicating that implementation of the United-States Korea Free Trade Agreement would likely enable the domestic industry to increase its exports of certain orange juice to the Korean market. Hearing Tr. at 83, 189.

26
Based upon the record in this five-year review, there also does not appear to be a correlation between the level of subject imports and the domestic industry’s financial performance. The domestic industry had its highest profits and operating income both when subject import volumes peaked (CY 2007/08) and when subject imports were at their period-low level (CY 2010/11).198 In 2010/11, the domestic industry held a 77.5 percent share of the market, and subject imports accounted for a *** percent market share.199 That year, the domestic industry had a gross profit of $158.4 million, an operating income of $92.0 million, and an operating income to sales ratio of 6.8 percent.200 In contrast, in CY 2007/08, the domestic industry held a 65.8 percent share of the market, and subject imports were at *** percent.201 That year, the domestic industry had a gross profit of $142.9 million, an operating income of $93.0 million and an operating income to sales ratio of 9.5 percent.202
As discussed above, we do not find it likely that revocation of the order would result in a significant increase in the volume of subject imports. Because of the lack of relationship between subject import volumes and U.S. prices for certain orange juice, likely subject import volumes would not likely depress or suppress the domestic industry’s prices significantly or have significant price effects if the order were revoked. In light of the lack of a likely significant increase in subject import volume and the lack of likely significant adverse price effects, the subject imports would not likely have a significant adverse impact on the production, shipments, sales, employment, and revenue levels of the domestic industry, which we do not find to be in a vulnerable condition. Accordingly, based on the record in this review, we conclude that, in the event of revocation of the order, subject imports from Brazil likely would not have a significant adverse impact on the domestic industry within a reasonably foreseeable time.
CONCLUSION
For the above reasons, we determine that revocation of the antidumping order on certain orange
juice from Brazil would not be likely to lead to continuation or recurrence of material injury to an industry in the United States within a reasonably foreseeable time.
198CR/PR at Table C-5 & C-6. 199CR/PR at Table C-5. 200CR/PR at Table C-6. 201CR/PR at Table C-5 & C-6. 202CR/PR at Table C-6.

I-1
PART I: INTRODUCTION AND OVERVIEW
BACKGROUND
On February 1, 2011, the U.S. International Trade Commission (“Commission” or “USITC”) gave notice, pursuant to section 751(c) of the Tariff Act of 1930, as amended (“the Act”),1 that it had instituted a review to determine whether revocation of the antidumping duty order on frozen concentrated orange juice for further manufacturing (“FCOJM”) and not-from-concentrate pasteurized orange juice (“NFCOJ”), collectively referred to as “certain orange juice,” from Brazil would likely lead to the continuation or recurrence of material injury to a domestic industry.2 3 On May 9, 2011, the Commission determined that it would conduct a full review pursuant to section 751(c)(5) of the Act.4 The following tabulation presents information relating to the schedule of this proceeding:5
Effective date
Action
March 9, 2006 Commerce’s antidumping duty order on certain orange juice from Brazil (71 FR 12183)
February 1, 2011 Commission’s institution of five-year review (76 FR 5822, February 2, 2011)
February 1, 2011 Commerce’s initiation of five-year review (76 FR 5563)
May 9, 2011 Commission’s determination to conduct a full five-year review (76 FR 30197, May 24, 2011)
May 26, 2011 Commerce’s final results of its expedited five-year review of the antidumping duty order
on certain orange juice from Brazil (76 FR 30655)
July 14, 2011 Commission’s scheduling of the review (76 FR 43344, July 20, 2011)
January 24, 2012 Commission’s hearing
March 14, 2012 Commission’s vote
April 4, 2012 Commission’s determination transmitted to Commerce
1 19 U.S.C. 1675(c). 2 Orange Juice From Brazil, 76 FR 5822, February 2, 2011. All interested parties were requested to respond to
this notice by submitting the information requested by the Commission. The Commission received five submissions representing the following entities: 1) Florida Citrus Mutual (“FCM”), Citrus World, Inc. (“Citrus World”), and Peace River Citrus Products, Inc. (“Peace River”); 2) Southern Gardens Citrus Processing Corp. (“Southern Gardens”); 3) Fischer S.A. Comercio, Industria and Agricultura (“Fischer”); 4) Louis Dreyfus Citrus, Inc and Louis Dreyfus Commodities Agroindustrial S.A. (“Louis Dreyfus”); and 5) Sucocitrico Cutrale Inc. (“Cutrale”), Cutrale Citrus Juices USA Inc. (“Cutrale USA”), and Citrus Products Inc. (“Citrus Products”).
3 In accordance with section 751(c) of the Act, the U.S. Department of Commerce (“Commerce”) published a notice of initiation of five-year review of the subject antidumping duty order concurrently with the Commission’s notice of institution. Initiation of Five-Year (“Sunset”) Review, 76 FR 5563, February 1, 2011.
4 Orange Juice From Brazil; Notice of Commission Determination To Conduct a Full Five-Year Review Concerning the Antidumping Duty Order On Orange Juice From Brazil, 76 FR 30197, May 24, 2011. The Commission found that both the domestic and respondent interested party group responses to its notice of institution were adequate and voted for a full review.
5 The Commission’s notice of institution, notice to conduct a full review, scheduling notice, and statement on adequacy appear in appendix A and may also be found at the Commission’s web site (internet address www.usitc.gov). Commissioners’ votes on whether to conduct an expedited or full review may also be found at the web site. Appendix B presents the witnesses appearing at the Commission’s hearing.

I-2
The Original Investigation
The original investigation resulted from a petition filed on December 27, 2004 by Florida Citrus Mutual, A. Duda & Sons, Inc. (“A. Duda”), Citrus World, Inc., Peace River Citrus Products, Inc., and Southern Gardens Citrus Processing Corp., alleging that an industry in the United States is materially injured and threatened with material injury by reason of less-than-fair-value (“LTFV”) imports of certain orange juice from Brazil. The Commission completed the original investigation in February 2006, determining that an industry in the United States was materially injured by reason of imports of certain orange juice from Brazil that were being sold at LTFV.6 After receipt of the Commission’s determination, Commerce issued an antidumping duty order on certain orange juice from Brazil, effective March 9, 2006.7
Subsequent Proceedings
Tropicana Products, Inc. (“Tropicana”), an importer, purchaser, and domestic producer, appealed
the Commission’s determination to the U.S. Court of International Trade (“CIT”). On April 12, 2007, the CIT remanded the case to the Commission to render a determination within 75 days. In June 2007, the Commission again determined that an industry in the United States was materially injured or threatened with material injury by reason of imports of certain orange juice from Brazil sold at LTFV.8 9
On September 19, 2007, the CIT remanded the case to the Commission for a second time, and in October 2007, the Commission again determined that an industry in the United States was materially injured or threatened with material injury by reason of imports of certain orange juice from Brazil sold at LTFV.10 11
6 Certain Orange Juice From Brazil, 71 FR 10993, March 3, 2006, Certain Orange Juice from Brazil, Inv. No. 731-TA-1089 (Final), USITC Publication 3838, March 2006.
7 The scope of this order with regard to FCOJM covers only FCOJM produced and/or exported by those companies which were excluded or revoked from the pre–existing antidumping order on FCOJ from Brazil as of December 27, 2004. Those companies are Cargill Citrus Limitada (Cargill), Coinbra–Frutesp S.A. (Coinbra–Frutesp), Sucocitrico Cutrale, S.A. (Cutrale), Fischer S/A -Agroindustria (Fischer), and Montecitrus Trading S.A. (Montecitrus). Antidumping Duty Order: Certain Orange Juice from Brazil, 71 FR 12183, March 9, 2006.
8 Chairman Daniel R. Pearson and Commissioners Deanna Tanner Okun and Irving A. Williamson dissented. 9 Certain Orange Juice from Brazil, Inv. No. 731-TA-1089 (Final) (Remand), USITC Publication 3930, June
2007. 10 Chairman Daniel R. Pearson and Commissioners Deanna Tanner Okun and Irving A. Williamson dissented.
11 Certain Orange Juice from Brazil, Inv. No. 731-TA-1089 (Final) (Second Remand), USITC Publication 3958, October 2007.

I-3
PREVIOUS AND RELATED INVESTIGATIONS
The Commission has conducted several investigations concerning frozen concentrated orange juice (“FCOJ”) from Brazil, as shown in table I-1.
Table I-1 FCOJ from Brazil: Previous investigations
Investigation No.
Date
USITC Publication No.
Action
701-TA-184 (F) 1983 1406 Affirmative1
751-TA-10 1984 1623 Affirmative2
731-TA-326 (F) 1987 1970 Affirmative
731-TA-326 (F)(Remand) 1989 2154 Affirmative3
731-TA-326 (First Review) 1999 3195 Affirmative4
731-TA-326 (Second Review) 2005 3760 Negative 1 On March 2, 1983, Commerce suspended its countervailing duty investigation involving FCOJ from Brazil (48
FR 8839). On February 26, 1999, Commerce terminated the suspended investigation because no domestic interested party responded to the notice of initiation by the applicable deadlines.
2 On May 31, 1984, the Commission received a request to review its affirmative injury determination because of changed circumstances, which alleged that the major freeze in Florida in December 1983 and the subsequent decline in the 1983/84 Florida crop as well as the surge in demand for Brazilian juice warranted a review. After receiving public comment, the Commission instituted a changed circumstance review, and determined on December 17, 1984, that the U.S. industry would be threatened with material injury if the suspension agreement were modified or revoked.
3 The Commission’s determination was appealed to the U.S. Court of International Trade and remanded to the Commission for further consideration with respect to reevaluation of the evidence concerning certain fair value inventories in Brazil and a reconsideration of inventories in the United States. After reevaluation of the evidence concerning fair value inventories, the Commission again found material injury.
4 The Commission conducted an expedited review.
Source: Certain Orange Juice from Brazil, Inv. No. 731-TA-1089 (Final), USITC Publication 3838, March 2006.
STATUTORY CRITERIA
Section 751 (c) of the Act requires Commerce and the Commission to conduct a review no later than five years after the issuance of an antidumping or countervailing duty order or the suspension of an investigation to determine whether revocation of the order or termination of the suspended investigation “would be likely to lead to continuation or recurrence of dumping or a countervailable subsidy (as the case may be) and of material injury.”
Section 752(a) of the Act provides that in making its determination of likelihood of continuation or recurrence of material injury–
(1) IN GENERAL.-- . . . the Commission shall determine whether revocation of an
order, or termination of a suspended investigation, would be likely to lead to continuation or recurrence of material injury within a reasonably foreseeable time. The Commission shall consider the likely volume, price effect, and impact of imports of the subject merchandise on the industry if the order is revoked or the suspended investigation is terminated. The Commission shall take into account--

I-4
(A) its prior injury determinations, including the volume, price effect, and impact of imports of the subject merchandise on the industry before the order was issued or the suspension agreement was accepted,
(B) whether any improvement in the state of the industry is related to the order or the suspension agreement,
(C) whether the industry is vulnerable to material injury if the order is revoked or the suspension agreement is terminated, and
(D) in an antidumping proceeding . . ., (Commerce’s findings) regarding duty absorption . . ..
(2) VOLUME.--In evaluating the likely volume of imports of the subject
merchandise if the order is revoked or the suspended investigation is terminated, the Commission shall consider whether the likely volume of imports of the subject merchandise would be significant if the order is revoked or the suspended investigation is terminated, either in absolute terms or relative to production or consumption in the United States. In so doing, the Commission shall consider all relevant economic factors, including--
(A) any likely increase in production capacity or existing unused
production capacity in the exporting country, (B) existing inventories of the subject merchandise, or likely
increases in inventories, (C) the existence of barriers to the importation of such
merchandise into countries other than the United States, and (D) the potential for product-shifting if production facilities in
the foreign country, which can be used to produce the subject merchandise, are currently being used to produce other products.
(3) PRICE.--In evaluating the likely price effects of imports of the subject
merchandise if the order is revoked or the suspended investigation is terminated, the Commission shall consider whether--
(A) there is likely to be significant price underselling by imports
of the subject merchandise as compared to domestic like products, and (B) imports of the subject merchandise are likely to enter the
United States at prices that otherwise would have a significant depressing or suppressing effect on the price of domestic like products.
(4) IMPACT ON THE INDUSTRY.--In evaluating the likely impact of imports of
the subject merchandise on the industry if the order is revoked or the suspended investigation is terminated, the Commission shall consider all relevant economic factors which are likely to have a bearing on the state of the industry in the United States, including, but not limited to–
(A) likely declines in output, sales, market share, profits,
productivity, return on investments, and utilization of capacity, (B) likely negative effects on cash flow, inventories, employment,
wages, growth, ability to raise capital, and investment, and

I-5
(C) likely negative effects on the existing development and production efforts of the industry, including efforts to develop a derivative or more advanced version of the domestic like product.
The Commission shall evaluate all such relevant economic factors . . . within the context of the business cycle and the conditions of competition that are distinctive to the affected industry.
Section 752(a)(6) of the Act states further that in making its determination, “the Commission may
consider the magnitude of the margin of dumping or the magnitude of the net countervailable subsidy. If a countervailable subsidy is involved, the Commission shall consider information regarding the nature of the countervailable subsidy and whether the subsidy is a subsidy described in Article 3 or 6.1 of the Subsidies Agreement.” Information obtained during the course of this review that relates to the statutory criteria is presented throughout this report.
SUMMARY DATA
Table I-2 presents a summary of data from the original investigation and the current full five-year
review. U.S. industry data and related information for the original investigation were based on questionnaire responses of 12 U.S. extractor/processors, while industry information for the current five- year review is based on questionnaire responses of 8 U.S. extractor/processors.12 U.S. import data for both the original investigation and the five-year review are based on official Commerce statistics. Related information on imports in the original investigation were based on questionnaire responses of eight U.S. importers, while related information on imports in the current review is from the questionnaire responses of 11 U.S. importers of certain orange juice (nine provided usable data).13 A summary of trade and financial data for frozen concentrated orange juice for manufacture (FCOJM), not-from-concentrate orange juice (NFCOJ), and total certain orange juice as collected in the review is presented in appendix C. Responses by U.S. extractor/processors, growers, importers, and purchasers of certain orange juice to a series of questions concerning the significance of the existing antidumping duty order and the likely effects of revocation of the order are presented in appendix D.
12 In the original investigation, the 12 responding U.S. extractor/processors accounted for more than 90 percent of U.S. production of certain orange juice during crop year 2004/05; in this current five-year review, the 8 responding U.S. extractor/processors account for virtually all U.S. production in 2010/11.
13 In the original investigation, U.S. data on oranges used for the production of certain orange juice were based on questionnaire responses of 36 U.S. growers, while data for the current five-year review are based on questionnaire responses of 19 U.S. growers.

I-6
Table I-2 Certain orange juice: Comparative data from the original investigation and current review, crop years 2001/02-2004/05 and 2005/06-2010/11
(Quantity=1,000 gallons SSE; value=$1,000; unit values are per gallon)
Item 2001/02 2002/03 2003/04 2004/05 2005/06 2006/07 2007/08 2008/09 2009/10 2010/11
U.S. consumption quantity: Amount
1,450,121
1,426,553
1,436,664
1,500,670
1,307,408
1,239,680
1,149,526
1,197,963
1,152,507
1,091,656
Domestic share1 87.2 79.9 84.8 76.5 77.6 68.4 65.8 74.8 72.7 77.5
Importer’s share:1
Brazil (subject)
7.6
15.9
10.7
15.4
***
***
***
***
***
***
Brazil (nonsubject) (2) (2) (2) (2) *** *** *** *** *** ***
All other sources 5.2 4.2 4.5 8.0 7.1 10.6 12.8 10.9 11.4 10.9
Total imports 12.8 20.1 15.2 23.5 22.4 31.6 34.2 25.2 27.3 22.5
U.S. imports from-- Brazil (subject):
Quantity
109,728
227,280
154,203
231,711
***
***
***
***
***
***
Value 99,162 242,259 142,702 232,481 *** *** *** *** *** ***
Unit value $0.90 $1.07 $0.93 $1.00 $*** $*** $*** $*** $*** $***
Brazil (nonsubject):
Quantity
(2)
(2)
(2)
(2)
***
***
***
***
***
***
Value (2) (2) (2) (2) *** *** *** *** *** ***
Unit value (2) (2) (2) (2) $*** $*** $*** $*** $*** $***
All other sources:
Quantity
75,559
59,589
64,167
120,432
93,291
131,379
146,951
130,786
131,199
118,446
Value 103,102 76,494 53,648 109,191 110,062 236,939 223,650 145,178 179,201 190,761
Unit value $1.36 $1.28 $0.84 $0.91 $1.18 $1.80 $1.52 $1.11 $1.37 $1.61
All countries:
Quantity
185,287
286,869
218,370
352,143
292,978
391,940
393,383
301,494
314,088
246,150
Value 202,265 318,753 196,350 341,672 347,993 675,612 592,013 394,893 453,340 429,334
Unit value $1.09 $1.11 $0.90 $0.97 $1.19 $1.72 $1.50 $1.31 $1.44 $1.74
Table continued on next page.

I-7
Table I-2--Continued Certain orange juice: Comparative data from the original investigation and current review, crop years 2001/02-2004/05 and 2005/06-2010/11
(Quantity=1,000 pounds; value=$1,000; unit values, unit labor costs and unit expenses are per pound)
Item 2001/02 2002/03 2003/04 2004/05 2005/06 2006/07 2007/08 2008/09 2009/10 2010/11
U.S. producers’-- Capacity quantity
1,645,640
1,645,641
1,690,640
1,690,640
1,499,478
1,502,075
1,550,919
1,543,035
1,530,658
1,540,597
Production quantity 1,405,537 1,226,103 1,465,341 965,406 1,160,025 964,342 1,274,154 1,178,835 1,010,108 1,029,023
Capacity utilization1 85.4 74.5 86.7 57.1 77.4 64.2 82.2 76.4 66.0 66.8
U.S. shipments:
Quantity
1,338,675
1,194,489
1,348,799
1,048,643
1,118,967
1,012,853
1,042,534
1,080,220
1,081,402
1,007,347
Value 1,331,416 1,247,495 1,321,088 1,103,316 1,692,984 1,998,244 1,610,642 1,447,403 1,666,290 1,784,221
Unit value $1.20 $1.26 $1.16 $1.23 $1.51 $1.97 $1.54 $1.34 $1.54 $1.77
Ending inventory quantity 423,741 439,812 540,384 415,181 315,998 218,851 410,863 445,560 304,728 260,250
Inventories/total shipments1 29.1 35.3 38.0 37.4 26.9 20.6 38.0 38.9 26.5 24.2
Production workers 3,445 3,445 3,542 3,040 2,697 2,473 2,661 2,665 2,392 2,574
Hours worked (1,000 hours) 9,098 8,263 8,478 7,263 7,093 6,593 7,122 7,317 6,906 7,053
Wages paid ($1,000) 118,500 117,708 122,723 113,485 138,214 134,290 146,144 151,703 142,135 157,164
Hourly wages $13.02 $14.25 $14.48 $15.63 $19.49 $20.37 $20.52 $20.73 $20.58 $22.28
Productivity (pounds per hour) 153.6 145.5 172.9 129.5 159.7 143.5 176.6 160.6 146.2 145.5
Table continued on next page.

I-8
Table I-2--Continued Certain orange juice: Comparative data from the original investigation and current review, fiscal years 2002/03-04/05 and 2005/06-10/11
(Quantity=1,000 pounds; value=$1,000; unit values are per pound)
Item 2001/02 2002/03 2003/04 2004/05 2005/06 2006/07 2007/08 2008/09 2009/10 2010/11
Net sales: Quantity
(3)
985,014
974,988
904,488
604,251
528,959
494,889
603,175
621,415
557,105
Value (3) 852,040 781,909 718,707 1,008,042 1,196,720 982,888 1,000,295 1,215,828 1,347,523
Unit value (3) $0.87 $0.80 $0.79 $1.67 $2.26 $1.99 $1.66 $1.96 $2.42
Cost of goods sold (3) 747,441 697,622 692,845 916,600 1,115,551 840,062 899,295 1,138,751 1,189,057
Gross profit or (loss) (3) 104,599 84,287 25,862 91,442 81,169 142,826 101,000 77,077 158,466
Operating income or (loss) (3) 71,310 51,733 (8,570) 13,794 21,839 92,982 46,242 16,019 91,991
Unit cost of goods sold (3) $0.76 $0.72 $0.77 $1.52 $2.11 $1.70 $1.49 $1.83 $2.13
Unit operating income or (loss) (3) $0.07 $0.05 ($0.01) $0.02 $0.04 $0.19 $0.08 $0.03 $0.17
Cost of goods sold/sales1 (3) 87.7 89.2 96.4 90.9 93.2 85.5 89.9 93.7 88.2
Operating income or (loss)/sales1
(3)
8.4
6.6
(1.2)
1.4
1.8
9.5
4.6
1.3
6.8
1 In percent. 2 In the final investigation, all reported imports of certain orange juice from Brazil were subject imports. 3 Financial data for fiscal year 2001/02 were not collected in the original investigation.
Note.–In the current review, subject imports were compiled from proprietary Customs data based on foreign manufacturers from Brazil that were assessed an antidumping duty. In this review, net by-product revenues are added to net sales values in the financial section because many extractor/processors treat them as part of sales and revenues and they were substantial and fluctuated over the period. For certain tollers for certain periods, by-product revenues were greater than tolling costs. Operating income and net income are the same whether by-product revenues are subtracted from cost of goods sold or treated as part of sales revenues. Financial and trade data are presented on different bases as well (tolling is included in trade data, but presented separately for financial data). Source: Data for the period 2001/02 through 2004/05 are compiled from data presented in the original staff report. Data for 2005/06 through 2010/11 are compiled from data submitted in response to Commission questionnaires and USDA data contained in Citrus Fruits Summary 2008 and 2011. Import data are compiled from official Commerce statistics and proprietary Customs data.

I-9
COMMERCE’S REVIEWS
Administrative Reviews14
Commerce has completed15 four administrative reviews of the outstanding antidumping duty order on certain orange juice from Brazil.16 The results of the administrative reviews are shown in table I- 3.
Table I-3 Certain orange juice: Administrative reviews of the antidumping duty order for Brazil
Date results published
Period of review
Producer or exporter Margin
(percent) August 11, 2008 73 FR 46584
August 24, 2005 - February 28, 2007
Fischer S.A. 4.81 Sucocitrico Cutrale, S.A. 0.45
August 11, 2009 74 FR 40167
March 1, 2007 - February 29, 2008
Fischer S.A. 0.00 Sucocitrico Cutrale, S.A. 2.17
August 18, 2010 75 FR 50999
March 1, 2008 - February 28, 2009
Fischer S.A. 5.26 Sucocitrico Cutrale, S.A. 8.13
August 12, 2011 76 FR 50176
March 1, 2009 - February 28, 2010
Coinbra-Frutesp (SA) (1) Fischer S.A. 3.97 Montecitrus Trading S.A. (1) Sucocitrico Cutrale, S.A. 0.42
(de minimis) 1 No shipments or sales subject to this review.
Source: Cited Federal Register notice.
Results of Five-Year Review
Commerce has issued the final results of its expedited review with respect to certain orange juice
from Brazil. Table I-4 presents the dumping margins calculated by Commerce in its original investigation and in its expedited review.
14 Commerce has not issued any duty absorption findings with respect to certain orange juice from Brazil. 15 A fifth administrative review for the period March 1, 2010 through February 28, 2011 was initiated on April
27, 2011. Initiation of Antidumping and Countervailing Duty Administrative Reviews, 76 FR 23545. 16 For previously reviewed or investigated companies not included in an administrative review, the cash deposit
rate continues to be the company-specific rate published for the most recent period.
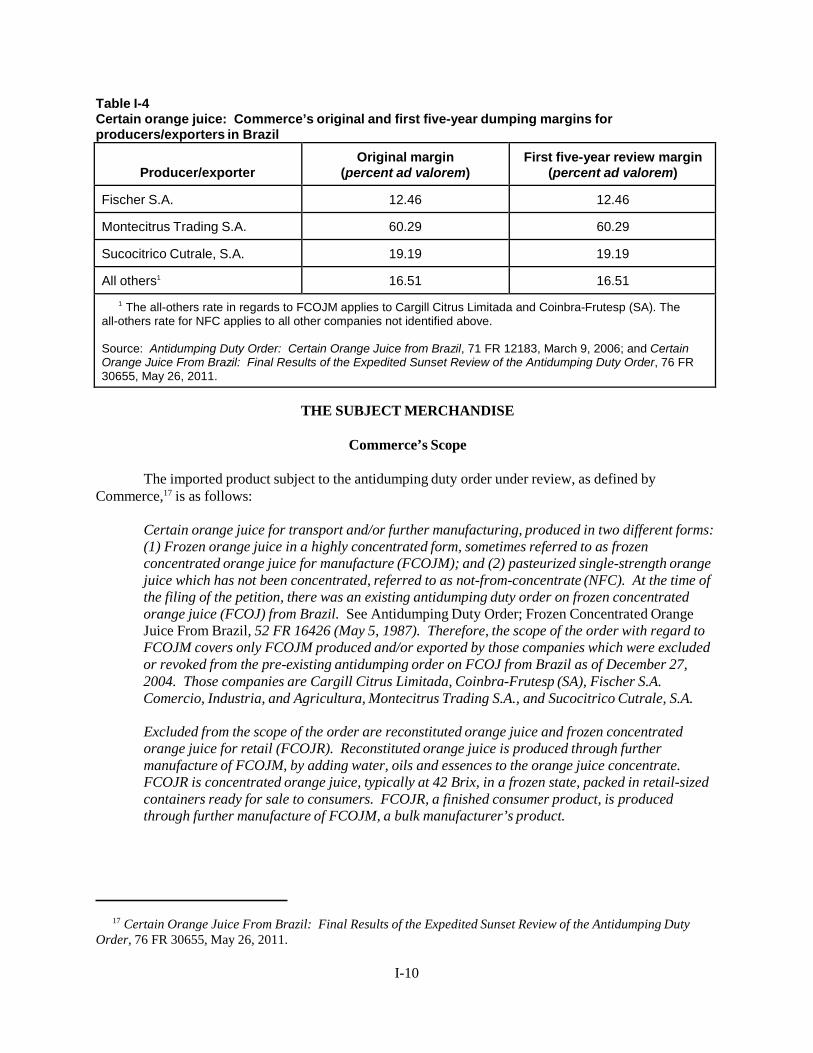
I-10
Table I-4 Certain orange juice: Commerce’s original and first five-year dumping margins for producers/exporters in Brazil
Producer/exporter Original margin
(percent ad valorem) First five-year review margin
(percent ad valorem)
Fischer S.A. 12.46 12.46
Montecitrus Trading S.A. 60.29 60.29
Sucocitrico Cutrale, S.A. 19.19 19.19
All others1 16.51 16.51
1 The all-others rate in regards to FCOJM applies to Cargill Citrus Limitada and Coinbra-Frutesp (SA). The all-others rate for NFC applies to all other companies not identified above.
Source: Antidumping Duty Order: Certain Orange Juice from Brazil, 71 FR 12183, March 9, 2006; and Certain Orange Juice From Brazil: Final Results of the Expedited Sunset Review of the Antidumping Duty Order, 76 FR 30655, May 26, 2011.
THE SUBJECT MERCHANDISE
Commerce’s Scope
The imported product subject to the antidumping duty order under review, as defined by Commerce,17 is as follows:
Certain orange juice for transport and/or further manufacturing, produced in two different forms: (1) Frozen orange juice in a highly concentrated form, sometimes referred to as frozen concentrated orange juice for manufacture (FCOJM); and (2) pasteurized single-strength orange juice which has not been concentrated, referred to as not-from-concentrate (NFC). At the time of the filing of the petition, there was an existing antidumping duty order on frozen concentrated orange juice (FCOJ) from Brazil. See Antidumping Duty Order; Frozen Concentrated Orange Juice From Brazil, 52 FR 16426 (May 5, 1987). Therefore, the scope of the order with regard to FCOJM covers only FCOJM produced and/or exported by those companies which were excluded or revoked from the pre-existing antidumping order on FCOJ from Brazil as of December 27, 2004. Those companies are Cargill Citrus Limitada, Coinbra-Frutesp (SA), Fischer S.A. Comercio, Industria, and Agricultura, Montecitrus Trading S.A., and Sucocitrico Cutrale, S.A.
Excluded from the scope of the order are reconstituted orange juice and frozen concentrated orange juice for retail (FCOJR). Reconstituted orange juice is produced through further manufacture of FCOJM, by adding water, oils and essences to the orange juice concentrate. FCOJR is concentrated orange juice, typically at 42 Brix, in a frozen state, packed in retail-sized containers ready for sale to consumers. FCOJR, a finished consumer product, is produced through further manufacture of FCOJM, a bulk manufacturer’s product.
17 Certain Orange Juice From Brazil: Final Results of the Expedited Sunset Review of the Antidumping Duty Order, 76 FR 30655, May 26, 2011.

I-11
Tariff Treatment
Certain orange juice is classifiable in the Harmonized Tariff Schedule of the United States (“HTS”) under subheadings 2009.11.00 (frozen orange juice); 2009.12.25 and 2009.12.45 (orange juice, not frozen, of a Brix value not exceeding 20), and 2009.19.00 (other orange juice). HTS subheadings are provided for convenience and customs purposes only; the written description of the subject merchandise in Commerce’s scope is dispositive. The column-1 general (normal trade relations) rate of duty for subheading 2009.12.25 is 4.5 cents/liter, while the rate for the other three subheadings is 7.85 cents/liter.
THE PRODUCT Description
and Applications
FCOJM is concentrated orange juice of 51 degrees or greater Brix in a frozen state.18 FCOJM is generally six or seven single strength concentrate, meaning that it requires the addition of water in a six or seven-to-one ratio to produce single strength, ready-to-drink orange juice. Most often FCOJM is at 65 degrees Brix when produced, imported, stored, or shipped. The bulk FCOJM is then stored at 20 degrees F or lower in a tank farm or in 55-gallon drums until it is sold or packaged for sale. NFCOJ is single strength orange juice that is never concentrated.
Both FCOJM and NFCOJ are used to produce ready-to-drink orange juice at the retail level. Both products are packaged into containers of various sizes. Instead of raising prices for the consumer, many orange juice brands have reduced their larger container sizes from 64 ounces to 59 ounces.19
FCOJM is also used in carbonated and noncarbonated nonjuice drinks, in multi-fruit drinks, as beverage bases, and as an ingredient in jams, jellies, and baby food.20 Consumption of NFCOJ as a share of total orange juice consumption has been growing annually as consumers increasingly prefer products that are perceived to be fresher.
Manufacturing Processes
Orange juice is manufactured directly from oranges. Oranges destined for processing differ from
those destined for the fresh market. Processing oranges typically provide a high juice yield, which results from sandy soil and a moist sub-tropical climate such as the one found in Florida, and are characterized as harder to peel and often less appealing in appearance than oranges for the fresh market. Because the appearance of processing oranges is not critical to the value of the fruit, minor scars from citrus canker or greening often does not prevent the fruit from being used. Oranges for the fresh market are typically grown in drier climates found in California and the Mediterranean basin and the fruit itself is generally drier, which lends itself to eating by hand. Orange juice characteristics such as color, flavor, sweetness, acidity, fragrance, pulp content, juice content, and texture are affected by the type of orange, the growing conditions, the time harvested, and the location where the orange was grown. Each of these characteristics is tested by the grower and processor before harvesting to ensure ideal juicing
18 Brix, as used in the citrus industry, is a measure of the total soluble solids in the juice or concentrate. These soluble solids are primarily sugars: sucrose, fructose, and glucose. Citric acid and minerals in the juice also contribute to the soluble solids. Brix is reported as "degrees Brix" and is equivalent to percentage. For example, a juice which is 12 degrees Brix has 12 percent total soluble solids. The Brix scale is a measure of the sugar content within the orange juice and also a measure of the degree of concentration, with the higher the Brix value the higher the level of concentration.
19 Industry representatives, interview by USITC staff, Florida, November 16-17, 2011. 20 Southern Gardens, Response to Notice of Institution, March 3, 2011, p. 6.
I-12
characteristics.21 The Hamlin orange variety is the most common early season variety grown in Florida. Valencia oranges are the most common mid to late-season variety grown in Florida and also account for the majority of the juicing oranges grown in Brazil. Juice from Valencia oranges has a darker color than juice from Hamlin oranges and the two are often mixed to achieve the ideal coloring.
Once the fruit is harvested and delivered to the processing facility, roughage from the grove is removed, the defective and unusable fruit is taken out by hand, and the fruit is washed. The fruit then enters the processing line. First, oils are removed from the peel by small blades. This oil is either added back to the juice for flavoring later or sold as additives for other products, such as soaps. The fruit is then sorted by size and juiced. After the juice is extracted, seeds, pulp, peel, and other extraneous material is filtered or centrifuged out of the juice. The juice is pasteurized through a gradual heating process so that it does not burn and is held at a specified temperature for a short time period, approximately 10-15 seconds. Once pasteurized, the juice is chilled and packaged or stored for future sale and/or packaging. Before the juice is packaged into retail sized containers, however, various amounts of pulp are put back into the juice to meet customer specifications and, in some cases, additives such as calcium and vitamins are added.
Processors often blend orange juice to attain certain characteristics specified by buyers such as color and Brix acid ratio.22 The juice, after extraction, is single strength with a concentration generally between 9 and 19 degrees Brix, with an average Brix value of 11.8 degrees.
Up until this point, orange juice intended for the NFCOJ market and the FCOJM market have gone through a similar process. Orange juice intended for the concentrate market is further processed by evaporation with vacuum and heat to remove excess water in order to obtain a base concentrate of 65 degree Brix, which is a seven-to-one strength ratio to single strength juice. The juice is then cooled to 20 degrees Fahrenheit or less in a tank farm or in 55-gallon drums.23 The juice may be transported in 55-gallon drums, but it is more commonly transported in bulk.24
Both NFCOJ and FCOJM are distributed throughout the country using a number of different modes of transportation. Frozen bulk orange juice may be loaded and unloaded onto ships, trucks, and trains through large hoses or flexible pipes. The product is typically shipped from Florida, even when imported, on refrigerated trains or trucks. Orange juice in FCOJM form is the most efficient kind of orange juice to transport and store since it takes up less space and weight than NFCOJ. FCOJM is reconstituted by adding water, oils, and essences. Reconstitution often takes place near the point of retail sale in order to save on transportation costs. NFCOJ is typically packaged into retail-size containers at the processing plant and then shipped by truck or train. However, it may also be shipped in bulk and packaged into retail-size containers near distribution points for major markets.
NFCOJ is stored a number of ways: frozen as blocks in warehouses; frozen in 55-gallon drums; chilled in large, stainless steel aseptic tanks; or chilled and placed in wooden boxes containing a plastic bag which holds about 300 gallons of juice. Most NFCOJ is stored in aseptic tanks, some of which hold over one million gallons, in refrigerated storage warehouses.25
With respect to organic orange juice, the U.S. Department of Agriculture implemented national organic standards on organic production and processing in October 2002. In 2008, Florida had 3,452
21 Industry representatives, interviews by USITC staff, Florida, November 16-17, 2011. 22 Industry representatives, interviews by USITC staff, Florida, November 16-17, 2011. 23 The high sugar level in orange juice prevents it from freezing into a solid state. The juice retains a liquid or
sludge-like state which allows it to be piped into storage tanks or transported. 24 Beginning in the late 1980s, U.S. and non-U.S. shippers began shifting away from 55-gallon drums and
towards bulk storage tanks which are more efficient to load and unload since less labor is needed and more orange juice can be transported on a given sized ship or truck. Industry representative, interview by USITC staff, Florida, November 17, 2011.
25 Industry representatives, interviews by USITC staff, Florida, November 16-17, 2011.

I-13
acres of organic citrus.26 However, the acreage dedicated to organic oranges for processing has reportedly declined as the need for more intensive pesticide spraying has increased in order to kill the Asian citrus psyllid and prevent the spread of the Huanglongbing virus, commonly referred to as greening.27 Organic orange juice is sold at the retail level in similar containers and forms as nonorganic orange juice, for example with or without pulp and with or without added vitamins, but only organic orange juice can be marketed with the USDA “organic” label in accordance with National Organic Program (“NOP”) regulations. Organic orange juice is rarely concentrated and typically sells for a significant premium.
Under the NOP Regulations, organic groves must be separate from conventional orange groves. In order for fruit to use the organic label, there must be a sufficient “buffer zone” between organic and conventional farms to ensure that synthetic pesticides and fertilizers do not accidentally reach an organic grove and a farm must be three years removed from any use of synthetic pesticides or fertilizers. Harvested organic oranges may not be commingled with conventional oranges or in contact with residues from synthetic pesticides or fertilizers. Organic orange juice processors must also comply with NOP regulations in order to use the organic label. For example, a processing facility must have separate organic “runs” through the plant, and the facility must clean all of its equipment prior to the runs.28
DOMESTIC LIKE PRODUCT ISSUES
In its original determination, the Commission found one domestic like product, consisting of
conventional FCOJM, conventional NFCOJ, organic FCOJM, and organic NFCOJ.29 The Commission defined the domestic industry as both orange growers and all domestic extractors/processors of certain orange juice.30 In its notice of institution in this current five-year review, the Commission solicited comments from interested parties regarding the appropriate domestic like product and domestic industry.31
FCM, Citrus World, and Peace River indicated that they agree with the Commission’s definitions of the domestic like product and the domestic industry, which was set forth in the notice of institution of this review.32 No other interested party provided further comment on the domestic like product, or requested that the Commission collect data concerning other possible domestic like products in their comments on the Commission’s draft questionnaires.
U.S. MARKET PARTICIPANTS
U.S. Producers
During the original investigation, 12 extractors/processors and 36 growers supplied the Commission with information on their U.S. operations with respect to certain orange juice. These firms accounted for more than 90 percent of U.S. production of certain orange juice and approximately 12
26 USDA, ERS, Organic Production: Certified Organic Fruit Acreage, by State, 2008; Table 11, http://www.ers.usda.gov/Data/Organic.
27 Industry representative, interview by USITC staff, Florida, November 17, 2011. 28 Minnesota Department of Agriculture, “Organic Food Processing Basics,” March 2005. 29 Certain Orange Juice from Brazil, Inv. No. 731-TA-1089 (Final), USITC Publication 3838, March 2006, p. 9. 30 Certain Orange Juice from Brazil, Inv. No. 731-TA-1089 (Final), USITC Publication 3838, March 2006, p.
13. 31 Orange Juice From Brazil, 76 FR 5822, February 2, 2011. 32 FCM, Citrus World, and Peace River Product’s response to the notice of institution, March 3, 2011, p. 27.

I-14
percent of oranges harvested in crop year 2004/05.33 In this current proceeding, the Commission issued extractor/processor questionnaires to 25 firms, eight of which provided the Commission with information on their certain orange juice operations.34 These firms are believed to account for virtually all35 of U.S. production of certain orange juice in crop year 2010/11. The Commission issued grower questionnaires to 410 growers of oranges used for the production of orange juice, 19 of which provided the Commission with information. Presented in table I-5 is a list of current domestic extractors/processors of certain orange juice and each company’s position on the continuation of the order, production location(s), related and/or affiliated firms, and share of reported production of certain orange juice in 2010/11.
Table I-5 Certain orange juice: U.S. extractors/processors, positions on the order, U.S. production location(s), related and/or affiliated firms, and shares of 2010/11 reported U.S. production
Firm
Position on continuation of
the order
U.S. production location(s)
Share of 2010/11
production (percent)
Citrosuco NA1 *** Lake Wales, FL; Wilmington, DE ***
Citrus World *** Lake Wales, FL ***
Cutrale USA2 ***3 Auburndale, FL; Leesburg, FL; Dade City, FL ***
Louis Dreyfus4 *** Winter Garden, FL ***
Peace River *** Arcadia, FL; Bartow, FL ***
Southern Gardens5 *** Clewiston, FL ***
Sun Orchard *** Tempe, AZ; Haines City, FL ***
Tropicana6 *** Bradenton, FL *** 1 Citrosuco NA is ***. 2 Cutrale USA is ***. 3 ***. 4 Louis Dreyfus is ***. 5 Southern Gardens is ***. 6 Tropicana is ***.
Note.–Because of rounding, shares may not total to 100.0 percent. The Commission also received a questionnaire response from ***.
Source: Compiled from data submitted in response to Commission questionnaires.
33 Of the 12 extractor/processors that supplied the Commission with usable questionnaire information during the original investigation, seven have provided responses to the current review, two did not respond to the Commission’s questionnaire, one provided an incomplete response, one no longer processes certain orange juice, and one ceased operating in 2007. The Commission also received a questionnaire response from one extractor/processor that did not provide data in the original investigation.
34 In addition, the Commission received one incomplete questionnaire response. 35 Coverage is based on reported production (1.03 billion pounds) versus USDA reported production (0.93 billion
pounds). Reported production is higher than USDA production because questionnaire data includes certain orange juice blended with imports and/or purchases.

I-15
As indicated in table above, three U.S. extractors/processors are related to foreign producers of the subject merchandise from Brazil and two are related to U.S. importers of the subject merchandise from Brazil. In addition, as discussed in greater detail in Part III, three U.S. extractors/processors directly import the subject merchandise and four purchase the subject merchandise from U.S. importers.
U.S. Importers
In the original investigation, eight U.S. importing firms supplied the Commission with usable
information on their operations involving the importation of certain orange juice, accounting for the vast majority of U.S. imports of certain orange juice from Brazil during crop years 2001/02 through 2004/05. Of the eight responding U.S. importers, four were domestic extractor/processors of certain orange juice.
In this current proceeding, the Commission issued importers’ questionnaires to 36 firms believed to be importers of subject certain orange juice, as well as to all U.S. extractors/processors of certain orange juice. Usable questionnaire responses were received from nine companies, representing virtually all36 total imports from Brazil in crop years 2005/06-2010/11. Table I-6 lists all responding U.S. importers of certain orange juice, their headquarters, and their shares of subject imports from Brazil in 2010/11.
Table I-6 Certain orange juice: U.S. importers, U.S. headquarters, source(s) of imports, and shares of subject imports in 2010/11
Firm
Headquarters
Source of imports
Share of subject 2010/11 imports from Brazil (percent)
FCOJM NFCOJ Total
Citrosuco NA Lake Wales, FL *** *** *** ***
Citrus Products Newark, NJ *** *** *** ***
Citrus World Lake Wales, FL *** *** *** ***
Fuerst Day Lawson London, United Kingdom *** *** *** ***
Louis Dreyfus Winter Garden, FL *** *** *** ***
Minute Maid Toronto, Canada *** *** *** ***
Rahal Foods Oak Brook, IL *** *** *** ***
Tampa Juice Service Tampa, FL *** *** *** ***
Votorantim Newark, DE *** *** *** ***
Total 100.0 100.0 100.0
Note.–Because of rounding, figures may not add to the totals shown. The Commission also received ***. Source: Compiled from data submitted in response to Commission questionnaires.
36 Proprietary Customs data reports *** firms importing orange juice from Brazil in calendar year 2010. The Commission received the *** largest importers’ questionnaires; those companies accounted for virtually all (*** percent) of U.S. imports from Brazil for 2010.

I-16
U.S. Purchasers
The Commission received questionnaires from 30 purchasers, 24 of which reported that they had bought certain orange juice since October 1, 2005. Four of the purchasers *** are related to importers of certain orange juice, and three stated that they are related to extractor/processors of certain orange juice ***. Seven reported that they are reconstituter/repackers, six are food processors, three are retail or food service outlets, five are distributors, three are dairy processors, and seven described themselves in some other way.37
APPARENT U.S. CONSUMPTION AND MARKET SHARES
Data concerning apparent U.S. consumption and market shares of certain orange juice during the
period for which data were collected in this proceeding are shown in table I-7 and figures I-1 and I-2. Official Commerce import statistics and proprietary Customs data were used to derive the import component of apparent U.S. consumption.
37 *** submitted two purchaser questionnaires, one with respect to FCOJM purchases and the other with respect to NFCOJ purchases.

Item
Crop year
2005/06 2006/07 2007/08 2008/09 2009/10 2010/11
Quantity (1,000 gallons SSE)
FCOJM:
Beginning stocks 230,059 179,810 185,330 305,491 289,556 217,358
U.S. production 364,682 349,043 569,788 500,495 351,514 349,262
Minus: U.S. exports 50,882 48,056 67,034 59,021 61,332 83,931
Minus: Ending stocks 169,422 148,701 318,904 327,683 233,230 157,032
Total domestic shipments 374,437 332,096 369,180 419,284 346,507 325,656
U.S. imports from Brazil (subject) *** *** *** *** *** ***
U.S. imports from Brazil (nonsubject) *** *** *** *** *** ***
U.S. imports from all other sources 91,175 128,541 144,168 129,517 127,884 114,205
Total U.S. imports 91,175 128,541 144,168 129,517 127,884 191,999
Apparent U.S. consumption 640,289 673,328 712,315 657,447 610,650 517,656
NFCOJ:
Beginning stocks 393,221 279,190 194,258 347,679 411,062 346,972
U.S. production 623,319 541,957 597,235 569,613 499,020 557,531
Minus: U.S. exports 86,969 74,617 70,263 67,171 87,069 133,980
Minus: Ending stocks 289,578 230,887 334,266 372,935 331,100 250,673
Total domestic shipments 639,993 515,644 386,963 477,186 491,912 519,850
U.S. imports from Brazil 25,011 47,870 47,465 62,062 46,630 49,909
U.S. imports from all other sources 2,116 2,838 2,783 1,269 3,315 4,242
Total U.S. imports 27,127 50,708 50,248 63,331 49,945 54,151
Apparent U.S. consumption 667,119 566,352 437,211 540,516 541,856 574,000
Total:
Beginning stocks 623,280 459,000 379,588 653,170 700,617 564,330
U.S. production 988,000 891,000 1,167,022 1,070,108 850,534 906,793
Minus: U.S. exports 137,851 122,673 137,297 126,192 148,402 217,911
Minus: Ending stocks 459,000 379,588 653,170 700,617 564,330 407,705
Total domestic shipments 1,014,430 847,740 756,143 896,469 838,419 845,506
U.S. imports from Brazil (subject) *** *** *** *** *** ***
U.S. imports from Brazil (nonsubject) *** *** *** *** *** ***
U.S. imports from all other sources 93,291 131,379 146,951 130,786 131,199 118,446
Total U.S. imports 93,291 131,379 393,383 301,494 314,088 246,150
Apparent U.S. consumption 1,307,408 1,239,680 1,149,526 1,197,963 1,152,507 1,091,656
Table I-7 Certain orange juice: Beginning stocks, U.S. production, U.S. imports, total supply, U.S. shipments, U.S. exports, ending stocks, apparent U.S. consumption, and market shares, crop years 2005/06-2010/11
Table continued on next page.
I-17
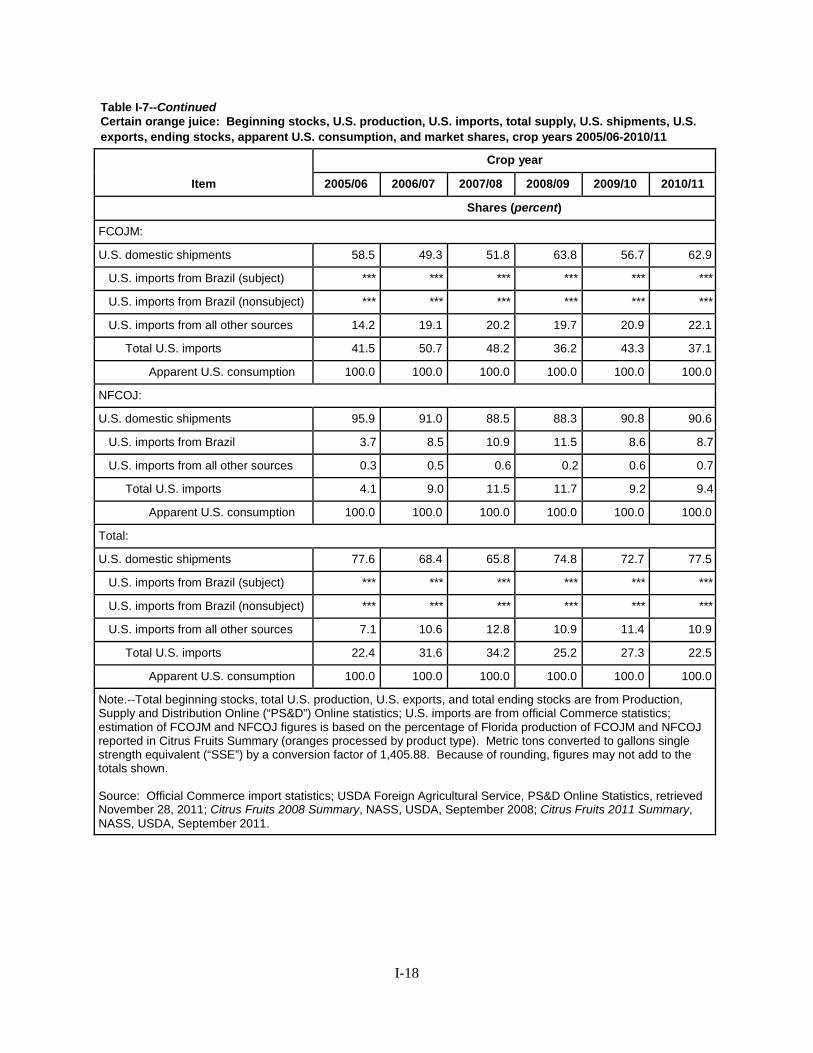
I-18
Table I-7--Continued Certain orange juice: Beginning stocks, U.S. production, U.S. imports, total supply, U.S. shipments, U.S. exports, ending stocks, apparent U.S. consumption, and market shares, crop years 2005/06-2010/11
Item
Crop year
2005/06 2006/07 2007/08 2008/09 2009/10 2010/11
Shares (percent)
FCOJM:
U.S. domestic shipments 58.5 49.3 51.8 63.8 56.7 62.9
U.S. imports from Brazil (subject) *** *** *** *** *** ***
U.S. imports from Brazil (nonsubject) *** *** *** *** *** ***
U.S. imports from all other sources 14.2 19.1 20.2 19.7 20.9 22.1
Total U.S. imports 41.5 50.7 48.2 36.2 43.3 37.1
Apparent U.S. consumption 100.0 100.0 100.0 100.0 100.0 100.0
NFCOJ:
U.S. domestic shipments 95.9 91.0 88.5 88.3 90.8 90.6
U.S. imports from Brazil 3.7 8.5 10.9 11.5 8.6 8.7
U.S. imports from all other sources 0.3 0.5 0.6 0.2 0.6 0.7
Total U.S. imports 4.1 9.0 11.5 11.7 9.2 9.4
Apparent U.S. consumption 100.0 100.0 100.0 100.0 100.0 100.0
Total:
U.S. domestic shipments 77.6 68.4 65.8 74.8 72.7 77.5
U.S. imports from Brazil (subject) *** *** *** *** *** ***
U.S. imports from Brazil (nonsubject) *** *** *** *** *** ***
U.S. imports from all other sources 7.1 10.6 12.8 10.9 11.4 10.9
Total U.S. imports 22.4 31.6 34.2 25.2 27.3 22.5
Apparent U.S. consumption 100.0 100.0 100.0 100.0 100.0 100.0
Note.--Total beginning stocks, total U.S. production, U.S. exports, and total ending stocks are from Production, Supply and Distribution Online (“PS&D”) Online statistics; U.S. imports are from official Commerce statistics; estimation of FCOJM and NFCOJ figures is based on the percentage of Florida production of FCOJM and NFCOJ reported in Citrus Fruits Summary (oranges processed by product type). Metric tons converted to gallons single strength equivalent (“SSE”) by a conversion factor of 1,405.88. Because of rounding, figures may not add to the totals shown.
Source: Official Commerce import statistics; USDA Foreign Agricultural Service, PS&D Online Statistics, retrieved November 28, 2011; Citrus Fruits 2008 Summary, NASS, USDA, September 2008; Citrus Fruits 2011 Summary, NASS, USDA, September 2011.
I-19
Figure I-1 Certain orange juice: Apparent U.S. consumption, by sources, crop years 2005/06-2010/11
* * * * * * *
Figure I-2 Certain orange juice: Market shares, by sources, crop years 2005/06-2010/11
* * * * * * *


II-1
PART II: CONDITIONS OF COMPETITION IN THE U.S. MARKET
U.S. MARKET CHARACTERISTICS
Both FCOJM and NFCOJ are sold to retail and food service outlets, producers of various food products, dairy processors, and commodity businesses. They are both also sold to reconstitutors and repackers for use in such end products as reconstituted orange juice, ready-to-serve orange juice, multi- fruit juice blends, and baby food. Most U.S. extractor/processors and importers that sell FCOJM and NFCOJ at the wholesale level sell nationally.
CHANNELS OF DISTRIBUTION
Approximately two-thirds of FCOJM was shipped commercially in each year between 2005/06
and 2010/11. Internal consumption accounted for between *** and *** percent of shipments in the period of review, while transfers and exports accounted for between *** and *** percent and *** and *** percent, respectively.
In contrast, the majority (*** percent during 2005/06-2010/11) of domestically produced NFCOJ reportedly is used internally by U.S. producers for the production of retail single-strength NFCOJ.1 This ratio decreased, however, from *** percent in 2005/06 to *** percent in 2010/11. Commercial shipments accounted for slightly more than *** to slightly more than *** of U.S. NFCOJ production in 2005/06- 2010/11, increasing from *** percent in 2005/06 to *** percent in 2010/11. The remainder was transferred to related firms or exported.
Commercially, nearly all domestically produced and imported FCOJM and NFCOJ is sold to end users, as presented in table II-1. Furthermore, nearly all end users’ shipments of both FCOJM and NFCOJ was to remanufacturers and packagers.
1 These data are driven by ***.

II-2
Table II-1 Certain orange juice: Channels of distribution for commercial shipments of domestic product and subject and nonsubject imports sold in the U.S. market (as a percent of total shipments), by year and by source, 2005/06-2010/11 2005/06 2006/07 2007/08 2008/09 2009/10 2010/11
FCOJM: Domestic Industry Share of quantity (percent)
Shipments to distributors 0 0 0 0 0 0
Shipments to end users 100.0 100.0 100.0 100.0 100.0 100.0
Brazil (subject):
Shipments to distributors 0 0 0 0 0 0
Shipments to end users 100.0 100.0 100.0 100.0 100.0 100.0
Brazil (nonsubject):
Shipments to distributors 0 0 0 0 0 0
Shipments to end users 100.0 100.0 100.0 100.0 100.0 100.0
Other nonsubject countries:
Shipments to distributors 0 0 0 0 0 0
Shipments to end users 100.0 100.0 100.0 100.0 100.0 100.0
NFCOJ: Domestic Industry
Shipments to distributors *** *** *** *** *** ***
Shipments to end users *** *** *** *** *** ***
Brazil:
Shipments to distributors 0 0 0 0 0 0
Shipments to end users 100.0 100.0 100.0 100.0 100.0 100.0
Note.--End users include remanufacturers and packagers, food processors, and other end users. Nearly all shipments to end users were shipped to remanufacturers and packagers. Note.--There were no nonsubject shipments of NFCOJ during the period for which data were collected
Source: Compiled from data submitted in response to Commission questionnaires.
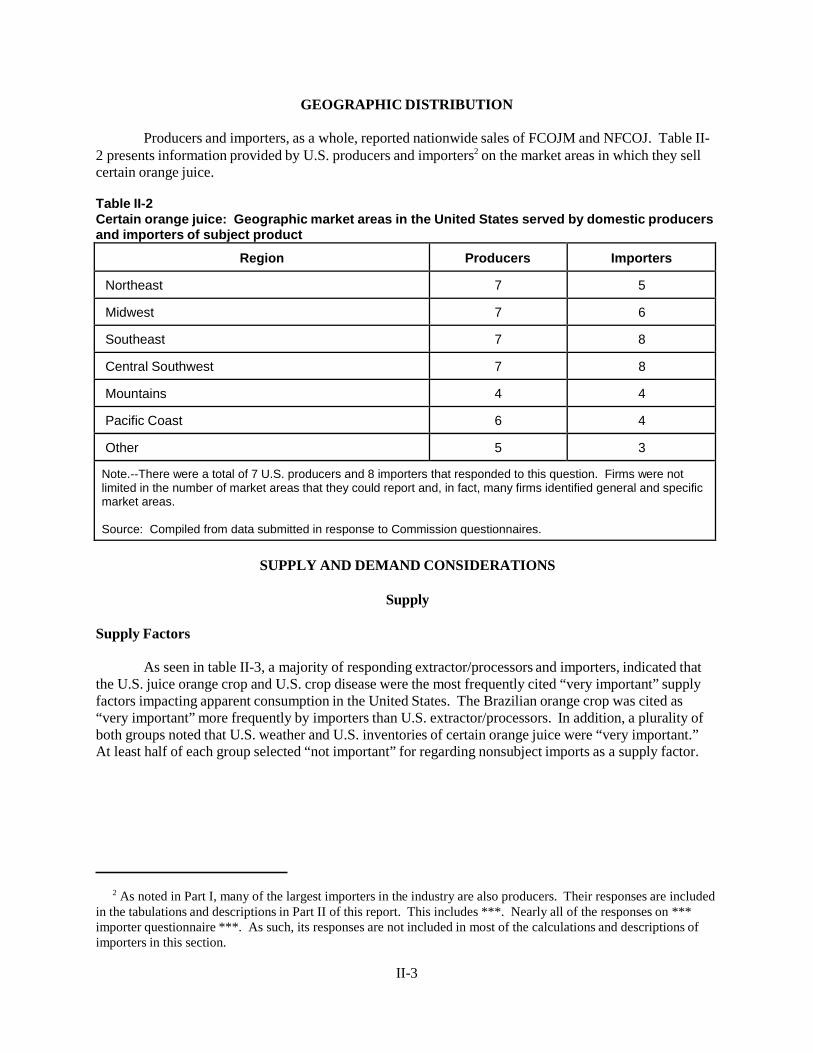
II-3
GEOGRAPHIC DISTRIBUTION
Producers and importers, as a whole, reported nationwide sales of FCOJM and NFCOJ. Table II- 2 presents information provided by U.S. producers and importers2 on the market areas in which they sell certain orange juice.
Table II-2 Certain orange juice: Geographic market areas in the United States served by domestic producers and importers of subject product
Region
Producers
Importers
Northeast 7 5
Midwest 7 6
Southeast 7 8
Central Southwest 7 8
Mountains 4 4
Pacific Coast 6 4
Other 5 3
Note.--There were a total of 7 U.S. producers and 8 importers that responded to this question. Firms were not limited in the number of market areas that they could report and, in fact, many firms identified general and specific market areas.
Source: Compiled from data submitted in response to Commission questionnaires.
SUPPLY AND DEMAND CONSIDERATIONS
Supply
Supply Factors
As seen in table II-3, a majority of responding extractor/processors and importers, indicated that
the U.S. juice orange crop and U.S. crop disease were the most frequently cited “very important” supply factors impacting apparent consumption in the United States. The Brazilian orange crop was cited as “very important” more frequently by importers than U.S. extractor/processors. In addition, a plurality of both groups noted that U.S. weather and U.S. inventories of certain orange juice were “very important.” At least half of each group selected “not important” for regarding nonsubject imports as a supply factor.
2 As noted in Part I, many of the largest importers in the industry are also producers. Their responses are included in the tabulations and descriptions in Part II of this report. This includes ***. Nearly all of the responses on *** importer questionnaire ***. As such, its responses are not included in most of the calculations and descriptions of importers in this section.

II-4
Table II-3 Certain orange juice: Perceived degree of impact of various supply factors on apparent consumption
Supply factor
Number of U.S. extractor/
processors reporting
Number of U.S.
importers reporting
V S N V S N
U.S. juice orange crop 5 3 0 7 1 1
U.S crop disease 5 3 0 5 3 1
U.S. weather 4 3 1 5 2 2
U.S. inventories of certain orange juice 4 2 2 4 3 2
Brazilian orange crop 3 2 3 5 2 2
U.S. certain orange juice pricing 3 2 3 2 4 3
Subject imports of certain orange juice 2 4 2 2 2 4
Nonsubject imports of certain orange juice 0 3 5 1 3 4
Note.--V=very important; S=somewhat important; N=not important. Note.--As noted earlier in Part II, four of the extractor/processors are also importers (***) and are included in both tabulations.
Source: Compiled from data submitted in response to Commission questionnaires.
U.S. Supply
The United States is the world’s second-largest producer of orange juice, and produced 30 percent of the world’s orange juice in 2010, a one percentage point decrease from 2005.3 Based on available information, U.S. extractor/processors of FCOJM and NFCOJ have the capability to respond to changes in demand with moderate changes in the quantity of shipments of U.S.-produced FCOJM and NFCOJ to the U.S. market. The main contributing factor to the moderate degree of responsiveness of supply is the availability of inventories and some ability to ship to/from alternative markets; this responsiveness is moderated by the unavailability of industry capacity due to the fixed supply of juice oranges, the main raw material for FCOJM and NFCOJ.
Six extractor/processors indicated that there have been changes that have affected supply since October 1, 2005. These factors include labor costs, grove costs, disease, pest infestation, volatility in transportation costs and the FCOJ4 market, reduced trees, energy costs, and spray fertilizer costs.
3 World OJ Situation: Florida Growers’ Role in Future Opportunities, presented at the Florida Citrus Industry 7th
Annual Meeting, Robert Norberg, Florida Department of Citrus, June 2011, and submitted in *** extractor/processor questionnaire response. These data are based on mixed crop years, but are valid when comparing trends. E-mail from ***.
4 FCOJ refers to frozen concentrated orange juice in a general sense, without distinction based on use.

II-5
Industry capacity
The production of FCOJM is largely dependent on the supply of oranges. Juice processors purchase approximately 95 percent of Florida fresh orange production.5 Roughly three-quarters of domestic orange juice production comes from oranges sourced domestically, while approximately 15 percent is produced from domestically produced orange solids. The remainder is produced using orange solids from other countries. Figure II-1 shows domestic certain orange juice capacity utilization and the production from fresh oranges from 2005/06 to 2010/11.
Figure II-1 Certain orange juice: Domestic producers’ capacity utilization and production from fresh oranges, 2005/06-2010/11
Note.--SE=”solids equivalent.”
Source: Tables III-5 and III-6.
U.S. extractor/processors’ reported capacity utilization for FCOJM decreased irregularly from 81.4 percent to 67.0 percent between crop years 2005/06 and 2010/11. It was lowest in 2006/07 at 62.5 percent, but highest the next year at 96.4 percent. U.S. extractor/processors’ reported capacity utilization for NFCOJ was lower in each year compared with their capacity utilization for FCOJM except 2006/07. It, too, decreased irregularly, however, from 74.4 percent to 66.6 percent between crop years 2005/06 and 2010/11, ranging between 61.5 and 74.4 percent. This level of capacity utilization indicates that U.S.
5 Certain Orange Juice From Brazil , Inv. No. 731-TA-1089 (Final), USITC Publication 33838, March 2006, p. II-1.
II-6
extractor/processors of FCOJM and NFCOJ have some excess capacity with which they could increase production in the event of a price change.
Additionally, all 8 domestic producers purchased certain orange juice from other domestic producers, 7 of 8 bought imported orange juice, and 4 of 8 purchased orange juice on the futures market or from financial firms such as ***. This purchased orange juice is used to supplement production and increase sales. This ability enhances the domestic industry’s ability to maintain enough juice to satisfy their customers’ demands.
Alternative markets
Domestic extractor/processors’ export shipments of FCOJM decreased from 8.4 percent of total shipments in 2005/06 to 6.4 percent of total shipments in 2007/08 before increasing to 10.4 percent of total shipments in 2010/11. Their export shipments of NFCOJ increased from 1.6 percent of total shipments in 2005/06 to 4.4 percent of total shipments in 2009/10 before decreasing to 2.4 percent in 2010/11. In addition, firms can sell their production into the futures market. In addition to allowing them to hedge against price swings, the futures market also allows firms to shift the timing of their shipments based on their ability to supply extra orange juice to the market or purchase . These data indicate that U.S. extractor/processors have some ability to divert shipments of total certain orange juice and FCOJM to or from alternative markets in response to changes in price, but less ability to divert shipments of NFCOJ to or from alternative markets.
Inventory levels
U.S. extractor/processors’ inventories of FCOJM, as a percentage of total shipments, were highly variable, decreasing from 30.2 percent of total shipments in 2005/06 to 17.7 percent in 2006/07 before increasing to over 40 percent in 2007/08 and 2008/09, and finally decreasing again to 20.7 percent of shipments by 2010/11.6 U.S. extractor/processors’ inventories of NFCOJ were less variable, but followed the same trend: decreasing from 24.3 percent of their shipments in 2005/06 to 23.0 percent in 2006/07 before increasing to over 30 percent in 2007/08 and 2008/09, and finally decreasing again to 27.4 percent of shipments by 2010/11.7 U.S. producer inventories reached their low marks in 2005/06 and 2006/07 in the wake of 4 hurricanes in two years, which led to low crops in each of these years. According to the USDA Cold Storage Report, domestic inventories of FCOJ were 43 percent lower in September 2011 than one year earlier and 22 percent lower in December 2011 than one year earlier.8 Given that a certain stock of inventory must be maintained due to the seasonal nature of orange production, these data indicate that U.S. extractor/processors generally have had some ability to use inventories as a means of increasing
6 This level is equivalent to slightly less than 11 weeks’ inventory. Testimony at the hearing noted that 12 weeks of inventory are necessary to maintain production until the harvest begins in earnest in January, but 16-20 weeks is more comfortable amount. More than this amount could lead to more costly storage. Hearing testimony, pp. 93-94 (Warlick). Some testimony presented at the hearing referenced inventory levels as of June 30th. When comparing these data to testimony presented in the hearing, 12 additional weeks of inventory should be added.
7 This level is equivalent to slightly more than 14 weeks’ inventory. 8 These levels also represent actual levels lower than the FCOJ inventory levels in September and December of
2006 and 2007, though shipments of FCOJ have decreased over this period. USDA Cold Storage Report, various issues, found at http://usda.mannlib.cornell.edu/MannUsda/viewDocumentInfo.do?documentID=1034.

II-7
shipments of FCOJM and NFCOJ to the U.S. market, though inventory levels presently are at comparatively low levels.
Production alternatives
Five of eight extractor/processors reported they can produce other products using the same equipment and machinery and/or the same production and related workers employed to certain orange juice, while three reported they do not. The most frequently-cited substitute in production was grapefruit juice, although lemonade and other citrus drinks were also noted.
Raw material availability
Numerous market participants noted that raw material availability has played a part in the market since October 1, 2005, including all responding extractor/processors. The primary raw material in making orange juice is oranges, which reportedly make up 80 percent of the cost of production, as noted by ***. It also stated that Florida orange production decreased from 225 million boxes to 150 million boxes since 2005/06, leading to a significant increase in fruit prices. Both crop freezes and tree diseases have contributed to this decrease in orange production.9 *** further noted that the availability of grapefruit for purchase has decreased by about half, affecting ***. Purchasers noted that energy prices are higher, as are commodity costs for sugar (and “maybe even soybeans and grains”10) which contributed to shifting land away from orange groves, as did the conversion of some orange groves to housing developments when land prices were high in 2005.
The Florida crop of oranges has varied considerably since 2005/06. It reached a high of 170 million boxes in 2007/08 and a low of 129 million boxes in 2006/07. In 2011/12, the USDA estimates that the crop will be 150 million boxes of oranges (an increase of around 10 million boxes from 2010/11), despite a 1 percent decrease in the number of round-orange trees (57.4 million).11 For further detail, see Figure II-2. The inventory of trees is compiled biennially and has been steadily declining since 2000, from 87.2 million trees in that year to 70.9 million trees in 2006 and 63.8 million trees in 2010.12 The FCOJ yield from oranges this year is forecasted to be 1.60 gallons per box of 42° brix concentrate. Last season’s final yield was 1.586 gallons per box, and the record yield of 1.673 was set in 2007/08.13
Ninety-six percent of Florida’s oranges is processed into juice. The Florida orange harvest season typically runs from September (for some early varieties) to July, with Valencia oranges, the dominant type of Florida juice orange, being harvested in February through July. Since orange juice can be frozen and stored for long periods of time, however, through planning, supply of FCOJM and NFCOJ does not experience seasonal availability variances.
9 *** extractor/processor questionnaire response and *** purchaser questionnaire responses. 10 *** purchaser questionnaire responses. 11 USDA National Agricultural Statistics Service (“NASS”), Citrus December Forecast, December 9, 2011. 12 2010 included temple oranges which were not included in prior years. Florida Agricultural Statistics Service,
Commercial Citrus Inventory, various issues, included in Florida Citrus Production Trends 2012-13 Through 2020- 21, Florida Department of Citrus, February 2011 and submitted in *** extractor/processor questionnaire response.
13 USDA National Agricultural Statistics Service (“NASS”), Citrus November Forecast, November 9, 2011.

II-8
Figure II-2 Certain orange juice: Florida orange crop, yearly, crop years 2005/06-2010/11, and 2011/12 (est.)
Source: USDA, NASS, Citrus December Forecast, December 9, 2011, and previous releases.
Subject Imports14
Brazil in the world’s largest producer of orange juice, producing 54 percent of the world’s orange juice in 2010, down from 57 percent in 2005.15 Based on available information, the subject Brazilian extractor/processors have the capability to respond to changes in demand with large changes in the quantity of shipments of FCOJM and NFCOJ to the U.S. market. The main contributing factors to the large degree of responsiveness of supply are the existence of alternate markets and inventories.
Extractor/processors and importers were asked whether there have been changes in the availability of supply of subject imports since 2005. Six of seven extractor/processor and five of six importers stated that availability had changed for subject imports since 2005. Crop variability has led to certain orange juice availability. Three firms noted that increasing Brazilian commitments to European and/or Asian markets has led to less availability in the United States, with *** stating that this is due to the antidumping measures being put in place. Weather and disease have also reportedly impacted Brazilian crops, leading to lower harvests. Importer *** noted that “Since 2005, there has been substantial increase in cost of labor, land value, energy in Brazil as well as substantial strengthening of
14 Eleven importers provided data in response to the Commission’s questionnaire. These firms account for virtually all subject imports of certain orange juice from Brazil since October 1, 2005.
15 World OJ Situation: Florida Growers’ Role in Future Opportunities, presented at the Florida Citrus Industry 7th
Annual Meeting, Robert Norberg, Florida Department of Citrus, June 2011, and submitted in *** extractor/processor questionnaire response.

II-9
the local currency vs. the US dollar.”16 Six of eight extractor/processors and three of seven responding importers anticipate no change in the availability of subject imports from Brazil in the United States, whereas one extractor/processor and four importers anticipate an increase in availability.
Industry capacity
Subject Brazilian extractor/processors reported that capacity utilization for FCOJM decreased irregularly from 70.0 percent in 2005/06 to a period low of 56.2 percent in 2010/11. For NFCOJ, subject Brazilian capacity utilization increased from 62.2 percent in 2005/06 to 76.0 percent in 2007/08 before decreasing to 61.7 percent in 2010/11. Although this level of capacity utilization would indicate that subject Brazilian extractor/processors have unused capacity with which they could increase production of FCOJM and NFCOJ in the event of a price change, as in the United States, this ability is limited by the availability of juice oranges in the home market. The 2011 USDA GAIN report lists expected production of FCOJ17 to increase 32 percent between Brazilian marketing year 2010/11 and 2011/1218 but decrease 14 percent in Brazilian marketing year 2012/13.
Alternative markets
Subject Brazilian extractor/processors’ shipments of FCOJM to markets other than the United States (i.e., their home market and other export markets) increased irregularly from *** percent of shipments in 2005/06 to *** percent of shipments in 2010/11, and their shipments of NFCOJ to other markets decreased irregularly from *** percent of shipments in 2005/06 to *** percent of shipments in 2010/11. These data indicate that subject Brazilian extractor/processors have the ability to divert shipments to or from alternative markets in response to changes in the price of FCOJM and NFCOJ. Brazilian respondent interested parties argued that Europe and Asia have “first call” on Brazilian production.19 Europe is Brazil’s largest market, and Brazilian exports to Asia have replaced North America as Brazil’s second largest market.20
Though the majority of Brazil’s orange juice is exported, there has been increasing consumption in Brazil. The USDA GAIN report expects domestic consumption of FCOJ in Brazil to increase 14 percent between BR2010/11 and BR2011/12 and a further 5 percent in BR2012/13, but would still only account for less than 5 percent of Brazil’s production.21
16 *** importer questionnaire response. 17 Includes NFCOJ on an FCOJ basis. 18 Brazilian marketing year 2010/11 is July 2010-June 2011 and will be referred to in the rest of this Part as BR
2010/11. 19 Brazilian respondent interested parties prehearing brief, p. 17. 20 “Florida Citrus Outlook 2011-12 Season,” Florida Department of Citrus, October 19, 2011. 21 “Brazil Citrus Annual,” USDA GAIN Report, December 7, 2011.

II-10
Inventory levels
Subject Brazilian extractor/processors’ inventories, as a percentage of shipments of FCOJM, varied considerably, decreasing from *** percent of shipments in 2005/06 to *** percent in 2006/07. These inventories then more than doubled, to *** percent of total shipments in 2007/08, but have been decreasing since that time and were *** percent at the end of 2010/11. Subject Brazilian extractor/ processors’ inventories, as a percentage of shipments of NFCOJ, were more steady, but decreased from *** percent of shipments in 2005/06 to a period low of *** percent in 2010/11.22 Given that a certain stock of inventory must be maintained due to the seasonal nature of orange production, these data indicate that subject Brazilian extractor/processors have a somewhat limited ability to use U.S. inventories as a means of increasing shipments of FCOJM and NFCOJ to the U.S. market.
The beginning levels of orange juice inventory in Brazil as of July 2011 were extremely low, according to both the USDA and the Florida Department of Citrus (86 and 88 percent lower in July 2011 than one year earlier, respectively).23 Both sources also expect these inventories to return to higher inventory levels than in 2009/10. The Brazilian government has started a new financing program which will encourage increased inventories (of up to 17 percent of Brazil’s anticipated current crop) until at least July 1, 2012.24 This inventory rebuilding will reduce the amount of orange juice available for export. The Florida Department of Citrus described the loan program as “providing processors an incentive to build stocks, slow export sales, and support grower prices.” 25
Production alternatives
Some Brazilian extractor/processors reported that they can produce other products using the same equipment and machinery used in production of certain orange juice. Two of five responding Brazilian extractor/processors (***) reported producing other products (such as other citrus juices and oils) on the same equipment and machinery used to produce certain orange juice.
Raw material availability
Brazil is the world’s largest producer of oranges. Like the Florida crop, the Brazilian crop of oranges has varied in size since 2005/2006, and had declined irregularly between 2005/06 and 2009/10. It reached a low of 378 million boxes in 2009/10, but the increased to a period high of 506 million boxes in 2010/11. For further detail, see figure II-3. Domestic interested parties noted that the USDA GAIN report indicated that the number of bearing trees in Brazil increased by five million between 2005/06 and
22 This level of inventories equates to less than seven weeks of inventory. 23 “Brazil Citrus Annual,” USDA GAIN Report, December 7, 2011 and “Florida Citrus Outlook 2011-12
Season,” Florida Department of Citrus, October 19, 2011. 24 Hearing transcript, p. 46 (Warlick) and domestic interested party Florida Citrus Mutual’s prehearing brief, p.
14. 25 “Florida Citrus Outlook 2011-12 Season,” Florida Department of Citrus, October 19, 2011.

II-11
2010/11 and are predicted to increase by another four million in 2011/2012.26 The 2011 USDA GAIN report on Brazilian citrus lists spot prices in Brazil for a box of fruit to have increased from a period-low of 3.56 reais per box of oranges delivered to São Paolo processors to 15 reais per box in June 2011.27
Figure II-3 Certain orange juice: Brazilian orange crop, yearly, Brazilian marketing years 2005/06-2011/12, and forecasted 2012/13
Source: USDA, FAS, PSD Online database, retrieved December 1, 2011.
Nonsubject Imports
The largest U.S. source of nonsubject imports of FCOJM is Mexico, which accounted for 27.2 percent of imports of FCOJM since October 1, 2005 on a quantity basis.28 The next largest nonsubject import source was Costa Rica, which accounted for 11.6 percent of imports. Imports of FCOJM from Honduras have been growing, but only accounted for around 1 percent of imports in 2010/11.
The largest U. S. source of nonsubject imports of NFCOJ is also Mexico, but Mexico only accounted for 5.1 percent of imports of NFCOJ since October 1, 2005 on a quantity basis.29 Imports from Mexico are heavily concentrated in the first half of the calendar year, whereas NFCOJ imports from Brazil, which account for virtually all other imports, mainly are imported in the second half of the
26 Hearing transcript, p. 42 (Warlick). These data refer to the Brazilian marketing year (July to June), which correspond to the U.S. marketing year of 2009/10 (October to September). The GAIN report states that the number of trees planted in Brazil increased from 219 million to 223 million between U.S. marketing year 2009/10 and 2010/11, and is predicted to decline to 221 million the following year. “Brazil Annual Citrus,” USDA GAIN report, December 7, 2011.
27 “Brazil Citrus Annual,” USDA GAIN Report, December 7, 2011. 28 Based on quantities imported under HTS subheading 2009.11.0060. 29 Based on quantities imported under HTS subheading 2009.12.2500.

II-12
calendar year. Consistent with these data, four of five extractor/processors who noted nonsubject supply shifts since 2005 reported that Mexico has been increasing its exports to the United States.
Blending
Five of eight extractor/processors reported blending domestically produced orange juice with imported orange juice is necessary in order to satisfy U.S. industry standards, meet supply deficiencies, or for other reasons. Five extractor/processors, 8 of 9 responding importers, and 9 of 19 responding purchasers also indicated that blending is needed to achieve the necessary quantities demanded, and four extractor/processors stated that imports are necessary to meet customer quality standards.30 Although *** indicated that blending is not necessary, it stated that it blends in order to obtain certain color and viscosity attributes in the juice. Importer Cutrale noted that it “need{s} to import juice at various times during the season when the oranges being produced by Florida growers do not provide adequate color or meet USDA score in order to meet customer specifications.”31 Purchaser Coca-Cola stated that the orange juice that is held in inventory may not have the characteristics required by a purchaser to deliver a consistent consumer experience, so blending may be necessary.32 Extractor/ processor *** noted that it does not blend domestic with imported juice, but does blend different types of Florida oranges to meet its customer specifications. The most common reasons for blending, as noted by purchasers, were for those also mentioned by extractor/processors (to meet quantity, quality, color, and viscosity targets), as well as helping to meet Grade requirements, Brix/acid ratio, and customer preferences. The only reasons noted by purchasers for not blending product would be if the product is to be labeled “100% domestic,” is a government purchase, or if a certain requirement (e.g., ultra low pulp) that is only produced by one country is needed. Three of 8 extractor/processors, 6 of 9 responding importers, and 13 of 18 purchasers noted that there is no discount or premium for blended products. One extractor/processor, two importers, and two purchasers noted there is a premium, while four extractor/processors, one importer, and three purchaser stated there is a discount for blended product.
Demand
Based on available information, certain orange juice consumers are likely to respond to changes in the price of certain orange juice with small changes in their purchases of certain orange juice. The main contributing factors to the low-to-moderate degree of responsiveness of demand are the somewhat inelastic demand for orange juice at the retail level, the typically moderate cost share of major end-uses, and the moderate substitutability of other products for certain orange juice.
30 One extractor/processor indicated that blending is not typically necessary, but it could be needed if there were weather events such as a freeze or a hurricane.
31 Hearing transcript, p. 151 (Thompson). 32 Respondent interested party Coca-Cola’s prehearing brief, pp. 4-5.

II-13
Demand Characteristics
U.S. demand for certain orange juice depends on the level of demand for downstream products using certain orange juice. FCOJM is used in ready-to-serve orange juice, reconstituted orange juice, and baby food, as well as a dispensed product for use in food-service applications and an ingredient in multi- juice fruit blends.
No extractor/processors or foreign producers reported changes in end uses for certain orange juice since October 1, 2005.33 Only 1 of 9 responding importers and 4 of 17 purchasers noted such changes. Importer *** stated that it believes there is a market shift toward NFCOJ from “FCOJ,” and anticipates a continuation of this trend. Two purchasers (***) also noted an increase in NFCOJ sales at the expense of FCOJM sales. *** reported producing more blends containing less than 100 percent FCOJ, and *** now offers a 35-percent orange juice drink. Only 2 of 18 responding purchasers anticipate changes in end uses in the near future, with *** noting that it expects the shift from FCOJ to NFCOJ to continue.
Demand Trends
Domestic consumption of orange juice has been generally decreasing since its 1998 peak.34
Based on USDA data, apparent consumption of orange juice decreased from 1.31 billion gallons in 2005/06 to 1.15 billion gallons in 2007/08, increased to 1.20 billion gallons in 2008/09, and decreased to 1.09 billion gallons in 2010/11.35
Demand Perceptions
All seven responding extractor/processors, 7 of 9 responding importers, 3 of 4 foreign producers, and 14 of 17 responding purchasers36 indicated that demand for all certain orange juice had decreased since 2005. Two importers and purchasers indicated that demand has fluctuated, while one foreign producer and one purchaser reported that demand had not changed. The main reasons reported for decreased demand were the current high price at retail (which some firms attribute to limited supply), overall economic conditions (i.e., reduced disposable income and increased unemployment), the pricing of alternative beverages, and a decrease in container size from 64 to 59 ounces.
Five of 7 responding producers, 4 of 10 responding importers, 3 of 4 foreign producers, and 10 of 19 responding purchasers anticipate the decreasing demand trend to continue in 2011/12. One producer, five importers, and seven purchasers expect demand to fluctuate during that period. One producer,
33 ***, but noted no general changes in end uses. 34 World OJ Situation: Florida Growers’ Role in Future Opportunities, presented at the Florida Citrus Industry 7th
Annual Meeting, Robert Norberg, Florida Department of Citrus, June 2011, and submitted in *** extractor/processor questionnaire response.
35 According to questionnaire production and DOC import data, apparent consumption of FCOJM increased from 729 million gallons in 2005/06 to 803 million gallons in 2007/08 before declining irregularly to 633 million gallons in 2010/11.
36 *** submitted two purchaser questionnaires, one with respect to FCOJM purchases and the other with respect to NFCOJ purchases. Some of their answers were the same across questionnaires, while others differed. Given the differences, the questionnaires were treated as separate replies.

II-14
importer, foreign producer, and purchaser each anticipate no changes, and one purchaser expects an increase in demand. Despite noting decreasing demand trends due to an increasing number of competing beverages, extractor/processor *** anticipates increased consumption trends in the United States and the world as availability of orange juice “returns to more normal levels due to production increases in the U.S. and Brazil.” A representative for importer Louis Dreyfus stated at the hearing that he believes the decrease in quantities of orange juice demanded over the last 18 moths is “entirely attributable to price.”37
As with recent demand trends, anticipated demand trends were noted to likely be affected by prices of raw materials, other beverage choices, economic conditions, and ongoing pressure to reduce carbohydrate and calorie counts in products. Additionally, when one retail orange juice producer introduced a reduced-size carafe (59 ounce, compared with the then-standard 64 ounce package), the rest of the industry followed suit to reduce costs. This has led to fewer orange solids being used per retail package sold.38
In January, traces of a fungicide were found in orange juice imported from Brazil (see Part IV for more information regarding this finding). This may have some effect on not just the supply of orange juice to the U.S. market, but also demand for orange juice in the U.S. market. At the hearing, domestic interested parties stated that, though the “issue will likely be resolved quickly, the damage being done to U.S. orange juice demand will take years and significant public relations and marketing resources to fully overcome.”39 Mr. Freeman of Louis Dreyfus stated that he believes in the short term it will benefit domestic producers, but will be forgotten by the second quarter of 2012.40
Downstream Demand
Six of 14 responding purchasers indicated that demand for their firm’s final products incorporating certain orange juice decreased since October 1, 2005. Three responding purchasers indicated that demand for their firm’s final products increased and three reported no change, while the two remaining responding purchasers indicated that demand fluctuated. Ten of these 14 noted that this had affected their purchases of orange juice. Eight purchasers indicated that changes in demand for their product affect their demand for certain orange juice, while four purchasers indicated that changes in demand for their product did not affect their demand for certain orange juice.
Seasonal Demand
Only one importer and one purchaser noted that there is a seasonal element to demand.41
Importer *** stated that demand increases from ice cream companies in summer and candy companies before Halloween. Purchaser *** stated that there is a demand cycle for schools following bid periods based on school calendars.
37 Hearing transcript, p. 192 (Freeman). 38 Ibid., pp. 97-98 (Behr). 39 Ibid., p. 38 (Behr). 40 Ibid., p. 92 (Freeman). 41 No extractor/processors reported a seasonal element to demand.
II-15
Substitute Products
Three of the 8 extractor/processors, 3 of 10 responding importers, 3 of 4 foreign producers, and 4 of 20 responding purchasers indicated that there are substitutes for certain orange juice.42 Their responses included other beverages: water, other fruit juices (such as strawberry, mango, pomegranate, and blueberry, which were noted to be recently gaining popularity among consumers), fruit juice blends, breakfast drinks, flavored waters, soft drinks, sports drinks, and numerous other drinks. *** indicated that other juices or fruit-based drinks “tend to be less expensive than FCOJM and/or require less FCOJM, resulting in increased inventories which affect price.”43 Furthermore, it reported that apple juice has replaced FCOJM as a base fruit juice sweetener. In addition to ***, two purchasers noted that the substitutes had changed since October 1, 2005, pointing to the increased number of drink choices on the market. *** noted that FCOJM may be substituted for other like products from Greece and Israel such as “orange compound.”44 Six of 7 responding extractor/processors, 8 of 9 responding importers, and 17 of 20 responding purchasers noted that there have been no changes in substitutes since October 1, 2005.
Extractor/processors *** noted that NFCOJ has grown in popularity compared with FCOJM- based products, but the trend is slowing down. As a result of the growth in popularity, *** stated that Brazilian firms have been reportedly heavily investing in tank farms, vessels, and infrastructure in the U.S. market to be able to increase exports to the United States of NFCOJ.
Cost Share
Reported cost shares varied by range of end products; for orange juice products, the reported cost share was generally higher, and for multi-juice blends and less-than-100 percent juices, the cost share was generally lower. Extractor/processors and importers reported cost shares ranging from approximately 20 percent for shelf-stable concentrate to 100 percent for single-strength orange juice.
Three of 12 responding purchasers reported that reconstituted orange juice was the only product produced using FCOJM, with five additional purchasers indicating that it accounted for the majority of the total value of their firm’s purchases of FCOJM, and one further noting that it accounted for 10 percent of its purchases.45 These purchasers reported that cost shares for FCOJM ranging from 33 percent to 100 percent.
***.46 ***.
42 Two of these affirmatively-responding purchasers are ***. 43 *** extractor/processor questionnaire response. 44 *** purchaser questionnaire response. 45 Additionally, *** reported that 100 percent of its sales of FCOJM are to the retail market, though ***. 46 ***.

II-16
SUBSTITUTABILITY ISSUES
The degree of substitution between domestic and imported FCOJM and between domestic and imported NFCOJ depends upon such factors as relative prices, quality, and conditions of sale (e.g., price discounts/rebates, lead times between order and delivery dates, payment terms, product services, etc.). Based on available data, staff believes that while there may be some differences between domestic and imported certain orange juice, there is a relatively high degree of substitution between the certain orange juice from the United States and from Brazil and other import sources.
Purchaser Characteristics
Questionnaires were sent to 47 purchasers of certain orange juice. Questionnaire responses were received from 30 purchasers, with 24 reporting that they had purchased certain orange juice since October 1, 2005.47 Four of the purchasers (***) are related to importers of certain orange juice, and three stated that they are related to extractor/processors of certain orange juice (***). Six reported that they are reconstituter/repackers, five are food processors, three are retail or food service outlets, five are distributors, two are dairy processors, and eight described themselves in some other way.48 Purchasers noted contacting an average of three suppliers before making a purchase, and their purchasing frequency varied from daily to yearly.
Knowledge of Country Sources
Twenty purchasers noted familiarity with orange juice from the United States and 16 stated they are familiar with orange juice from Brazil. In addition, a number of purchasers are familiar with certain orange juice from nonsubject countries: 13 are familiar with orange juice from Mexico, 6 from Costa Rica, 3 from Belize, and 1 each from Honduras and South Africa.
The quantities of certain orange juice reported by purchasers is contained in table II-4. Fifteen purchasers were buying certain orange juice imported from Brazil before the order was put in place, compared to nine that were not. Of the 15 that were purchasing before the order, three did not change their purchasing patterns, four reduced their purchases because of the order, and nine reduced their purchases from Brazil for reasons other than the order. Since the order was put in place, 13 of 19 purchasers reported not changing their purchases from nonsubject sources, while two increased their nonsubject purchases. Seven changed their pattern of nonsubject purchases, but the change was due to
47 ***. Seven purchasers responded that they did not purchase certain orange juice since October 1, 2005. *** reported that it did purchase since that time, but provided no substantive answers to the Commission’s questionnaire. It buys virtually no orange juice concentrate and only uses it for inclusion in its organic line. It purchases almost exclusively from the United States. Staff telephone interview with ***. *** responded that it stopped purchasing in 2007, closed the facility that used the certain orange juice, and all its records prior to 2010 had been shipped out of state. E-mail from and staff telephone interview with ***.
48 These other purchasers described themselves as: a bulk FCOJM seller and merchant, a bulk processor of Florida citrus, an extractor/processor, a juice manufacturer/bottler, a manufacturer of beverages for food service, a purchasing coop for dairy and food processors, and a soft drink manufacturer. Some purchasers described themselves as more than one type of purchaser.

II-17
factors unrelated to the order.49 Purchasers’ general purchase patterns, by country of origin, are presented in table II-5.
Table II-4 Certain orange juice: Purchasers’ reported purchase quantities of FCOJM and NFCOJ, by country and crop year, 2005/06-2010/11 2005/06 2006/07 2007/08 2008/09 2009/10 2010/11
Quantity (Thousands of pounds solids equivalent ("SE"))
FCOJM: United States
648,2941
215,689
135,020
111,992
164,520
176,214
Brazil 238,290 241,797 201,264 110,804 133,971 75,226
Brazil (nonsubject) 27,266 40,141 23,317 44,898 41,774 46,494
Other countries2 71,624 84,125 95,309 118,069 111,398 107,577
NFCOJ: United States
154,033
153,379
147,682
127,074
143,445
150,504
Brazil 41,401 70,093 67,874 77,054 59,912 81197
Other countries 0 0 0 0 0 0 1 ***. 2 For other sources, purchase data are 286.3 percent of the imports of certain orange juice from nonsubject
countries; however, it includes data for purchases bought on the futures market of indeterminate origin, much of which will be certain orange juice produced in the United States and/or Brazil. In fact, according to one source, more than 98 percent of the FCOJ traded on the futures market reportedly comes from Florida. See http://www.tradertech.com/information/orangejuicetrading.asp, retrieved December 16, 2011.
Source: Compiled from data submitted in response to Commission questionnaires.
Table II-5 Certain orange juice: Reported purchase pattern changes since October 1, 2005, by country Decrease Increase No change Fluctuate No purchases
Purchase source: (Number of purchasers)
United States 4 3 2 12 1
Brazil 5 4 2 5 4
Brazil (nonsubject) 2 6 3 2 7
Other countries 3 5 1 6 6
Source: Compiled from data submitted in response to Commission questionnaires.
49 Two did not purchase nonsubject orange juice either before or after the order was put in place.
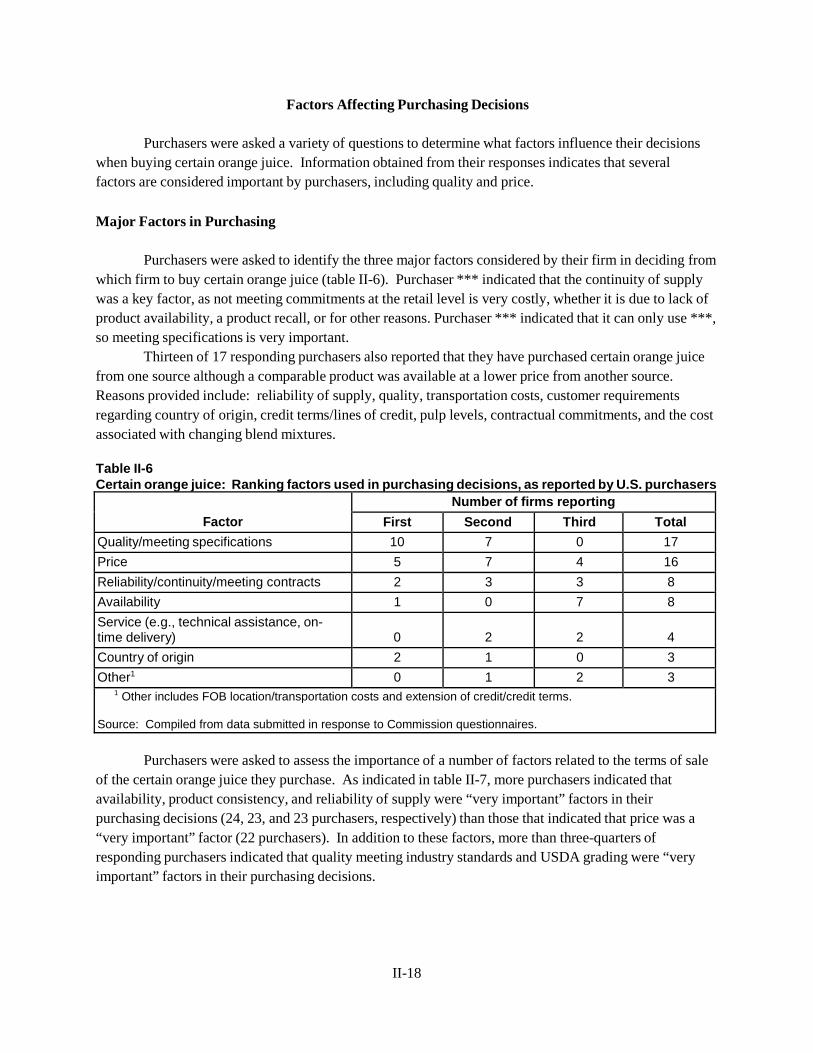
II-18
Factors Affecting Purchasing Decisions
Purchasers were asked a variety of questions to determine what factors influence their decisions when buying certain orange juice. Information obtained from their responses indicates that several factors are considered important by purchasers, including quality and price.
Major Factors in Purchasing
Purchasers were asked to identify the three major factors considered by their firm in deciding from which firm to buy certain orange juice (table II-6). Purchaser *** indicated that the continuity of supply was a key factor, as not meeting commitments at the retail level is very costly, whether it is due to lack of product availability, a product recall, or for other reasons. Purchaser *** indicated that it can only use ***, so meeting specifications is very important.
Thirteen of 17 responding purchasers also reported that they have purchased certain orange juice from one source although a comparable product was available at a lower price from another source. Reasons provided include: reliability of supply, quality, transportation costs, customer requirements regarding country of origin, credit terms/lines of credit, pulp levels, contractual commitments, and the cost associated with changing blend mixtures.
Table II-6 Certain orange juice: Ranking factors used in purchasing decisions, as reported by U.S. purchasers
Factor Number of firms reporting
First Second Third Total Quality/meeting specifications 10 7 0 17 Price 5 7 4 16 Reliability/continuity/meeting contracts 2 3 3 8 Availability 1 0 7 8 Service (e.g., technical assistance, on- time delivery)
0
2
2
4
Country of origin 2 1 0 3 Other1 0 1 2 3
1 Other includes FOB location/transportation costs and extension of credit/credit terms. Source: Compiled from data submitted in response to Commission questionnaires.
Purchasers were asked to assess the importance of a number of factors related to the terms of sale
of the certain orange juice they purchase. As indicated in table II-7, more purchasers indicated that availability, product consistency, and reliability of supply were “very important” factors in their purchasing decisions (24, 23, and 23 purchasers, respectively) than those that indicated that price was a “very important” factor (22 purchasers). In addition to these factors, more than three-quarters of responding purchasers indicated that quality meeting industry standards and USDA grading were “very important” factors in their purchasing decisions.

II-19
Table II-7 Certain orange juice: Importance of factors used in purchasing decisions as reported by U.S. purchasers
Factor
Number of firms reporting
Very important Somewhat important Not important
Availability 24 0 0
Product consistency 23 1 0
Reliability of supply 23 0 1
Price 22 2 0
Quality meets industry standards 21 1 1
USDA Grade 17 6 1
U.S. transportation costs 17 7 1
Color 17 6 1
Delivery time 15 9 0
Quality exceeds industry standards 12 7 4
Delivery terms 10 12 1
Viscosity 9 13 1
Technical support/service 9 12 4
Product range 9 7 6
Extension of credit 7 6 11
Packaging 6 8 10
Discounts offered 5 7 12
Minimum quantity requirements 2 9 13
Specifications1 3 0 0
Continuity of supply1 1 0 0
Meet internal quality standards1 1 0 0
Other services1 1 0 0
Overall innovation1 1 0 0 1 Factor added by purchaser(s) in questionnaire response(s).
Source: Compiled from data submitted in response to Commission questionnaires.
As indicated in table II-6, while price was named by 5 of 21 responding purchasers as the number
one factor generally considered in deciding from whom to purchase certain orange juice, by 7 purchasers as the number two factor, and as the number three factor by 4 other responding purchasers. Also, as indicated in table II-7, 22 of 24 responding purchasers indicated that price was a “very important” factor in their purchase decisions, while two purchasers indicated that price was “somewhat important.” However, as indicated earlier, only one of 24 responding purchasers *** indicated that their firm would “always” purchase certain orange juice that is offered at the lowest price, while 19 responding purchasers

II-20
each indicated that they would “usually” or “sometimes” purchase certain orange juice that is offered at the lowest price. The remaining three reported they “rarely/never” purchase the lowest-priced orange juice. Eight purchasers listed reasons why they purchased higher-priced certain orange juice even though lower-priced orange juice was available. Reasons indicated by purchasers included: country of origin, the importance of the FOB location, quality, service, and timing/availability of supply.
Quality was identified by 10 of the 24 responding purchasers as the number one factor generally considered in deciding from whom to purchase certain orange juice, while three other responding purchasers indicated that it was the number two factor. Twenty-one of 24 responding purchasers indicated that quality meeting industry standards was a “very important” factor in their purchasing decisions and 12 of 24 responding purchasers indicated that quality exceeding industry standards was a “very important” factor in their purchasing decision. Purchasers named a number of factors they consider in evaluating quality including: flavor, color, pulp, Brix, acidity, Brix to acid ratio, taste, defects, USDA grades and scores, consistency, pH, bacteria count, yeast and mold count, fruit type, oil level, viscosity, microbiological tolerances, processor certification, kosher certification, non-genetically modified organisms, compliant with regulations, pesticide tolerance, and third-party audits.
Twenty-one of 24 purchasers reported that they required all suppliers to become certified or prequalified, with two more indicating they required some suppliers to become certified or prequalified. Only purchaser *** does not require some type of certification or prequalification. Certifications can include those granted for Safe Quality Food, Hazards Analysis and Critical Control Points, meeting kosher guidelines, third-party audits, and providing samples for testing. Purchasers indicated that qualification/certification can take as little as two days or as much as six months. No purchasers reported that any suppliers had failed in their attempts to qualify their certain orange juice.
Purchasers were also asked how frequently they and their customers made purchasing decisions based on the country of origin or the producer of certain orange juice. The producer of the orange juice is generally more important than the country of origin (table II-8). While the majority of purchasers (14 of 24) reported that they “always” or “usually” make purchase decisions based on the producer; the majority (17 of 23) “sometimes” or “rarely/never” make their decision based on the country of origin.
Table II-8 Certain orange juice: Purchaser responses to questions regarding the origin of their purchases
Purchaser/customer decision Always Usually Sometimes Rarely/Never
Purchaser makes purchase decision based on country of origin
5
1
5
12
Purchaser makes purchase decision based on the manufacturer
4
10
1
9
Purchaser’s customer makes purchase decision based on country of origin
2
2
9
9
Purchaser’s customer makes purchase decision based on the manufacturer
1
6
5
12
Source: Compiled from data submitted in response to Commission questionnaires.
While only one purchaser reported “usually” buying certain orange juice based on the country of origin, five “always” do. The country of origin may be specified on a label and therefore must match, or it may be specified on a specific bid. Florida’s Natural brand even uses the fact that it only buys Florida

II-21
oranges as a part of its advertising scheme. On January 16, 2012, Tropicana announced that it would go back to using only Florida oranges to produce its flagship product Tropicana Pure Premium, a practice it abandoned in 2007.50 The country of origin and processor is less important for purchaser’s customers than the purchaser themselves. Some FCOJ is sold into the futures market, wherein the country of origin is not specified. One market participant noted that it does not know the country of origin for these purchases, as the juice is often blended.51
Purchasers were further asked how often certain orange juice from different sources meets minimum quality standards. Twelve purchasers noted that domestically produced certain orange juice “always” meets minimum quality standards, nine noted that it “usually” does, two noted that it “sometimes” does, and one (***) stated that domestic certain orange juice “never” meets minimum quality standards. Similarly, 15 purchasers indicated that subject certain orange juice imported from Brazil “always” meets minimum quality standards, 7 noted that it “usually” does, and 1 noted that it “sometimes” does. Ten of 16 responding purchasers noted that nonsubject Brazilian orange juice “always” meets minimum quality standards, but 10 of 16 indicated that orange juice imported from Mexico only “usually” meets minimum quality standards. Among other listed nonsubject countries, three of four purchases indicated that Belize “always” meets minimum quality standards, and three of five indicated Costa Rica “always” does.
FCOJM vs. NFCOJ Comparisons
As indicated in table II-9, a large majority of responding purchasers indicated that in terms of
every factor except shelf life, FCOJM was comparable to that of NFCOJ. Four of 12 responding purchasers noted that FCOJM has a superior shelf life compared to NFCOJ.
Table II-9 Certain orange juice: Comparisons between FCOJM and NFCOJ as reported by U.S. purchasers
Factor
Number of firms reporting
FCOJM superior Comparable FCOJM inferior
Color 1 11 0
Ingredients 0 11 1
Convenience 1 9 2
Packaging 1 10 1
Vitamin and mineral content 1 10 1
Brix level 1 9 2
Viscosity1 0 9 2
Shelf life 4 7 1
Note.--*** did not respond and indicated that FCOJM is not comparable to NFCOJ. Source: Compiled from data submitted in response to Commission questionnaires.
50 “Tropicana goes back to using only Florida oranges,” Chicago Tribune, January 16, 2011. 51 Staff telephone interview with ***.

II-22
Comparisons of Domestic Products and Subject Imports
As indicated in table II-10, 4 of 5 extractor/processors, 6 of 7 importers, and 17 of 20 purchasers indicated that U.S.-produced FCOJM and imports of FCOJM from Brazil are either “always” or “frequently” used interchangeably.52 With respect to NFCOJ, 4 of 6 extractor/processors, 4 of 5 responding importers, and 8 of 10 responding purchasers indicated that U.S.-produced NFCOJ and imports of NFCOJ from Brazil are either “always” or “frequently” used interchangeably. Among those firms reporting that interchangeability is only “sometimes” or “never” interchangeable, extractor/ producer *** noted that quality, availability, and price limit interchangeability between domestic and subject product. Purchasers *** stated that their required specification are not produced in the United States, and purchaser *** also noted specification limitations.53 Purchaser *** stated that quality and service can limit interchangeability, while purchaser *** stated that country of origin labeling on consumer packaging limits interchangeability. Importer Louis Dreyfus argued that Brazil only takes the best part of its production to export to the United States.54
As indicated in table II-11, a majority of responding extractor/processors, importers, and purchasers reported that differences other than price between U.S.-produced FCOJM and imports of FCOJM from Brazil are at most “sometimes” or “never” a significant factor in their firm’s sales of FCOJM. Extractor/processor *** stated that the “Location of the Brazilian tank farms along with their bulk transportation systems, give them an advantage into the high population areas of the northeast US”, while extractor/producer *** reiterated that quality and availability are determining factors. Extractor/processor ***, in explaining its “never” response, stated that “Differences other than price are seldom factors in determining which origin is used in sales of blended product.” Importer *** stated that weather-related issues or small crops in Brazil “drastically” affect the FCOJ market, and those issues in the United States similarly affect the NFCOJ market. Similarly, purchaser *** stated that it looks to guarantee its supply, particularly if the Florida crop is affected by weather or other factors. Purchaser *** noted that it changes its purchasing patterns due to timing/availability of crops and competition with Europe and Asia. Purchaser *** indicated that Brazilian FCOJM is often not available, or due to, antidumping duties, only available at uncompetitive prices. The FOB point of the product is important to ***, as transportation costs are a key element in its decision process. It also considers Brix level for NFCOJ along with the transportation costs.
52 ***, in noting that U.S. and Brazilian orange juice is “always” interchangeable, stated that “This analysis assumes that early and late varieties from each country are combined to optimize the utility of the product from each respective country/origin.”
53 Purchaser ***. 54 Hearing transcript, p. 171 (Freeman).

Table II-10 Certain orange juice: Perceived degree of interchangeability of product produced in the United States and in other countries
Country pair
Number of U.S. extractor/processors
reporting
Number of U.S.
importers reporting
Number of U.S.
purchasers
A F S N A F S N A F S N
FCOJM
U.S. vs. Brazil 1 3 1 0 4 2 1 0 7 10 3 0
U.S. vs. Mexico 1 3 1 0 1 2 2 0 4 11 1 0
U.S. vs. other 0 0 3 0 1 1 2 0 3 5 3 0
Brazil vs. Mexico 1 3 0 0 2 1 3 0 4 8 2 0
Brazil vs. other 0 1 0 0 1 1 2 0 3 3 3 0
NFCOJ
U.S. vs. Brazil 1 3 2 0 2 2 1 0 2 6 1 1
U.S. vs. Mexico 0 3 3 0 0 0 2 0 1 2 2 1
U.S. vs. other 0 0 3 0 0 1 2 0 1 0 1 1
Brazil vs. Mexico 0 2 1 0 1 0 2 0 2 1 2 1
Brazil vs. other 0 0 0 0 0 1 2 0 1 0 1 1
Note.–A=always; F=frequently; S=sometimes; N=never.
Source: Compiled from data submitted in response to Commission questionnaires.
II-23

II-24
Table II-11 Certain orange juice: Perceived significance of differences other than price between product produced in the United States and in other countries
Country pair
Number of U.S. extractor/processors
reporting
Number of U.S.
importers reporting
Number of U.S.
purchasers
A F S N A F S N A F S N
FCOJM
U.S. vs. Brazil 0 1 1 3 2 0 2 2 2 4 8 4
U.S. vs. Mexico 0 1 2 2 0 0 5 0 1 4 6 4
U.S. vs. other 0 0 1 1 0 0 3 0 0 0 7 2
Brazil vs. Mexico 0 1 1 1 0 0 5 0 0 3 7 3
Brazil vs. other 0 0 0 0 0 0 4 0 0 0 6 2
NFCOJ
U.S. vs. Brazil 0 1 2 3 1 1 1 1 1 3 4 2
U.S. vs. Mexico 1 1 2 2 2 0 1 0 1 2 1 2
U.S. vs. other 0 0 2 1 1 0 1 0 0 0 1 1
Brazil vs. Mexico 1 1 1 1 1 0 1 1 1 1 2 2
Brazil vs. other 0 0 1 0 0 0 2 0 0 0 1 1
Note.–A=always; F=frequently; S=sometimes; N=never.
Source: Compiled from data submitted in response to Commission questionnaires.
As seen in table II-12, a majority of responding purchasers reported that U.S.-produced certain orange juice and Brazilian imports of certain orange juice are comparable across all specified factors. The factors with the largest amounts of non-comparability were availability, delivery time, and U.S. transportation costs (7 or 8 purchasers reported non-comparability for each of these factors). Two purchasers found U.S. availability to be superior to that from Brazil, compared with 5 that note U.S. availability is inferior. Six purchasers reported the U.S. industry as superior with respect to delivery times and five reported the U.S. industry as superior with respect to U.S. transportation costs.

II-25
Table II-12 Certain orange juice: Comparisons between U.S.-produced and subject Brazilian certain orange juice as reported by U.S. purchasers
Factor
U.S. vs Brazil U.S. vs Mexico Brazil vs Mexico
S C I S C I S C I
Number of firms responding
Availability 2 13 5 10 5 1 11 4 0
Delivery terms 2 18 0 4 12 0 5 10 0
Delivery time 6 12 2 8 7 1 8 6 1
Discounts offered 0 19 1 0 13 3 0 11 4
Extension of credit 0 17 3 3 13 0 2 13 0
Price 0 17 3 0 10 6 1 9 5
Minimum quantity requirements 1 16 1 1 13 0 1 11 1
Packaging 0 17 1 0 14 0 0 13 0
Product consistency 2 16 2 6 9 1 7 7 1
Product range 2 16 1 3 12 1 2 12 1
Quality meets industry standards 3 15 2 4 11 1 4 10 1
Quality exceeds industry standards 1 16 3 2 13 1 1 14 0
Reliability of supply 2 14 4 8 6 2 9 6 0
Technical support/service 4 15 1 6 8 2 5 9 1
U.S. transportation costs 5 13 2 4 9 3 4 9 2
Note.--S=first listed country’s product is superior; C=both countries’ products are comparable; I=first listed country’s product is inferior. Note.--Not all companies gave responses for all factors. Note.--Some purchasers also compared the orange juice from the United States and Brazil to that from Costa Rica and/or Belize. For the most part, a majority of responses showed comparability. The exception to this is price, which was noted by a majority of purchasers as superior for Costa Rica/Belize compared with both the United States and Brazil.
Source: Compiled from data submitted in response to Commission questionnaires.
Comparisons of Domestic Products and Nonsubject Imports
Purchasers were asked to compare domestic product to that from Mexico and other countries as
well. As indicated in table II-10, 4 of 5 extractor/processors, 3 of 5 responding importers, and 15 of 16 responding purchasers indicated that U.S.-produced FCOJM and imports of FCOJM from Mexico and other countries are either “always” of “frequently” used interchangeably.55 In contrast, all three responding extractor/processors, 2 of 4 responding importers, and 3 of 11 responding purchasers indicated that U.S.-produced FCOJM and imports of FCOJM from other nonsubject countries are only “sometimes”
55 ***, in noting that U.S. and Mexican FCOJM is “sometimes” interchangeable, stated that “Storage, transportation and delivery systems are not in place in Mexico to make it a viable, reliable supplier of large volumes of NFCOJ to the U.S. market. However, imports of FCOJM from Mexico have steadily risen since 2005 due to two competitive advantages: 1) the phase-out of duties under NAFTA and 2) the antidumping duty order on certain orange juice from Brazil.”

II-26
used interchangeably. With respect to NFCOJ, the Commission received fewer responses from purchasers, but responses indicate that there were relatively fewer purchasers noting that NFCOJ from the United States and Mexico and other countries is “always” or “frequently” interchangeable. All six extractor/processors, both importers, and four of six purchasers noted that domestically produced NFCOJ and that imported from Mexico are “frequently” or “sometimes” interchangeable. Similar comparison were made for NFCOJ from the United States with that from other countries, with all three extractor/processors, all three importers, but only one of three purchasers noting NFCOJ from the United States are either “frequently” or “sometimes” interchangeable.
As indicated in table II-11, 3 of 5 responding extractor/processors, all 5 responding importers, and 10 of 15 purchasers reported that differences other than price between U.S.-produced FCOJM and imports of FCOJM from Mexico that are either “frequently” or “sometimes” a significant factor in their firm’s sales of FCOJM. With respect to comparing FCOJM from the United States to that imported from other countries, all responding firms indicated that differences other than price are either “sometimes” or “never” a significant factor in their firm’s sales of FCOJM. Responses regarding the frequency of non- price factors being a significant factor in comparing sales of U.S.-produced NFCOJ with NFCOJ imported from other countries were more varied.
Comparisons of Subject Imports and Nonsubject Imports
Market participants compared both FCOJM and NFCOJ from Brazil with that imported from
Mexico and other subject countries. As indicated in tables II-10 and II-11, extractor/processors, importers, and purchasers reported data similar to that submitted by market participants comparing domestic and nonsubject imports, both in terms of interchangeability and factors other than price.
ELASTICITY ESTIMATES
This section discusses elasticity estimates for the certain orange juice market. Parties were
encouraged to comment on these estimates if desired, though no party elected to do so.
U.S. Supply Elasticity
The domestic supply elasticity for certain orange juice measures the sensitivity of the quantity supplied by U.S. producers to changes in the U.S. market price of certain orange juice. The elasticity of domestic supply depends on several factors including the level of excess capacity, the ease with which producers can alter capacity, producers’ ability to shift to production of other products, the existence of inventories, and the availability of alternate markets for U.S.-produced certain orange juice. Though the supply of U.S. oranges is inelastic, supply can respond to changes in price as long as sufficient inventories are maintained. If inventories are below certain benchmark levels, U.S. supply of FCOJM and NFCOJ will become much more inelastic.56 Generally, the U.S. industry is likely to be able to somewhat increase or decrease shipments to the U.S. market; an estimate in the range of 2 to 4 is suggested for certain orange juice, though current inventory levels would indicate a level closer to the low end of this estimate.
56 At a certain point, when inventories are a critically low levels, U.S. supply elasticity would become infinitely inelastic.
II-27
U.S. Demand Elasticity
The U.S. demand elasticity for certain orange juice measures the sensitivity of the overall quantity demanded to a change in the U.S. market price of certain orange juice. This estimate depends on factors discussed earlier such as the existence, availability, and commercial viability of substitute products, as well as the component share of certain orange juice in the production of any downstream products. Based on the available information, the aggregate demand for certain orange juice is likely to be in a range of -0.4 to -0.8.
Substitution Elasticity
The elasticity of substitution depends upon the extent of product differentiation between the domestic and imported products.57 Product differentiation, in turn, depends upon such factors as quality, conditions of sale, and flavor profiles. Based on available information, the elasticity of substitution between domestic and subject certain orange juice is likely to be in the range of 3 to 5.
57 The substitution elasticity measures the responsiveness of the relative U.S. consumption levels of the subject imports and the domestic like products to changes in their relative prices. This reflects how easily purchasers switch from the U.S. product to the subject products (or vice versa) when prices change.


III-1
PART III: CONDITION OF THE U.S. INDUSTRY
OVERVIEW
Information on capacity, production, shipments, inventories, and employment presented in this section of the report is based on questionnaire data of 19 U.S. growers and eight U.S. extractor/ processors. These firms account for approximately 9.0 percent1 of U.S. production of oranges and virtually all2 of U.S. production of certain orange juice during crop year 2010/11.
U.S. GROWERS
The U.S. orange juice industry is located primarily in Florida, where most oranges, including
Hamlin (early season) and Valencia (mid to late-season), are grown almost exclusively for the production of orange juice. Oranges grown in California, in contrast, are typically grown for fresh consumption.3 In 2007, according to the U.S. Census of Agriculture, there were 5,561 orange farms in Florida, down from 7,072 farms in 2002.4 The Commission issued grower questionnaires to approximately 410 growers in Florida, including all firms identified as large growers (over 1,000 acres) by FCM, as well as a random sample of small growers (less than 1,000 acres) identified by FCM. Nineteen firms provided responses to the Commission’s grower questionnaire.5 Table III-1 presents a list of responding orange growers.
Table III-1 Oranges: U.S. growers, position, acres harvested and quantity of harvest, by firm, crop year 2010/11
* * * * * * *
All 19 responding growers reported that they do not grow or anticipate growing other products on
the same land, with the same equipment or machinery, or using the same production and related workers in the growing of oranges for the production of certain orange juice. Two firms reported the ability to switch production between oranges for the production of orange juice and other products. *** indicated it could switch to growing grapefruit at a cost of $6,000 per acre over 10-12 years. *** stated that it could switch to the production of oranges for the fresh market.
Changes Experienced in Operations
Responding growers reported several changes in operations relating to growing oranges for the
production of certain orange juice since October 2005, primarily relating to the effects of citrus diseases. Six growers reported grove openings and/or expansions, including replanting due to canker and greening damage. Four reported grove closings, all due to citrus disease. *** stated that its orange acreage has declined by over *** acres, mostly from the impact of various citrus tree diseases. In addition, ***
1 Staff calculated coverage by comparing the total oranges harvested by responding growers (12.03 million 90- pound boxes) to USDA data on Florida processed oranges (134.40 million 90-pound boxes).
2 Staff compared reported production (1.03 billion pounds) to USDA reported production (.93 billion pounds). Reported production is higher than USDA production because questionnaire data include certain orange juice blended with imports and/or purchases.
3 Certain Orange Juice from Brazil, Inv. No. 731-TA-1089 (Final), USITC Pub. 3838, March 2006, p. III-1. 4 2007 and 2002 Census of Agriculture, USDA National Agricultural Statistics Service (“NASS”). 5 Approximately 33 of the questionnaires were returned as undeliverable, and three firms responded that they
have not grown oranges for the production of certain orange juice since October 2005.
III-2
removed trees on approximately *** acres during the Canker Eradication Program in 2005 and 2006. *** reported a significant increase in grove maintenance expense due to increased spraying for greening and citrus canker eradication. Additionally, one grower reported changes in labor agreements due to the H- 2A program and e-verify requirements.
In addition to the changes reported above, growers were also asked to specifically report on how weather events, citrus diseases, and real estate development has affected their operations and orange harvest. Many growers reported several freezes, especially in 2009 and 2010, reducing the orange crop. One grower noted that freezes have reduced the ratio of pounds solid sugar in the fruit, decreasing the prices of citrus. Several storms, including hurricane Charley (August 2004), hurricane Wilma (October 2005), and tropical storm Fay (August 2008), have damaged and weakened trees.
Most growers reported that citrus canker, greening, and tristazea have had significant impacts on their groves and, as noted above, are the primary reasons for declines in acreage. Citrus greening, also known as Huanglongbing or HLB, is characterized as the most destructive citrus disease currently affecting the Florida citrus industry. It is spread by an Asian citrus psyllid, a small insect which was first reported in Florida in 1998. HLB attacks the tree and can kill it in less than two years.6 Growers reported added costs associated with increased spraying to keep the diseases at bay. One grower reported spraying eight times per year at an average cost of $50-70 per acre, compared to spraying 1 time per year at an average cost of $20 per acre in 2005. An additional grower also stated that nursery trees have doubled in cost as the industry moved indoors to counter canker and HLB infestations.7 Growers reported little effect from real estate development, with only a few growers reporting sales of land to real estate developers prior to 2006.
Anticipated Changes in Existing Operations
The Commission asked whether U.S. growers anticipated any changes in the character of their
operations relating to the growing of oranges for production of certain orange juice in the future. Five growers anticipate changes in the future. Specifically, *** expects its 2011/12 crop to be the same as its prior year crop, which was freeze damaged, and anticipates the 2012/13 crop to be down ten percent due to citrus diseases. *** anticipates changes due to increased cost of harvest labor. *** expects declining acreage, and *** reported they will continue to battle citrus diseases with increased spraying, and removing HLB infected trees.
U.S. Bearing Acreage, Production, and Yield
Table III-2 presents USDA data on the bearing acreage and production of oranges in the United
States from crop years 2005/06 to 2010/11. Approximately 70 percent of the total domestic orange bearing acreage is located in Florida, and 96 percent of the oranges produced in Florida are used for processing. Total bearing acreage in the United States has fallen in each year since 2005/06, decreasing by a total of 8.2 percent between 2005/06 and 2010/11. Production of oranges used for processing in the United States has fluctuated from 2005/06 to 2010/11, but overall has decreased by 6.3 percent in the six- year period. Table III-3 presents the utilization of Florida round oranges from crop years 2005/06 to 2010/11. Over that six-year period, the share of Florida round oranges being processed into FCOJM fluctuated between 33.2 and 45.8 percent, while the share being processed into NFCOJ fluctuated between 50.0 and 61.1 percent.
6 Hearing transcript, p. 18 (Sparks). 7 Hearing transcript, p. 24 (Story).

III-3
Table III-2 Oranges: Bearing acreage, production, yield, and shares of production by utilization, by state, crop years 2005/06-2010/11
Item
Crop year (October-September)
2005/06 2006/07 2007/08 2008/09 2009/10 2010/11
Bearing acreage (1,000 acres)
Florida 491.0 475.9 463.9 459.1 451.0 440.0
California 181.0 179.0 180.0 186.0 183.0 180.0
Texas 8.8 8.8 8.8 8.8 8.8 8.8
Arizona 4.3 4.3 4.3 2.4 (1) (1)
Total U.S. 685.1 668.0 657.0 656.3 642.8 628.8
Total oranges produced (million boxes)
Florida 147.7 129.0 170.2 162.5 133.7 140.3
California 61.0 46.0 64.5 46.5 57.5 61.5
Texas 1.6 2.0 1.7 1.5 1.6 1.9
Arizona 0.5 0.3 0.4 0.3 (1) (1)
Total U.S. 210.8 177.3 236.8 210.7 192.8 203.7
Fresh oranges (million boxes)
Florida 7.3 6.4 5.9 6.9 5.9 5.9
California 44.0 27.2 49.4 39.1 47.9 48.3
Texas 1.3 1.5 1.4 1.2 1.4 1.7
Arizona 0.2 0.2 0.3 0.2 (1) (1)
Total fresh 52.8 35.3 56.9 47.4 55.2 55.9
Processed oranges (million boxes)
Florida 140.4 122.6 164.3 155.6 127.8 134.4
California 17.0 18.8 15.1 7.4 9.6 13.2
Texas 0.3 0.5 0.4 0.2 0.2 0.3
Arizona 0.2 0.1 0.1 0.1 (1) (1)
Total processed 157.9 142.0 179.9 163.3 137.6 147.9
Yield (boxes per acre)
Florida 301 271 367 354 296 319
California 337 257 358 250 314 342
Texas 182 225 197 166 186 221
Arizona 105 70 88 104 (1) (1)
U.S. Average 308 265 360 321 300 324
Table continued on next page.

III-4
Table III-2--Continued Oranges: Bearing acreage, production, yield, and shares of production by utilization, by state, crop years 2005/06-2010/11
Item
Crop year (October-September)
2005/06 2006/07 2007/08 2008/09 2009/10 2010/11
Share of total oranges produced (percent)
Florida:
Fresh 4.9 5.0 3.5 4.2 4.4 4.2
Processed 95.1 95.0 96.5 95.8 95.6 95.8
Total 100.0 100.0 100.0 100.0 100.0 100.0
California:
Fresh 72.1 59.1 76.6 84.1 83.3 78.5
Processed 27.9 40.9 23.4 15.9 16.7 21.5
Total 100.0 100.0 100.0 100.0 100.0 100.0
Texas:
Fresh 79.4 74.3 78.3 85.2 88.5 84.8
Processed 20.6 25.7 21.7 14.8 11.5 15.2
Total 100.0 100.0 100.0 100.0 100.0 100.0
Arizona:
Fresh 52.0 66.7 75.0 66.7 (1) (1)
Processed 48.0 33.3 25.0 33.3 (1) (1)
Total 100.0 100.0 100.0 100.0 (1) (1)
U.S. Total:
Fresh 25.0 19.9 24.0 22.5 28.6 27.4
Processed 74.9 80.1 76.0 77.5 71.4 72.6
Total 100.0 100.0 100.0 100.0 100.0 100.0 1 Not available. Estimates discontinued beginning with the 2009/10 crop year.
Note.–Because of rounding, figures may not add to the totals shown.
Source: Citrus Fruits, 2008 and 2011 summaries, USDA, National Agricultural Statistics Service.
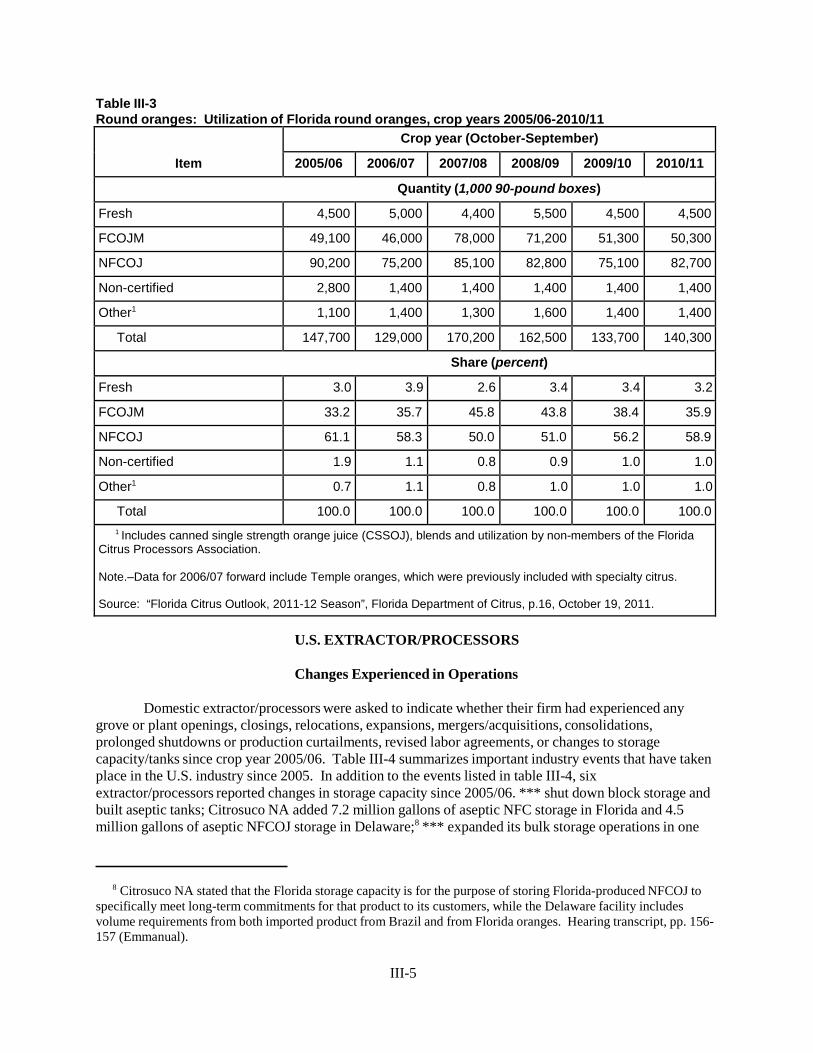
III-5
Table III-3 Round oranges: Utilization of Florida round oranges, crop years 2005/06-2010/11
Item
Crop year (October-September)
2005/06 2006/07 2007/08 2008/09 2009/10 2010/11
Quantity (1,000 90-pound boxes)
Fresh 4,500 5,000 4,400 5,500 4,500 4,500
FCOJM 49,100 46,000 78,000 71,200 51,300 50,300
NFCOJ 90,200 75,200 85,100 82,800 75,100 82,700
Non-certified 2,800 1,400 1,400 1,400 1,400 1,400
Other1 1,100 1,400 1,300 1,600 1,400 1,400
Total 147,700 129,000 170,200 162,500 133,700 140,300
Share (percent)
Fresh 3.0 3.9 2.6 3.4 3.4 3.2
FCOJM 33.2 35.7 45.8 43.8 38.4 35.9
NFCOJ 61.1 58.3 50.0 51.0 56.2 58.9
Non-certified 1.9 1.1 0.8 0.9 1.0 1.0
Other1 0.7 1.1 0.8 1.0 1.0 1.0
Total 100.0 100.0 100.0 100.0 100.0 100.0 1 Includes canned single strength orange juice (CSSOJ), blends and utilization by non-members of the Florida
Citrus Processors Association.
Note.–Data for 2006/07 forward include Temple oranges, which were previously included with specialty citrus.
Source: “Florida Citrus Outlook, 2011-12 Season”, Florida Department of Citrus, p.16, October 19, 2011.
U.S. EXTRACTOR/PROCESSORS
Changes Experienced in Operations
Domestic extractor/processors were asked to indicate whether their firm had experienced any grove or plant openings, closings, relocations, expansions, mergers/acquisitions, consolidations, prolonged shutdowns or production curtailments, revised labor agreements, or changes to storage capacity/tanks since crop year 2005/06. Table III-4 summarizes important industry events that have taken place in the U.S. industry since 2005. In addition to the events listed in table III-4, six extractor/processors reported changes in storage capacity since 2005/06. *** shut down block storage and built aseptic tanks; Citrosuco NA added 7.2 million gallons of aseptic NFC storage in Florida and 4.5 million gallons of aseptic NFCOJ storage in Delaware;8 *** expanded its bulk storage operations in one
8 Citrosuco NA stated that the Florida storage capacity is for the purpose of storing Florida-produced NFCOJ to specifically meet long-term commitments for that product to its customers, while the Delaware facility includes volume requirements from both imported product from Brazil and from Florida oranges. Hearing transcript, pp. 156- 157 (Emmanual).

III-6
Florida facility to accommodate FCOJ produced at an alternate Florida facility; *** constructed an NFCOJ tank farm consisting of *** tanks of *** million gallons each in 2009; *** entered into a joint venture with another Florida processor during 2010 to utilize its excess storage capacity from NFCOJ; and *** added *** million gallons of NFCOJ capacity, converted *** million gallons of bulk concentrate storage to NFCOJ, and is building *** million gallons of additional NFCOJ storage.
Table III-4 Certain orange juice: Survey of industry events since crop year 2005/06
Company Description of event
(acquisition, bankruptcy, merger, shutdown)
Cargill Juice North America
Announced plans in May 2007 to permanently cease operations at its orange and grapefruit juice processing facilities in Frostproof and Avon Park, Florida.1
***
***.
*** ***.
***
***.
*** ***.
*** ***. 1 “Cargill to close juice plants in central Florida,” May 10, 2007, found at
http://www.cargill.com/news/releases/2007/NA3007799.jsp, retrieved on December 1, 2011. Source: Compiled from questionnaire responses and company press releases.
Anticipated Changes in Existing Operations
The Commission asked whether domestic extractor/processors anticipate any changes in the character of their operations relating to the production of certain orange juice in the future. Only one extractor/processor, ***, anticipates changes in the future. The firm stated, “Importers of certain orange juice from Brazil are currently expanding tank farm and associated infrastructure at both Florida and Northeast U.S. ports for increasing imports and inventories of NFCOJ. Once this infrastructure is in place, it will be used to pay back the capital spent. This will lead to even more Brazilian solids entering the U.S. marketplace and additional downward pressure on the price of NFCOJ. This in turn will lead to less volumes for the domestic industry, and eventually to downward pressure on fruit prices for Florida growers. *** has already reduced our run plan by approximately *** pound solids for the 2011/12 season and beyond.”

III-7
U.S. CAPACITY, PRODUCTION, AND CAPACITY UTILIZATION
U.S. extractor/processors’ capacity, production, and capacity utilization data for certain orange juice are presented in table III-5. Total reported certain orange juice capacity increased slightly by 2.7 percent from crop year 2005/06 to 2010/11, while total production declined by 11.3 percent during the same period.9
Table III-5 Certain orange juice: Reported U.S. capacity, production, and capacity utilization, crop years 2005/06-2010/11
Item
Crop year (October 1 - September 30)
2005/06 2006/07 2007/08 2008/09 2009/10 2010/11
Quantity (1,000 pounds SE1)
FCOJM:
Capacity 639,361 638,434 681,853 672,275 662,246 671,354
Production 520,340 398,717 657,277 575,125 475,896 449,913
Capacity utilization (percent) 81.4 62.5 96.4 85.5 71.9 67.0
NFCOJ:
Capacity 860,117 863,641 869,066 870,760 868,412 869,243
Production 639,685 565,625 616,877 603,710 534,212 579,110
Capacity utilization (percent) 74.4 65.5 71.0 69.3 61.5 66.6
Total:
Capacity 1,499,478 1,502,075 1,550,919 1,543,035 1,530,658 1,540,597
Production 1,160,025 964,342 1,274,154 1,178,835 1,010,108 1,029,023
Capacity utilization (percent) 77.4 64.2 82.2 76.4 66.0 66.8 1 Solids equivalent.
Note.–*** reported capacity (production capability) based on operating 168 hours per week and 28 weeks per year; *** on 66 hours per week and 50 weeks per year, *** on 156 hours per week and 26 weeks per year, *** on 168 hours per week and 30 weeks per year, *** on 156 hours per week and 39 weeks per year, *** on 80 hours per week and 30 weeks per year, and *** reported capacity based on its air emissions permit. Capacity for *** in crop years 2005/06 through 2009/10 and for *** in all years was less than production because they blend purchased juice with domestic solids.
Note.–*** reported data on a September 1 - August 31 year basis.
Source: Compiled from data submitted in response to Commission questionnaires.
9 Reported production numbers include juice produced using domestic solids and blended with domestic and/or imported juice. Respondents argue that the best measure of productive capacity for orange juice is the number of fruit-bearing orange trees available to produce oranges. Virtually all juice oranges produced by the trees will be processed into juice, production of juice will vary with crop yield, and yield will vary according to the weather conditions. See table III-2 for the bearing acreage of oranges. Respondents’ prehearing brief, p. 6.

III-8
Blending
All extractor/processors of certain orange juice reported blending imports and/or domestic purchases of orange solids with juice extracted in their establishments. Reasons for blending were to improve overall blend quality and meet customer preferences for taste, consistency, color and viscosity attributes, as well as to standardize and achieve the quality standards required by Florida State statute, customer specifications, and for delivery to the futures’ market. Some extractor/processors also noted that blending with imported product allows the product to be sold at a discount. One extractor/processor reported an increase in blending since 2005, two reported no increases, one reported a decrease, and one stated that blending varies from year to year based on the quality of the Florida fruit.
Cutrale USA stated that it needs to import juice at various times during the season when the oranges being produced by Florida growers do not provide adequate color or meet USDA score in order to meet customer specifications.10 Tropicana recently announced that it plans to use only Florida oranges in its Pure Premium NFCOJ product. It also imports FCOJ and NFCOJ from Brazil to supplement its retail brand quantity and quality (taste, color, and viscosity) requirements.11 Citrus World stated that imports are not necessary for blending purposes, and the U.S. crop produces sufficient Valencia and non- Valencia oranges to satisfy blending requirements.12 Table III-6 presents U.S. extractor/processors’ reported U.S. production by input.
10 Hearing transcript, p. 150 (Thompson). 11 Tropicana’s letter to the Commission, January 20, 2012, p. 1. 12 FCM’s posthearing brief, Commissioner Questions, p. 41 and exh. 4.

III-9
Table III-6 Certain orange juice: Reported U.S. production by input, crop years 2005/06-2010/11
Item
Crop year (October 1 - September 30)
2005/06 2006/07 2007/08 2008/09 2009/10 2010/11
Quantity (1,000 pounds SE)
FCOJM production from:
U.S. fresh oranges 254,795 265,406 510,594 478,410 350,479 349,100
Purchases of U.S. orange solids
177,717
20,195
16,866
28,886
70,010
48,277
Orange solids from subject Brazil producers
46,876
50,051
66,083
10,453
18,560
15,047
Orange solids from nonsubject Brazil producers
25,308
36,692
40,835
30,120
11,383
0
Other orange solid imports 15,644 26,371 22,899 27,256 25,463 37,489
Total production 520,340 398,715 657,277 575,125 475,895 449,913
NFCOJ production from:
U.S. fresh oranges 493,830 414,235 463,573 483,731 425,388 474,139
Purchases of U.S. orange solids
132,346
121,685
119,443
82,521
84,931
72,695
Orange solids from subject Brazil producers
***
***
***
***
***
***
Orange solids from nonsubject Brazil producers
***
***
***
***
***
***
Other orange solid imports *** *** *** *** *** ***
Total production 639,685 565,624 616,877 603,709 534,212 579,109
Certain orange juice production from:
U.S. fresh oranges 748,625 679,641 974,167 962,141 775,867 823,239
Purchases of U.S. orange solids
310,063
141,880
136,309
111,407
154,941
120,972
Orange solids from subject Brazil producers
***
***
***
***
***
***
Orange solids from nonsubject Brazil producers
***
***
***
***
***
***
Other orange solid imports *** *** *** *** *** ***
Total production 1,160,025 964,339 1,274,154 1,178,834 1,010,107 1,029,022
Table continued on next page.

III-10
Table III-6--Continued Certain orange juice: Reported U.S. production by input, crop years 2005/06-2010/11
Item
Crop year (October 1 - September 30)
2005/06 2006/07 2007/08 2008/09 2009/10 2010/11
Share of production (percent)
FCOJM production from:
U.S. fresh oranges 49.0 66.6 77.7 83.2 73.6 77.6
Purchases of U.S. orange solids
34.2
5.1
2.6
5.0
14.7
10.7
Orange solids from subject Brazil producers
9.0
12.6
10.1
1.8
3.9
3.3
Orange solids from nonsubject Brazil producers
4.9
9.2
6.2
5.2
2.4
0.0
Other orange solid imports 3.0 6.6 3.5 4.7 5.4 8.3
Total production 100.0 100.1 100.0 100.0 100.0 100.0
NFCOJ production from:
U.S. fresh oranges 77.2 73.2 75.1 80.1 79.6 81.9
Purchases of U.S. orange solids
21
22
19
14
16
13
Orange solids from subject Brazil producers
***
***
***
***
***
***
Orange solids from nonsubject Brazil producers
***
***
***
***
***
***
Other orange solid imports *** *** *** *** *** ***
Total production 100.0 100.0 100.0 100.0 100.0 100.0
Certain orange juice production from:
U.S. fresh oranges 64.5 70.5 76.5 81.6 76.8 80.0
Purchases of U.S. orange solids
26.7
14.7
10.7
9.5
15.3
11.8
Orange solids from subject Brazil producers
***
***
***
***
***
***
Orange solids from nonsubject Brazil producers
***
***
***
***
***
***
Other orange solid imports *** *** *** *** *** ***
Total production 100.0 100.0 100.0 100.0 100.0 100.0
Note.–Because of rounding, figures may not add to the totals shown. Source: Compiled from data submitted in response to Commission questionnaires.

III-11
Constraints on Capacity
The Commission asked domestic producers to report the constraints on their capacity to produce certain orange juice. Five extractor/processors reported equipment constraints, including both extraction and storage. The second largest constraint, reported by four extractor/processors, was fruit availability and the length of the growing season. Other constraints mentioned were the availability of labor and Title V (air quality) permits.
One firm, ***, reported that they are able to switch production between certain orange juice and grapefruit juice, but only to a very limited extent due to constraints such as the availability of grapefruit for processing and the limited overall market for grapefruit juice.
Five firms reported producing or anticipate producing other products on the same equipment and machinery as in the production of certain orange juice and using the same production and related workers. In crop year 2010/11, companies that produced other products on the same equipment as certain orange juice reported producing 50.1 million pounds solids equivalent of other citrus products, primarily grapefruit juice.
U.S. PRODUCERS’ SHIPMENTS
Data on U.S. extractor/processors’ shipments of certain orange juice are presented in table III-7.
The quantity of U.S. extractor/processors’ U.S. shipments of certain orange juice declined from 2005/06 to 2010/11, by 10.0 percent over the entire period. However, the value of U.S. extractor/processors’ U.S. shipments increased by 5.4 percent over the entire period. Export shipments increased by 22.0 percent over the entire period. *** reported the largest exports, and together accounted for *** percent of total reported exports by U.S. extractor/processors in 2010/11. Louis Dreyfus stated that it has developed an export business in the Middle East and has established a market in South Korea.13 Other reported export markets were Europe, Japan, Australia, Canada, and Saudi Arabia.
13 Hearing transcript, p. 183 (Freeman).

III-12
Table III-7 Certain orange juice: U.S. producers’ shipments, by types, crop years 2005/06-2010/11
Item
Crop year (October 1 - September 30)
2005/06 2006/07 2007/08 2008/09 2009/10 2010/11
Quantity (1,000 pounds SE)
FCOJM:
Commercial shipments *** *** *** *** *** ***
Internal consumption *** *** *** *** *** ***
Transfers *** *** *** *** *** ***
U.S. shipments 477,081 432,603 472,866 516,451 522,979 454,037
Export shipments 43,969 40,011 32,298 41,706 44,042 52,555
Total shipments 521,050 472,614 505,164 558,157 567,021 506,592
NFCOJ:
Commercial shipments *** *** *** *** *** ***
Internal consumption *** *** *** *** *** ***
Transfers *** *** *** *** *** ***
U.S. shipments 641,886 580,250 569,668 563,769 558,423 553,310
Export shipments 10,270 8,627 7,307 22,213 25,494 13,599
Total shipments 652,156 588,877 576,975 585,982 583,917 566,909
Total:
Commercial shipments *** *** *** *** *** ***
Internal consumption *** *** *** *** *** ***
Transfers *** *** *** *** *** ***
U.S. shipments 1,118,967 1,012,853 1,042,534 1,080,220 1,081,402 1,007,347
Export shipments 54,239 48,638 39,605 63,919 69,536 66,154
Total shipments 1,173,206 1,061,491 1,082,139 1,144,139 1,150,938 1,073,501
Value (1,000 dollars)
FCOJM:
Commercial shipments *** *** *** *** *** ***
Internal consumption *** *** *** *** *** ***
Transfers *** *** *** *** *** ***
U.S. shipments 594,231 693,786 513,055 453,161 665,392 708,687
Export shipments 46,848 71,696 46,935 48,118 57,374 92,254
Total shipments 641,079 765,482 559,990 501,279 722,766 800,941
Table continued on next page.

III-13
Table III-7--Continued Certain orange juice: U.S. producers’ shipments, by types, crop years 2005/06-2010/11
Item
Crop year (October 1 - September 30)
2005/06 2006/07 2007/08 2008/09 2009/10 2010/11
Value (1,000 dollars)
NFCOJ:
Commercial shipments *** *** *** *** *** ***
Internal consumption *** *** *** *** *** ***
Transfers *** *** *** *** *** ***
U.S. shipments 1,098,753 1,304,458 1,097,587 994,242 1,000,898 1,075,534
Export shipments 15,077 16,747 14,040 34,573 39,019 24,631
Total shipments 1,113,830 1,321,205 1,111,627 1,028,815 1,039,917 1,100,165
Total:
Commercial shipments *** *** *** *** *** ***
Internal consumption *** *** *** *** *** ***
Transfers *** *** *** *** *** ***
U.S. shipments 1,692,984 1,998,244 1,610,642 1,447,403 1,666,290 1,784,221
Export shipments 61,925 88,443 60,975 82,691 96,393 116,885
Total shipments 1,754,909 2,086,687 1,671,617 1,530,094 1,762,683 1,901,106
Unit value (dollars per pound SE)
FCOJM:
Commercial shipments $*** $*** $*** $*** $*** $***
Internal consumption *** *** *** *** *** ***
Transfers *** *** *** *** *** ***
U.S. shipments 1.25 1.60 1.08 0.88 1.27 1.56
Export shipments 1.07 1.79 1.45 1.15 1.30 1.76
Average 1.23 1.62 1.11 0.90 1.27 1.58
NFCOJ:
Commercial shipments *** *** *** *** *** ***
Internal consumption *** *** *** *** *** ***
Transfers *** *** *** *** *** ***
U.S. shipments 1.71 2.25 1.93 1.76 1.79 1.94
Export shipments 1.47 1.94 1.92 1.56 1.53 1.81
Average 1.71 2.24 1.93 1.76 1.78 1.94
Table continued on next page.

III-14
Table III-7--Continued Certain orange juice: U.S. producers’ shipments, by types, crop years 2005/06-2010/11
Item
Crop year (October 1 - September 30)
2005/06 2006/07 2007/08 2008/09 2009/10 2010/11
Unit value (per pound SE)
Total:
Commercial shipments $*** $*** $*** $*** $*** $***
Internal consumption *** *** *** *** *** ***
Transfers *** *** *** *** *** ***
U.S. shipments 1.51 1.97 1.54 1.34 1.54 1.77
Export shipments 1.14 1.82 1.54 1.29 1.39 1.77
Average 1.50 1.97 1.54 1.34 1.53 1.77
Share of quantity (percent)
FCOJM:
Commercial shipments *** *** *** *** *** ***
Internal consumption *** *** *** *** *** ***
Transfers *** *** *** *** *** ***
U.S. shipments 91.6 91.5 93.6 92.5 92.2 89.6
Export shipments 8.4 8.5 6.4 7.5 7.8 10.4
Total shipments 100.0 100.0 100.0 100.0 100.0 100.0
NFCOJ:
Commercial shipments *** *** *** *** *** ***
Internal consumption *** *** *** *** *** ***
Transfers *** *** *** *** *** ***
U.S. shipments 98.4 98.5 98.7 96.2 95.6 97.6
Export shipments 1.6 1.5 1.3 3.8 4.4 2.4
Total shipments 100.0 100.0 100.0 100.0 100.0 100.0
Total:
Commercial shipments *** *** *** *** *** ***
Internal consumption *** *** *** *** *** ***
Transfers *** *** *** *** *** ***
U.S. shipments 95.4 95.4 96.3 94.4 94.0 93.8
Export shipments 4.6 4.6 3.7 5.6 6.0 6.2
Total shipments 100.0 100.0 100.0 100.0 100.0 100.0
Note.–Because of rounding, figures may not add to the totals shown. *** reported data on a September 1 - August 31 year basis. Source: Compiled from data submitted in response to Commission questionnaires.

III-15
U.S. PRODUCERS’ INVENTORIES
NFCOJ can be stored in inventory for up to one year, and FCOJM can be stored for two to three years; however, the quality is degraded the longer the product remains in storage.14 Hamlin (early- season) oranges are typically harvested October through December, and Valencia oranges (late-season) are typically harvested March through June. Because of these crop seasons, processors must hold inventories at the end of each processing period in order to carry them over to the next crop. Most U.S. processors begin processing operations in December or January when there is a sufficient volume of early-mid season oranges available to run the processing plants. When the U.S. marketing season begins on October 1, Citrus World states it needs a minimum of 12 weeks NFC inventory, and would prefer levels at 16 to 20 weeks inventory. Inventory levels over 20 weeks would be burdensome and considered a cost liability. Most U.S. processors blend early-mid season oranges with Valencias, which are harvested and processed in March. Processors that blend with Valencia oranges would need a six-month supply of Valencia juice from the beginning of the U.S. marketing season on October 1 to late-March, when Valencias are harvested and processed.15 Coca Cola stated that it needs 39 weeks of inventory at the end of the Florida processing season in June to produce a consistent retail product until the start of the next processing season in December.16
Table III-8 presents end-of-period inventories for certain orange juice. It shows that total inventories fluctuated in each year, and declined by 17.6 percent from 2005/06 to 2010/11. The ratio of inventories to total shipments of FCOJM declined by 9.5 percentage points, while the ratio of inventories to total shipments of NFCOJ increased by 3.1 percentage points over the period. Table III-9 presents USDA data on U.S. inventories of certain orange juice.
14 Hearing transcript, pp. 79-80 (Behr). 15 FCM’s posthearing brief, Commissioner Questions, pp. 2-9, and exh. 4. 16 Coca Cola’s posthearing brief, p. 5.

III-16
Table III-8 Certain orange juice: U.S. producers’ end-of-period inventories, crop years 2005/06-2010/11
Item Crop year (October 1 - September 30)
2005/06 2006/07 2007/08 2008/09 2009/10 2010/11
FCOJM:
Inventories (1,000 pounds SE) 157,436 83,540 235,652 252,620 161,494 104,815
Ratio to production (percent) 30.3 21.0 35.9 43.9 33.9 23.3
Ratio to U.S. shipments (percent) 33.0 19.3 49.8 48.9 30.9 23.1
Ratio to total shipments (percent) 30.2 17.7 46.6 45.3 28.5 20.7
NFCOJ:
Inventories (1,000 pounds SE) 158,562 135,311 175,211 192,940 143,234 155,435
Ratio to production (percent) 24.8 23.9 28.4 32.0 26.8 26.8
Ratio to U.S. shipments (percent) 24.7 23.3 30.8 34.2 25.6 28.1
Ratio to total shipments (percent) 24.3 23.0 30.4 32.9 24.5 27.4
Total:
Inventories (1,000 pounds SE) 315,998 218,851 410,863 445,560 304,728 260,250
Ratio to production (percent) 27.2 22.7 32.2 37.8 30.2 25.3
Ratio to U.S. shipments (percent) 28.2 21.6 39.4 41.2 28.2 25.8
Ratio to total shipments (percent) 26.9 20.6 38.0 38.9 26.5 24.2
Source: Compiled from data submitted in response to Commission questionnaires.

III-17
Table III-9 Certain orange juice: U.S. producers’ carryover stocks and ratio to production, crop years 2005/06-2010/11
Item Crop year (October 1 - September 30)
2005/06 2006/07 2007/08 2008/09 2009/10 2010/11
Quantity (1,000 gallons SSE)
U.S. production 988,000 891,000 1,167,022 1,070,108 850,534 906,793
Beginning stocks 623,280 459,000 379,588 653,170 700,617 564,330
Ending stocks 459,000 379,588 653,170 700,617 564,330 407,705
Ratio of ending stocks to U.S. production (percent)
46.5
42.6
56.0
65.5
66.4
45.0
Note.–Metric tons converted to gallons SSE by a conversion factor of 1,405.88. Stocks contain U.S. production blended with imports of certain orange juice. Source: Foreign Agricultural Service, USDA, PS&D Online, retrieved November 28, 2011.
U.S. PRODUCERS’ IMPORTS AND PURCHASES
U.S. producers’ imports and purchases of certain orange juice are presented in table III-10. Three
U.S. extractor/processors, ***,17 reported that they imported subject orange juice, and four extractor/processors, ***, reported that they purchased imports of subject orange juice.
Table III-10 Certain orange juice: U.S. producers’ imports and purchases, crop years 2005/2006-2010/11
* * * * * * *
U.S. EMPLOYMENT, WAGES, AND PRODUCTIVITY
Data provided by U.S. extractor/processors on the number of production and related workers (“PRWs”), involved in the production of certain orange juice, the total hours worked by such workers, and wages paid to such PRWs during the period for which data were collected in this review are presented in table III-11. Employment fluctuated modestly between 2005/06 and 2010/11; PRWs decreased in that period by 4.6 percent, and total hours worked decreased by less than 1 percent.
17 In addition, ***.

III-18
Table III-11 Certain orange juice: U.S. extractor/processors’ employment-related data, crop years 2005/06- 2010/11
Item
Crop year
2005/06 2006/07 2007/08 2008/09 2009/10 2010/11
FCOJM:
PRWs (number) 710 686 777 811 709 709
Hours worked (1,000 hours) 1,709 1,450 1,877 2,077 1,820 1,844
Wages paid (1,000 dollars) 29,746 26,314 34,719 38,370 36,027 37,479
Hourly wages $17.41 $18.15 $18.50 $18.47 $19.80 $20.32
Productivity (pounds SE per hour) 288.5 262.3 341.3 275.0 261.2 242.4
Unit labor costs (per pound SE) $0.06 $0.07 $0.05 $0.07 $0.08 $0.08
NFCOJ:
PRWs (number) 1,987 1,787 1,884 1,854 1,683 1,865
Hours worked (1,000 hours) 5,384 5,143 5,245 5,240 5,086 5,209
Wages paid (1,000 dollars) 108,468 107,976 111,425 113,333 106,108 119,685
Hourly wages $20.15 $20.99 $21.24 $21.63 $20.86 $22.98
Productivity (pounds SE per hour) 118.8 110.0 117.6 115.2 105.0 111.2
Unit labor costs (per pound SE) $0.17 $0.19 $0.18 $0.19 $0.20 $0.21
Total:
PRWs (number) 2,697 2,473 2,661 2,665 2,392 2,574
Hours worked (1,000 hours) 7,093 6,593 7,122 7,317 6,906 7,053
Wages paid (1,000 dollars) 138,214 134,290 146,144 151,703 142,135 157,164
Hourly wages $19.49 $20.37 $20.52 $20.73 $20.58 $22.28
Productivity (pounds SE per hour) 159.7 143.5 176.6 160.6 146.2 145.5
Unit labor costs (per pound SE) $0.12 $0.14 $0.12 $0.13 $0.14 $0.15
Note.–***. Source: Compiled from data submitted in response to Commission questionnaires.
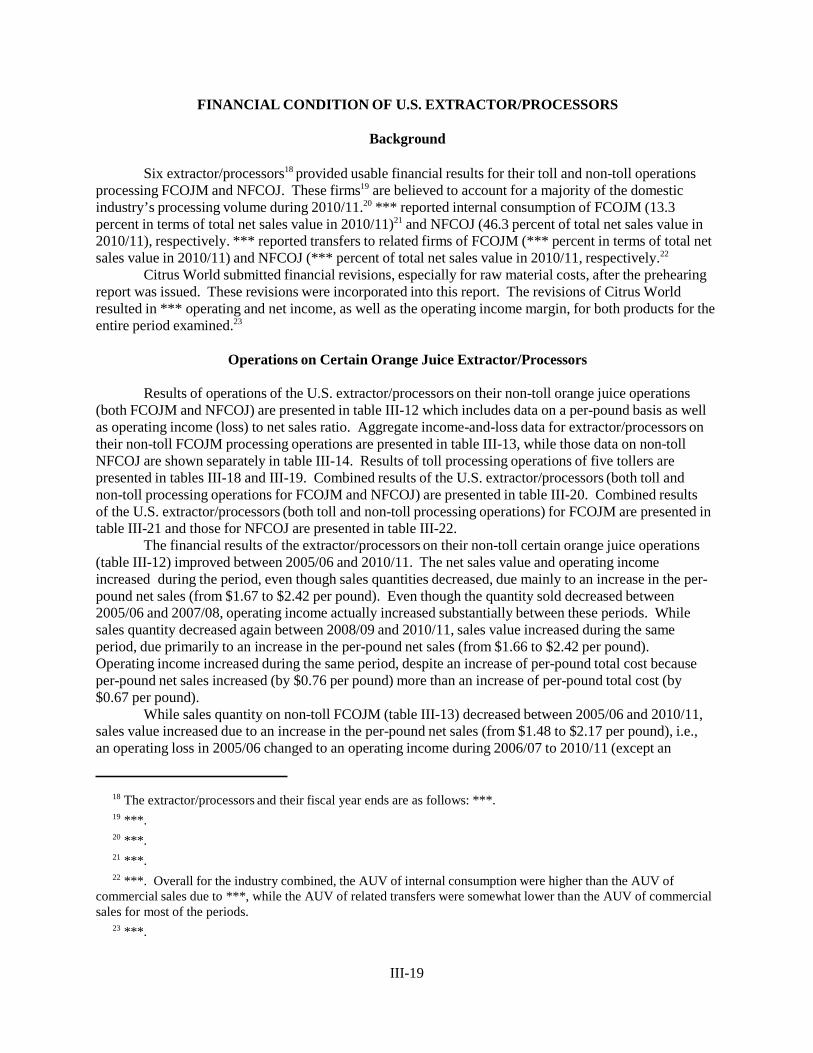
III-19
FINANCIAL CONDITION OF U.S. EXTRACTOR/PROCESSORS
Background
Six extractor/processors18 provided usable financial results for their toll and non-toll operations processing FCOJM and NFCOJ. These firms19 are believed to account for a majority of the domestic industry’s processing volume during 2010/11.20 *** reported internal consumption of FCOJM (13.3 percent in terms of total net sales value in 2010/11)21 and NFCOJ (46.3 percent of total net sales value in 2010/11), respectively. *** reported transfers to related firms of FCOJM (*** percent in terms of total net sales value in 2010/11) and NFCOJ (*** percent of total net sales value in 2010/11, respectively.22
Citrus World submitted financial revisions, especially for raw material costs, after the prehearing report was issued. These revisions were incorporated into this report. The revisions of Citrus World resulted in *** operating and net income, as well as the operating income margin, for both products for the entire period examined.23
Operations on Certain Orange Juice Extractor/Processors
Results of operations of the U.S. extractor/processors on their non-toll orange juice operations
(both FCOJM and NFCOJ) are presented in table III-12 which includes data on a per-pound basis as well as operating income (loss) to net sales ratio. Aggregate income-and-loss data for extractor/processors on their non-toll FCOJM processing operations are presented in table III-13, while those data on non-toll NFCOJ are shown separately in table III-14. Results of toll processing operations of five tollers are presented in tables III-18 and III-19. Combined results of the U.S. extractor/processors (both toll and non-toll processing operations for FCOJM and NFCOJ) are presented in table III-20. Combined results of the U.S. extractor/processors (both toll and non-toll processing operations) for FCOJM are presented in table III-21 and those for NFCOJ are presented in table III-22.
The financial results of the extractor/processors on their non-toll certain orange juice operations (table III-12) improved between 2005/06 and 2010/11. The net sales value and operating income increased during the period, even though sales quantities decreased, due mainly to an increase in the per- pound net sales (from $1.67 to $2.42 per pound). Even though the quantity sold decreased between 2005/06 and 2007/08, operating income actually increased substantially between these periods. While sales quantity decreased again between 2008/09 and 2010/11, sales value increased during the same period, due primarily to an increase in the per-pound net sales (from $1.66 to $2.42 per pound). Operating income increased during the same period, despite an increase of per-pound total cost because per-pound net sales increased (by $0.76 per pound) more than an increase of per-pound total cost (by $0.67 per pound).
While sales quantity on non-toll FCOJM (table III-13) decreased between 2005/06 and 2010/11, sales value increased due to an increase in the per-pound net sales (from $1.48 to $2.17 per pound), i.e., an operating loss in 2005/06 changed to an operating income during 2006/07 to 2010/11 (except an
18 The extractor/processors and their fiscal year ends are as follows: ***. 19 ***. 20 ***. 21 ***. 22 ***. Overall for the industry combined, the AUV of internal consumption were higher than the AUV of
commercial sales due to ***, while the AUV of related transfers were somewhat lower than the AUV of commercial sales for most of the periods.
23 ***.

III-20
operating loss in 2009/10), due to an increase in the per-pound net sales. However, the operating income decreased substantially between 2007/08 and 2009/10 because the increase in per-pound total cost was greater than the increase in per-pound net sales. On the other hand, the financial results on non-toll NFCOJ operations (table III-14) are somewhat different from results of operations on FCOJM operations between 2005/06 and 2010/11; even though sales quantity increased marginally, operating income increased over the period (except in 2006/07 and 2009/10). Between 2007/08 and 2009/10, even though both sales quantity and value of NFCOJ increased, operating income decreased somewhat for the same period because per-pound total cost remained almost the same and at the same time per-pound net sales decreased slightly. Per-pound average net sales and per-pound total costs for NFCOJ were consistently higher compared to those for FCOJM for all periods. Overall, however, operating income and per-pound profitability for NFCOJ were much higher than those for FCOJM (except 2007/08).

III-21
Table III-12 Certain orange juice: Results of non-toll operations of U.S. extractor/processors on combined FCOJM and NFCOJ, fiscal years 2005/06-2010/11
Item Fiscal year
2005/06 2006/07 2007/08 2008/09 2009/10 2010/11 Quantity (1,000 pounds SE)
Net sales1 604,251 528,959 494,889 603,175 621,415 557,105 Value ($1,000)
Net sales1 1,008,042 1,196,720 982,888 1,000,295 1,215,828 1,347,523
COGS 916,600 1,115,551 840,062 899,295 1,138,751 1,189,057
Gross profit 91,442 81,169 142,826 101,000 77,077 158,466
SG&A expenses 77,648 59,330 49,844 54,758 61,058 66,475
Operating income 13,794 21,839 92,982 46,242 16,019 91,991
Interest expense 19,178 15,163 12,525 11,597 12,783 13,517
Other expense 4,542 0 2,252 615 1,215 244
CDSOA funds received 1 1,855 8,777 1,942 7,579 4,712
Other income 3,860 3,425 2,448 1,444 13,615 3,342
Net income (6,065) 11,956 89,430 37,416 23,215 86,284
Depreciation/amortization 21,007 20,727 19,243 21,650 21,913 28,248
Cash flow 14,942 32,683 108,673 59,066 45,128 114,532
Net gain (loss) on futures (73,726) 38,747 148,824 (33,840) (70,823) (16,204) Value (per pound SE)
Net sales $1.67 $2.26 $1.99 $1.66 $1.96 $2.42
COGS 1.52 2.11 1.70 1.49 1.83 2.13
Gross profit 0.15 0.15 0.29 0.17 0.12 0.28
SG&A expenses 0.13 0.11 0.10 0.09 0.10 0.12
Operating income 0.02 0.04 0.19 0.08 0.03 0.17 Ratio to net sales (percent)
COGS 90.9 93.2 85.5 89.9 93.7 88.2
Gross profit 9.1 6.8 14.5 10.1 6.3 11.8
SG&A expenses 7.7 5.0 5.1 5.5 5.0 4.9
Operating income 1.4 1.8 9.5 4.6 1.3 6.8 Number of firms reporting
Operating losses 3 2 1 1 2 2
Data 6 6 6 6 6 6 1 Internal consumption and related transfers are not shown separately.
Source: Compiled from data submitted in response to Commission questionnaires.

III-22
Table III-13 FCOJM: Results of non-toll operations of U.S. extractor/processors, fiscal years 2005/06-2010/11
Item Fiscal year
2005/06 2006/07 2007/08 2008/09 2009/10 2010/11 Quantity (1,000 pounds SE)
Net sales1 397,542 318,827 312,992 390,255 407,696 348,653 Value ($1,000)
Net sales1 589,484 646,259 526,208 513,183 692,037 757,585
COGS 577,310 627,950 446,133 488,298 682,263 688,913
Gross profit 12,174 18,309 80,075 24,885 9,774 68,672
SG&A expenses 19,476 16,664 14,928 14,337 13,914 17,491
Operating income (7,302) 1,645 65,147 10,548 (4,140) 51,181
Interest expense 12,865 9,511 8,262 7,142 8,338 7,430
Other expense 853 0 188 12 117 135
CDSOA funds received 1 1,855 7,906 1,205 5,610 3,665
Other income 984 817 1,153 306 1,274 2,612
Net income (20,035) (5,194) 65,756 4,905 (5,711) 49,893
Depreciation/amortization 9,461 10,671 9,419 10,777 9,715 9,816
Cash flow (10,574) 5,477 75,175 15,682 4,004 59,709
Net gain (loss) on futures (75,282) 36,885 142,181 (35,899) (68,577) (15,371) Value (per pound SE)
Net sales $1.48 $2.03 $1.68 $1.32 $1.70 $2.17
COGS 1.45 1.97 1.43 1.25 1.67 1.98
Gross profit 0.03 0.06 0.26 0.06 0.02 0.20
SG&A expenses 0.05 0.05 0.05 0.04 0.03 0.05
Operating income (0.02) 0.01 0.21 0.03 (0.01) 0.15 Ratio to net sales (percent)
COGS 97.9 97.2 84.8 95.2 98.6 90.9
Gross profit 2.1 2.8 15.2 4.8 1.4 9.1
SG&A expenses 3.3 2.6 2.8 2.8 2.0 2.3
Operating income (1.2) 0.3 12.4 2.1 (0.6) 6.8 Number of firms reporting
Operating losses 4 3 2 2 3 2
Data 6 6 6 6 6 6 1 Internal consumption and related transfers are not shown separately.
Source: Compiled from data submitted in response to Commission questionnaires.

III-23
Table III-14 NFCOJ: Results of non-toll operations of U.S. extractor/processors, fiscal years 2005/06-2010/11
Item Fiscal year
2005/06 2006/07 2007/08 2008/09 2009/10 2010/11 Quantity (1,000 pounds SE)
Net sales1 206,709 210,132 181,897 212,920 213,719 208,452 Value ($1,000)
Net sales1 418,558 550,461 456,680 487,112 523,791 589,938
COGS 339,290 487,601 393,929 410,997 456,488 500,144
Gross profit 79,268 62,860 62,751 76,115 67,303 89,794
SG&A expenses 58,172 42,666 34,916 40,421 47,144 48,984
Operating income 21,096 20,194 27,835 35,694 20,159 40,810
Interest expense 6,313 5,652 4,263 4,455 4,445 6,087
Other expense 3,689 0 2,064 603 1,098 109
CDSOA funds received 0 0 871 737 1,969 1,047
Other income 2,876 2,608 1,295 1,138 12,341 730
Net income 13,970 17,150 23,674 32,511 28,926 36,391
Depreciation/amortization 11,546 10,056 9,824 10,873 12,198 18,432
Cash flow 25,516 27,206 33,498 43,384 41,124 54,823
Net gain (loss) on futures 1,556 1,862 6,643 2,059 (2,246) (833) Value (per pound SE)
Net sales $2.02 $2.62 $2.51 $2.29 $2.45 $2.83
COGS 1.64 2.32 2.17 1.93 2.14 2.40
Gross profit 0.38 0.30 0.35 0.36 0.31 0.43
SG&A expenses 0.28 0.20 0.19 0.19 0.22 0.24
Operating income 0.10 0.10 0.15 0.17 0.09 0.20 Ratio to net sales (percent)
COGS 81.1 88.6 86.3 84.4 87.2 84.8
Gross profit 18.9 11.4 13.7 15.6 12.8 15.2
SG&A expenses 13.9 7.8 7.6 8.3 9.0 8.3
Operating income 5.0 3.7 6.1 7.3 3.8 6.9 Number of firms reporting
Operating losses 2 1 1 1 1 0
Data 5 5 5 5 5 5 1 Internal consumption and related transfers are not shown separately.
Source: Compiled from data submitted in response to Commission questionnaires.

III-24
Selected financial data, by firm, are presented in table III-15. ***, experienced operating income for all periods for which data were collected. ***.24 ***. All extractor/processors except *** showed much improved profitability in the recent period, 2010/11.
The effects of by-product revenues are substantial and are reflected in this report. By-product revenues can be treated either as a cost reduction of the main or joint products, or as part of revenue or other income.25 However, for certain extractor/processors, these by-product revenues were so substantial and fluctuated to such an extent over the period that revenues exceeded tolling costs for certain periods which effectively resulted in negative tolling costs. Moreover, many extractor/processors treat by- product revenues as part of net sales and revenues. In this report, they are added to net sales values. Operating and net income are the same whether by-product revenues are subtracted from cost of goods sold (“COGS”) or are left out of COGS and treated as part of sales revenues.
Additional information was reported regarding whether and how much revaluation of inventory and mark-to-market adjustments were reflected in the financial data.26 ***.
Five extractor/processors reported gains and losses on futures and options.27 Except for ***, all other extractor/processors report net gains (losses) as part of COGS, as adjustments to raw material costs.
Selected aggregate per-pound cost data of the extractor/processors on their operations, i.e., COGS and selling, general, and administrative (“SG&A”) expenses, are presented in table III-16. Per-unit COGS fluctuated over the period which resulted in the same pattern for per-unit total cost (which included SG&A expenses) during the same periods, while per-unit SG&A expenses remained relatively unchanged.
Table III-15 Certain orange juice: Results of non-toll operations of U.S. extractor/processors on FCOJM and NFCOJ, by firm, fiscal years 2005/06-2010/11
* * * * * * *
24 ***. E-mail from ***, January 27, 2012. 25 Cost Accounting (Ninth Edition), Horngreen, Foster, Datar, Prentice Hall, 1997, p. 558. 26 When the utility of the goods in the ordinary course of business is no longer as great as their cost, a departure
from the cost principle of measuring the inventory is required. Whether the cause is obsolescence, physical deterioration, changes in price levels, or any other, the difference should be recognized by a charge to income in the current period. This usually is accomplished by stating the goods as a lower level designated as market (lower of cost or market principle) (ARB-43, Chapter 4, Statement 5). However, another Generally Accepted Accounting Principle (“GAAP”), Financial Accounting Standard (FAS-133, Accounting for Derivative Instruments and Hedging Activities) states that if inventory has been the hedged item in a fair value hedge, the inventory’s cost basis used in determining the lower-of-cost-or-market shall include the effects of adjusting its carrying amount as a result of recording the gain or loss on the hedged item. ***.
27 They are ***. E-mails from ***; e-mails from ***; e-mail from ***; e-mail from ***; e-mail from ***.

III-25
Table III-16 Certain orange juice: Per-pound costs of non-toll U.S. extractor/processors on FCOJM and NFCOJ, fiscal years 2005/06-2010/11
Item
Fiscal year
2005/06 2006/07 2007/08 2008/09 2009/10 2010/11
COGS: Value (per pound SE)
Raw materials $1.34 $1.88 $1.46 $1.27 $1.61 $1.85
Direct labor 0.07 0.09 0.09 0.08 0.09 0.10
Factory overhead 0.10 0.14 0.15 0.13 0.13 0.18
Total COGS 1.52 2.11 1.70 1.49 1.83 2.13
SG&A expenses 0.13 0.11 0.10 0.09 0.10 0.12
Total cost 1.65 2.22 1.80 1.58 1.93 2.25
Source: Compiled from data submitted in response to Commission questionnaires.
A variance analysis showing the effects of prices and volume on the extractor/processors’ sales of orange juice, and of costs and volume on their total cost, is shown in table III-17. The analysis is summarized at the bottom of the table. The analysis indicates that the increase in operating income ($78.2 million) between 2005/06 and 2010/11 was attributable mainly to the positive effect of increased price ($418.1 million) which was offset to some extent by the negative effects of increased costs/expenses ($338.9 million) and lower sales volume ($1.0 million). The increase in operating income in 2010/11 compared to 2009/10 was attributable again to a positive price variance in conjunction with negative cost/expense and volume variances.

III-26
Table III-17 Certain orange juice: Variance analysis of non-toll operations of U.S. extractor/processors on FCOJM and NFCOJ, fiscal years 2005/06-2010/11
Item
Between fiscal years
2006-11 2006-07 2007-08 2008-09 2009-10 2010-11
Value ($1,000)
Net sales:
Price variance 418,132 314,284 (136,752) (197,657) 185,284 257,521
Volume variance (78,651) (125,606) (77,080) 215,064 30,249 (125,826)
Total net sales variance 339,481 188,678 (213,832) 17,407 215,533 131,695
Cost of sales:
Cost variance (343,974) (313,163) 203,637 124,580 (212,261) (168,155)
Volume variance 71,517 114,212 71,852 (183,813) (27,195) 117,849
Total cost variance (272,457) (198,951) 275,489 (59,233) (239,456) (50,306)
Gross profit variance 67,024 (10,273) 61,657 (41,826) (23,923) 81,389
SG&A expenses:
Expense variance 5,115 8,643 5,665 5,992 (4,644) (11,736)
Volume variance 6,058 9,675 3,821 (10,906) (1,656) 6,319
Total SG&A variance 11,173 18,318 9,486 (4,914) (6,300) (5,417)
Operating income variance 78,197 8,045 71,143 (46,740) (30,223) 75,972
Summarized as:
Price variance 418,132 314,284 (136,752) (197,657) 185,284 257,521
Net cost/exp. variance (338,859) (304,520) 209,301 130,572 (216,905) (179,891)
Net volume variance (1,076) (1,719) (1,407) 20,345 1,398 (1,658)
Note.--Unfavorable variances are shown in parentheses; all others are favorable. The data are comparable to changes in operating income as presented in table III-12.
Source: Compiled from data submitted in response to Commission questionnaires.

III-27
In addition to the non-toll processing operations of domestic extractor/processors, there are some amounts of toll processing done by five extractor/processors, ***. Based upon questionnaire responses, toll processing accounted for approximately *** percent of the total combined value of FCOJM and NFCOJ processed in 2010/11 (3.7 percent for FCOJM and 5.7 percent for NFCOJ in 2010/11). *** toll- processed for ***; *** toll-processed for ***; *** toll-processed for ***; *** toll-processed for ***; and *** toll-processed for ***. Neither *** provided revenue and cost data relating to the sale of the processed FCOJM and NFCOJ to other parties.
In toll processing, the firm that owns the oranges or orange solids (the tollee) arranges for unrelated extractor/processors (the tollers) to process the oranges or orange solids for a fee, and then the tollee arranges for the final sale of the FCOJM and NFCOJ to other parties. Aggregate income-and-loss data for five extractor/processors (tollers) on their toll-processing operations are presented in table III-18. Selected financial data for five tollers, by firm, are presented in table III-19. The results are in contrast to the non-toll results contained in tables III-12, III-13, and III-14. While quantity and value of the toll- processing operations increased between 2005/06 and 2007/08, an operating loss changed to an operating income during the same period, because processing cost decreased for the same period. Between 2008/09 and 2010/11, both tolling quantities and revenues decreased and tolling income subsequently decreased.
Net by-product revenues were substantial and fluctuated over the period. They are added to tolling revenues because for certain tollers for certain periods, these additional revenues were greater than tolling costs; these by-product revenues appear to be in consideration for tollees and tollers when negotiating tolling fees. Differences between non-toll and toll extractor/processors are reflected in the financial results of the two types of extractor/processors. Using 2010/11 data as an example, the unit sales revenue reported by non-toll extractor/processors was *** per pound for FCOJM and NFCOJ combined, while the costs include the cost of the oranges or orange solids (*** per pound), the costs of processing (*** per pound), and SG&A expenses (*** per pound). These are in contrast to the financial results reported by toll extractor/processors, in which the revenues are the processing fees *** per pound) while the costs are processing costs ($0.23 per pound) and SG&A expenses ($0.04 per pound).

III-28
Table III-18 Certain orange juice: Results of toll-processing operations of U.S. extractor/processors on combined FCOJM and NFCOJ, fiscal years 2005/06-2010/11
Item Fiscal year
2005/06 2006/07 2007/08 2008/09 2009/10 2010/11 Quantity (1,000 pounds SE)
Net sales1 183,323 185,022 302,460 285,193 213,094 206,051 Value ($1,000) Net sales1 56,672 48,143 87,019 82,992 65,253 64,972
COGS 55,085 50,465 62,734 59,617 45,495 46,362
Gross profit 1,587 (2,322) 24,285 23,375 19,758 18,610
SG&A expenses 4,425 4,991 5,998 6,401 5,542 7,212
Operating income (2,838) (7,313) 18,287 16,974 14,216 11,398 Value (per pound SE)
Net sales $0.31 $0.26 $0.29 $0.29 $0.31 $0.32
COGS 0.30 0.27 0.21 0.21 0.21 0.23
Gross profit 0.01 (0.01) 0.08 0.08 0.09 0.09
SG&A expenses 0.02 0.03 0.02 0.02 0.03 0.04
Operating income (0.02) (0.04) 0.06 0.06 0.07 0.06 Ratio to net sales (percent)
COGS 97.2 104.8 72.1 71.8 69.7 71.4
Gross profit 2.8 (4.8) 27.9 28.2 30.3 28.6
SG&A expenses 7.8 10.4 6.9 7.7 8.5 11.1
Operating income (5.0) (15.2) 21.0 20.5 21.8 17.5 Number of firms reporting
Operating losses 2 2 0 0 0 0
Data 4 4 4 5 3 3 1 By-product revenue is reflected in net sales value. ***.
Source: Compiled from data submitted in response to Commission questionnaires.
Table III-19 Certain orange juice: Results of toll operations of U.S. extractor/processors on FCOJM and NFCOJ, by firm, fiscal years 2005/06-2010/11
* * * * * * *

III-29
Combined results of the U.S. extractor/processors (both toll and non-toll operations for FCOJM and NFCOJ) are presented in table III-20. Combined results of the U.S. extractor/processors (both toll and non-toll operations) for FCOJM are shown in table III-21, while combined results of the U.S. extractor/processors (both toll and non-toll operations) for NFCOJ are shown in table III-22, respectively.28 The trends on combined operations are similar to those of non-toll operations on FCOJM and NFCOJ because approximately 95 percent of sales revenues were derived from non-toll processing operations. While the quantity sold decreased between 2005/06 and 2010/11, net sales values and operating income increased during the same period, due primarily to an increase of average sale value. Even though sales quantities and values increased between 2007/08 and 2009/10, operating income decreased substantially during this period because per-pound total cost increased (from $1.20 to $1.50) more than an increase of per-pound selling price (from $1.34 to $1.54).
28 ***.

III-30
Table III-20 Certain orange juice: Results of U.S. extractor/processors on their combined FCOJM and NFCOJ toll and non-toll processing operations, fiscal years 2005/06-2010/11
Item Fiscal year
2005/06 2006/07 2007/08 2008/09 2009/10 2010/11 Quantity (1,000 pounds SE)
Net sales 787,574 713,981 797,349 888,368 834,509 763,156
Value ($1,000)
Net sales 1,064,714 1,244,863 1,069,907 1,083,287 1,281,081 1,412,495
COGS 971,685 1,166,016 902,796 958,912 1,184,246 1,235,419
Gross profit 93,029 78,847 167,111 124,375 96,835 177,076
SG&A expenses 82,073 64,321 55,842 61,159 66,600 73,687
Operating income 10,956 14,526 111,269 63,216 30,235 103,389
Value (per pound SE)
Net sales $1.35 $1.74 $1.34 $1.22 $1.54 $1.85
COGS 1.23 1.63 1.13 1.08 1.42 1.62
Gross profit 0.12 0.11 0.21 0.14 0.12 0.23
SG&A expenses 0.10 0.09 0.07 0.07 0.08 0.10
Operating income 0.01 0.02 0.14 0.07 0.04 0.14
Ratio to net sales (percent)
COGS 91.3 93.7 84.4 88.5 92.4 87.5
Gross profit 8.7 6.3 15.6 11.5 7.6 12.5
SG&A expenses 7.7 5.2 5.2 5.6 5.2 5.2
Operating income 1.0 1.2 10.4 5.8 2.4 7.3
Number of firms reporting
Operating losses 3 2 1 1 2 2
Data 6 6 6 6 6 6
Source: Compiled from data submitted in response to Commission questionnaires.
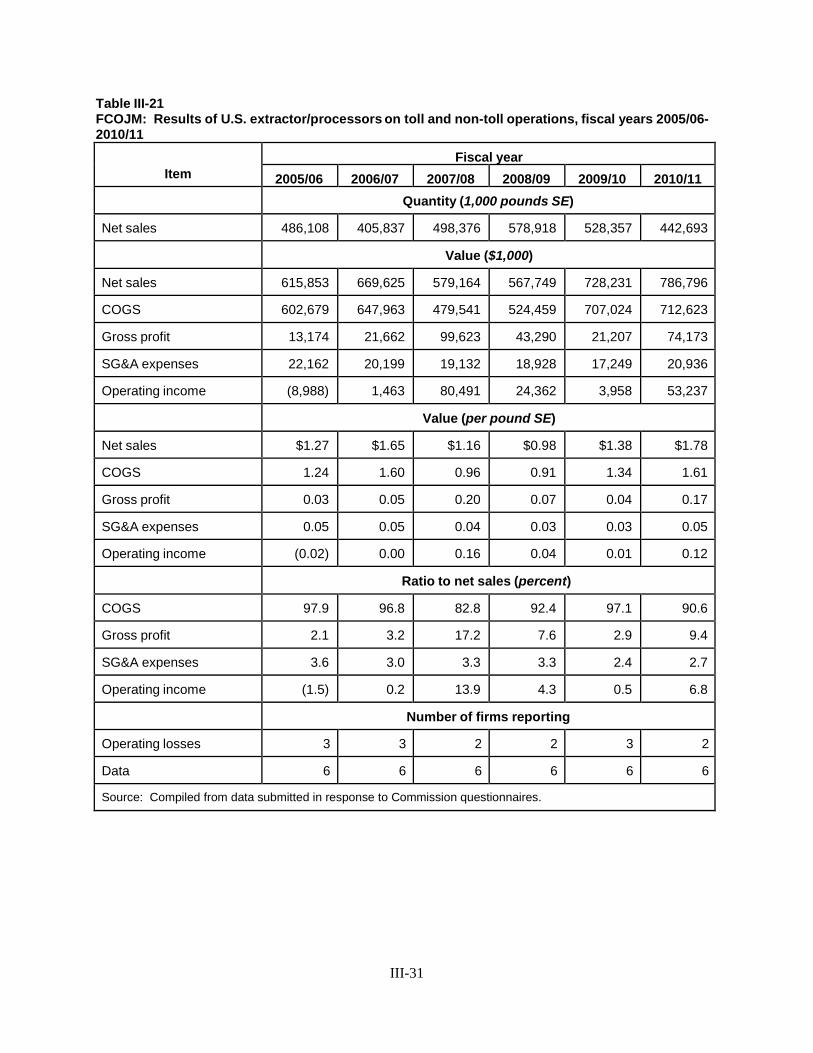
III-31
Table III-21 FCOJM: Results of U.S. extractor/processors on toll and non-toll operations, fiscal years 2005/06- 2010/11
Item Fiscal year
2005/06 2006/07 2007/08 2008/09 2009/10 2010/11 Quantity (1,000 pounds SE)
Net sales 486,108 405,837 498,376 578,918 528,357 442,693
Value ($1,000)
Net sales 615,853 669,625 579,164 567,749 728,231 786,796
COGS 602,679 647,963 479,541 524,459 707,024 712,623
Gross profit 13,174 21,662 99,623 43,290 21,207 74,173
SG&A expenses 22,162 20,199 19,132 18,928 17,249 20,936
Operating income (8,988) 1,463 80,491 24,362 3,958 53,237
Value (per pound SE)
Net sales $1.27 $1.65 $1.16 $0.98 $1.38 $1.78
COGS 1.24 1.60 0.96 0.91 1.34 1.61
Gross profit 0.03 0.05 0.20 0.07 0.04 0.17
SG&A expenses 0.05 0.05 0.04 0.03 0.03 0.05
Operating income (0.02) 0.00 0.16 0.04 0.01 0.12
Ratio to net sales (percent)
COGS 97.9 96.8 82.8 92.4 97.1 90.6
Gross profit 2.1 3.2 17.2 7.6 2.9 9.4
SG&A expenses 3.6 3.0 3.3 3.3 2.4 2.7
Operating income (1.5) 0.2 13.9 4.3 0.5 6.8
Number of firms reporting
Operating losses 3 3 2 2 3 2
Data 6 6 6 6 6 6
Source: Compiled from data submitted in response to Commission questionnaires.

III-32
Table III-22 NFCOJ: Results of U.S. extractor/processors on toll and non-toll operations, fiscal years 2005/06- 2010/11
Item Fiscal year
2005/06 2006/07 2007/08 2008/09 2009/10 2010/11 Quantity (1,000 pounds SE)
Net sales 301,466 308,144 298,973 309,450 306,152 320,463
Value ($1,000)
Net sales 448,861 575,238 490,743 515,538 552,850 625,699
COGS 369,006 518,053 423,255 434,453 477,222 522,796
Gross profit 79,855 57,185 67,488 81,085 75,628 102,903
SG&A expenses 59,911 44,122 36,710 42,231 49,351 52,751
Operating income 19,944 13,063 30,778 38,854 26,277 50,152
Value (per pound SE)
Net sales $1.49 $1.87 $1.64 $1.67 $1.81 $1.95
COGS 1.22 1.68 1.42 1.40 1.56 1.63
Gross profit 0.26 0.19 0.23 0.26 0.25 0.32
SG&A expenses 0.20 0.14 0.12 0.14 0.16 0.16
Operating income 0.07 0.04 0.10 0.13 0.09 0.16
Ratio to net sales (percent)
COGS 82.2 90.1 86.2 84.3 86.3 83.6
Gross profit 17.8 9.9 13.8 15.7 13.7 16.4
SG&A expenses 13.3 7.7 7.5 8.2 8.9 8.4
Operating income 4.4 2.3 6.3 7.5 4.8 8.0
Number of firms reporting
Operating losses 2 2 1 0 1 0
Data 5 5 5 5 5 5
Source: Compiled from data submitted in response to Commission questionnaires.

III-33
Capital Expenditures and Research and Development Expenses
The responding firms’ aggregate data on capital expenditures and research and development (“R&D”) expenses are presented in table III-23. *** had large capital expenditures during the period for which data were collected. *** reported R&D expenses. Capital expenditures, by firm, are presented in table III-24. Capital expenditures decreased substantially in 2006/07 and again in 2007/08 and then increased in 2009/10, due mainly to ***. R&D expenses decreased continuously from 2005/06 to 2008/09 and increased in both 2009/10 and 2010/11.
Table III-23 Certain orange juice: Capital expenditures and R&D expenses by U.S. extractor/processors, fiscal years 2005/06-2010/11
Item
Fiscal year
2005/06 2006/07 2007/08 2008/09 2009/10 2010/11
Value ($1,000)
Capital expenditures:1
FCOJM 19,936 11,489 7,602 9,737 12,948 8,721
NFCOJ 20,081 12,788 14,022 21,430 70,500 38,246
Total 40,017 24,277 21,624 31,167 83,448 46,967
R&D expenses:2
FCOJM *** *** *** *** *** ***
NFCOJ *** *** *** *** *** ***
Total *** *** *** *** *** *** 1 All companies reported capital expenditures. 2 *** reported R&D expenses.
Source: Compiled from data submitted in response to Commission questionnaires.
Table III-24 Certain orange juice: Capital expenditures by U.S. extractor/processors, by firms, fiscal years 2005/06-2010/11
* * * * * * *

III-34
Assets and Return on Investment
U.S. extractor/processors were requested to provide data on their assets used in the production and sales of orange juice during the period for which data were collected to assess their return on investment (“ROI”). Although ROI can be computed in different ways, a commonly used method is income earned during the period divided by the total assets utilized for the operations. Therefore, staff calculated ROI as operating income divided by total assets used in the production and sales of certain orange juice. Data on the U.S. extractor/processors’ total assets and their ROI are presented in table III- 25.
The value of total assets decreased steadily from 2005/06 to 2008/09 and then increased between 2008/09 and 2010/11. The return on investment increased during the period for which data were collected since operating income increased during the same period. The trend of ROI over the period was the same as the trend of the operating income margin to net sales in tables III-12 and III-20 over the same period.
Table III-25 Certain orange juice: Value of assets and return on investment of U.S. extractor/processors, fiscal years 2005/06-2010/11
Item
At end of fiscal year
2005/06 2006/07 2007/08 2008/09 2009/10 2010/11 Value ($1,000)
Total net assets 447,760 436,946 426,982 413,913 460,291 459,980 Value ($1,000)
Operating income (loss) 13,794 21,839 92,982 46,242 16,019 91,991 Ratio of operating income to total assets (percent)
Return on investment 3.1 5.0 21.8 11.2 3.5 20.0
Source: Compiled from data submitted in response to Commission questionnaires.
Operations on Certain Orange Growers
Results of operations of 11 U.S. orange growers are presented in table III-26.29 Due to the extremely small number of responses by U.S. growers compared to over 5,500 growers in Florida, the financial results of 11 growers may not represent a true picture of the operational results of all U.S. growers. Sales quantity and value both fluctuated between 2005/06 and 2010/11, while operating income increased between 2005/06 and 2007/08, fell in 2008/09, and partially recovered in 2009/10 and 2010/11. The average unit sales value per box increased from 2005/06 to 2006/07, decreased in 2007/08 and 2008/09, then recovered in 2009/10 and 2010/11, while the average unit growing and operating expenses generally followed the same trend, but increased less than the increase in per-unit sales value, which resulted in a higher operating income in 2010/11 compared to 2005/06. However, net income before income taxes for 2005/06 was much higher than 2010/11 because of other income which comprised of government assistance, insurance proceeds, and others (refer to table III-27).
29 Although a total 19 growers submitted questionnaire responses, eight responses either contained no financial data or inconsistent financial data, or were substantially incomplete, therefore, could not be utilized.
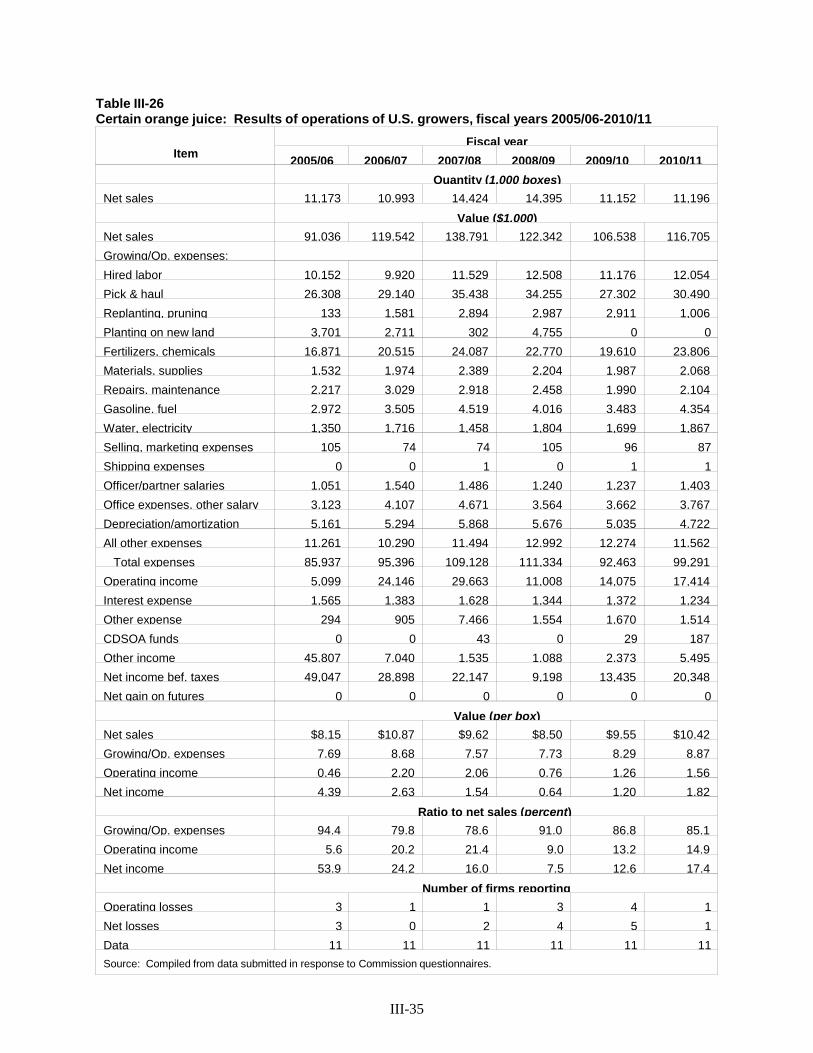
III-35
Table III-26 Certain orange juice: Results of operations of U.S. growers, fiscal years 2005/06-2010/11
Item
Fiscal year
2005/06
2006/07
2007/08
2008/09
2009/10
2010/11
Quantity (1,000 boxes)
Net sales
11,173
10,993
14,424
14,395
11,152
11,196
Value ($1,000)
Net sales
91,036
119,542
138,791
122,342
106,538
116,705
Growing/Op. expenses:
Hired labor
10,152
9,920
11,529
12,508
11,176
12,054
Pick & haul
26,308
29,140
35,438
34,255
27,302
30,490
Replanting, pruning
133
1,581
2,894
2,987
2,911
1,006
Planting on new land
3,701
2,711
302
4,755
0
0
Fertilizers, chemicals
16,871
20,515
24,087
22,770
19,610
23,806
Materials, supplies
1,532
1,974
2,389
2,204
1,987
2,068
Repairs, maintenance
2,217
3,029
2,918
2,458
1,990
2,104
Gasoline, fuel
2,972
3,505
4,519
4,016
3,483
4,354
Water, electricity
1,350
1,716
1,458
1,804
1,699
1,867
Selling, marketing expenses
105
74
74
105
96
87
Shipping expenses
0
0
1
0
1
1
Officer/partner salaries
1,051
1,540
1,486
1,240
1,237
1,403
Office expenses, other salary
3,123
4,107
4,671
3,564
3,662
3,767
Depreciation/amortization
5,161
5,294
5,868
5,676
5,035
4,722
All other expenses
11,261
10,290
11,494
12,992
12,274
11,562
Total expenses
85,937
95,396
109,128
111,334
92,463
99,291
Operating income
5,099
24,146
29,663
11,008
14,075
17,414
Interest expense
1,565
1,383
1,628
1,344
1,372
1,234
Other expense
294
905
7,466
1,554
1,670
1,514
CDSOA funds
0
0
43
0
29
187
Other income
45,807
7,040
1,535
1,088
2,373
5,495
Net income bef. taxes
49,047
28,898
22,147
9,198
13,435
20,348
Net gain on futures
0
0
0
0
0
0
Value (per box)
Net sales
$8.15
$10.87
$9.62
$8.50
$9.55
$10.42
Growing/Op. expenses
7.69
8.68
7.57
7.73
8.29
8.87
Operating income
0.46
2.20
2.06
0.76
1.26
1.56
Net income
4.39
2.63
1.54
0.64
1.20
1.82
Ratio to net sales (percent)
Growing/Op. expenses
94.4
79.8
78.6
91.0
86.8
85.1
Operating income
5.6
20.2
21.4
9.0
13.2
14.9
Net income
53.9
24.2
16.0
7.5
12.6
17.4
Number of firms reporting
Operating losses
3
1
1
3
4
1
Net losses
3
0
2
4
5
1
Data
11
11
11
11
11
11
Source: Compiled from data submitted in response to Commission questionnaires.

III-36
Nine growers reported sources of other income; this information is presented in table III-27. Table III-27 Certain orange juice: Sources of other income of U.S. growers, fiscal years 2005/06-2010/11
Item
Fiscal year
2005/06
2006/07
2007/08
2008/09
2009/10
2010/11
Value ($1,000)
Government assistance1
32,889
3,873
320
0
0
0
Proceeds from insurance2
10,470
1,798
127
181
1,168
4,125
All other income3
2,448
1,369
1,088
907
1,205
1,370
Total
45,807
7,040
1,535
1,088
2,373
5,495
1 *** reported these amounts. 2 *** reported these amounts. 3 *** reported these amounts.
Source: Compiled from data submitted in response to Commission questionnaires.
Growers’ Capital Expenditures and Research and Development Expenses
The responding growers’ aggregate data on capital expenditures and research and development
(“R&D”) expenses are shown in table III-28. Capital expenditures fluctuated over the period30 while R&D expenses which were reported by *** for the most recent two years were negligible.
Table III-28 Certain orange juice: Capital expenditures and R&D expenses by U.S. growers, fiscal years 2005/06-2010/11
Item
Fiscal year
2005/06
2006/07
2007/08
2008/09
2009/10
2010/11
Value ($1,000)
Capital expenditures1
8,512
11,919
5,334
10,966
2,694
3,962
R&D expenses2
0
0
0
0
***
***
1 Nine growers reported capital expenditures. 2 *** reported R&D expenses.
Source: Compiled from data submitted in response to Commission questionnaires.
30 Capital expenditures were spent primarily for ***. E-mail from ***.

IV-1
PART IV: U.S. IMPORTS AND THE FOREIGN INDUSTRY
U.S. IMPORTS
Overview
The Commission issued questionnaires to 36 firms believed to have imported certain orange juice between crop years 2005/06 and 2010/11 as well as to all U.S. extractors/processors of certain orange juice. Nine firms provided data and information in response to the questionnaires, while 16 firms indicated that they had not imported certain orange juice during the period for which data were collected, and one firm provided an incomplete response.1 U.S. import data are based on official Commerce statistics for imports of certain orange juice.2 Firms responding to the Commission’s questionnaire accounted for virtually all3 imports of certain orange juice from Brazil during 2010/11.
Imports from Subject and Nonsubject Countries4
Table IV-1 presents data for U.S. imports of certain orange juice from Brazil and all other sources.
The share of imports of certain orange juice from Brazil was 51.9 percent in 2010/11, split *** between subject and nonsubject sources. Imports of certain orange juice from both subject and nonsubject Brazilian sources decreased from 2005/06 to 2010/11, by *** percent and *** percent respectively. Imports of certain orange juice from all other countries, however, increased over the 6-year period by 27 percent. The leading sources of nonsubject imports were Mexico (26.9 percent of total imports in 2010) and Costa Rica (10.7 percent of total imports in 2010).
1 The Commission also received ***. 2 Official import statistics presented for certain orange juice are collected under two HTS statistical reporting
numbers: 2009.11.0060 (FCOJM) and 2009.12.25 (NFCOJ). Some FCOJM and NFCOJ may be imported under subheadings 2009.12.45 and 2009.19.00, which also include nonsubject merchandise.
3 Proprietary Customs data reports *** firms importing orange juice from Brazil in calendar year 2010. The Commission received the six largest importers’ questionnaires; those companies accounted for virtually all (*** percent) of U.S. imports from Brazil for 2010.
4 In December 2011, The U.S. Food and Drug Administration (FDA) reported that trace amounts of the banned fungicide carbendazim had been found in orange juice from Brazil. The FDA is currently testing both imported and domestic juice. It will deny entry to shipments that test positive for carbendazim. As of February 16, 2012, the FDA found 24 (out of 104) samples that tested positive, and has detained and/or refused the shipments. Of the 24 samples, 12 were from shipments from Canada and 12 were from Brazil. FDA, http://www.fda.gov/Food/FoodSafety /Product-SpecificInformation/FruitsVegetablesJuices/ucm287783.htm, retrieved on February 22, 2012.

IV-2
Table IV-1 Certain orange juice: U.S. imports, by sources, crop years 2005/06-2010/11
Source
Crop year (October - September)
2005/06 2006/07 2007/08 2008/09 2009/10 2010/11
Quantity (1,000 gallons SSE1)
FCOJM:
Brazil (subject) *** *** *** *** *** ***
Brazil (nonsubject) *** *** *** *** *** ***
Other sources 91,175 128,541 144,168 129,517 127,884 114,205
Total 91,175 128,541 144,168 129,517 127,884 191,999
NFCOJ:
Brazil 25,011 47,870 47,465 62,062 46,630 49,909
Other sources 2,116 2,838 2,783 1,269 3,315 4,242
Total 27,127 50,708 50,248 63,331 49,944 54,151
Total:
Brazil (subject) *** *** *** *** *** ***
Brazil (nonsubject) *** *** *** *** *** ***
Other sources 93,291 131,379 146,951 130,786 131,199 118,446
Total 93,291 131,379 393,383 130,786 314,088 246,150
Value (1,000 dollars)2
FCOJM:
Brazil (subject) *** *** *** *** *** ***
Brazil (nonsubject) *** *** *** *** *** ***
Other sources 105,286 229,069 218,388 142,874 169,791 181,447
Total 308,991 599,696 218,388 142,874 169,791 317,907
NFCOJ:
Brazil 34,226 68,046 80,989 115,458 94,755 102,113
Other sources 4,777 7,870 5,262 2,303 9,409 9,315
Total 39,002 75,916 86,251 117,762 104,164 111,427
Total:
Brazil (subject) *** *** *** *** *** ***
Brazil (nonsubject) *** *** *** *** *** ***
Other sources 110,062 236,939 223,650 145,178 179,201 190,761
Total 347,993 236,939 223,650 145,178 453,340 429,334
Table continued on next page.

IV-3
Table IV-1--Continued Certain orange juice: U.S. imports, by sources, crop years 2005/06-2010/11
Source
Crop year (October - September)
2005/06 2006/07 2007/08 2008/09 2009/10 2010/11
Unit value (dollars per gallon)
FCOJM:
Brazil (subject) *** *** *** *** *** ***
Brazil (nonsubject) *** *** *** *** *** ***
Other sources 1.15 1.78 1.51 1.10 1.33 1.59
Average 1.16 1.76 1.47 1.16 1.32 1.66
NFCOJ:
Brazil 1.37 1.42 1.71 1.86 2.03 2.05
Other sources 2.26 2.77 1.89 1.81 2.84 2.20
Average 1.44 1.50 1.72 1.86 2.09 2.06
Total:
Brazil (subject) *** *** *** *** *** ***
Brazil (nonsubject) *** *** *** *** *** ***
Other sources 1.18 1.80 1.52 1.11 1.37 1.61
Average 1.19 1.72 1.50 1.31 1.44 1.74
Share of quantity (percent)
FCOJM:
Brazil (subject) *** *** *** *** *** ***
Brazil (nonsubject) *** *** *** *** *** ***
Other sources 34.3 37.7 42.0 54.4 48.4 59.5
Total 100.0 37.7 42.0 54.4 48.4 100.0
NFCOJ:
Brazil 92.2 94.4 94.5 98.0 93.4 92.2
Other sources 7.8 5.6 5.5 2.0 6.6 7.8
Total 100.0 100.0 100.0 100.0 100.0 100.0
Total:
Brazil (subject) *** *** *** *** *** ***
Brazil (nonsubject) *** *** *** *** *** ***
Other sources 31.8 33.5 37.4 43.4 41.8 48.1
Total 31.8 33.5 100.0 43.4 41.8 100.0
Table continued on next page.

IV-4
Table IV-1--Continued Certain orange juice: U.S. imports, by sources, crop years 2005/06-2010/11
Source
Crop year (October - September)
2005/06 2006/07 2007/08 2008/09 2009/10 2010/11
Share of value (percent)
FCOJM:
Brazil (subject) *** *** *** *** *** ***
Brazil (nonsubject) *** *** *** *** *** ***
Other sources 34.1 38.2 43.2 51.6 48.6 57.1
Total 34.1 38.2 43.2 100.0 48.6 100.0
NFCOJ:
Brazil 87.8 89.6 93.9 98.0 91.0 91.6
Other sources 12.2 10.4 6.1 2.0 9.0 8.4
Total 100.0 100.0 100.0 100.0 100.0 100.0
Total:
Brazil (subject) *** *** *** *** *** ***
Brazil (nonsubject) *** *** *** *** *** ***
Other sources 31.6 35.1 37.8 36.8 39.5 44.4
Total 31.6 35.1 37.8 100.0 39.5 100.0
1 Single strength equivalent. 2 Landed, duty-paid.
Note.–Imports of FCOJM are from HTS statistical reporting number 2009.11.0060 and imports of NFCOJ are from HTS subheading 2009.12.25. Subject imports were compiled based on foreign manufacturers identified in proprietary customs data as being assessed an antidumping duty. Liters are converted to gallons by a conversion factor of .2642.
Source: Official Commerce statistics and proprietary Customs data.
U.S. IMPORTERS’ IMPORTS SUBSEQUENT TO SEPTEMBER 30, 2011
The Commission requested importers to indicate whether they had imported or arranged for the
importation of certain orange juice from Brazil for delivery after September 30, 2011. Seven importers responded that they have imported or arranged for the imports of certain orange juice after September 30, 2011. The estimated total arranged imports reported by five of these seven importers are 39.3 million gallons.5
5 *** did not provide estimates.

IV-5
U.S. IMPORTERS’ INVENTORIES
Table IV-2 presents data for inventories of U.S. imports of certain orange juice from Brazil and all other sources held in the United States. No Brazilian producer reported maintaining inventories of certain orange juice in the United States, including in foreign trade zones or bonded warehouses since 2005.
Table IV-2 Certain orange juice: U.S. importers’ end-of-period inventories of imports, by source, crop years 2005/06- 2010/11
Item
Crop year (October - September)
2005/06 2006/07 2007/08 2008/09 2009/10 2010/11
FCOJM:
Imports from Brazil (subject):
Inventories (1,000 pounds SE) *** *** *** *** *** ***
Ratio to U.S. imports (percent) *** *** *** *** *** ***
Ratio to total shipments of imports (percent)
***
***
***
***
***
***
Imports from Brazil (nonsubject):
Inventories (1,000 pounds SE) 5,835 15,365 7,221 25,280 14,775 12,416
Ratio to U.S. imports (percent) 5.5 21.5 12.5 23.8 12.3 15.6
Ratio to total shipments of imports (percent)
5.1
27.0
12.4
32.2
11.9
18.0
Imports from all other sources:
Inventories (1,000 pounds SE) *** *** *** *** *** ***
Ratio to U.S. imports (percent) *** *** *** *** *** ***
Ratio to total shipments of imports (percent)
***
***
***
***
***
***
Imports from all sources:
Inventories (1,000 pounds SE) 21,265 53,039 51,815 61,599 46,889 25,118
Ratio to U.S. imports (percent) 7.7 15.0 15.4 23.2 17.5 14.2
Ratio to total shipments of imports (percent)
9.8
21.0
19.9
34.6
22.1
16.5
Table continued on next page.
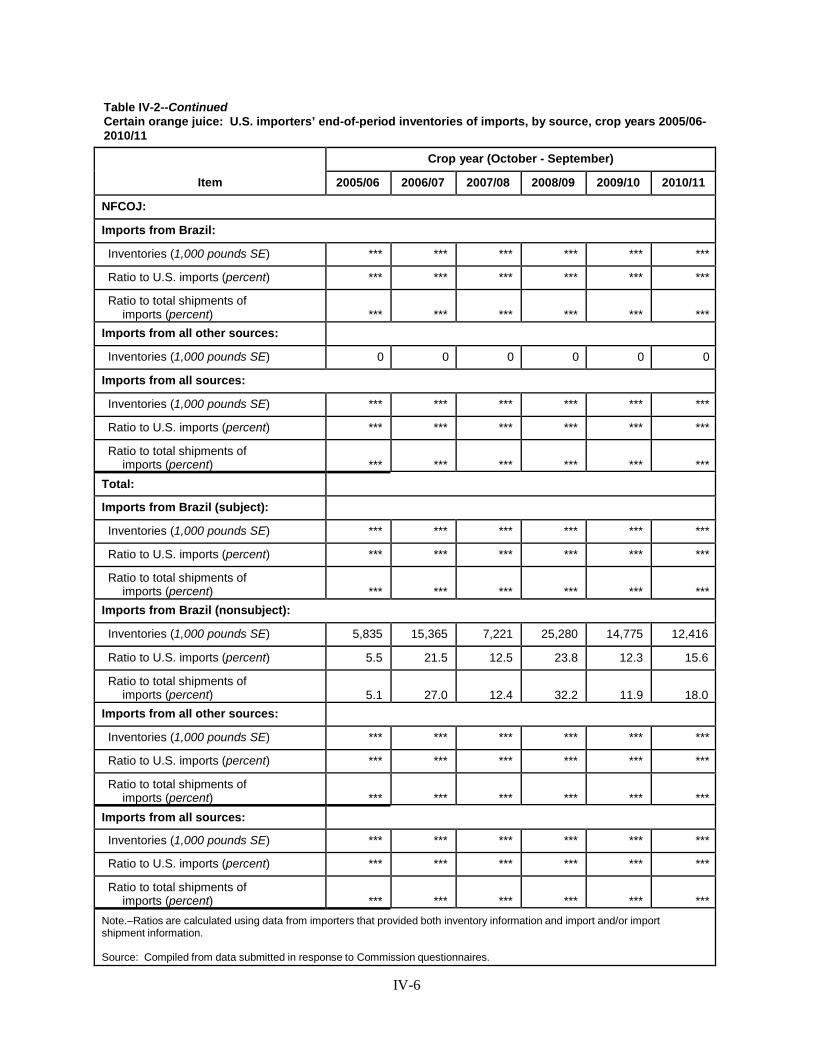
IV-6
Table IV-2--Continued Certain orange juice: U.S. importers’ end-of-period inventories of imports, by source, crop years 2005/06- 2010/11
Item
Crop year (October - September)
2005/06 2006/07 2007/08 2008/09 2009/10 2010/11
NFCOJ:
Imports from Brazil:
Inventories (1,000 pounds SE) *** *** *** *** *** ***
Ratio to U.S. imports (percent) *** *** *** *** *** ***
Ratio to total shipments of imports (percent)
***
***
***
***
***
***
Imports from all other sources:
Inventories (1,000 pounds SE) 0 0 0 0 0 0
Imports from all sources:
Inventories (1,000 pounds SE) *** *** *** *** *** ***
Ratio to U.S. imports (percent) *** *** *** *** *** ***
Ratio to total shipments of imports (percent)
***
***
***
***
***
***
Total:
Imports from Brazil (subject):
Inventories (1,000 pounds SE) *** *** *** *** *** ***
Ratio to U.S. imports (percent) *** *** *** *** *** ***
Ratio to total shipments of imports (percent)
***
***
***
***
***
***
Imports from Brazil (nonsubject):
Inventories (1,000 pounds SE) 5,835 15,365 7,221 25,280 14,775 12,416
Ratio to U.S. imports (percent) 5.5 21.5 12.5 23.8 12.3 15.6
Ratio to total shipments of imports (percent)
5.1
27.0
12.4
32.2
11.9
18.0
Imports from all other sources:
Inventories (1,000 pounds SE) *** *** *** *** *** ***
Ratio to U.S. imports (percent) *** *** *** *** *** ***
Ratio to total shipments of imports (percent)
***
***
***
***
***
***
Imports from all sources:
Inventories (1,000 pounds SE) *** *** *** *** *** ***
Ratio to U.S. imports (percent) *** *** *** *** *** ***
Ratio to total shipments of imports (percent)
***
***
***
***
***
***
Note.–Ratios are calculated using data from importers that provided both inventory information and import and/or import shipment information.
Source: Compiled from data submitted in response to Commission questionnaires.
IV-7
ANTIDUMPING INVESTIGATIONS IN THIRD-COUNTRY MARKETS
There are no known antidumping duty investigations or determinations on certain orange juice in any other country.
THE INDUSTRY IN BRAZIL
Overview
Brazil is the world’s largest orange juice producer and exporter. According to USDA data, Brazil produced 62.3 percent of total world production in 2010/11.6 Brazil grows four major varieties of oranges used for processing: Hamlin, Pera Rio, Natal, and Valencia. Orange growing and orange juice processing are concentrated in the state of São Paulo, where more than 75 percent of the orange bearing trees and orange juice production are located.7 The Brazilian citrus industry, like Florida, has been affected by citrus greening, which is primarily a tropical disease.8
In June 2011, the Brazilian government announced a new financing program for citrus processors. Each firm will be granted up to $50 million with an annual interest rate of 6.75 percent to purchase oranges that will be processed in the 2011/12 season. The program was created to finance the stockpiling of up to 240,000 metric tons of orange juice and is intended to minimize the negative effects of supply peaks that lead to plunges in the value of orange juice and fruit. The program is in place for one year and is not expected to be renewed.9
The Brazilian orange juice industry consists of four major firms. Presented in table IV-3 is a list of Brazilian extractors/processors of certain orange juice, related and/or affiliated firms, and share of reported Brazilian production of certain orange juice in 2010/11. Publicly available data on the Brazilian orange and orange juice industry are presented in table IV-4.10
6 USDA, FAS, PS&D Online database (accessed December 12, 2011). 7 “Brazil Citrus Annual 2010”, USDA Foreign Agricultural Service GAIN Report, December 9, 2010. 8 Hearing Transcript, pp. 77-78 (Sparks and Warlick). 9 FCM’s prehearing brief, pp. 14-17 and exh. 1; Respondents’ posthearing brief, Exhibit 1, Questions from
Chairman Okun, pp. 1-2. 10 The crop year for Brazil is July through June; the crop year in the United States is October through September.

IV-8
Table IV-3 Certain orange juice: Brazilian extractors/processors, related and/or affiliated firms, and shares of 2010/11 reported Brazilian production
Firm
Related and/or affiliated firms
Share of 2010/11 Brazilian
production (percent)
Share of 2010/11 U.S.
exports (percent)
Citrovita Agro Industrial Ltda. (“Citrovita)1
Owned by Votorantim Group, Brazil; ***
***
***
Sucocitrico Cutrale (“Cutrale”)
Cutrale Citrus Juices, Auburndale, FL; ***
***
***
Fischer S.A. Comercio, Industria e Agricultura, (“Fischer”)2
Citrosuco North America, Lake Wales, FL
***
***
Louis Dreyfus Commodities Agroindustrial S.A. (“Louis Dreyfus”)
Louis Dreyfus Citrus, Winter Garden, FL
***
***
Montecitrus Trading S/A (“Montecitrus”)
None
***
***
1 Citrovita is a nonsubject producer of certain orange juice. 2 Fischer S.A. Comercio, Industria e Agricultura is the successor-in-interest to Fischer S/A-Agroindustria.
Note.–In May 2010, Citrovita and Citrosuco (controlled by Fischer) announced that the two companies will merge, forming a 50/50 joint venture. "Brazil OJ firms clear first hurdle in merger." Reuters, March 31, 2011. Found at http://uk.reuters.com/article/2011/03/31/idUKN3125035920110331, retrieved December 15, 2011.
Source: Compiled from data submitted in response to Commission questionnaires.

IV-9
Table IV-4 Orange juice: Brazilian orange bearing trees, production and utilization of oranges, Brazilian stocks, production, exports, and domestic consumption, crop years 2005/06-2011/12, and projected 2012/13
Item
Crop year (July - June)
2005/06
2006/07
2007/08
2008/09
2009/10
2010/11
2011/12
Projected 2012/13
Area planted (1,000 acres)
2,103
2,058
2,056
2,088
2,016
1,977
2,002
1,984
Area harvested (1,000 acres)
1,830
1,786
1,798
1,803
1,790
1,790
1,815
1,798
Bearing trees (millions)
214
216
217
218
216
219
223
221
Non-bearing trees (millions)
41
41
39
43
49
40
40
40
Oranges produced (million 90-lb boxes)
406
441
453
413
417
378
506
445
Quantity (million SSE gallons)
FCOJM:1
Beginning stocks2 142 25 21 233 242 180 21 288
Total production 1,807 2,024 2,081 1,750 1,790 1,539 2,024 1,750
Total supply 1,949 2,050 2,102 1,984 2,031 1,719 2,046 2,038
Exports 1,891 1,989 1,825 1,792 1,804 1,649 1,701 1,750
Domestic consumption
32
39
44
48
48
49
56
59
Ending stocks 25 21 233 143 180 21 288 229 1 The data include NFCOJ production for exports converted to FCOJM 65 Brix equivalent. There is no official
estimate for NFCOJ supply and demand in Brazil. 2 São Paulo stocks.
Note.–One hectare=2.471 acres, 40.8 kg box=90 pound box, FCOJ metric tons at 65 Brix and NFC metric tons export (which were presented in FCOJ Brix equivalents) were converted to SSE gallons by a conversion factor of 1405.88. Because of rounding, figures may not add to the totals shown.
Source: “Brazil Citrus Annual 2011", USDA Foreign Agricultural Service GAIN Report, December 7, 2011, “Brazil Citrus Annual 2010", USDA Foreign Agricultural Service GAIN Report, December 9, 2010, “Brazil Citrus Annual 2009", USDA Foreign Agricultural Service GAIN Report, December 15, 2009, “Brazil Citrus Annual 2008", USDA Foreign Agricultural Service GAIN Report, December 19, 2008., “Brazil Citrus Annual 2007", USDA Foreign Agricultural Service GAIN Report, December 17, 2007, “Brazil Citrus Annual 2006", USDA Foreign Agricultural Service GAIN Report, December 15, 2006.

IV-10
Certain Orange Juice Operations
At the time of the Commission’s original investigation, usable questionnaire responses were received from four firms estimated to account for approximately 85 percent of Brazilian production of certain orange juice in 2004/05.11 In this review, the Commission issued foreign producer questionnaires to 23 Brazilian firms believed to process and/or export certain orange juice. Questionnaire responses were received from four subject producers of certain orange juice and one nonsubject producer of FCOJM in Brazil that are believed to account for 90 percent12 of Brazilian production of certain orange juice in 2010/11.
Brazilian producers were asked to indicate whether their firms had experienced any plant openings, closing, relocations, expansions, acquisitions, consolidations, prolonged shutdowns or curtailments, revised labor agreements, or any other change in the character of their operations or organization relating to the production of certain orange juice since 2005. Three Brazilian processor/extractors reported owning or planting new groves. One firm, ***, reported that its *** stopped production in February 2009 and is now used only for warehousing. Two firms reported expansions; *** expanded its groves and NFC handling and storage capabilities in two plants, while *** increased its trees and processing capability. *** reported that labor agreements are revised each year, resulting in a *** percent accumulated increase in wages over from 2005 to 2011. Four Brazilian processor/extractors reported increases of juice storage capacity.
In addition to these changes in operations, there has also been one merger in the Brazilian orange juice industry. In May 2010, Citrovita and Citrosuco (controlled by Fischer) announced that they will merge, creating a 50/50 joint venture.13 In December 2011, Brazil’s antitrust regulator, the Administrative Board for Economic Protection (CADE), approved the merger.14 Citrosuco stated that the joint venture has not been finalized and is not scheduled to close in the immediate future.15 In addition, Citrovita stated that once the merger is finalized, ***.
Information on reported Brazilian processor/extractors’ production capacity, production, shipments and inventories are presented in tables IV-5 through IV-7. Table IV-8 presents data for Citrovita, a nonsubject producer of FCOJM in Brazil. The data show an increase in capacity for total subject certain orange juice by 5.2 percent from 2005/06 to 2010/11. Two processor/extractors reported producing or anticipate producing tangerine, lemon, and lime juices using the same machinery and equipment or using the same production and related workers that are used to produce certain orange juice. Reported capacity for nonsubject processor/extractor, Citrovita, ***.
Production and total shipments of subject certain orange juice decreased from 2005/06 to 2010/11, by 12.9 percent and 7.7 percent respectively. Most orange juice produced in Brazil is exported. In 2010/11, 96.4 percent of total subject shipments were exports, and *** percent of Citrovita’s shipments were exports. Most shipments of subject certain orange juice are exports to the European Union, comprising 70.4 percent of total subject shipments in 2010/11. Almost all NFCOJ is exported to the United States (26.9 percent of all shipments) and the European Union (72.6 percent of all shipments) in 2010/11. While the largest market for FCOJM is also the European Union (69.9 percent of all
11 In addition, one Brazilian extractor/processor of nonsubject FCOJM, Citrovita, provided a questionnaire response.
12 Coverage is calculated based on responding Brazilian processor/extractor’s reported production in 2010/11 (1.60 billion gallons) versus USDA’s reported production for Brazil in 2010/11 (1.77 billion gallons).
13 “Citrosuco and Citrovita, Two Brazilian OJ Giants, Merge,” The Ledger, May 17, 2010, found at http://www.theledger.com/article/20100517/NEWS/5175026/1001/news36, retrieved on December 6, 2010.
14 FCM’s prehearing brief, p. 12 and exh. 1. 15 Hearing transcript, p. 216 (Kalik), and Respondents’ post-hearing brief, p. 13.

IV-11
shipments), Asia is the second largest market, comprising 18.7 percent of total shipments in 2010/11, up 4.7 percentage points from 2005/06.
Table IV-5 FCOJM (subject): Brazilian capacity, production, shipments, and inventories, crop years 2005/06- 2010/11
Item
Crop year (July - June)
2005/06 2006/07 2007/08 2008/09 2009/10 2010/11
Quantity (1,000 pounds SE)
Capacity 1,735,026 1,829,973 1,739,370 1,614,282 1,667,732 1,659,627
Production 1,215,160 1,267,440 1,208,682 1,010,629 1,105,337 933,206
End of period inventories 243,660 215,659 373,396 334,139 295,760 157,784
Shipments: Internal consumption
***
***
***
***
***
***
Commercial home market shipments
***
***
***
***
***
***
Exports: United States
165,807
228,009
226,055
100,042
102,366
46,243
European Union 871,337 863,701 665,097 748,109 817,072 748,614
Asia 182,821 160,576 106,770 148,684 161,788 200,124
All other markets 39,876 23,844 19,228 23,440 26,807 28,790
Total exports 1,259,841 1,276,130 1,017,150 1,020,275 1,108,033 1,023,771
Total shipments *** *** *** *** *** ***
Value ($1,000)
Commercial shipments: Home market
***
***
***
***
***
***
Exports to-- United States
113,477
254,288
212,935
99,074
88,665
55,304
European Union 522,924 820,654 761,367 738,379 644,083 962,019
Asia 124,610 177,549 128,928 152,627 138,304 256,983
All other markets 24,400 29,560 24,400 24,723 23,645 35,313
Total exports 785,411 1,282,051 1,127,630 1,014,804 894,697 1,309,618
Total shipments *** *** *** *** *** ***
Table continued on next page.

IV-12
Table IV-5--Continued FCOJM (subject): Brazilian capacity, production, shipments, and inventories, crop years 2005/06- 2010/11
Item
Crop year (July - June)
2005/06 2006/07 2007/08 2008/09 2009/10 2010/11
Average unit value (dollars per pound SE)
Commercial shipments: Home market
***
***
***
***
***
***
Exports to-- United States
0.68
1.12
0.94
0.99
0.87
1.20
European Union 0.60 0.95 1.14 0.99 0.79 1.29
Asia 0.68 1.11 1.21 1.03 0.85 1.28
All other markets 0.61 1.24 1.27 1.05 0.88 1.23
Total exports 0.62 1.00 1.11 0.99 0.81 1.28
Total shipments *** *** *** *** *** ***
Ratios and shares (percent)
Capacity utilization 70.0 69.3 69.5 62.6 66.3 56.2
Inventories to production 20.1 17.0 30.9 33.1 26.8 16.9
Inventories to total shipments
18.7
16.6
35.5
31.6
25.7
14.7
Share of total quantity of: Internal consumption
***
***
***
***
***
***
Home market *** *** *** *** *** ***
Exports to-- United States
12.7
17.6
21.5
9.5
8.9
4.3
European Union 66.9 66.7 63.3 71.3 71.4 69.9
Asia 14.0 12.4 10.2 14.1 14.1 18.7
All other markets 3.1 1.8 1.8 2.2 2.3 2.7
Total exports 96.7 98.5 96.8 97.2 96.9 95.6
Note.–Because of rounding, figures may not add to the totals shown. *** reported quantity values in Brazilian reals. Commission staff used the following BRL to USD conversion for years 2005/06 to 2010/11: 0.4674; 0.5213; 0.6227; 0.5056; 0.5586; and 0.6264.
Source: Compiled from data submitted in response to Commission questionnaires.

IV-13
Table IV-6 NFCOJ: Brazilian capacity, production, shipments, and inventories, crop years 2005/06-2010/11
Item
Crop year (July - June)
2005/06 2006/07 2007/08 2008/09 2009/10 2010/11
Quantity (1,000 pounds SE)
Capacity 219,672 261,069 325,469 351,858 360,107 396,163
Production 136,582 174,093 247,418 254,672 243,565 244,290
End of period inventories 23,776 26,175 34,612 40,716 48,035 34,232
Shipments: Internal consumption
***
***
***
***
***
***
Commercial home market shipments
***
***
***
***
***
***
Exports: United States
27,226
32,570
74,748
65,408
56,636
69,523
European Union 109,289 137,526 162,608 178,243 175,972 187,481
Asia 971 1,200 1,239 989 908 419
All other markets 213 144 152 164 118 39
Total exports 137,699 171,440 238,747 244,804 233,634 257,462
Total shipments *** *** *** *** *** ***
Value ($1,000)
Commercial shipments: Home market
***
***
***
***
***
***
Exports to-- United States
23,684
26,821
77,583
80,237
83,795
96,963
European Union 117,967 155,112 188,403 229,320 231,007 275,555
Asia 1,308 1,856 2,301 1,930 1,617 795
All other markets 321 326 374 464 319 120
Total exports 143,280 184,116 268,661 311,951 316,738 373,433
Total shipments *** *** *** *** *** ***
Table continued on next page.

IV-14
Table IV-6--Continued NFCOJ: Brazilian capacity, production, shipments, and inventories, crop years 2005/06-2010/11
Item
Crop year (July - June)
2005/06 2006/07 2007/08 2008/09 2009/10 2010/11
Average unit value (dollars per pound SE)
Commercial shipments: Home market
***
***
***
***
***
***
Exports to-- United States
0.87
0.82
1.04
1.23
1.48
1.39
European Union 1.08 1.13 1.16 1.29 1.31 1.47
Asia 1.35 1.55 1.86 1.95 1.78 1.90
All other markets 1.51 2.27 2.46 2.83 2.70 3.08
Total exports 1.04 1.07 1.13 1.27 1.36 1.45
Total shipments *** *** *** *** *** ***
Ratios and shares (percent)
Capacity utilization 62.2 66.7 76.0 72.4 67.6 61.7
Inventories to production 17.4 15.0 14.0 16.0 19.7 14.0
Inventories to total shipments
17.2
15.2
14.5
16.4
20.3
13.3
Share of total quantity of: Internal consumption
***
***
***
***
***
***
Home market *** *** *** *** *** ***
Exports to-- United States
19.7
19.0
31.3
26.3
24.0
26.9
European Union 79.2 80.1 68.0 71.7 74.5 72.6
Asia 0.7 0.7 0.5 0.4 0.4 0.2
All other markets 0.2 0.1 0.1 0.1 0.0 0.0
Total exports 99.8 99.9 99.9 98.5 98.9 99.8
Note.–Because of rounding, figures may not add to the totals shown. *** reported quantity values in Brazilian reals. Commission staff used the following BRL to USD conversion for years 2005/06 to 2010/11: 0.4674; 0.5213; 0.6227; 0.5056; 0.5586; and 0.6264.
Source: Compiled from data submitted in response to Commission questionnaires.

IV-15
Table IV-7 Certain orange juice (subject): Brazilian capacity, production, shipments, and inventories, crop years 2005/06-2010/11
Item
Crop year (July - June)
2005/06 2006/07 2007/08 2008/09 2009/10 2010/11
Quantity (1,000 pounds SE)
Capacity 1,954,698 2,091,042 2,064,839 1,966,140 2,027,839 2,055,790
Production 1,351,742 1,441,533 1,456,100 1,265,301 1,348,902 1,177,496
End of period inventories 267,436 241,834 408,008 374,855 343,795 192,016
Shipments: Internal consumption
***
***
***
***
***
***
Commercial home market shipments
***
***
***
***
***
***
Exports: United States
193,033
260,579
300,803
165,450
159,002
115,766
European Union 980,626 1,001,227 827,705 926,352 993,044 936,095
Asia 183,792 161,776 108,009 149,673 162,696 200,543
All other markets 40,089 23,988 19,380 23,604 26,925 28,829
Total exports 1,397,540 1,447,570 1,255,897 1,265,079 1,341,667 1,281,233
Total shipments *** *** *** *** *** ***
Value ($1,000)
Commercial shipments: Home market
***
***
***
***
***
***
Exports to-- United States
137,161
281,109
290,518
179,311
172,460
152,267
European Union 640,892 975,766 949,770 967,699 875,090 1,237,574
Asia 125,917 179,406 131,229 154,557 139,921 257,778
All other markets 24,721 29,886 24,775 25,187 23,964 35,433
Total exports 928,691 1,466,166 1,396,291 1,326,755 1,211,435 1,683,051
Total shipments *** *** *** *** *** ***
Table continued on next page.

IV-16
Table IV-7--Continued Certain orange juice (subject): Brazilian capacity, production, shipments, and inventories, crop years 2005/06-2010/11
Item
Crop year (July - June)
2005/06 2006/07 2007/08 2008/09 2009/10 2010/11
Average unit value (dollars per pound SE)
Commercial shipments: Home market
***
***
***
***
***
***
Exports to-- United States
0.71
1.08
0.97
1.08
1.08
1.32
European Union 0.65 0.97 1.15 1.04 0.88 1.32
Asia 0.69 1.11 1.21 1.03 0.86 1.29
All other markets 0.62 1.25 1.28 1.07 0.89 1.23
Total exports 0.66 1.01 1.11 1.05 0.90 1.31
Total shipments *** *** *** *** *** ***
Ratios and shares (percent)
Capacity utilization 69.2 68.9 70.5 64.4 66.5 57.3
Inventories to production 19.8 16.8 28.0 29.6 25.5 16.3
Inventories to total shipments
18.6
16.5
31.6
28.9
24.9
14.4
Share of total quantity of: Internal consumption
***
***
***
***
***
***
Home market *** *** *** *** *** ***
Exports to-- United States
13.4
17.8
23.3
12.7
11.5
8.7
European Union 68.1 68.2 64.2 71.3 72.0 70.4
Asia 12.8 11.0 8.4 11.5 11.8 15.1
All other markets 2.8 1.6 1.5 1.8 2.0 2.2
Total exports 97.0 98.7 97.4 97.4 97.2 96.4
Note.–Because of rounding, figures may not add to the totals shown. *** reported quantity values in Brazilian reals. Commission staff used the following BRL to USD conversion for years 2005/06 to 2010/11: 0.4674; 0.5213; 0.6227; 0.5056; 0.5586; and 0.6264.
Source: Compiled from data submitted in response to Commission questionnaires.
IV-17
Table IV-8 FCOJM (nonsubject): Citrovita’s capacity, production, shipments, and inventories, crop years 2005/06-2010/11
* * * * * * *
The Commission asked Brazilian extractor/processors to report the constraints on their capacity to
produce certain orange juice. All extractors/processors stated that the availability of fruit was a major constraint on capacity. One firm also stated that production is constrained due to its plants’ capacity and fruit conditions.
One Brazilian extractor/processors reported that it is able to switch production between certain orange juice and other products. *** facilities can be modified to produce lemon juice and lemon oils; however, production of lemon juice is minimal and the firm does not expect that it would change the volume of orange juice it produces in response to changes in the price of lemon juice or lemon oil.
GLOBAL MARKET
Production
World production of orange juice in 2010/11 was 3.3 billion gallons, down by 4.6 percent since 2006/07. Brazil and the United States are the largest orange juice producing countries, and together made up 90.2 percent of the world’s production in 2010/11, with Brazil producing 62.3 percent and the United States, 27.9 percent. Table IV-9 presents world production and exports of orange juice by country.

IV-18
Table IV-9 Orange juice: World production and exports, by country, crop years 2005/06-2010/11
Country
Crop Year
2005/06 2006/07 2007/08 2008/09 2009/10 2010/11
Production (million gallons SSE)
Brazil 2,024.5 2,080.7 1,848.7 1,789.7 1,546.5 2,024.5
EU-27 (1) 240.6 232.1 138.6 120.0 103.0
Mexico 79.4 98.4 143.4 147.6 115.3 119.5
United States 988.0 891.0 1,167.0 1,070.1 850.5 906.8
All others 257.0 99.4 103.6 124.1 100.1 98.1
World total (1) 3,410.2 3,494.8 3,270.1 2,732.5 3,251.9
Shares of production (percent)
Brazil 60.5 61.0 52.9 54.7 56.6 62.3
EU-27 (1) 7.1 6.6 4.2 4.4 3.2
Mexico 2.4 2.9 4.1 4.5 4.2 3.7
United States 29.5 26.1 33.4 32.7 31.1 27.9
All others 7.7 2.9 3.0 3.8 3.7 3.0
World total (1) 100.0 100.0 100.0 100.0 100.0
Exports (million gallons SSE)
Brazil 1,989.3 1,824.8 1,792.5 1,803.7 1,673.0 1,743.3
United States 137.9 122.7 137.3 126.2 148.4 217.9
Mexico 74.5 91.0 134.3 138.9 106.8 111.1
EU-27 (1) 65.4 62.4 56.5 63.8 63.3
All others 124.7 56.6 56.5 65.1 58.1 64.0
World total (1) 2,160.5 2,183.0 2,190.4 2,050.1 2,199.5
Share of exports (percent)
Brazil 85.5 84.5 82.1 82.3 81.6 79.3
United States 5.9 5.7 6.3 5.8 7.2 9.9
Mexico 3.2 4.2 6.2 6.3 5.2 5.0
EU-27 (1) 3.0 2.9 2.6 3.1 2.9
All others 5.4 2.6 2.6 3.0 2.8 2.9
World total (1) 100.0 100.0 100.0 100.0 100.0 1 Not available.
Source: USDA, FAS, PS&D Online database (accessed December 12, 2011).
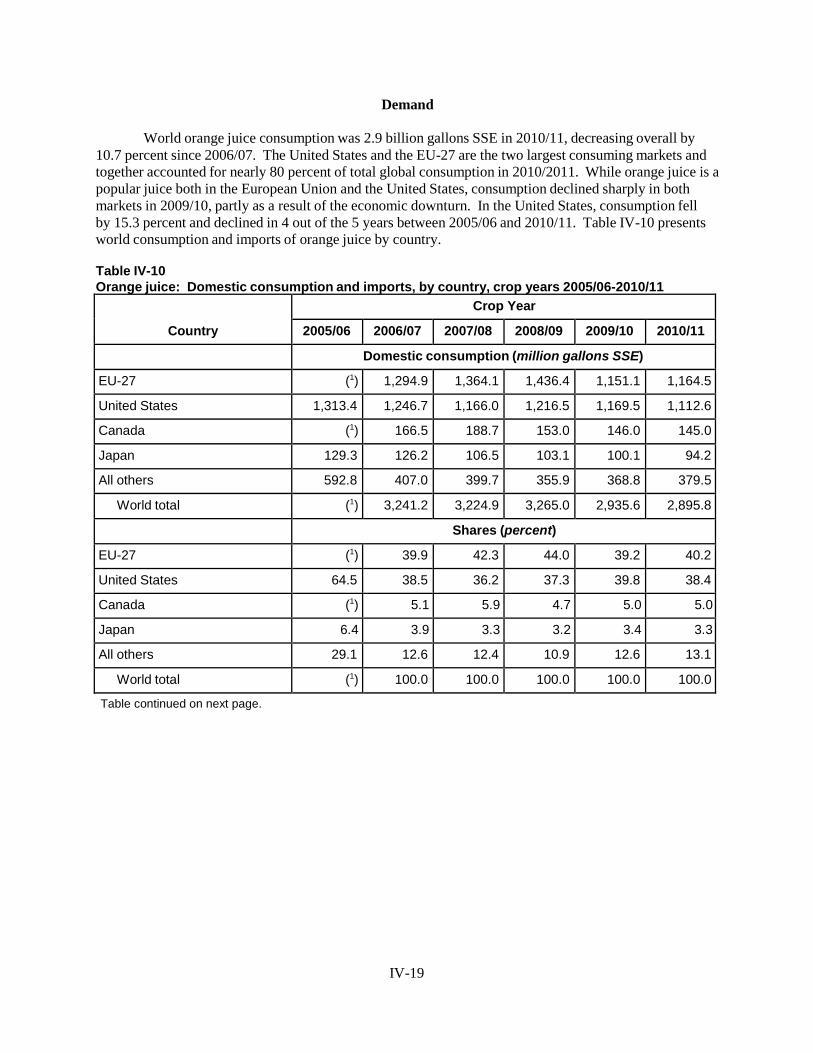
IV-19
Demand
World orange juice consumption was 2.9 billion gallons SSE in 2010/11, decreasing overall by 10.7 percent since 2006/07. The United States and the EU-27 are the two largest consuming markets and together accounted for nearly 80 percent of total global consumption in 2010/2011. While orange juice is a popular juice both in the European Union and the United States, consumption declined sharply in both markets in 2009/10, partly as a result of the economic downturn. In the United States, consumption fell by 15.3 percent and declined in 4 out of the 5 years between 2005/06 and 2010/11. Table IV-10 presents world consumption and imports of orange juice by country.
Table IV-10 Orange juice: Domestic consumption and imports, by country, crop years 2005/06-2010/11
Country
Crop Year
2005/06 2006/07 2007/08 2008/09 2009/10 2010/11
Domestic consumption (million gallons SSE)
EU-27 (1) 1,294.9 1,364.1 1,436.4 1,151.1 1,164.5
United States 1,313.4 1,246.7 1,166.0 1,216.5 1,169.5 1,112.6
Canada (1) 166.5 188.7 153.0 146.0 145.0
Japan 129.3 126.2 106.5 103.1 100.1 94.2
All others 592.8 407.0 399.7 355.9 368.8 379.5
World total (1) 3,241.2 3,224.9 3,265.0 2,935.6 2,895.8
Shares (percent)
EU-27 (1) 39.9 42.3 44.0 39.2 40.2
United States 64.5 38.5 36.2 37.3 39.8 38.4
Canada (1) 5.1 5.9 4.7 5.0 5.0
Japan 6.4 3.9 3.3 3.2 3.4 3.3
All others 29.1 12.6 12.4 10.9 12.6 13.1
World total (1) 100.0 100.0 100.0 100.0 100.0
Table continued on next page.

IV-20
Table IV-10-Continued Orange juice: Domestic consumption and imports, by country, crop years 2005/06-2010/11
Country
Crop Year
2005/06 2006/07 2007/08 2008/09 2009/10 2010/11
Imports (million gallons SSE)
EU-27 (1) 1,063.4 1,201.4 1,354.3 1,094.9 1,124.7
United States 299.0 399.0 409.9 320.0 331.1 267.1
Canada (1) 170.1 194.0 157.5 147.6 147.6
Japan 127.9 126.2 96.6 105.9 90.3 94.2
All others 370.7 312.5 290.8 241.5 277.2 265.1
World total (1) 2,071.1 2,192.7 2,179.3 1,941.1 1,898.7
Share of imports (percent)
EU-27 (1) 51.3 54.8 62.1 56.4 59.2
United States 37.5 19.3 18.7 14.7 17.1 14.1
Canada (1) 8.2 8.8 7.2 7.6 7.8
Japan 16.0 6.1 4.4 4.9 4.6 5.0
All others 46.5 15.1 13.3 11.1 14.3 14.0
World total (1) 100.0 100.0 100.0 100.0 100.0 1 Not available.
Source: USDA, FAS, PS&D Online database (accessed December 12, 2011).
The Florida Department of Citrus noted that there are four factors that are currently influencing
global demand for orange juice: economic stability and recovery, new markets and population growth, consumer perceptions and attitudes, and availability and pricing. It further noted that “After expanding for many years until the first decade of the 21st century, the world OJ situation has leveled and declined in recent years due to a combination of factors: availability issues caused by disease pressure and weather events, economic stagnation especially in developed economies, advent of competitive and substitute products.”16 The EU-27 surpassed the United States as the largest consumer of orange juice in the world in 2008. Consumption in the EU decreased from just over 1.2 billion gallons single-strength equivalent (“SSE”) in 2005 to 1.1 billion gallons SSE in 2006, before increasing irregularly to 1.2 billion gallons SSE again. China’s consumption has been nearly level at approximately 100 million gallons SSE since 2006. Consumption in the rest of the world increased from approximately 400 million gallons SSE to approximately 600 million gallons SSE in 2007, but has since decreased to approximately 500 million gallons SSE.17
16 World OJ Situation: Florida Growers’ Role in Future Opportunities, presented at the Florida Citrus Industry 7th
Annual Meeting, Robert Norberg, Florida Department of Citrus, June 2011, and submitted in *** extractor/processor questionnaire response.
17 Ibid.
IV-21
Responses by market participants regarding demand outside the United States varied considerably. Three of 6 responding extractor/processors, 3 of 9 responding importers, 1 of 4 of foreign producers, and 5 of 12 responding purchasers reported that demand outside the United States for orange juice has increased since October 1, 2005. One extractor/processor, one foreign producer, and three purchasers noted no change in demand. Two extractor/processors, one importer, and one purchaser noted decreasing demand outside the United States. Five importers, two foreign producers, and three purchasers reported fluctuating demand for orange juice since October 1, 2005. Market participants noted that prices of raw materials and prices relative to alternative products have decreased demand and consumption, although increased market access and overall growth in emerging markets may be increasing demand worldwide, particularly in Eastern Europe and China.18 Despite having noted decreasing demand trends due to an increasing number of competing beverages, extractor/processor *** anticipates increased consumption trends in the U.S. and the world as availability of orange juice “returns to more normal levels due to production increases in the U.S. and Brazil.”
The majority of market participants anticipate demand to fluctuate through 2012/13, as noted by 1 of 7 responding extractor/processors, 7 of 10 responding importers, 2 of 4 foreign producers, and 8 of 14 responding purchasers. Three of 7 extractor/processors, 1 of 4 foreign producers, and 3 of 14 responding purchasers do not anticipate any change to demand outside the United States. One responding extractor/ processor, 2 of 10 responding importers, 1 of 4 foreign producers, and 2 of 14 responding purchasers anticipate increased demand through 2012-13, and the remaining market participatns expect decreasing demand outside the United States.
Additionally, foreign producers were also asked how demand had changed in Brazil. One noted increasing demand, two stated that there has been no change, and one reported fluctuating demand. They anticipate the same demand trends for 2012-13.
18 *** purchaser questionnaire responses.


V-1
PART V: PRICING AND RELATED INFORMATION
FACTORS AFFECTING PRICES
Raw Materials
Raw materials, most of which are juice oranges, averaged 83.8 percent of the cost of goods sold of certain orange juice for domestic extractor/processors (excluding toll production) since 2005/06. Orange prices fluctuated between crop year 2005/06 and crop year 2009/10, but increased overall by 14 percent (figure V-1).1
The Florida and São Paulo orange crops also fluctuated during the same period, as noted in Part II, with the Florida orange crop falling by 9.5 percent and the Brazilian orange crop increasing by 15.7 percent. Current prices for Florida oranges to growers are between $1.60 and $2.00 per pound solids equivalent, and multi-year contracts have floors of $1.35 to $1.65 per pound.2
Figure V -1 C ertain orange juice: S eason average delivered-in prices for oranges, average prices for FC O JM and N FC O J
Sources: USDA, NASS, Florida Agricultural Statistics Service, Florida Citrus Statistics, 2009-2010 and previous releases, and Tables V-1-V-2.
1 Final data for 2010/2011 are not yet available. Price are “delivered-in” prices, w hich is the price paid by processors for fruit, including harvesting and transportation to the plant.
2 H earing transcript, p. 152 (Thom pson).

V-2
Exchange Rates
Petitioners stated that, with the exception of a period of sharp depreciation due to the global economic downturn and within the last few months, the Brazilian real has been appreciating with respect to the U.S. dollar since before the start of the period of review (see Figure V-2).3
They argued that depreciation would encourage increased Brazilian exports to the United States and possibly induce diversion away from the EU and to the United States. Respondents noted that orange juice is sold on a dollar basis worldwide.4
Also, they argued, the strengthening of the dollar in the last six months has not resulted in a weak currency; in fact, the Brazilian real has been stronger over the past six years than during the final investigation.5
Figure V -2 N om inal and real exchange rate betw een the U .S . dollar and the B razilian real, m onthly, O ctober 2005-D ecem ber 2011
Source: St. Louis Federal Reserve Bank exchange rate database (FRED) and www.inflation.eu.
U.S. Inland Transportation Costs
U.S. inland transportation costs for certain orange juice generally ranged between 1 and 6 percent for both U.S. extractor/processors and importers.6
3 D om estic interested party Florida C itrus M utual’s prehearing brief, pp. 22-23. 4 H earing transcript, p. 197 (Freem an). 5 Ibid., p. 198 (D unn). 6 ***.

V-3
Futures Market
The futures market for FCOJ plays a role in determining pricing. As described by domestic interested parties, the futures market “provides price discovery for the players in the bulk FCOJ market. It is not a market in which there is a significant amount of delivery and taking of product. It’s relatively small compared to how much orange juice, how much concentrate is transacted between parties in the United States. In my mind, its primary role is in price discovery,”7 and “... it’s basically the only tool that we have outside of physical sales contracts to manage risk in the marketplace.”8 Additionally, Brazilian respondent interested parties noted that the futures market plays the role of “buyer and seller of last resort.”9
In the original investigation, both petitioners and respondents indicated that FCOJM prices are determined by orange juice futures prices and that U.S. inventories of certain orange juice are correlated with orange juice futures prices.10
Three firms (***) indicated that 25 to 50 percent of their sales of U.S.-produced FCOJM were delivered to the futures market, while only one firm (***) reported any import sales delivered to the futures market.11
Several responding extractor/processors and importers indicated that changes in inventories of certain orange juice impact the futures price for FCOJM, although one firm (***) noted that perceived and actual crop size in Florida and Brazil, rather than inventories, drive futures prices. Brazilian respondent interested parties submitted data showing that a higher preponderance of futures markets “inversions” (i.e., when the price for futures in nearby months is higher than futures in future months) occurred when reported inventories drop below a level of around 450 million gallons.12
Some firms noted that inventories of U.S. certain orange juice had declined since 2005 because of a decrease in Florida fruit production and therefore FCOJM futures prices increased. In its importer questionnaire response, *** stated that global inventories declined in 2010 and “went dry” in 2011 and that orange juice was taken out of the futures market to supply EU markets, which increased futures prices. It noted that “the price of NFCOJ impacts futures prices of FCOJM, not the other way around.” Futures prices for FCOJ (figure V-3) moved in the same direction as the price of oranges described earlier (figure V- 1).13
Domestic interested parties argued that bulk prices for orange juice are highly correlated with FCOJ futures prices, which, in turn, are influenced by imports. These futures prices, they stated, heavily
7 H earing transcript, pp. 130-131 (B ehr). 8 Ibid., p. 131 (C asper). 9 B razilian respondent interested parties posthearing brief, responses to questions from C om m issioner A ranoff, p.
4. 10 In addition, petitioners asserted that the futures price has a direct im pact on the price of N FC O J and the price of
U .S. oranges for processing. C ertain O range Juice From Brazil, Inv. N o. 731-TA-1089 (Final), U SITC Publication 33838, M arch 2006, pp. V -8-9.
11 It reported that only 1 percent of its nonsubject im port sales w ere delivered to the futures m arket. 12 B razilian respondent interested parties posthearing brief, questions by C omm issioner A ranoff, pp. 6-7. 13 U .S. FC O J futures prices are m ore highly correlated w ith dom estic pricing data than subject im port pricing data
collected in this investigation, and m ore highly correlated w ith FC O JM prices than N FC O J prices. C orrelations betw een month-end closing futures prices and FC O JM and N FC O J data collected from extractor/processors w ere 0.81 and 0.65, respectively. C orrelations betw een m onth-end closing futures prices and FC O JM and N FC O J data collected from im porters w ere 0.54 and 0.15, respectively.

V-4
Figure V -3 C ertain orange juice: C losing prices of FC O J futures contracts on the IC E (N Y B O T), O ctober 3, 2005-O ctober 31, 2011
Note.–The New York Board of Trade (NYBOT) is a wholly-owned subsidiary of Intercontinental Exchange (ICE) and was renamed ICE Futures US in September 2007.
Source: ICE Futures US, https://www.theice.com/FuturesUSReportCenter.shtm, accessed December 8, 2011.
influence the price received by growers.14
Respondent interested party Coca-Cola argued the opposite: “the price of orange juice is driven by the price of Florida oranges, not futures.”15
As of January 2012, futures prices for oranges were fluctuating significantly, and had reached record levels in early- to mid-January. Factors noted by parties affecting this level of pricing include the fungicide carbendazim being found in imports of orange juice from Brazil (which could halt imports from Brazil), two freezes in Florida and one in California, and a reduction in the USDA Florida orange production estimate.16
PRICING PRACTICES
Pricing Methods
Firms generally determine prices based on both contracts and transaction-by-transaction negotiations. All seven responding extractor/processors use contracts to determine prices, six also use transaction-by-transaction negotiations, and two also use set price lists. *** also reported futures market prices plus margins. Similarly, seven of eight responding importers use transaction-by-transaction negotiations, six use contracts, one uses set price lists, and one reported basing prices on futures market prices.
14 H earing transcript, p. 12 (M cG rath), p. 35 (B ehr), and p. 120 (W arlick). 15 Ibid., pp. 173 (H orrisberger). 16 Ibid, p. 137 (W arlick), and p. 164 (Freem an).

V-5
Most extractor/processors (five of seven) and importers (five of eight) indicated that a majority of their sales of certain orange juice are made on either a short-term contract or a spot basis. The exceptions among extractor/processors were ***. Other extractor/processors reporting at least some long-term contract sales were ***. Three of eight importers *** reported that 70 to 100 percent of their import sales were on a long-term contract basis and three reported that 2 to 25 percent of sales were on a long-term contract basis.
Most extractor/processors (5 of 7) reported that their short-term contracts were for one year.17
Long-term contracts ranged from one year to 20 years. Importers’ short-term contracts ranged from 3 months to one year and their long-term contracts were from 1 to 5 years. Extractors/processors and importers generally reported that they do not renegotiate prices during the contract period, though prices can rise and fall via price indexing included in contracts. No firms reported having meet-or-release provisions.
Parties at the hearing noted a movement in the orange juice industry toward long-term contracts to ensure adequate supplies of oranges for purchasers and a promise of a steady stream of income for the orange growers.18
These contracts typically contain a floor price and a “rise,” which is based on a number of things which could include spot prices, the futures market, and import prices.19
Contracts also contain a ceiling price, or cap.20
Domestic interested parities argued that some of these contracts are relatively old and the floors are probably below the cost of production.21
A representative from extractor/ processor Cutrale USA noted that its long-term contracts, which are generally three years in length, have a floor price of $1.35 to $1.65 per pound solids equivalent.22
A representative from respondent interested party Coca-Cola testified that it needs to be able to keep the growers in business to maintain consistent supply, so three to four years ago, it spoke with a cooperative to determine growing costs, set a floor above that the first year, and increase the floor in future years. Also, Coca-Cola is reportedly working with a major grower to develop a $1 billion, 20-year contract to increase the amount of Florida plantings.23
Sales Terms and Discounts
Firms reported that their typical sales terms were net 10 to 30 days. All responding
extractor/processors and most responding importers reported that their sales were typically on a f.o.b. basis.
Extractor/processors generally reported no discount policies, with the exception of ***, which reported earned income rebates. In addition, two extractor/processors reported discounts for early payments. Among importers, four do not offer discounts, one offers quantity discounts, one offers annual volume discounts, and two offer discounts for early payment.
17 O ne firm reported short-term contracts of 9 m onths and one firm reported short-term contracts ranging from 6 to 12 m onths.
18 H earing transcript, p. 15 (D unn). 19 H earing transcript, pp. 106 and 118 (M cG rath). 20 Ibid., p. 118 (M cG rath). 21 Ibid., p. 146 (B ehr). 22 Ibid., pp. 152-153 (Thom pson). 23 Ibid., pp. 177-178 (H orrisberger).
V-6
Price Leadership
Four purchasers identified Citrovita, Citrosuco, Cutrale, and Louis Dreyfus as price leaders in the market for certain orange juice. Purchaser *** stated that Citrosuco, Cutrale, and Louis Dreyfus have a supply base in Brazil which can “influence the futures which then influences price.” Purchaser *** noted that all product is priced off the futures market, but Louis Dreyfus and Cutrale are the price leaders for a markup over the futures price. Purchaser *** noted that it considers the price leaders to be the fruit growers rather than the orange juice sellers. In the hearing, a representative from Coca-Cola testified that for the residual volumes it purchases from Brazil, Coca-Cola pays for Brazilian orange juice based on, and greater than, its Florida prices.24
Nonsubject Country Price Comparisons
Brazilian respondent interested parties argued that prices in European markets are generally
higher than those in the United States.25 Domestic interested parties stated that which market has higher
prices depends on the product and fluctuates monthly. Domestic interested parties’ economist testified that she believes NFCOJ prices are currently higher in the EU, but FCOJ prices are currently higher in the United States.26
PRICE DATA
The Commission requested U.S. extractor/processors and importers of certain orange juice to
provide monthly data for the total quantity and f.o.b. value of FCOJM and NFCOJ that were shipped to unrelated customers in the U.S. market during October 2005 to September 2011. The products for which pricing data were requested are as follows:
Product 1.–Frozen concentrated orange juice for manufacturing (FCOJM) with a brix level
between 59 and 67 degrees inclusive, with standard pulp levels, not organic
Product 2.– Single strength, not from concentrate, pasteurized orange juice (NFCOJ), not organic
Six U.S. extractor/processors and two importers of certain orange juice from Brazil provided
usable pricing data for sales of the requested products, although not all firms reported pricing for all products for all months. By quantity, quarterly pricing data accounted for approximately 88 percent of U.S. extractor/processors’ shipments of FCOJM and 71 percent of U.S. extractor/processors’ shipments of NFCOJ, and approximately 55 percent of subject imports from Brazil of FCOJM27 and 60 percent of subject imports from Brazil of NFCOJ during October 2005-September 2011. The pricing data are presented in tables V-1 and V-2 and figures V-4 to V-5.28
24 Ibid., p. 179 (H orrisberger). 25 B razilian respondent interested parties’ prehearing brief, pp. 39-40. 26 H earing transcript, p. 88 (W arlick). 27 Subject im ports of FC O JM only include FC O J that is intended for m anufacturing and includes im ports
produced and/or exported by C argill C itrus Lim itada, C oinbra-Frutesp (SA ), Fischer S.A ., M ontecitrus Trading S.A ., and Sucocitrico C utrale, S.A .
28 The pricing data for B razil differ from those reported in the prehearing staff report. ***. E-m ail from ***.

V-7
Price Trends
Prices of domestic products 1 and 2 generally increased between October 2005 and mid-2007, declined through the end of 2008, and then increased through September 2011. Prices of imported subject Brazilian products 1 and two also generally increased through early- to mid-2007, but after a few months of decline, remained relatively stable through early- to mid-2010. Beginning in mid-2010, prices for imported subject Brazilian product 1 have been generally increasing, while prices for product 2 increased until February 2011, decreased through July 2011, and were higher in August and September 2011 than in July 2011.
The weighted-average sales prices per pound solids equivalent (SE) of the U.S.-produced and Brazilian product 1 (FCOJM) increased by *** and *** percent, respectively, between October 2005 and September 2011, while weighted-average sales prices of the U.S.-produced and Brazilian product 2 (NFCOJ) increased by *** percent and *** percent, respectively, during the same period (table V-3). Price trends do not display any discernable pattern of monthly seasonality (figures E-1 and E-2 in Appendix E). Quantities of domestic product 1 (FCOJM) were lowest at the end of the Florida crop year, while subject import quantities of product 2 (NFCOJ) were lowest in March through July (figures E-3 and E-4 in Appendix E). Quantity trends were not as pronounced for domestic product 2 or subject imported product 1.

V-8
Table V -1 C ertain orange juice: W eighted-average f.o.b. prices and quantities of dom estic and im ported product 1,1 and m argins of underselling/(overselling), by m onth, O ctober 2005- S eptem ber 2011
Period
United States Brazil (subject)
Price
(per pound SE)
Quantity (thousand
pounds SE)
Price
(per pound SE)
Quantity (thousand
pounds SE)
Margin
(percent)
2005/06: October
$1.16
19,954
$***
***
***
November 1.20 68,546 *** *** ***
December 1.23 33,668 *** *** ***
January 1.27 45,808 *** *** ***
February 1.31 45,925 *** *** ***
March 1.34 40,879 *** *** ***
April 1.39 17,125 *** *** ***
May 1.42 16,509 *** *** ***
June 1.47 17,843 *** *** ***
July 1.49 15,182 *** *** ***
August 1.52 20,847 *** *** ***
September 1.64 17,889 *** *** ***
2006/07: October
1.62
31,261
***
***
***
November 1.84 31,722 *** *** ***
December 1.80 24,499 *** *** ***
January 1.97 26,053 *** *** ***
February 2.07 22,780 *** *** ***
March 2.07 21,955 *** *** ***
April 2.17 20,815 *** *** ***
May 2.01 23,531 *** *** ***
June 1.99 19,428 *** *** ***
July *** *** *** *** ***
August 1.80 13,090 *** *** ***
September 1.53 13,567 *** *** *** Table continued on next page.

V-9
Table V -1--C ontinued C ertain orange juice: W eighted-average f.o.b. prices and quantities of dom estic and im ported product 1,1 and m argins of underselling/(overselling), by m onth, O ctober 2005- S eptem ber 2011
Period
United States Brazil (subject)
Price
(per pound SE)
Quantity (thousand
pounds SE)
Price
(per pound SE)
Quantity (thousand
pounds SE)
Margin
(percent)
2007/08: October
$1.90
19,761
$***
***
***
November 1.60 11,843 *** *** ***
December 1.74 17,829 *** *** ***
January 1.65 27,296 *** *** ***
February 1.62 15,726 *** *** ***
March 1.68 15,084 *** *** ***
April 1.53 17,269 *** *** ***
May 1.38 25,777 *** *** ***
June 1.42 15,140 *** *** ***
July 1.48 17,322 *** *** ***
August 1.21 19,055 *** *** ***
September 1.12 44,907 *** *** ***
2008/09: October
1.17
21,270
***
***
***
November 1.07 23,264 *** *** ***
December 1.26 20,972 *** *** ***
January 1.06 29,313 *** *** ***
February 0.97 24,374 *** *** ***
March 0.99 28,535 *** *** ***
April 1.00 29,278 *** *** ***
May 1.01 35,393 *** *** ***
June 1.01 25,542 *** *** ***
July 1.02 21,759 *** *** ***
August 1.08 15,646 *** *** ***
September 1.20 30,472 *** *** *** Table continued on next page.

V-10
Table V -1--C ontinued C ertain orange juice: W eighted-average f.o.b. prices and quantities of dom estic and im ported product 1,1 and m argins of underselling/(overselling), by m onth, O ctober 2005- S eptem ber 2011
Period
United States Brazil (subject)
Price
(per pound SE)
Quantity (thousand
pounds SE)
Price
(per pound SE)
Quantity (thousand
pounds SE)
Margin
(percent)
2009/10: October
$1.25
36,719
$***
***
***
November 1.20 23,952 *** *** ***
December 1.41 32,656 *** *** ***
January 1.44 35,320 *** *** ***
February 1.49 21,799 *** *** ***
March 1.52 37,465 *** *** ***
April 1.52 27,948 *** *** ***
May 1.49 42,887 *** *** ***
June 1.54 20,374 *** *** ***
July 1.50 26,728 *** *** ***
August 1.53 17,982 *** *** ***
September 1.59 19,454 -- 0 --
2010/11: October
1.56
18,381
***
***
***
November 1.59 39,061 *** *** ***
December 1.64 25,556 *** *** ***
January 1.78 39,691 *** *** ***
February 1.92 32,738 *** *** ***
March 1.83 43,211 *** *** ***
April 1.76 23,338 *** *** ***
May 1.74 29,590 -- 0 --
June 1.86 16,967 -- 0 --
July 1.96 14,092 *** *** ***
August 1.97 14,514 *** *** ***
September 1.92 15,228 *** *** *** 1 Frozen concentrated orange juice for manufacturing (FCOJM) with a Brix level between 59 and 67 degrees
inclusive, with standard pulp levels, not organic. Source: Compiled from data submitted in response to Commission questionnaires.

V-11
Table V -2 C ertain orange juice: W eighted-average f.o.b. prices and quantities of dom estic and im ported product 2,1 and m argins of underselling/(overselling), by m onth, O ctober 2005- S eptem ber 2011
Period
United States Brazil
Price
(per pound SE)
Quantity (thousand
pounds SE)
Price
(per pound SE)
Quantity (thousand
pounds SE)
Margin
(percent)
2005/06: October
$***
***
$***
***
***
November *** *** *** *** ***
December *** *** *** *** ***
January *** *** *** *** ***
February *** *** *** *** ***
March *** *** *** *** ***
April *** *** *** *** ***
May *** *** *** *** ***
June *** *** *** *** ***
July *** *** *** *** ***
August *** *** *** *** ***
September *** *** *** *** ***
2006/07: October
***
***
***
***
***
November *** *** *** *** ***
December *** *** *** *** ***
January *** *** *** *** ***
February *** *** *** *** ***
March *** *** *** *** ***
April *** *** *** *** ***
May *** *** *** *** ***
June *** *** *** *** ***
July *** *** *** *** ***
August *** *** *** *** ***
September *** *** *** *** *** Table continued on next page.

V-12
Table V -2--C ontinued C ertain orange juice: W eighted-average f.o.b. prices and quantities of dom estic and im ported product 2,1 and m argins of underselling/(overselling), by m onth, O ctober 2005- S eptem ber 2011
Period
United States Brazil
Price
(per pound SE)
Quantity (thousand
pounds SE)
Price
(per pound SE)
Quantity (thousand
pounds SE)
Margin
(percent)
2007/08: October
$***
***
$***
***
***
November *** *** *** *** ***
December *** *** *** *** ***
January *** *** *** *** ***
February *** *** *** *** ***
March *** *** *** *** ***
April *** *** *** *** ***
May *** *** *** *** ***
June *** *** *** *** ***
July *** *** *** *** ***
August *** *** *** *** ***
September *** *** *** *** ***
2008/09: October
***
***
***
***
***
November *** *** *** *** ***
December *** *** *** *** ***
January *** *** *** *** ***
February *** *** *** *** ***
March *** *** *** *** ***
April *** *** *** *** ***
May *** *** *** *** ***
June *** *** *** *** ***
July *** *** *** *** ***
August *** *** *** *** ***
September 1.59 8,883 *** *** *** Table continued on next page.

V-13
Table V -2--C ontinued C ertain orange juice: W eighted-average f.o.b. prices and quantities of dom estic and im ported product 2,1 and m argins of underselling/(overselling), by m onth, O ctober 2005- S eptem ber 2011
Period
United States Brazil
Price (per pound SE)
Quantity (pounds SE)
Price (per pound SE)
Quantity (pounds SE)
Margin (percent)
2009/10: October
$***
***
$***
***
***
November *** *** *** *** ***
December *** *** *** *** ***
January *** *** *** *** ***
February *** *** *** *** ***
March *** *** *** *** ***
April *** *** *** *** ***
May 1.88 10,625 *** *** ***
June *** *** *** *** ***
July *** *** *** *** ***
August *** *** *** *** ***
September *** *** *** *** ***
2010/11: October
***
***
***
***
***
November *** *** *** *** ***
December 1.99 6,087 *** *** ***
January 1.98 12,078 *** *** ***
February 1.85 11,242 *** *** ***
March 1.88 6,872 *** *** ***
April *** *** *** *** ***
May *** *** *** *** ***
June *** *** *** *** ***
July *** *** *** *** ***
August *** *** *** *** ***
September *** *** *** *** *** 1 Single strength, not from concentrate, pasteurized orange juice (NFCOJ), not organic.
Source: Compiled from data submitted in response to Commission questionnaires.

V-14
Figure V -4 C ertain orange juice: W eighted-average f.o.b. prices and quantities of dom estic and im ported product 1, by m onth, O ctober 2005-S eptem ber 2011
* * * * * * *
Figure V -5 C ertain orange juice: W eighted-average f.o.b. prices and quantities of dom estic and im ported product 2,1 by m onth, O ctober 2005-S eptem ber 2011
* * * * * * *
Table V -3 C ertain orange juice: S um m ary of w eighted-average f.o.b. prices for products 1 and 2 from the U nited S tates and B razil
Item N um ber of m onths
Low price (per pound S E )
H igh price (per pound S E )
C hange in price1
(percent)
P roduct 1
U nited S tates 72 $0.97 $2.17 66.0
B razil 69 1.05 2.03 80.4
P roduct 2
U nited S tates 72 1.44 2.47 55.4
B razil 72 1.51 2.48 27.5 1 Percentage change from the first month in which price data were available to the last month in which price data
were available, based on unrounded data. Source: Tables V-1 to V-2.
Price Comparisons
Overall, there were 141 price comparisons for domestic certain orange juice and imported
subject certain orange juice (table V-4). Subject imported product was priced below domestic product in 45 of 141 comparisons (32 percent). Margins of underselling averaged 8.5 percent, ranging from 0.0 percent to 23.3 percent. The subject imported product was priced above the comparable domestic product in 96 instances. Margins of overselling averaged 16.3 percent, ranging from 0.2 percent to 55.0 percent.29
Twenty-nine of the 45 instances of underselling occurred in 2005/06 and 2006/07. Patterns of underselling and overselling are displayed in figure V-5.
Most purchasers reported that prices of U.S.-produced certain orange juice and imported product from Brazil and Mexico have changed by the same amount since 2005. Nearly all of the firms that reported a change in relative prices reported that U.S. prices are now relatively higher than prices of imports from Brazil and Mexico.
29 The correlation coefficient betw een prices for dom estic products 1 and 2 their corresponding subject B razilian pricing products w ere 0.68 and 0.49, respectively. These correlation coefficients do not necessarily im ply causation and these price trends may track one another for reasons other than each other’s prices, such as m acroeconom ic trends or prices of other substitute or dow nstream goods.

Table V -4 C ertain orange juice: N um ber of quarters of underselling and (overselling) and highest and low est m argins of underselling and (overselling), by crop year and product num ber, O ctober 2005- S eptem ber 2011
Product and
country
Number of quarters of
underselling
Number of quarters of
(overselling)
Margins of underselling
Margins of (overselling)
Average (percent)
Range (percent) Average (percent)
Range (percent)
Min
Max
Min
Max
By year
2005/06
13
11
8..4
1.3
18.5
(7.5)
(1.3)
(22.1)
2006/07
16
8
8.9
0.0
17.4
(3.5)
(0.9)
(7.0)
2007/08
8
16
12.0
5.9
23.3
(15.0)
(0.4)
(32.5)
2008/09
0
24
--
--
--
(33.1)
(15.6)
(55.0)
2009/10
4
19
2.7
0.8
4.5
(12.0)
(2.4)
(28.5)
2010/11
4
18
5.7
1.6
14.4
(10.5)
(0.2)
(25.5)
By product
1
30
39
7.9
0.4
23.3
(18.2)
(0.4)
(55.0)
2
15
57
9.5
0.0
18.5
(14.9)
(0.2)
(37.4)
Total
45
96
8.5
0.0
23.3
(16.3)
(0.2)
(55.0)
1 In the original investigation, there were 46 instances of underselling and 41 instances of overselling for Brazil; the majority of instances of underselling were for nonorganic FCOJM (product 1), and the majority of instances of overselling were for nonorganic NFCOJ (product 2).
Source: Compiled from data submitted in response to Commission questionnaires.
Figure V -5 C ertain orange juice: M argins of underselling/(overselling), by m onth and product
* * * * * * *
V-15


APPENDIX A
FEDERAL REGISTER NOTICES AND THE COMMISSION’S STATEMENT ON ADEQUACY
A-1


Federal Register / Vol. 76, No. 21 / Tuesday, February 1, 2011 / Notices 5563
DEPARTMENT OF COMMERCE
International Trade Administration
Initiation of Five-Year (‘‘Sunset’’) Review
AGENCY: Import Administration, International Trade Administration, Department of Commerce. SUMMARY: In accordance with section 751(c) of the Tariff Act of 1930, as amended (‘‘the Act’’), the Department of Commerce (‘‘the Department’’) is automatically initiating a five-year review (‘‘Sunset Review’’) of the antidumping duty order listed below. The International Trade Commission (‘‘the Commission’’) is publishing concurrently with this notice its notice of Institution of Five-Year Review which covers the same order. DATES: Effective Date: February 1, 2011. FOR FURTHER INFORMATION CONTACT: The Department official identified in the Initiation of Review section below at AD/CVD Operations, Import Administration, International Trade Administration, U.S. Department of Commerce, 14th Street & Constitution Ave., NW., Washington, DC 20230. For information from the Commission contact Mary Messer, Office of Investigations, U.S. International Trade Commission at (202) 205–3193. SUPPLEMENTARY INFORMATION: Background
The Department’s procedures for the conduct of Sunset Reviews are set forth in its Procedures for Conducting Five- Year (‘‘Sunset’’) Reviews of Antidumping and Countervailing Duty Orders, 63 FR 13516 (March 20, 1998) and 70 FR 62061 (October 28, 2005). Guidance on methodological or analytical issues relevant to the Department’s conduct of Sunset Reviews is set forth in the Department’s Policy Bulletin 98.3— Policies Regarding the Conduct of Five- Year (‘‘Sunset’’) Reviews of Antidumping and Countervailing Duty Orders: Policy Bulletin, 63 FR 18871 (April 16, 1998).
Initiation of Review
In accordance with 19 CFR 351.218(c), we are initiating the Sunset Review of the following antidumping duty order:

5564 Federal Register / Vol. 76, No. 21 / Tuesday, February 1, 2011 / Notices
DOC case No. ITC case No. Country Product Department contact
A–351–840 ......................... 731–TA–1089 Brazil .................................. Orange Juice ..................... David Goldberger, (202) 482–4136.
Filing Information As a courtesy, we are making
information related to Sunset proceedings, including copies of the pertinent statute and Department’s regulations, the Department schedule for Sunset Reviews, a listing of past revocations and continuations, and current service lists, available to the public on the Department’s Internet Web site at the following address: ‘‘http://ia.ita.doc.gov/sunset/.’’ All submissions in these Sunset Reviews must be filed in accordance with the Department’s regulations regarding format, translation, service, and certification of documents. These rules can be found at 19 CFR 351.303.
Pursuant to 19 CFR 351.103(d), the Department will maintain and make available a service list for these proceedings. To facilitate the timely preparation of the service list(s), it is requested that those seeking recognition as interested parties to a proceeding contact the Department in writing within 10 days of the publication of the Notice of Initiation.
Because deadlines in Sunset Reviews can be very short, we urge interested parties to apply for access to proprietary information under administrative protective order (‘‘APO’’) immediately following publication in the Federal Register of this notice of initiation by filing a notice of intent to participate. The Department’s regulations on submission of proprietary information and eligibility to receive access to business proprietary information under APO can be found at 19 CFR 351.304– 306.
Information Required From Interested Parties
Domestic interested parties defined in section 771(9)(C), (D), (E), (F), and (G) of the Act and 19 CFR 351.102(b) wishing to participate in a Sunset Review must respond not later than 15 days after the date of publication in the Federal Register of this notice of initiation by filing a notice of intent to participate. The required contents of the notice of
If we receive an order-specific notice of intent to participate from a domestic interested party, the Department’s regulations provide that all parties wishing to participate in the Sunset Review must file complete substantive responses not later than 30 days after the date of publication in the Federal Register of this notice of initiation. The required contents of a substantive response, on an order-specific basis, are set forth at 19 CFR 351.218(d)(3). Note that certain information requirements differ for respondent and domestic parties. Also, note that the Department’s information requirements are distinct from the Commission’s information requirements. Please consult the Department’s regulations for information regarding the Department’s conduct of Sunset Reviews.1 Please consult the Department’s regulations at 19 CFR part 351 for definitions of terms and for other general information concerning antidumping and countervailing duty proceedings at the Department.
This notice of initiation is being published in accordance with section 751(c) of the Act and 19 CFR 351.218 (c).
Dated: January 25, 2011. Christian Marsh, Deputy Assistant Secretary for Antidumping and Countervailing Duty Operations. [FR Doc. 2011–2197 Filed 1–31–11; 8:45 am] BILLING CODE 3510–DS–P
intent to participate are set forth at 19 CFR 351.218(d)(1)(ii). In accordance with the Department’s regulations, if we do not receive a notice of intent to participate from at least one domestic interested party by the 15-day deadline, the Department will automatically revoke the order without further review. See 19 CFR 351.218(d)(1)(iii).
1 In comments made on the interim final sunset regulations, a number of parties stated that the proposed five-day period for rebuttals to substantive responses to a notice of initiation was insufficient. This requirement was retained in the final sunset regulations at 19 CFR 351.218(d)(4). As provided in 19 CFR 351.302(b), however, the Department will consider individual requests to extend that five-day deadline based upon a showing of good cause.

5822 Federal Register / Vol. 76, No. 22 / Wednesday, February 2, 2011 / Notices
INTERNATIONAL TRADE COMMISSION [Investigation No. 731–TA–1089 (Review)]
Orange Juice From Brazil
AGENCY: United States International Trade Commission. ACTION: Institution of a five-year review concerning the antidumping duty order on certain orange juice from Brazil.
material injury. Pursuant to section 751(c)(2) of the Act, interested parties are requested to respond to this notice by submitting the information specified below to the Commission; 1 to be assured of consideration, the deadline for responses is March 3, 2011. Comments on the adequacy of responses may be filed with the Commission by April 18, 2011. For further information concerning the conduct of this review and rules of general application, consult the Commission’s Rules of Practice and Procedure, part 201, subparts A through E (19 CFR part 201), and part 207, subparts A, D, E, and F (19 CFR part 207), as most recently amended at 74 FR 2847 (January 16, 2009). DATES: Effective Date: February 1, 2011. FOR FURTHER INFORMATION CONTACT: Mary Messer (202–205–3193), Office of Investigations, U.S. International Trade Commission, 500 E Street, SW., Washington, DC 20436. Hearing- impaired persons can obtain information on this matter by contacting the Commission’s TDD terminal on 202– 205–1810. Persons with mobility impairments who will need special assistance in gaining access to the Commission should contact the Office of the Secretary at 202–205–2000. General information concerning the Commission may also be obtained by accessing its Internet server (http:// www.usitc.gov). The public record for this review may be viewed on the Commission’s electronic docket (EDIS) at http://edis.usitc.gov. SUPPLEMENTARY INFORMATION:
Background.—On March 9, 2006, the Department of Commerce issued an antidumping duty order on imports of certain orange juice from Brazil (71 FR 12183). The Commission is conducting a review to determine whether revocation of the order would be likely to lead to continuation or recurrence of material injury to the domestic industry within a reasonably foreseeable time. It will assess the adequacy of interested party responses to this notice of institution to determine whether to conduct a full review or an expedited review. The Commission’s determination in any expedited review will be based on the facts available,
which may include information provided in response to this notice.
Definitions.—The following definitions apply to this review:
(1) Subject Merchandise is the class or kind of merchandise that is within the scope of the five-year review, as defined by the Department of Commerce.
(2) The Subject Country in this review is Brazil.
(3) The Domestic Like Product is the domestically produced product or products which are like, or in the absence of like, most similar in characteristics and uses with, the Subject Merchandise. In its original determination, the Commission defined the Domestic Like Product as consisting of conventional FCOJM, conventional NFC, organic FCOJM, and organic NFC, coextensive with Commerce’s scope.2
(4) The Domestic Industry is the U.S. producers as a whole of the Domestic Like Product, or those producers whose collective output of the Domestic Like Product constitutes a major proportion of the total domestic production of the product. In its original determination, the Commission defined the Domestic Industry as both orange growers and all domestic extractors/processors of certain orange juice.
(5) The Order Date is the date that the antidumping duty order under review became effective. In this review, the Order Date is March 9, 2006.
(6) An Importer is any person or firm engaged, either directly or through a parent company or subsidiary, in importing the Subject Merchandise into the United States from a foreign manufacturer or through its selling agent.
Participation in the review and public service list.—Persons, including industrial users of the Subject Merchandise and, if the merchandise is sold at the retail level, representative consumer organizations, wishing to participate in the review as parties must file an entry of appearance with the Secretary to the Commission, as provided in section 201.11(b)(4) of the Commission’s rules, no later than 21 days after publication of this notice in the Federal Register. The Secretary will maintain a public service list containing the names and addresses of all persons, or their representatives, who are parties to the review.
1 No response to this request for information is Former Commission employees who SUMMARY: The Commission hereby gives notice that it has instituted a review pursuant to section 751(c) of the Tariff
required if a currently valid Office of Management and Budget (OMB) number is not displayed; the OMB number is 3117–0016/USITC No. 11–5–238, expiration date June 30, 2011. Public reporting
are seeking to appear in Commission five-year reviews are advised that they may appear in a review even if they
Act of 1930 (19 U.S.C. 1675(c)) (the Act) burden for the request is estimated to average 15 to determine whether revocation of the antidumping duty order on certain orange juice from Brazil would be likely to lead to continuation or recurrence of
hours per response. Please send comments regarding the accuracy of this burden estimate to the Office of Investigations, U.S. International Trade Commission, 500 E Street, SW., Washington, DC 20436.
2 FCOJM stands for frozen concentrated orange juice for further manufacturing and NFC stands for conventional pasteurized single strength orange juice which has not been concentrated, typically referred to as not-from-concentrate.

Federal Register / Vol. 76, No. 22 / Wednesday, February 2, 2011 / Notices 5823 participated personally and substantially in the corresponding underlying original investigation. The Commission’s designated agency ethics official has advised that a five-year review is not considered the ‘‘same particular matter’’ as the corresponding underlying original investigation for purposes of 18 U.S.C. 207, the post employment statute for Federal employees, and Commission rule 201.15(b) (19 CFR 201.15(b)), 73 FR 24609 (May 5, 2008). This advice was developed in consultation with the Office of Government Ethics. Consequently, former employees are not required to seek Commission approval to appear in a review under Commission rule 19 CFR 201.15, even if the corresponding underlying original investigation was pending when they were Commission employees. For further ethics advice on this matter, contact Carol McCue Verratti, Deputy Agency Ethics Official, at 202–205– 3088.
Limited disclosure of business proprietary information (BPI) under an administrative protective order (APO) and APO service list.—Pursuant to section 207.7(a) of the Commission’s rules, the Secretary will make BPI submitted in this review available to authorized applicants under the APO issued in the review, provided that the application is made no later than 21 days after publication of this notice in the Federal Register. Authorized applicants must represent interested parties, as defined in 19 U.S.C. 1677(9), who are parties to the review. A separate service list will be maintained by the Secretary for those parties authorized to receive BPI under the APO.
Certification.—Pursuant to section 207.3 of the Commission’s rules, any person submitting information to the Commission in connection with this review must certify that the information is accurate and complete to the best of the submitter’s knowledge. In making the certification, the submitter will be deemed to consent, unless otherwise specified, for the Commission, its employees, and contract personnel to use the information provided in any other reviews or investigations of the same or comparable products which the Commission conducts under Title VII of the Act, or in internal audits and investigations relating to the programs and operations of the Commission pursuant to 5 U.S.C. Appendix 3.
Written submissions.—Pursuant to section 207.61 of the Commission’s rules, each interested party response to this notice must provide the information specified below. The deadline for filing
such responses is March 3, 2011. Pursuant to section 207.62(b) of the Commission’s rules, eligible parties (as specified in Commission rule 207.62(b)(1)) may also file comments concerning the adequacy of responses to the notice of institution and whether the Commission should conduct an expedited or full review. The deadline for filing such comments is April 18, 2011. All written submissions must conform with the provisions of sections 201.8 and 207.3 of the Commission’s rules and any submissions that contain BPI must also conform with the requirements of sections 201.6 and 207.7 of the Commission’s rules. The Commission’s rules do not authorize filing of submissions with the Secretary by facsimile or electronic means, except to the extent permitted by section 201.8 of the Commission’s rules, as amended, 67 FR 68036 (November 8, 2002). Also, in accordance with sections 201.16(c) and 207.3 of the Commission’s rules, each document filed by a party to the review must be served on all other parties to the review (as identified by either the public or APO service list as appropriate), and a certificate of service must accompany the document (if you are not a party to the review you do not need to serve your response).
Inability to provide requested information.—Pursuant to section 207.61(c) of the Commission’s rules, any interested party that cannot furnish the information requested by this notice in the requested form and manner shall notify the Commission at the earliest possible time, provide a full explanation of why it cannot provide the requested information, and indicate alternative forms in which it can provide equivalent information. If an interested party does not provide this notification (or the Commission finds the explanation provided in the notification inadequate) and fails to provide a complete response to this notice, the Commission may take an adverse inference against the party pursuant to section 776(b) of the Act in making its determination in the review.
Information To Be Provided in Response to This Notice of Institution: As used below, the term ‘‘firm’’ includes any related firms.
(1) The name and address of your firm or entity (including World Wide Web address) and name, telephone number, fax number, and e-mail address of the certifying official.
(2) A statement indicating whether your firm/entity is a U.S. producer of the Domestic Like Product, a U.S. union or worker group, a U.S. importer of the Subject Merchandise, a foreign producer or exporter of the Subject Merchandise,
a U.S. or foreign trade or business association, or another interested party (including an explanation). If you are a union/worker group or trade/business association, identify the firms in which your workers are employed or which are members of your association.
(3) A statement indicating whether your firm/entity is willing to participate in this review by providing information requested by the Commission.
(4) A statement of the likely effects of the revocation of the antidumping duty order on the Domestic Industry in general and/or your firm/entity specifically. In your response, please discuss the various factors specified in section 752(a) of the Act (19 U.S.C. 1675a(a)) including the likely volume of subject imports, likely price effects of subject imports, and likely impact of imports of Subject Merchandise on the Domestic Industry.
(5) A list of all known and currently operating U.S. producers of the Domestic Like Product. Identify any known related parties and the nature of the relationship as defined in section 771(4)(B) of the Act (19 U.S.C. 1677(4)(B)).
(6) A list of all known and currently operating U.S. importers of the Subject Merchandise and producers of the Subject Merchandise in the Subject Country that currently export or have exported Subject Merchandise to the United States or other countries since the Order Date.
(7) A list of 3–5 leading purchasers in the U.S. market for the Domestic Like Product and the Subject Merchandise (including street address, World Wide Web address, and the name, telephone number, fax number, and E-mail address of a responsible official at each firm).
(8) A list of known sources of information on national or regional prices for the Domestic Like Product or the Subject Merchandise in the U.S. or other markets.
(9) If you are a U.S. producer of the Domestic Like Product, provide the following information on your firm’s operations on that product during crop year 2009/10, except as noted (report quantity data in millions of boxes (growers) or thousands of solids (processors) and value data in U.S. dollars, f.o.b. your production facility). If you are a union/worker group or trade/business association, provide the information, on an aggregate basis, for the firms in which your workers are employed/which are members of your association.
(a) Production (quantity) and, if known, an estimate of the percentage of total U.S. production of the Domestic

5824 Federal Register / Vol. 76, No. 22 / Wednesday, February 2, 2011 / Notices
Like Product accounted for by your firm’s(s’) production;
(b) Capacity (quantity) of your firm to produce the Domestic Like Product (i.e., the level of production that your establishment(s) could reasonably have expected to attain during the year, assuming normal operating conditions (using equipment and machinery in place and ready to operate), normal operating levels (hours per week/weeks per year), time for downtime, maintenance, repair, and cleanup, and a typical or representative product mix);
(c) The quantity and value of U.S.
product during crop year 2010 (report quantity data in millions of boxes (growers) or thousands of solids (processors) and value data in U.S. dollars, landed and duty-paid at the U.S. port but not including antidumping duties). If you are a trade/business association, provide the information, on an aggregate basis, for the firms which are members of your association.
(a) Production (quantity) and, if known, an estimate of the percentage of total production of Subject Merchandise in the Subject Country accounted for by your firm’s(s’) production;
with either or both of these definitions, please explain why and provide alternative definitions.
Authority: This review is being conducted under authority of title VII of the Tariff Act of 1930; this notice is published pursuant to section 207.61 of the Commission’s rules. By order of the Commission.
Issued: January 27, 2011. Marilyn R. Abbott, Secretary to the Commission. [FR Doc. 2011–2215 Filed 2–1–11; 8:45 am] BILLING CODE 7020–02–P
commercial shipments of the Domestic Like Product produced in your U.S. plant(s);
(d) The quantity and value of U.S. internal consumption/company transfers of the Domestic Like Product produced in your U.S. plant(s); and
(e) The value of (i) net sales, (ii) cost of goods sold (COGS), (iii) gross profit, (iv) selling, general and administrative (SG&A) expenses, and (v) operating income of the Domestic Like Product produced in your U.S. plant(s) (include both U.S. and export commercial sales, internal consumption, and company transfers) for your most recently completed fiscal year (identify the date on which your fiscal year ends).
(10) If you are a U.S. importer or a trade/business association of U.S. importers of the Subject Merchandise from the Subject Country, provide the following information on your firm’s(s’) operations on that product during crop year 2009/10 (report quantity data in thousands of solids and value data in U.S. dollars). If you are a trade/business association, provide the information, on an aggregate basis, for the firms which are members of your association.
(a) The quantity and value (landed, duty-paid but not including antidumping duties) of U.S. imports and, if known, an estimate of the percentage of total U.S. imports of Subject Merchandise from the Subject Country accounted for by your firm’s(s’) imports;
(b) The quantity and value (f.o.b. U.S. port, including antidumping duties) of U.S. commercial shipments of Subject Merchandise imported from the Subject Country; and
(c) The quantity and value (f.o.b. U.S. port, including antidumping duties) of U.S. internal consumption/company transfers of Subject Merchandise imported from the Subject Country.
(11) If you are a producer, an exporter, or a trade/business association of producers or exporters of the Subject Merchandise in the Subject Country, provide the following information on your firm’s(s’) operations on that
(b) Capacity (quantity) of your firm to produce the Subject Merchandise in the Subject Country (i.e., the level of production that your establishment(s) could reasonably have expected to attain during the year, assuming normal operating conditions (using equipment and machinery in place and ready to operate), normal operating levels (hours per week/weeks per year), time for downtime, maintenance, repair, and cleanup, and a typical or representative product mix); and
(c) The quantity and value of your firm’s(s’) exports to the United States of Subject Merchandise and, if known, an estimate of the percentage of total exports to the United States of Subject Merchandise from the Subject Country accounted for by your firm’s(s’) exports.
(12) Identify significant changes, if any, in the supply and demand conditions or business cycle for the Domestic Like Product that have occurred in the United States or in the market for the Subject Merchandise in the Subject Country since the Order Date, and significant changes, if any, that are likely to occur within a reasonably foreseeable time. Supply conditions to consider include technology; production methods; development efforts; ability to increase production (including the shift of production facilities used for other products and the use, cost, or availability of major inputs into production); and factors related to the ability to shift supply among different national markets (including barriers to importation in foreign markets or changes in market demand abroad). Demand conditions to consider include end uses and applications; the existence and availability of substitute products; and the level of competition among the Domestic Like Product produced in the United States, Subject Merchandise produced in the Subject Country, and such merchandise from other countries.
(13) (OPTIONAL) A statement of whether you agree with the above definitions of the Domestic Like Product and Domestic Industry; if you disagree

Federal Register / Vol. 76, No. 100 / Tuesday, May 24, 2011 / Notices 30197
INTERNATIONAL TRADE COMMISSION [Investigation No. 731–TA–1089 (Review)]
Orange Juice From Brazil; Notice of Commission Determination To Conduct a Full Five-Year Review Concerning the Antidumping Duty Orderon Orange Juice From Brazil
AGENCY: United States International Trade Commission. ACTION: Notice
SUMMARY: The Commission hereby gives notice that it will proceed with a full review pursuant to section 751(c)(5) of the Tariff Act of 1930 (19 U.S.C. 1675(c)(5)) to determine whether revocation of the antidumping duty orderon orange juice from Brazil would be likely to lead to continuation or recurrence of material injury within a reasonably foreseeable time. A schedule for the review will be established and announced at a later date. For further information concerning the conduct of this review and rules of general application, consult the Commission’s Rules of Practice and Procedure, part 201, subparts A through E (19 CFR part 201), and part 207, subparts A, D, E, and F (19 CFR part 207). DATES: Effective Date: May 9, 2011. FOR FURTHER INFORMATION CONTACT: Elizabeth Haines (202–205–3200), Office of Investigations, U.S. International Trade Commission, 500 E Street SW., Washington, DC 20436. Hearing- impaired persons can obtain information on this matter by contacting the Commission’s TDD terminal on 202– 205–1810. Persons with mobility impairments who will need special assistance in gaining access to the Commission should contact the Office of the Secretary at 202–205–2000. General information concerning the Commission may also be obtained by accessing its Internet server (http:// www.usitc.gov). The public record for this review may be viewed on the Commission’s electronic docket (EDIS) at http://edis.usitc.gov. SUPPLEMENTARY INFORMATION: On May 9, 2011, the Commission determined that it should proceed to a full review in the subject five-year review pursuant to section 751(c)(5) of the Act. The Commission found that both the domestic and respondent interested party group responses to its notice of institution (76 FR 5822, February 2, 2011) were adequate.A record of the Commissioners’ votes, the Commission’s statement on adequacy, and any individual Commissioner’s statements will be available from the
Office of the Secretary and at the Commission’s web site.
Authority: This review is being conducted under authority of title VII of the Tariff Act of 1930; this notice is published pursuant to section 207.62 of the Commission’s rules.
By order of the Commission. Issued: May 18, 2011.
James R. Holbein, Secretary to the Commission. [FR Doc. 2011–12673 Filed 5–23–11; 8:45 am] BILLING CODE 7020–02–P

Federal Register / Vol. 76, No. 102 / Thursday, May 26, 2011 / Notices 30655
DEPARTMENT OF COMMERCE
International Trade Administration
[A–351–840]
Certain Orange Juice From Brazil: Final Results of the Expedited Sunset Review of the Antidumping Duty Order
AGENCY: Import Administration, International Trade Administration, Department of Commerce. SUMMARY: On February 1, 2011, the Department of Commerce (the Department) initiated a sunset review of the antidumping duty order on certain orange juice (OJ) from Brazil, pursuant to section 751(c) of the Tariff Act of 1930, as amended (the Act). The Department has conducted an expedited (120-day) sunset review of this order pursuant to 19 CFR 351.218(e)(1)(ii)(C)(2). As a result of this sunset review, the Department finds that revocation of the antidumping duty order would be likely to lead to the continuation or recurrence of dumping. DATES: Effective Date: May 26, 2011. FOR FURTHER INFORMATION: Hector Rodriguez or Elizabeth Eastwood, AD/CVD Operations, Office 2, Import Administration, International Trade Administration, U.S. Department of Commerce, 14th Street and Constitution Avenue, NW., Washington, DC 20230; telephone: (202) 482–0629 and (202) 482–3874, respectively. SUPPLEMENTARY INFORMATION:
Background
On February 1, 2011, the Department published the notice of initiation of the first sunset review of the antidumping duty order on OJ from Brazil, pursuant to section 751(c) of the Act. See Initiation of Five-Year (‘‘Sunset’’) Review, 76 FR 5563 (Feb. 1, 2011) (Notice of Initiation).
The Department received two separate notices of intent to participate from Florida Citrus Mutual, Citrus World, Inc., and Peace River Citrus Products, Inc. (the petitioners) and from Southern Gardens Citrus Processing Corporation (Southern Gardens), a producer in the United States of a domestic like product. Both the petitioners and Southern Gardens (collectively, the domestic interested parties) claimed interested party status under sections 771(9)(C) and (D) of the Act as producers of OJ in the United States.
The Department received adequate substantive responses to the Notice of Initiation from the domestic interested parties within the 30-day deadline specified in 19 CFR 351.218(d)(3)(i). We received no substantive responses from respondent interested parties with respect to the order covered by this sunset review. As a result, pursuant to section 752(c)(3)(B) of the Act and 19 CFR 351.218(e)(1)(ii)(C)(2), the Department conducted an expedited (120-day) sunset review of the antidumping duty order on OJ from Brazil.

30656 Federal Register / Vol. 76, No. 102 / Thursday, May 26, 2011 / Notices
Scope of the Order The scope of the order includes
certain orange juice for transport and/or further manufacturing, produced in two different forms: (1) Frozen orange juice in a highly concentrated form, sometimes referred to as frozen concentrated orange juice for manufacture (FCOJM); and (2) pasteurized single-strength orange juice which has not been concentrated, referred to as not-from-concentrate (NFC). At the time of the filing of the petition, there was an existing antidumping duty order on frozen concentrated orange juice (FCOJ) from Brazil. See Antidumping Duty Order; Frozen Concentrated Orange Juice From Brazil, 52 FR 16426 (May 5, 1987). Therefore, the scope of the order with regard to FCOJM covers only FCOJM produced and/or exported by those companies which were excluded or revoked from the pre-existing antidumping order on FCOJ from Brazil as of December 27, 2004. Those
include the likelihood of continuation or recurrence of dumping and the magnitude of the margin likely to prevail if the order were revoked. Parties can find a complete discussion of all issues raised in this review and the corresponding recommendations in this public memorandum which is on file in the Central Records Unit, Room 7046 of the main Department building.
In addition, a complete version of the Decision Memo can be accessed directly on the Web at http://ia.ita.doc.gov/frn. The paper copy and electronic version of the Decision Memo are identical in content.
Final Results of Review
We determine that revocation of the antidumping duty order on OJ from Brazil would be likely to lead to the continuation or recurrence of dumping at the following weighted-average percentage margins:
Weighted- companies are Cargill Citrus Limitada, Coinbra-Frutesp (SA), Fischer S.A. Comercio, Industria, and Agricultura, Montecitrus Trading S.A., and Sucocitrico Cutrale, S.A.
Manufacturers/Exporters/ Producers
Fischer S.A. Comercio,
average mar- gin (percent)
Excluded from the scope of the order are reconstituted orange juice and frozen concentrated orange juice for retail (FCOJR). Reconstituted orange juice is produced through further manufacture of FCOJM, by adding water, oils and essences to the orange juice concentrate. FCOJR is concentrated orange juice, typically at 42 Brix, in a frozen state, packed in retail-sized containers ready for sale to consumers. FCOJR, a finished consumer product, is produced through further manufacture of FCOJM, a bulk manufacturer’s product.
The subject merchandise is currently classifiable under subheadings 2009.11.00, 2009.12.25, 2009.12.45, and 2009.19.00 of the Harmonized Tariff Schedule of the United States (HTSUS). These HTSUS subheadings are provided for convenience and for customs purposes only and are not dispositive. Rather, the written description of the scope of the order is dispositive.
Analysis of Comments Received All issues raised in this review are
addressed in the ‘‘Issues and Decision Memorandum for the Expedited Sunset Review of the Antidumping Duty Order on Certain Orange Juice from Brazil’’ to Ronald K. Lorentzen, Deputy Assistant Secretary for Import Administration (May 19, 2011) (Decision Memo), which is hereby adopted by this notice. The issues discussed in the Decision Memo
Industria, and Agricultura * 12.46 Montecitrus Trading S.A. ...... 60.29 Sucocitrico Cutrale, S.A. ...... 19.19 All-Others Rate ** .................. 16.51
* Fischer S.A. Comercio, Industria, and Agricultura is the successor-in-interest to Fischer S/A—Agroindustria.
** The all-others rate in regards to FCOJM applies to Cargill Citrus Limitada and Coinbra- Frutesp (SA). The all-others rate for NFC ap- plies to all other companies not identified above.
This notice also serves as the only reminder to parties subject to administrative protective order (APO) of their responsibility concerning the return or destruction of proprietary information disclosed under APO in accordance with 19 CFR 351.305. Timely notification of the return or destruction of APO materials or conversion to judicial protective orders is hereby requested. Failure to comply with the regulations and terms of an APO is a violation which is subject to sanction.
We are issuing and publishing the results and notice in accordance with sections 751(c), 752(c), and 777(i)(1) of the Act.
Dated: May 19, 2011. Ronald K. Lorentzen, Deputy Assistant Secretary for Import Administration. [FR Doc. 2011–13088 Filed 5–25–11; 8:45 am]
BILLING CODE 3510–DS–P

43344 Federal Register / Vol. 76, No. 139 / Wednesday, July 20, 2011 / Notices
INTERNATIONAL TRADE COMMISSION [Investigation No. 731–TA–1089 (Review)]
Certain Orange Juice From Brazil; Scheduling of a Full Five-Year Review Concerning the Antidumping Duty Order on Certain Orange Juice From Brazil AGENCY: United States International Trade Commission. ACTION: Notice.
SUMMARY: The Commission hereby gives notice of the scheduling of a full review pursuant to section 751(c)(5) of the Tariff Act of 1930 (19 U.S.C. 1675(c)(5)) (the Act) to determine whether revocation of the antidumping duty order on certain orange juice from Brazil would be likely to lead to continuation or recurrence of material injury within a reasonably foreseeable time. The Commission has determined to exercise its authority to extend the review period by up to 90 days pursuant to 19 U.S.C. 1675(c)(5)(B). For further information concerning the conduct of this review and rules of general application, consult the Commission’s Rules of Practice and Procedure, part 201, subparts A through E (19 CFR Part 201), and part 207, subparts A, D, E, and F (19 CFR Part 207). DATES: Effective Date: July 14, 2011. FOR FURTHER INFORMATION CONTACT: Amy Sherman (202–205–3289), Office of Investigations, U.S. International Trade Commission, 500 E Street, SW., Washington, DC 20436. Hearing- impaired persons can obtain information on this matter by contacting the Commission’s TDD terminal on 202– 205–1810. Persons with mobility impairments who will need special assistance in gaining access to the Commission should contact the Office of the Secretary at 202–205–2000. General information concerning the Commission may also be obtained by accessing its internet server (http:// www.usitc.gov). The public record for this review may be viewed on the Commission’s electronic docket (EDIS) at http://edis.usitc.gov. SUPPLEMENTARY INFORMATION:
Background.—On May 9, 2011, the Commission determined that responses to its notice of institution of the subject five-year review were such that a full review pursuant to section 751(c)(5) of the Act should proceed (76 FR 30197, May 24, 2011). A record of the Commissioners’ votes, the Commission’s statement on adequacy, and any individual Commissioner’s statements are available from the Office
of the Secretary and at the Commission’s Web site.
Participation in the review and public service list.—Persons, including industrial users of the subject merchandise and, if the merchandise is sold at the retail level, representative consumer organizations, wishing to participate in this review as parties must file an entry of appearance with the Secretary to the Commission, as provided in section 201.11 of the Commission’s rules, by 45 days after publication of this notice. A party that filed a notice of appearance following publication of the Commission’s notice of institution of the review need not file an additional notice of appearance. The Secretary will maintain a public service list containing the names and addresses of all persons, or their representatives, who are parties to the review.
Limited disclosure of business proprietary information (BPI) under an administrative protective order (APO) and BPI service list.—Pursuant to section 207.7(a) of the Commission’s rules, the Secretary will make BPI gathered in this review available to authorized applicants under the APO issued in the review, provided that the application is made by 45 days after publication of this notice. Authorized applicants must represent interested parties, as defined by 19 U.S.C. 1677(9), who are parties to the review. A party granted access to BPI following publication of the Commission’s notice of institution of the review need not reapply for such access. A separate service list will be maintained by the Secretary for those parties authorized to receive BPI under the APO.
Staff report.—The prehearing staff report in the review will be placed in the nonpublic record on January 4, 2012, and a public version will be issued thereafter, pursuant to section 207.64 of the Commission’s rules.
Hearing.—The Commission will hold a hearing in connection with the review beginning at 9:30 a.m. on January 24, 2012, at the U.S. International Trade Commission Building. Requests to appear at the hearing should be filed in writing with the Secretary to the Commission on or before January 17, 2012. A nonparty who has testimony that may aid the Commission’s deliberations may request permission to present a short statement at the hearing. All parties and nonparties desiring to appear at the hearing and make oral presentations should attend a prehearing conference to be held at 9:30 a.m. on January 20, 2012, at the U.S. International Trade Commission Building. Oral testimony and written materials to be submitted at the public
hearing are governed by sections 201.6(b)(2), 201.13(f), 207.24, and 207.66 of the Commission’s rules. Parties must submit any request to present a portion of their hearing testimony in camera no later than 7 business days prior to the date of the hearing.
Written submissions.—Each party to the review may submit a prehearing brief to the Commission. Prehearing briefs must conform with the provisions of section 207.65 of the Commission’s rules; the deadline for filing is January 13, 2012. Parties may also file written testimony in connection with their presentation at the hearing, as provided in section 207.24 of the Commission’s rules, and posthearing briefs, which must conform with the provisions of section 207.67 of the Commission’s rules. The deadline for filing posthearing briefs is February 2, 2012; witness testimony must be filed no later than three days before the hearing. In addition, any person who has not entered an appearance as a party to the review may submit a written statement of information pertinent to the subject of the review on or before February 2, 2012. On March 1, 2012, the Commission will make available to parties all information on which they have not had an opportunity to comment. Parties may submit final comments on this information on or before March 5, 2012, but such final comments must not contain new factual information and must otherwise comply with section 207.68 of the Commission’s rules. All written submissions must conform with the provisions of section 201.8 of the Commission’s rules; any submissions that contain BPI must also conform with the requirements of sections 201.6, 207.3, and 207.7 of the Commission’s rules. The Commission’s rules do not authorize filing of submissions with the Secretary by facsimile or electronic means, except to the extent permitted by section 201.8 of the Commission’s rules, as amended, 67 FR 68036 (November 8, 2002). Even where electronic filing of a document is permitted, certain documents must also be filed in paper form, as specified in II(C) of the Commission’s Handbook on Electronic Filing Procedures, 67 FR 68168, 68173 (November 8, 2002).
Additional written submissions to the Commission, including requests pursuant to section 201.12 of the Commission’s rules, shall not be accepted unless good cause is shown for accepting such submissions, or unless the submission is pursuant to a specific request by a Commissioner or Commission staff.

Federal Register / Vol. 76, No. 139 / Wednesday, July 20, 2011 / Notices
In accordance with sections 201.16(c) and 207.3 of the Commission’s rules, each document filed by a party to the review must be served on all other parties to the review (as identified by either the public or BPI service list), and a certificate of service must be timely filed. The Secretary will not accept a document for filing without a certificate of service.
Authority: This review is being conducted under authority of title VII of the Tariff Act of 1930; this notice is published pursuant to section 207.62 of the Commission’s rules.
Issued: July 14, 2011. By order of the Commission.
James R. Holbein, Secretary to the Commission. [FR Doc. 2011–18201 Filed 7–19–11; 8:45 am] BILLING CODE 7020–02–P
43345

EXPLANATION OF COMMISSION DETERMINATION ON ADEQUACY in
Orange Juice from Brazil Inv. No. 731-TA-1089 (Review)
On May 9, 2011, the Commission determined to conduct a full review in the subject five-year review pursuant to section 751(c)(3)(B) of the Tariff Act of 1930, as amended, 19 U.S.C. § 1675(c)(3)(B).
The Commission received responses to its notice of institution from seven U.S. producers of the
domestic like product.1 The Commission found these responses to be individually adequate. The Commission also found that the domestic interested party group response to its notice of institution was adequate.
The Commission received responses to the notice of institution from three Brazilian
producers/exporters of the subject merchandise.2 The Commission found these responses to be individually adequate. The Commission also found that the respondent interested party group response to its notice of institution was adequate.
Having found the group responses of the domestic and respondent interested parties to be
adequate, the Commission determined to conduct a full review.
A record of the Commissioners’ votes is available from the Office of the Secretary and on the Commission’s website (http://www.usitc.gov).
1 The Commission received responses to the notice of institution from the following seven U.S. producers of the domestic like product: (1) Florida Citrus Mutual, (2) Citrus World, Inc., (3) Peace River Citrus Products, Inc., (4) Southern Gardens Citrus Processing Corp., (5) Louis Dreyfus Citrus, Inc., (6) Citrosuco North America, Inc., and (7) Citrus Products Inc.
2 The Commission received responses to the notice of institution from the following three
Brazilian producers/exporters of the subject merchandise: (1) Fischer S.A. Comercio, Industria and Agricultura, (2) Louis Dreyfus Commodities Agroindustrial S.A., and (3) Sucocitrico Cutrale Ltd.


B-1
APPENDIX B HEARING
WITNESSES


B-3
CALENDAR OF PUBLIC HEARING
Those listed below appeared as witnesses at the United States International Trade Commission’s hearing:
Subject: Certain Orange Juice from Brazil
Inv. No.: 731-TA-1089 (Review)
Date and Time: January 24, 2012 - 11:30 a.m.
Sessions were held in connection with this investigation in the Main Hearing Room (room
101), 500 E Street, SW, Washington, D.C. OPENING REMARKS:
In Support of Continuation (Matthew T. McGrath,
Barnes, Richardson & Colburn) In Opposition to Continuation (Christopher Dunn,
Curtis Mallet-Prevost Colt & Mosle LLP) In Support of the Continuation of
Antidumping Duties: Barnes, Richardson & Colburn Washington, D.C. on behalf of
Florida Citrus Mutual (“FCM”) Citrus World, Inc. Peace River Citrus Products, Inc.
Michael Sparks, Executive Vice President and CEO,
Floria Citrus Mutual
Victor Story, President, Story Groves Services, Inc.; and President, Florida Citrus Mutual
John Barben, Vice President, Robert J. Barben, Inc.

B-4
In Support of the Continuation of Antidumping Duties (continued):
Dr. Robert Behr, Vice President, Planning and Production,
Citrus World, Inc.
Amy Warlick, Economist, Barnes, Richardson & Colburn
Matthew T. McGrath ) ) – OF COUNSEL
Stephen W. Brophy ) Mayer Brown LLP Washington, D.C. on behalf of
Southern Gardens Corporation (“Southern Gardens”)
Dan Casper, Vice President, Procurement, Sales
& Marketing, Southern Gardens
Matthew J. McConkey ) ) – OF COUNSEL
Jeffery C. Lowe )
B-5
In Opposition to the Continuation of Antidumping Duties:
Kalik Lewin Bethesda, MD on behalf of
Fischer S.A. Comercio Industria and Agricultura and Citrosuco North America, Inc.
and
Curtis Mallet-Prevost Colt & Mosle LLP Washington, D.C. on behalf of
Sucocitrico Cutrale Ltda. Cutrale Citrus Juices Inc. Louis Dreyfus Commodities Agroindustria, S.A. Louis Dreyfus Citrus, Inc.
Nick Emmanual, CEO and President, Citrosuco North
America, Inc.
Hugh Thompson, President, Cutrale Citrus Juices, Inc.
Randal Freeman, Senior Vice President, Louis Dreyfus Citrus, Inc.
Robert G. Kalik )
) – OF COUNSEL Christopher Dunn )

B-6
In Opposition to the Continuation of Antidumping Duties (continued):
Arent Fox LLP Washington, D.C. on behalf of
The Coca-Cola Company (“TCCC”)
Jim Horrisberger, Director, North American
Procurement, TCCC
Matthew J. Clark ) ) – OF COUNSEL
Nancy A. Noonan ) REBUTTAL/CLOSING REMARKS:
In Support of Continuation (Matthew T. McGrath and Amy Warlick,
Barnes, Richardson & Colburn; and Jeffery C. Lowe, Mayer Brown LLP)
In Opposition to Continuation (Robert G. Kalik, Kalik Lewin; and Christopher Dunn, Curtis Mallet-Prevost Colt & Mosle LLP)
-END-

C-1
APPENDIX C
SUMMARY DATA


Quantity . . . . . . . . . . . . . . . . . . Value . . . . . . . . . . . . . . . . . . . . Unit value . . . . . . . . . . . . . . . .
*** *** ***
*** *** ***
*** *** ***
*** *** ***
*** *** ***
*** *** ***
*** *** ***
*** *** ***
*** *** ***
*** *** ***
*** *** ***
*** *** ***
Brazil (nonsubject): Quantity . . . . . . . . . . . . . . . . . .
***
***
***
***
***
***
***
***
***
***
***
***
Value . . . . . . . . . . . . . . . . . . . . *** *** *** *** *** *** *** *** *** *** *** *** Unit value . . . . . . . . . . . . . . . .
All other sources: Quantity . . . . . . . . . . . . . . . . . .
***
91,175
***
128,541
***
144,168
***
129,517
***
127,884
***
114,205
***
25.3
***
41.0
***
12.2
***
-10.2
***
-1.3
***
-10.7 Value . . . . . . . . . . . . . . . . . . . . 105,286 229,069 218,388 142,874 169,791 181,447 72.3 117.6 -4.7 -34.6 18.8 6.9 Unit value . . . . . . . . . . . . . . . .
All sources: $1.15 $1.78 $1.51 $1.10 $1.33 $1.59 37.6 54.3 -15.0 -27.2 20.4 19.7
Quantity . . . . . . . . . . . . . . . . . . 265,852 341,232 343,136 238,163 264,143 191,999 -27.8 28.4 0.6 -30.6 10.9 -27.3 Value . . . . . . . . . . . . . . . . . . . . 308,991 599,696 505,763 277,131 349,176 317,907 2.9 94.1 -15.7 -45.2 26.0 -9.0 Unit value . . . . . . . . . . . . . . . . $1.16 $1.76 $1.47 $1.16 $1.32 $1.66 42.5 51.2 -16.1 -21.1 13.6 25.3
U.S. processors' U.S. shipments . 374,437 332,096 369,180 419,284 346,507 325,656 -13.0 -11.3 11.2 13.6 -17.4 -6.0
U.S. exports (quantity) . . . . . . . . . 50,882 48,056 67,034 59,021 61,332 83,931 65.0 -5.6 39.5 -12.0 3.9 36.8 Ending stocks (quantity) . . . . . . . 169,422 148,701 318,904 327,683 233,230 157,032 -7.3 -12.2 114.5 2.8 -28.8 -32.7
Table C-1 FCOJM: Summary data concerning the U.S. market, crop years 2005/06 - 2010/11
(Quantity=1,000 gallons SSE, value=1,000 dollars, unit values are per gallon; period changes=percent, except where noted)
Reported data Period changes Crop years 2005/06 - 2005/06- 2006/07 - 2007/08 - 2008/09 - 2009/10 -
Item 2005/06 2006/07 2007/08 2008/09 2009/10 2010/11 2010/11 2006/07 2007/08 2008/09 2009/10 2010/11
FCOJM apparent consumption:
Quantity . . . . . . . . . . . . . . . . . . .
640,289
673,328
712,315
657,447
610,650
517,656
-19.2
5.2
5.8
-7.7
-7.1
-15.2 U.S. processors' share . . . . . . . Importers' share (1):
Brazil (subject) . . . . . . . . . . . . .
58.5
***
49.3
***
51.8
***
63.8
***
56.7
***
62.9
***
4.4
***
-9.2
***
2.5
***
11.9
***
-7.0
***
6.2
*** Brazil (nonsubject) . . . . . . . . . . *** *** *** *** *** *** *** *** *** *** *** *** All other sources . . . . . . . . . . . 14.2 19.1 20.2 19.7 20.9 22.1 7.8 4.9 1.1 -0.5 1.2 1.1
Total imports . . . . . . . . . . . . . 41.5 50.7 48.2 36.2 43.3 37.1 -4.4 9.2 -2.5 -11.9 7.0 -6.2
U.S. imports from: Brazil (subject):
(1) "Reported data" are in percent and "period changes" are in percentage points.
Source: Compiled from official statistics of USDA and USDOC/CNIF.
Table C-2 FCOJM: Summary data concerning U.S. processors, crop years 2005/06 - 2010/11
(Quantity=1,000 pounds SE, value=1,000 dollars, unit values, unit labor costs, and unit expenses are per pound; period changes=percent, except where noted)
Reported data Period changes Crop years 2005/06 - 2005/06- 2006/07 - 2007/08 - 2008/09 - 2009/10 -
Item 2005/06 2006/07 2007/08 2008/09 2009/10 2010/11 2010/11 2006/07 2007/08 2008/09 2009/10 2010/11
U.S. processors': Average capacity quantity . . . . . 639,361 638,434 681,853 672,275 662,246 671,354 5.0 -0.1 6.8 -1.4 -1.5 1.4 Production quantity . . . . . . . . . . 520,340 398,717 657,277 575,125 475,896 449,913 -13.5 -23.4 64.8 -12.5 -17.3 -5.5 Capacity utilization (2) . . . . . . . . U.S. shipments:
81.4 62.5 96.4 85.5 71.9 67.0 -14.4 -18.9 33.9 -10.8 -13.7 -4.8
Quantity . . . . . . . . . . . . . . . . . . 477,081 432,603 472,866 516,451 522,979 454,037 -4.8 -9.3 9.3 9.2 1.3 -13.2 Value . . . . . . . . . . . . . . . . . . . . 594,231 693,786 513,055 453,161 665,392 708,687 19.3 16.8 -26.0 -11.7 46.8 6.5 Unit value . . . . . . . . . . . . . . . . $1.25 $1.60 $1.08 $0.88 $1.27 $1.56 25.3 28.8 -32.3 -19.1 45.0 22.7
Export shipments: Quantity . . . . . . . . . . . . . . . . . .
43,969
40,011
32,298
41,706
44,042
52,555
19.5
-9.0
-19.3
29.1
5.6
19.3
Value . . . . . . . . . . . . . . . . . . . . 46,848 71,696 46,935 48,118 57,374 92,254 96.9 53.0 -34.5 2.5 19.2 60.8 Unit value . . . . . . . . . . . . . . . . $1.07 $1.79 $1.45 $1.15 $1.30 $1.76 64.8 68.2 -18.9 -20.6 12.9 34.7
Ending inventory quantity . . . . . 157,436 83,540 235,652 252,620 161,494 104,815 -33.4 -46.9 182.1 7.2 -36.1 -35.1 Inventories/total shipments (2) . 30.2 17.7 46.6 45.3 28.5 20.7 -9.5 -12.5 29.0 -1.4 -16.8 -7.8 Production workers . . . . . . . . . . 710 686 777 811 709 709 -0.1 -3.4 13.3 4.4 -12.6 0.0 Hours worked (1,000s) . . . . . . . 1,709 1,450 1,877 2,077 1,820 1,844 7.9 -15.2 29.4 10.7 -12.4 1.3 Wages paid ($1,000s) . . . . . . . . 29,746 26,314 34,719 38,370 36,027 37,479 26.0 -11.5 31.9 10.5 -6.1 4.0 Hourly wages . . . . . . . . . . . . . . . $17.41 $18.15 $18.50 $18.47 $19.80 $20.32 16.8 4.3 1.9 -0.1 7.2 2.7 Productivity (pounds per hour) . 288.5 262.3 341.3 275.0 261.2 242.4 -16.0 -9.1 30.1 -19.4 -5.0 -7.2 Unit labor costs . . . . . . . . . . . . . $0.06 $0.07 $0.05 $0.07 $0.08 $0.08 39.0 14.7 -21.7 24.0 12.8 10.7 Net sales:
Quantity . . . . . . . . . . . . . . . . . .
397,542
318,827
312,992
390,255
407,696
348,653
-12.3
-19.8
-1.8
24.7
4.5
-14.5 Value . . . . . . . . . . . . . . . . . . . . 589,484 646,259 526,208 513,183 692,037 757,585 28.5 9.6 -18.6 -2.5 34.9 9.5 Unit value . . . . . . . . . . . . . . . . $1.48 $2.03 $1.68 $1.31 $1.70 $2.17 46.5 36.7 -17.1 -21.8 29.1 28.0
Cost of goods sold (COGS) . . . . 577,310 627,950 446,133 488,298 682,263 688,913 19.3 8.8 -29.0 9.5 39.7 1.0 Gross profit or (loss) . . . . . . . . . 12,174 18,309 80,075 24,885 9,774 68,672 464.1 50.4 337.4 -68.9 -60.7 602.6 SG&A expenses . . . . . . . . . . . . 19,476 16,664 14,928 14,337 13,914 17,491 -10.2 -14.4 -10.4 -4.0 -3.0 25.7 Operating income or (loss) . . . . (7,302) 1,645 65,147 10,548 (4,140) 51,181 (3) (3) 3,860.3 -83.8 (3) (3) Capital expenditures . . . . . . . . . 19,936 11,489 7,602 9,737 12,948 8,721 -56.3 -42.4 -33.8 28.1 33.0 -32.6 Unit COGS . . . . . . . . . . . . . . . . . $1.45 $1.97 $1.43 $1.25 $1.67 $1.98 36.1 35.6 -27.6 -12.2 33.7 18.1 Unit SG&A expenses . . . . . . . . $0.05 $0.05 $0.05 $0.04 $0.03 $0.05 2.4 6.7 -8.7 -23.0 -7.1 47.0 Unit operating income or (loss) . ($0.02) $0.01 $0.21 $0.03 ($0.01) $0.15 (3) (3) 3,934.1 -87.0 (3) (3) COGS/sales (2) . . . . . . . . . . . . . Operating income or (loss)/
sales (2) . . . . . . . . . . . . . . . . . .
97.9
(1.2)
97.2
0.3
84.8
12.4
95.2
2.1
98.6
(0.6)
90.9
6.8
-7.0
8.0
-0.8
1.5
-12.4
12.1
10.4
-10.3
3.4
-2.7
-7.7
7.4
(1) "Reported data" are in percent and "period changes" are in percentage points. (2) Undefined.
Note.--Financial data are reported on a fiscal year basis and may not necessarily be comparable to data reported on a calendar year basis. Because of rounding, figures may not add to the totals shown. Unit values and shares are calculated from the unrounded figures.
Source: Compiled from data submitted in response to Commission questionnaires.
C-3

Table C-3 NFCOJ: Summary data concerning the U.S. market,, crop years 2005/06 - 2010/11
(Quantity=1,000 gallons SSE, value=1,000 dollars, unit values are per gallon; period changes=percent, except where noted)
Reported data Period changes Crop years 2005/06 - 2005/06- 2006/07 - 2007/08 - 2008/09 - 2009/10 -
Item 2005/06 2006/07 2007/08 2008/09 2009/10 2010/11 2010/11 2006/07 2007/08 2008/09 2009/10 2010/11 NFCOJ apparent consumption:
Quantity . . . . . . . . . . . . . . . . . . . 667,119 566,352 437,211 540,516 541,856 574,000 -14.0 -15.1 -22.8 23.6 0.2 5.9 U.S. processors' share . . . . . . . Importers' share (1):
Brazil (subject) . . . . . . . . . . . .
95.9
3.7
91.0
8.5
88.5
10.9
88.3
11.5
90.8
8.6
90.6
8.7
-5.4
4.9
-4.9
4.7
-2.5
2.4
-0.2
0.6
2.5
-2.9
-0.2
0.1 Brazil (nonsubject) . . . . . . . . . . 0.0 0.0 0.0 0.0 0.0 0.0 0.0 0.0 0.0 0.0 0.0 0.0 All other sources . . . . . . . . . . . 0.3 0.5 0.6 0.2 0.6 0.7 0.4 0.2 0.1 -0.4 0.4 0.1
Total imports . . . . . . . . . . . . . 4.1 9.0 11.5 11.7 9.2 9.4 5.4 4.9 2.5 0.2 -2.5 0.2
U.S. imports from: Brazil (subject):
Quantity . . . . . . . . . . . . . . . . . . 25,011 47,870 47,465 62,062 46,630 49,909 99.5 91.4 -0.8 30.8 -24.9 7.0 Value . . . . . . . . . . . . . . . . . . . . 34,226 68,046 80,989 115,458 94,755 102,113 198.4 98.8 19.0 42.6 -17.9 7.8 Unit value . . . . . . . . . . . . . . . .
Brazil (nonsubject): Quantity . . . . . . . . . . . . . . . . . .
$1.37
(2)
$1.42
(2)
$1.71
(2)
$1.86
(2)
$2.03
(2)
$2.05
(2)
49.5
(2)
3.9
(2)
20.0
(2)
9.0
(2)
9.2
(2)
0.7
(2) Value . . . . . . . . . . . . . . . . . . . . (2) (2) (2) (2) (2) (2) (2) (2) (2) (2) (2) (2) Unit value . . . . . . . . . . . . . . . .
All other sources: Quantity . . . . . . . . . . . . . . . . . .
(2)
2,116
(2)
2,838
(2)
2,783
(2)
1,269
(2)
3,315
(2)
4,242
(2)
100.5
(2)
34.1
(2)
-1.9
(2)
-54.4
(2)
161.2
(2)
28.0 Value . . . . . . . . . . . . . . . . . . . . 4,777 7,870 5,262 2,303 9,409 9,315 95.0 64.8 -33.1 -56.2 308.5 -1.0 Unit value . . . . . . . . . . . . . . . . $2.26 $2.77 $1.89 $1.81 $2.84 $2.20 -2.7 22.8 -31.8 -4.0 56.4 -22.6
All sources: Quantity . . . . . . . . . . . . . . . . . .
27,127
50,708
50,248
63,331
49,944
54,151
99.6
86.9
-0.9
26.0
-21.1
8.4
Value . . . . . . . . . . . . . . . . . . . . 39,002 75,916 86,251 117,762 104,164 111,427 185.7 94.6 13.6 36.5 -11.5 7.0 Unit value . . . . . . . . . . . . . . . . $1.44 $1.50 $1.72 $1.86 $2.09 $2.06 43.1 4.1 14.7 8.3 12.2 -1.3
U.S. processors' U.S. shipments . 639,993 515,644 386,963 477,186 491,912 519,850 -18.8 -19.4 -25.0 23.3 3.1 5.7
U.S. exports (quantity) . . . . . . . . . 86,969 74,617 70,263 67,171 87,069 133,980 54.1 -14.2 -5.8 -4.4 29.6 53.9 Ending stocks (quantity) . . . . . . . 289,578 230,887 334,266 372,935 331,100 250,673 -13.4 -20.3 44.8 11.6 -11.2 -24.3
(1) "Reported data" are in percent and "period changes" are in percentage points. (2) Not applicable.
Source: Compiled from official statistics of USDA and USDOC/CNIF.
Table C-4 NFCOJ: Summary data concerning U.S. processors, crop years 2005/06 - 2010/11
(Quantity=1,000 pounds, value=1,000 dollars, unit values, unit labor costs, and unit expenses are per pound; period changes=percent, except where noted)
Reported data Period changes Crop years 2005/06 - 2005/06- 2006/07 - 2007/08 - 2008/09 - 2009/10 -
Item 2005/06 2006/07 2007/08 2008/09 2009/10 2010/11 2010/11 2006/07 2007/08 2008/09 2009/10 2010/11 U.S. processors':
Average capacity quantity . . . . .
860,117
863,641
869,066
870,760
868,412
869,243
1.1
0.4
0.6
0.2
-0.3
0.1 Production quantity . . . . . . . . . . 639,685 565,625 616,877 603,710 534,212 579,110 -9.5 -11.6 9.1 -2.1 -11.5 8.4 Capacity utilization (2) . . . . . . . . U.S. shipments:
Quantity . . . . . . . . . . . . . . . . . .
74.4
641,886
65.5
580,250
71.0
569,668
69.3
563,769
61.5
558,423
66.6
553,310
-7.7
-13.8
-8.9
-9.6
5.5
-1.8
-1.7
-1.0
-7.8
-0.9
5.1
-0.9 Value . . . . . . . . . . . . . . . . . . . . 1,098,753 1,304,458 1,097,587 994,242 1,000,898 1,075,534 -2.1 18.7 -15.9 -9.4 0.7 7.5 Unit value . . . . . . . . . . . . . . . . $1.71 $2.25 $1.93 $1.76 $1.79 $1.94 13.6 31.3 -14.3 -8.5 1.6 8.4
Export shipments: Quantity . . . . . . . . . . . . . . . . . .
10,270
8,627
7,307
22,213
25,494
13,599
32.4
-16.0
-15.3
204.0
14.8
-46.7
Value . . . . . . . . . . . . . . . . . . . . 15,077 16,747 14,040 34,573 39,019 24,631 63.4 11.1 -16.2 146.2 12.9 -36.9 Unit value . . . . . . . . . . . . . . . . $1.47 $1.94 $1.92 $1.56 $1.53 $1.81 23.4 32.2 -1.0 -19.0 -1.7 18.3
Ending inventory quantity . . . . . 158,562 135,311 175,211 192,940 143,234 155,435 -2.0 -14.7 29.5 10.1 -25.8 8.5 Inventories/total shipments (2) . 24.3 23.0 30.4 32.9 24.5 27.4 3.1 -1.3 7.4 2.6 -8.4 2.9 Production workers . . . . . . . . . . 1,987 1,787 1,884 1,854 1,683 1,865 -6.1 -10.1 5.4 -1.6 -9.2 10.8 Hours worked (1,000s) . . . . . . . 5,384 5,143 5,245 5,240 5,086 5,209 -3.3 -4.5 2.0 -0.1 -2.9 2.4 Wages paid ($1,000s) . . . . . . . . 108,468 107,976 111,425 113,333 106,108 119,685 10.3 -0.5 3.2 1.7 -6.4 12.8 Hourly wages . . . . . . . . . . . . . . . $20.15 $20.99 $21.24 $21.63 $20.86 $22.98 14.0 4.2 1.2 1.8 -3.5 10.1 Productivity (pounds per hour) . 118.8 110.0 117.6 115.2 105.0 111.2 -6.4 -7.4 6.9 -2.0 -8.8 5.8 Unit labor costs . . . . . . . . . . . . . Net sales:
Quantity . . . . . . . . . . . . . . . . . .
$0.17
206,709
$0.19
210,132
$0.18
181,897
$0.19
212,920
$0.20
213,719
$0.21
208,452
21.9
0.8
12.6
1.7
-5.4
-13.4
3.9
17.1
5.8
0.4
4.1
-2.5 Value . . . . . . . . . . . . . . . . . . . . 418,558 550,461 456,680 487,112 523,791 589,938 40.9 31.5 -17.0 6.7 7.5 12.6 Unit value . . . . . . . . . . . . . . . . $2.02 $2.62 $2.51 $2.29 $2.45 $2.83 39.8 29.4 -4.2 -8.9 7.1 15.5
Cost of goods sold (COGS) . . . . 339,290 487,601 393,929 410,997 456,488 500,144 47.4 43.7 -19.2 4.3 11.1 9.6 Gross profit or (loss) . . . . . . . . . 79,268 62,860 62,751 76,115 67,303 89,794 13.3 -20.7 -0.2 21.3 -11.6 33.4 SG&A expenses . . . . . . . . . . . . 58,172 42,666 34,916 40,421 47,144 48,984 -15.8 -26.7 -18.2 15.8 16.6 3.9 Operating income or (loss) . . . . 21,096 20,194 27,835 35,694 20,159 40,810 93.4 -4.3 37.8 28.2 -43.5 102.4 Capital expenditures . . . . . . . . . 20,081 12,788 14,022 21,430 70,500 38,246 90.5 -36.3 9.6 52.8 229.0 -45.8 Unit COGS . . . . . . . . . . . . . . . . $1.64 $2.32 $2.17 $1.93 $2.14 $2.40 46.2 41.4 -6.7 -10.9 10.7 12.3 Unit SG&A expenses . . . . . . . . . $0.28 $0.20 $0.19 $0.19 $0.22 $0.23 -16.5 -27.9 -5.5 -1.1 16.2 6.5 Unit operating income or (loss) . $0.10 $0.10 $0.15 $0.17 $0.09 $0.20 91.8 -5.8 59.2 9.6 -43.7 107.6 COGS/sales (2) . . . . . . . . . . . . . Operating income or (loss)/
81.1 88.6 86.3 84.4 87.2 84.8 3.7 7.5 -2.3 -1.9 2.8 -2.4
sales (2) . . . . . . . . . . . . . . . . . 5.0 3.7 6.1 7.3 3.8 6.9 1.9 -1.4 2.4 1.2 -3.5 3.1
(1) "Reported data" are in percent and "period changes" are in percentage points.
Note.--Financial data are reported on a fiscal year basis and may not necessarily be comparable to data reported on a calendar year basis. Because of rounding, figures may not add to the totals shown. Unit values and shares are calculated from the unrounded figures.
Source: Compiled from data submitted in response to Commission questionnaires.
C-4
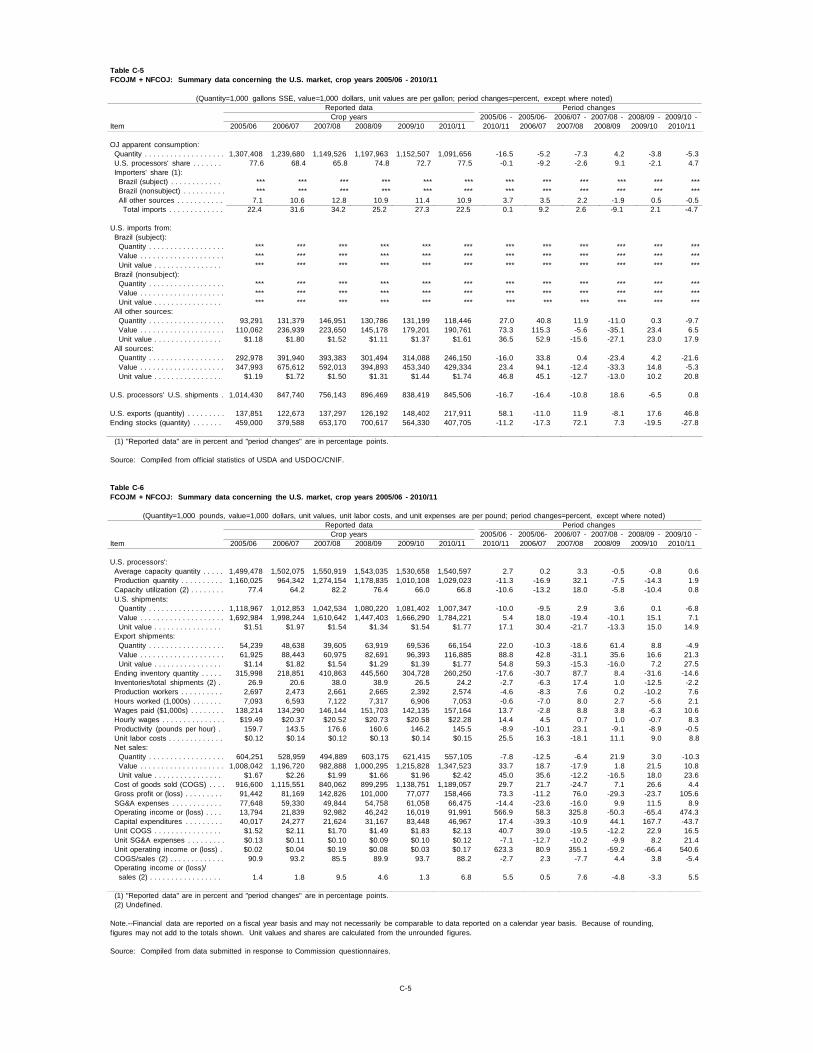
Table C-5 FCOJM + NFCOJ: Summary data concerning the U.S. market, crop years 2005/06 - 2010/11
(Quantity=1,000 gallons SSE, value=1,000 dollars, unit values are per gallon; period changes=percent, except where noted)
Reported data Period changes Crop years 2005/06 - 2005/06- 2006/07 - 2007/08 - 2008/09 - 2009/10 -
Item 2005/06 2006/07 2007/08 2008/09 2009/10 2010/11 2010/11 2006/07 2007/08 2008/09 2009/10 2010/11
OJ apparent consumption:
Quantity . . . . . . . . . . . . . . . . . . . 1,307,408
1,239,680
1,149,526
1,197,963
1,152,507
1,091,656
-16.5
-5.2
-7.3
4.2
-3.8
-5.3
U.S. processors' share . . . . . . . Importers' share (1):
Brazil (subject) . . . . . . . . . . . .
77.6
***
68.4
***
65.8
***
74.8
***
72.7
***
77.5
***
-0.1
***
-9.2
***
-2.6
***
9.1
***
-2.1
***
4.7
*** Brazil (nonsubject) . . . . . . . . . . *** *** *** *** *** *** *** *** *** *** *** *** All other sources . . . . . . . . . . . 7.1 10.6 12.8 10.9 11.4 10.9 3.7 3.5 2.2 -1.9 0.5 -0.5
Total imports . . . . . . . . . . . . . 22.4 31.6 34.2 25.2 27.3 22.5 0.1 9.2 2.6 -9.1 2.1 -4.7
U.S. imports from: Brazil (subject):
Quantity . . . . . . . . . . . . . . . . . .
***
***
***
***
***
***
***
***
***
***
***
*** Value . . . . . . . . . . . . . . . . . . . . *** *** *** *** *** *** *** *** *** *** *** *** Unit value . . . . . . . . . . . . . . . .
Brazil (nonsubject): Quantity . . . . . . . . . . . . . . . . . .
***
***
***
***
***
***
***
***
***
***
***
***
***
***
***
***
***
***
***
***
***
***
***
*** Value . . . . . . . . . . . . . . . . . . . . *** *** *** *** *** *** *** *** *** *** *** *** Unit value . . . . . . . . . . . . . . . .
All other sources: Quantity . . . . . . . . . . . . . . . . . .
***
93,291
***
131,379
***
146,951
***
130,786
***
131,199
***
118,446
***
27.0
***
40.8
***
11.9
***
-11.0
***
0.3
***
-9.7 Value . . . . . . . . . . . . . . . . . . . . 110,062 236,939 223,650 145,178 179,201 190,761 73.3 115.3 -5.6 -35.1 23.4 6.5 Unit value . . . . . . . . . . . . . . . . $1.18 $1.80 $1.52 $1.11 $1.37 $1.61 36.5 52.9 -15.6 -27.1 23.0 17.9
All sources: Quantity . . . . . . . . . . . . . . . . . .
292,978
391,940
393,383
301,494
314,088
246,150
-16.0
33.8
0.4
-23.4
4.2
-21.6
Value . . . . . . . . . . . . . . . . . . . . 347,993 675,612 592,013 394,893 453,340 429,334 23.4 94.1 -12.4 -33.3 14.8 -5.3 Unit value . . . . . . . . . . . . . . . . $1.19 $1.72 $1.50 $1.31 $1.44 $1.74 46.8 45.1 -12.7 -13.0 10.2 20.8
U.S. processors' U.S. shipments . 1,014,430 847,740 756,143 896,469 838,419 845,506 -16.7 -16.4 -10.8 18.6 -6.5 0.8
U.S. exports (quantity) . . . . . . . . . 137,851 122,673 137,297 126,192 148,402 217,911 58.1 -11.0 11.9 -8.1 17.6 46.8 Ending stocks (quantity) . . . . . . . 459,000 379,588 653,170 700,617 564,330 407,705 -11.2 -17.3 72.1 7.3 -19.5 -27.8
(1) "Reported data" are in percent and "period changes" are in percentage points.
Source: Compiled from official statistics of USDA and USDOC/CNIF.
Table C-6 FCOJM + NFCOJ: Summary data concerning the U.S. market, crop years 2005/06 - 2010/11
(Quantity=1,000 pounds, value=1,000 dollars, unit values, unit labor costs, and unit expenses are per pound; period changes=percent, except where noted)
Reported data Period changes Crop years 2005/06 - 2005/06- 2006/07 - 2007/08 - 2008/09 - 2009/10 -
Item 2005/06 2006/07 2007/08 2008/09 2009/10 2010/11 2010/11 2006/07 2007/08 2008/09 2009/10 2010/11 U.S. processors':
Average capacity quantity . . . . . 1,499,478
1,502,075
1,550,919
1,543,035
1,530,658
1,540,597
2.7
0.2
3.3
-0.5
-0.8
0.6
Production quantity . . . . . . . . . . 1,160,025 964,342 1,274,154 1,178,835 1,010,108 1,029,023 -11.3 -16.9 32.1 -7.5 -14.3 1.9 Capacity utilization (2) . . . . . . . . 77.4 64.2 82.2 76.4 66.0 66.8 -10.6 -13.2 18.0 -5.8 -10.4 0.8 U.S. shipments:
Quantity . . . . . . . . . . . . . . . . . . 1,118,967
1,012,853
1,042,534
1,080,220
1,081,402
1,007,347
-10.0
-9.5
2.9
3.6
0.1
-6.8
Value . . . . . . . . . . . . . . . . . . . . 1,692,984 1,998,244 1,610,642 1,447,403 1,666,290 1,784,221 5.4 18.0 -19.4 -10.1 15.1 7.1 Unit value . . . . . . . . . . . . . . . .
Export shipments: $1.51 $1.97 $1.54 $1.34 $1.54 $1.77 17.1 30.4 -21.7 -13.3 15.0 14.9
Quantity . . . . . . . . . . . . . . . . . . 54,239 48,638 39,605 63,919 69,536 66,154 22.0 -10.3 -18.6 61.4 8.8 -4.9 Value . . . . . . . . . . . . . . . . . . . . 61,925 88,443 60,975 82,691 96,393 116,885 88.8 42.8 -31.1 35.6 16.6 21.3 Unit value . . . . . . . . . . . . . . . . $1.14 $1.82 $1.54 $1.29 $1.39 $1.77 54.8 59.3 -15.3 -16.0 7.2 27.5
Ending inventory quantity . . . . . 315,998 218,851 410,863 445,560 304,728 260,250 -17.6 -30.7 87.7 8.4 -31.6 -14.6 Inventories/total shipments (2) . 26.9 20.6 38.0 38.9 26.5 24.2 -2.7 -6.3 17.4 1.0 -12.5 -2.2 Production workers . . . . . . . . . . 2,697 2,473 2,661 2,665 2,392 2,574 -4.6 -8.3 7.6 0.2 -10.2 7.6 Hours worked (1,000s) . . . . . . . 7,093 6,593 7,122 7,317 6,906 7,053 -0.6 -7.0 8.0 2.7 -5.6 2.1 Wages paid ($1,000s) . . . . . . . . 138,214 134,290 146,144 151,703 142,135 157,164 13.7 -2.8 8.8 3.8 -6.3 10.6 Hourly wages . . . . . . . . . . . . . . . $19.49 $20.37 $20.52 $20.73 $20.58 $22.28 14.4 4.5 0.7 1.0 -0.7 8.3 Productivity (pounds per hour) . 159.7 143.5 176.6 160.6 146.2 145.5 -8.9 -10.1 23.1 -9.1 -8.9 -0.5 Unit labor costs . . . . . . . . . . . . . Net sales:
Quantity . . . . . . . . . . . . . . . . . .
$0.12
604,251
$0.14
528,959
$0.12
494,889
$0.13
603,175
$0.14
621,415
$0.15
557,105
25.5
-7.8
16.3
-12.5
-18.1
-6.4
11.1
21.9
9.0
3.0
8.8
-10.3 Value . . . . . . . . . . . . . . . . . . . . 1,008,042 1,196,720 982,888 1,000,295 1,215,828 1,347,523 33.7 18.7 -17.9 1.8 21.5 10.8 Unit value . . . . . . . . . . . . . . . . $1.67 $2.26 $1.99 $1.66 $1.96 $2.42 45.0 35.6 -12.2 -16.5 18.0 23.6
Cost of goods sold (COGS) . . . . 916,600 1,115,551 840,062 899,295 1,138,751 1,189,057 29.7 21.7 -24.7 7.1 26.6 4.4 Gross profit or (loss) . . . . . . . . . 91,442 81,169 142,826 101,000 77,077 158,466 73.3 -11.2 76.0 -29.3 -23.7 105.6 SG&A expenses . . . . . . . . . . . . 77,648 59,330 49,844 54,758 61,058 66,475 -14.4 -23.6 -16.0 9.9 11.5 8.9 Operating income or (loss) . . . . 13,794 21,839 92,982 46,242 16,019 91,991 566.9 58.3 325.8 -50.3 -65.4 474.3 Capital expenditures . . . . . . . . . 40,017 24,277 21,624 31,167 83,448 46,967 17.4 -39.3 -10.9 44.1 167.7 -43.7 Unit COGS . . . . . . . . . . . . . . . . $1.52 $2.11 $1.70 $1.49 $1.83 $2.13 40.7 39.0 -19.5 -12.2 22.9 16.5 Unit SG&A expenses . . . . . . . . . $0.13 $0.11 $0.10 $0.09 $0.10 $0.12 -7.1 -12.7 -10.2 -9.9 8.2 21.4 Unit operating income or (loss) . $0.02 $0.04 $0.19 $0.08 $0.03 $0.17 623.3 80.9 355.1 -59.2 -66.4 540.6 COGS/sales (2) . . . . . . . . . . . . . Operating income or (loss)/
sales (2) . . . . . . . . . . . . . . . . .
90.9
1.4
93.2
1.8
85.5
9.5
89.9
4.6
93.7
1.3
88.2
6.8
-2.7
5.5
2.3
0.5
-7.7
7.6
4.4
-4.8
3.8
-3.3
-5.4
5.5
(1) "Reported data" are in percent and "period changes" are in percentage points. (2) Undefined.
Note.--Financial data are reported on a fiscal year basis and may not necessarily be comparable to data reported on a calendar year basis. Because of rounding, figures may not add to the totals shown. Unit values and shares are calculated from the unrounded figures.
Source: Compiled from data submitted in response to Commission questionnaires.
C-5


D-1
APPENDIX D
RESPONSES OF U.S. EXTRACTOR/PROCESSORS, U.S. GROWERS, U.S. IMPORTERS, AND U.S. PURCHASERS CONCERNING THE SIGNIFICANCE OF THE ANTIDUMPING DUTY FINDING AND THE LIKELY EFFECTS OF
REVOCATION


D-3
U.S. EXTRACTOR/PROCESSORS’ COMMENTS REGARDING THE SIGNIFICANCE OF THE ANTIDUMPING DUTY ORDER AND THE LIKELY EFFECTS OF REVOCATION
The Commission requested U.S. extractor/processors to describe any changes in the character of their operations or organizations relating to the production of certain orange juice in the future if the antidumping duty finding on certain orange juice from Brazil were to be revoked. (Question II- 4). The following are quotations from the responses of extractor/processors.
* * * * * * *
The Commission requested U.S. extractor/processors to describe the significance of the existing antidumping finding covering imports of certain orange juice from Brazil in terms of its effect on their firm’s production capacity, production, U.S. shipments, inventories, purchases, employment, revenues, costs, profits, cash flow, capital expenditures, research and development expenditures, and asset values. (Question II-17.) The following are quotations from the responses of extractor/processors.
* * * * * * *
The Commission requested U.S. extractor/processors to describe any anticipated changes in their production capacity, production, U.S. shipments, inventories, purchases, employment, revenues, costs, profits, cash flow, capital expenditures, research and development expenditures, and asset values relating to the production of certain orange juice in the future if the antidumping duty finding on certain orange juice were revoked. (Question II-18.) The following are quotations from the responses of extractor/processors.
* * * * * * *

D-4
U.S. GROWERS’ COMMENTS REGARDING THE SIGNIFICANCE OF THE ANTIDUMPING DUTY ORDER AND THE LIKELY EFFECTS OF REVOCATION
The Commission requested U.S. growers to describe any changes in the character of their operations or organizations relating to the growing of oranges for the production of certain orange juice in the future if the antidumping duty finding on certain orange juice from Brazil were to be revoked. (Question II-4). The following are quotations from the responses of growers.
* * * * * * *
The Commission requested U.S. growers to describe the significance of the existing antidumping finding covering imports of certain orange juice from Brazil in terms of its effect on their firm’s production capacity, production, U.S. shipments, inventories, purchases, employment, revenues, costs, profits, cash flow, capital expenditures, research and development expenditures, and asset values. (Question II-13.) The following are quotations from the responses of growers.
* * * * * * *
The Commission requested U.S. growers to describe any anticipated changes in their production capacity, production, U.S. shipments, inventories, purchases, employment, revenues, costs, profits, cash flow, capital expenditures, research and development expenditures, and asset values relating to the production of certain orange juice in the future if the antidumping duty finding on certain orange juice were revoked. (Question II-14.) The following are quotations from the responses of extractor/processors.

D-5
U.S. IMPORTERS’ COMMENTS REGARDING THE SIGNIFICANCE OF THE ANTIDUMPING DUTY ORDER AND THE LIKELY EFFECTS OF REVOCATION
The Commission requested U.S. importers to describe any anticipated changes to the character of their operations or organizations relating to the importation of certain orange juice in the future if the antidumping duty order were to be revoked. (Question II-4.) The following are quotations from the responses of U.S. importers.
* * * * * * *
The Commission requested U.S. importers to describe the significance of the existing antidumping duty order covering imports of certain orange juice from Brazil in terms of its effect on their imports, U.S. shipments of imports, and inventories. (Question II-12). The following are quotations from the responses of importers.
* * * * * * *
The Commission requested U.S. importers to describe any anticipated changes in their imports, U.S. shipments of imports, or inventories of certain orange juice in the future if the existing antidumping duty order was revoked. (Question II-13). The following are quotations from the responses of importers.
* * * * * * *
D-6
U.S. PURCHASER COMMENTS REGARDING THE SIGNIFICANCE OF THE ANTIDUMPING DUTY ORDER AND THE LIKELY EFFECTS OF REVOCATION
The Commission asked U. S. purchasers to comment on the likely effect of any revocation of the antidumping duty order covering certain orange juice from Brazil. They were asked to discuss the potential effects of revocation of the antidumping duty order in terms of (1) the future activities of their firm and (2) the U.S. market as a whole. (Question III-36). Their responses are as follows.
* * * * * * *

E-1
APPENDIX E
MONTHLY PRICE AND QUANTITY DATA


E-3
Figure E -1 C ertain orange juice: M onth-by-m onth w eighted-average f.o.b. prices of dom estic and im ported subject product 1, by crop year, O ctober 2005-S eptem ber 2011
* * * * * * *
Figure E -2 C ertain orange juice: M onth-by-m onth w eighted-average f.o.b. prices of dom estic and im ported subject product 2, by crop year, O ctober 2005-S eptem ber 2011
* * * * * * *
Figure E -3 C ertain orange juice: M onth-by-m onth quantities of dom estic products 1 and 2, by crop year, O ctober 2005-S eptem ber 2011
* * * * * * *
Figure E -4 C ertain orange juice: M onth-by-m onth quantities of subject im ported products 1 and 2, by crop year, O ctober 2005-S eptem ber 2011
* * * * * * *