cerebral edema after rapid dialysis is not caused by an increase
TRANSCRIPT

1600 Volume 6 ‘ Number #{243}‘ 1995
Cerebral Edema After Rapid Dialysis Is Not Caused by anIncrease in Brain Organic Osmolytes1Stephen M. Silver2
SM. Silver, University of Rochester School of Medicine,Rochester General Hospital, Department of Medicine/Nephrology Unit, Rochester, NY
(J, Am. Soc. Nephrol. 1995; 6: 1600-1 oO#{243})
ABSTRACTDialysis disequilibrium syndrome (DDS) is character-ized by the neurologic deterioration and cerebraledema that occurs after hemodialysis. To investigatethe pathogenesis of DDS, the effects of rapid hemodi-alysis on brain electrolytes, urea, and several organicosmolytes were studied in the rat. Forty-two h afterbilateral ureteral ligation, 1 1 uremic rats were hemo-dialyzed for 90 mm, yielding a decrease in plasmaurea from 96 ± 4 to 44 ± 5 mM (p < 0.01). This groupwas compared with 10 uremic and 1 1 nonuremicanimals that were not dialyzed. In dialyzed animals,compared with nondlalyzed uremic controls, therewas an Increase in brain water (3.98 ± 0.02 versus 3.77± 0.02 L/kg dry wt; P < 0.0)) and the brain to plasma(urea) ratio (1 .32 versus 0.65). There was no significantdifference in the brain content of sodium and potas-slum between groups. The retention of brain urea,
despite the large decrease in plasma urea concen-tration, was able to account for the increase in brain
water observed in rapidly dialyzed animals. Majororganic osmolytes in the brain, including glutamine,glutamate, taurine and myoinositol, did not increasesignificantly after rapid dialysis. Cerebral edema inthis model of DDS was primarily due to a large brain-to-plasma urea gradient, not to the formation oforganic osmolytes.
Key Words: Disequilibrium. hemodialysis. urea. renal failure
(acute), organic osmolytes
T he dialysis disequilibrium syndrome (DDS) ischaracterized by cerebral edema. seizures, and
coma developing toward the end of a hemodialysistreatment ( 1 ). It was first hypothesized that the slow
removal of urea from the brain during acute hemodi-
alysis establishes a brain-to-plasma gradient that
promotes osmotically induced brain swelling. i.e. . the“reverse urea effect” (2.3). However, Arieffand cowork-
1 ReceIved January 29. 1995. Accepted June 5. 1995.
2 Correspondence to Dr. SM. Silver, Rochester General Hospital, Nephrology Unit.
1425 Portland Ave., Rochester, NY 14621.
104&6673/0606-1600$03.00/0Journal of the American Society of NephrologyCopyright C 1995 by the American Society of Nephrology
ens concluded that the Increase in brain water ob-
served in studies of rapidly dialyzed dogs could not be
accounted for by the retention ofbrain urea (4). On thebasis of the presence of an increased brain tissue-to-
plasma osmolality in rapidly dialyzed animals, those
investigators attributed the cerebral edema to the
formation of “idiogenic osmoles. “ We recently reex-pbored this issue in a study of rapidly hemodialyzed
rats and found that after acute hemodialysis, a large
brain-to-plasma urea gradient developed that could
account for the increase in brain water observed (5).This suggested that the reverse urea gradient was
responsible for the cerebral edema observed in our
model of DDS but did not rule out the concomitant
formation of idiogenic osmobes. These idiogenic os-
moles have now been identified as specific brain or-
ganic osmolytes that appear to change in an adaptivemanner in response to changes in plasma tonicity(6-8). Major brain organic osmolytes include glu-
tamine, glutamate, taunine, and myoinositol. The aim
of this study was to assess the contribution of organic
osmobytes to cerebral edema In our model of DDS in
the rat.
METHODS
Three groups of male Sprague-Dawley rats (Holtzmann,Madison, WI) weighing 300 to 400 g were studied: Group I,normal controls: 1 1 nonuremic animals that did not receivedialysis: Group II, uremic nondialyzed controls: 10 acutelyuremic animals that did not receive dialysis; Group III. modelof DDS: 1 1 acutely uremic animals dialyzed for 90 mmagainst dialysate without urea. Animals In Groups II and IIIunderwent bilateral ureteral ligation under pentobarbitalanesthesia (50 mg!kg Ip) via abdominal incisions; anesthe-tized animals in Group I underwent sham surgery. In allgroups. at the time of surgery, femoral arterial lines (PE 50)were inserted and placed subcutaneously. In Group III, afemoral venous line was also placed. All groups were then feda low-sodium and low-potassium tube-feeding diet (ICN Nu-tritlonal Blochemicals. Cleveland, OH; 2.7 mL of water!g ofdry feed) to which sodium bicarbonate was added (final con-centration, 75 mM). Five feedings were given by gavage over 42h (21 mL!100 g body wt per 42 h). Animals in Group I weregiven 2 mL of additional water per feeding to compensate forurinary losses. This regimen yielded uremic, normonatremicanimals without significant acidemia In Groups II and III (Ta-bles 1 and 2). Blood (1 .5 mL) was obtained from the femoralartery immediately before euthanasia in Groups I and II. InGroup III, blood was obtained 1 mAn before dialysis was initi-ated and 1 ruIn after dialysis was completed. followed byeuthanasia.
The technique for the hemodialysis of rats was slightlymodified from that described previously (5). Forty-two h afternephrectomy, animals to be dialyzed were placed In restrain-ing cages on a digital platform scale to allow the continuousmonitoring of body weight. Blood pressure was measured byconnecting the femoral arterial line to a transducer; animals

Silver
Journal of the American Society of Nephrology 1601
TABLE 1 . Plasma values
Parameter Nonuremic Controls Ure mic, NondialyzedUremic, Pre-dialysis and
Post-dialysis RapidDialysis
Plasma Sodium (mM)Predialysis 140 ± 1 139 ± 1 138 ± 1
Postdialysis 143 ± 2#{176}Plasma Urea (mM)
Predialysis 8. 1 ± 09b 1 1 1 ± 4 96 ± 4
Postdialysis 44 ± 5#{176}
Plasma Glucose (mM)Predialysis 10 ± 1� 15 ± 1 12 ± 1
Postdlalysls 16 ± 1#{176}
Plasma Taurine (mM)Predlalysis 0.8 ± 0.2#{176} 5.1 ± 0.3 4.6 ± 0.4Postdialysis 2.7 ± 0.3#{176}
Plasma osmolality (mosm/kg)Predialysis 312 ± 2 381 ± 4 372 ± 6
Postdialysls 339 ± 4
pH
Predialysis 7.43 ± 0.02 7.39 ± 0.03 7.42 ± 0.02Postdialysis 7.52 ± 0.02#{176}
PC02 (mm Hg)Predialysis 34 ± 1b 40 ± 2 40 ± 1
Postdialysis 33 ± 2#{176}P02 (mm Hg)
Predialysis 95 ± 2b 1 14 ± 6 120 ± 4Posfdialysis 137 ± 5#{176}
HematocritPredialysis 43 ± 1b 38 ± 2 38 ± 1
Postdialysis 26 ± 1#{176}
a p < 0.05 versus predialysis value of same group.b p < 0.05 versus all other groups.
C p < 0.05 versus uremic. nondialyzed group.
TABLE 2. Brain tissue water and electrolytes
.Parameter Nonuremic Controls . .
Uremic, NondialyzedUremic, Post-Rapid
.
Dialysis
Brain Water (L/kg dry wt) 3.86 ± 0.02#{176} 3.77 ± 0.02#{176} 3.98 ± 0.02#{176}Brain Sodium
Concentration (mM/L of brain water) 63.2 ± 0.6 64.7 ± 0.7 60.5 ± 0,9b
Content (mmol/kg dry wf) 242 ± 2 242 ± 3 239 ± 3
Brain PotassiumConcentration (mM/L of brain water) 134 ± 1 138 ± 1 131 ± 1 b
Content (mmol/kg dry wt) 513 ± 5 515 ± 5 518 ± 5
Brain Sodium + PotassiumConcentration (mM/I of brain water) 197 ± 1 203 ± 2 191 ± 2Content (mmol/kg dry wt) 755 ± 7 756 ± 8 757 ± 8
a p < 0.05 versus all other groups.b p < 0.05 versus uremic, nondialyzed group.
with a mean arterial blood pressure less than 100 mm Hgwere not dialyzed or studied further. Femoral arterial andvenous lines were attached to plastic tubing (Tygon #13;
Cole-Parmer, Chicago. IL) that was In turn attached to ahollow-fiber cuprophane dialyzer with a surface area of 250cm2 (kindly provided by Baxter Corporation, Deerfield, IL).Before dialysis. each animal was given 4.5 mL of normal
saline, an amount equal to the volume of the extracorporealcircuit volume (3.0 mL) and the volume of blood removed forplasma and blood gas analysis ( 1 .5 mL). Heparin was admin-istered In a 2,000-U bolus, followed by a 1 .000-U/h infusionInto the arterial line to prevent dialyzer clotting. The dialysatecontained: sodium, 135 mM; bicarbonate, 30 mM; potas-slum, 4 mM; chloride, 1 13 mM; calcium, 1.25 mM; magne-

Cerebral Edema After Rapid Dialysis
1602 Volume 6 ‘ Number #{243}‘ 1995
slum, 1 .5 mM; and glucose, 1 1 mM. Dialysate temperaturewas maintained at 37#{176}C.
Dialysis was performed for 90 mm. Arterial blood wasdelivered by an occlusive pump (Microprocessor Pump DriveModel 7524-01 ; Cole-Parmen) at a blood flow rate of 0.8mL/mln per 100 g body wt and returned through the femoralvenous line. The countercurrent dialysate flow rate was 20mL/min. The animal was kept at constant weight by theInfusion ofdialysate Into the venous line via a syringe pump.
Plasma Composition
Plasma measurements included sodium and potassium byflame photometry (Instrumentation Laboratory Model 443;Boston, MA) and arterial blood pH, P,�02, and P02 (Instrumen-tatlon Laboratory Model 1 304 Blood Gas Analyzer). Plasmaurea, glucose, myoinositol, taunine, glutamine, betaine, andglycerol phosphorylcholine (GPC) were measured by high-performance liquid chromatography (HPLC) as describedbelow.
Brain Composition
Immediately after decapitation, the head was cut sagitallywith a scroll saw. The evenly bissected brain was removed byscooping the two hemispheres from the two halves of thecranium.
Within 15 5 after decapitation, one-half of the brain wasplaced in liquid nitrogen and stored at - 70#{176}C.Before analy-515 by HPLC, the frozen tissue was crushed to a fine powderunder liquid nitrogen. The other half of the brain wasweighed within 30 s after removal from the skull, dried at100#{176}Cfor 48 h. and then reweighed to determine watercontent. The dried brain tissue was crushed and dissolved In0.75 M HNO3 for sodium and potassium analysis by flamephotometry.
HPLC Analysis
Urea, Glucose, myo-Inositol. Taunine, Betaine, and GPC(Plasma and Brain Tissue). Concentrations of these soluteswere measured by HPLC as described by Wolff et at. (9).Plasma was extracted by the addition of an equal volume of6% perchlonic acid with 1 mM maltose as internal standard.Tissue samples were extracted by the addition of 300 j.tL ofIce-cold 6% perchlonic acid with 1 mM maltose per 50 mg oftissue and vortexing for 1 mm. The extracts were centrifugedat 2,000 g for 10 mm at 4#{176}C.The resulting supernatants wereremoved and neutralized with 30% potassium hydroxide.Lipid was removed by passing the neutralized extractthrough a Sep-Pak C- 18 cartridge (Waters ChromatographyDivision, Millipore Corp.. Millard, MA). An aliquot of 80 jtL ofextract was injected into a Waters HPLC system, fractionatedon a Sugar Pak 1 column (Waters), and eluted with 0. 1 mMcalcium disodium EDTA at 0.5 mL/mmn and 80#{176}C.Metabo-lites were detected with a refractive index detector (Model410; Waters). Levels were quantified on a Waters 840 dataand chromatography control station.
Amino Acids (Brain Tissue Only). Amino acids were mea-sured by reverse-phase HPLC as described by Gunawan et at.( 10). Tissue was extracted by the addition of 300 �L ofIce-cold 0. 1 N hydrochloric acid and 0.4 mM methioninesulfone per 50 mg of tissue, followed by vortexing for 1 mm.The extracts were centrifuged at 2,000 g for 10 mm at 4#{176}C.The supernatants were then deprotemnized by centrifugationthrough an Ultrafree MC- 10,000 NMWL ifiter unit (MilliporeCorp.). Samples of deproteinized tissue (50 �L) were deny-Itized with phenylisothiocyanate (Pierce Chemical Company,
Rockford, IL) and redissolved in 200 �iL of Picotag SampleDiluent (Waters). The samples were each passed throughMillex HV 0.45-j.�m-pore-size filters (Millipore). Samples andstandard were injected onto a Waters reverse-phase HPLCsystem and fractionated on a Picotag Column (Waters).Amino acids measured included those considered to be brainorganic osmolytes: alanine, aspartic acid, y-amlnobutynicacid, glutamic acid, glutamine, glycine. lysine, senine, tau-nine, and threonine (8). Levels were quantified on a Waters840 data and chromatography control station.
Statistical Methods
Data are expressed as mean values ± SE. Differencesbetween groups for all brain analyses and for predialysisplasma analyses were assessed by one-factor analysis ofvariance with significance determined by the Scheffe F-test(Statvlew 1 . 1 Brain Power, Calabasas, CA). A paired t testwas used to assess differences within Group III predlalysisand postdialysis. Significance was accepted at the P < 0.05level.
RESULTS
Plasma Analysis
Plasma values are shown in Table 1 . Predialysis
plasma sodium levels were equivalent in all groups,
and there was no significant difference in plasma urea
bevels between uremic groups. Plasma glucose levelswere increased in all groups, but more so in uremic,nondialyzed animals. Plasma taunine levels were alsosignificantly increased in both unemic groups. Uremic
groups were not acidotic or hypoxic.
After 90 mm of hemodialysis, plasma urea levels
decreased 54%. Plasma taurine levels also declined,and plasma sodium and glucose levels increased. The
increase in plasma pH after dialysis was in large partsecondary to a decrease in plasma P(02 levels. The
large decrease in the hematocrit levels after dialysismay have been secondary to hemolysis due to rapid
blood flow through the dialysis access lines; no obvi-
ous hemorrhage was observed.
Brain Composition
Brain tissue water and electrolyte values are shownin Table 2. Amounts ofbrain water in uremic, nondia-
lyzed animals were about 2% less than in nonuremic
controls. Amounts ofbrain water postdialysis were 3%
higher than in normal controls and almost 6% higherthan in the uremic non-dialyzed group. despite the
increases in plasma sodium and glucose levels indialyzed animals. There were no sIgnificant differ-ences in the brain content of sodium, potassium, or
their sums between any of the groups, and thus, the
cerebral edema observed in dialyzed animals couldnot be accounted for by an increase In brain electro-byte content. The ratio of brain-to-plasma urea con-centration was less than one in nondialyzed uremicgroups but significantly more than one after dialysis(Figure 1 ). There was no significant rise in major(Table 3) or minor (Table 4) organIc osmolytes after

r’- p<O.O51.32
2.0
,<w� 1.5
U)
a-� 0.5
0
and, thus,
Silver
Journal of the American Society of Nephrology 1603
UREMIC RAPIDLY DIALYZED
NON-DIALYZED
Figure 1 . Ratio of brain water to plasma (urea) in acutely
uremic, nondialyzed animals compared with acutely ure-
mic animals after 90 mm of hemodialysis.
dialysis when compared with the non-dialyzed uremic
group.
Predicted Brain Water
On the basis of several assumptions, the change in
brain water amounts after acute dialysis as a result of
the change in brain urea content can be estimated (5).
First, it is assumed that the brain and plasma are in
osmotic equilibrium. Then. the change in brain water
(BW) predicted by the measured change in plasma
osmobality (Posm) and brain solute (Bsol) predialysis
and postdialysis by the use of the following relation-
ship was:
Posm (pre) Bsol (pre)/BW (pre)
Posm (post) Bsol (post)/BW (post)
BW_(post) Posm_(pre)Bsol(post)
BW (pre) � Posm (post)Bsol(pre)
In this study, the brain electrolyte content did not
differ between groups. If it is assumed that at osmotic
equilibrium, brain solute content equals the product
of plasma osmolality and brain water content and that
all brain solutes except urea remained constant dun-
ing dialysis. then
Bsol (post) = [Posm (pre) X BW (pre)1
thus,
+ �\ brain urea content
BW (post)/BW(pre)
- [Posm(pre) x BW(pre)] + � brain urea content
- Posm(post) x BW(pre)
If values for brain water and urea content in the
nondialyzed uremic animals are entered into the
above formula as prediabysis values, a predicted value
for postdialysis brain water content can be calculated
from the predialysis and postdialysis plasma osmola-
lity values and the predialysis and postdialysis brain
urea content. This calculation provides the change inbrain water that would be expected if brain solute
content were to remain constant during dialysis ex-
cept for the modest reduction in brain urea.
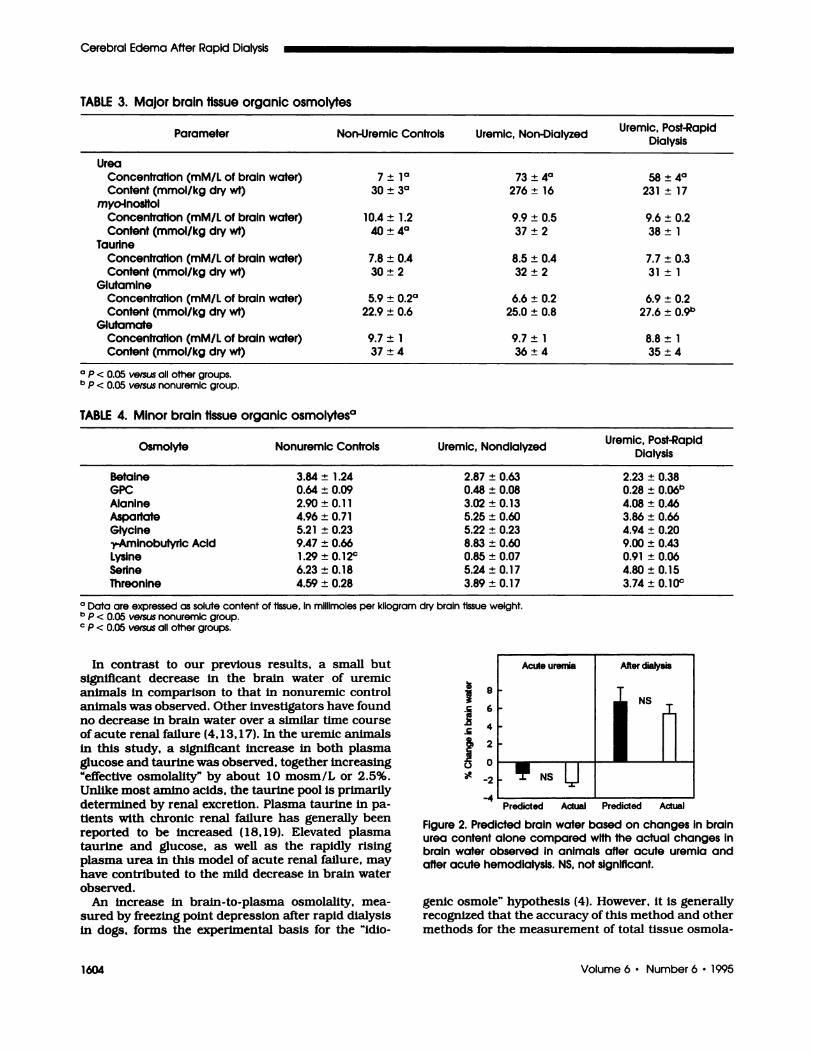
The difference between actual and predicted values
(5.4 ± 1 .0 versus 6.7 ± 1 .7%) was statistically insig-
nificant, suggesting that the change in brain urea
content alone can account for the increase in brain
water after dialysis (Figure 2). Similarly, one can
predict the change in brain water in acute uremia
using values of nonuremic control animals as preure-
mic values. Again. assuming that the only brain solute
that changed was urea, the difference between actual
and predicted values (-2.2 ± 0.6 versus - 1 .2 ± 0.5%)
was also insignificant (Figure 2).
DISCUSSION
Controversy regarding the pathogenesis of DDS re-
mains active ( 1 1 ). This study confirms and extends
our findings supporting the role of the “reverse urea
effect” in the pathogenesis of DDS. It again was ob-
served that a significant increase in brain water oc-
curred after rapid hemodialysis. In association with
the increase in brain water. a larger reversal of the
brain-to-plasma urea concentration ratio occurred.
Despite a decrease in plasma urea concentration of
over 50%, brain urea content did not decrease signif-
icantly and this retained urea was more than enough
to account for the cerebral edema observed. The find-
ings are in agreement with the brain dehydration that
has been observed after intravenous urea injection
and the approximately 8-h time period required for
urea to reach a steady state in the brain after an acute
increase in plasma [urea] (12). The finding that dialy-
sis with an isosmolar urea bath prevents cerebral
edema lends further support to the reverse urea effectand makes an effect of the dialysis procedure itself on
brain water unlikely (5).
Our previous finding that brain urea concentration
was consistently less than that of plasma was con-
firmed in this study. which used a different method tomeasure tissue urea concentration (5). This observa-tion has been questioned because it was presumed
that urea moves freely across the blood-brain barrier,
and therefore, levels in brain and plasma must be
equal in a steady state, as experimental studies in the
dog have indicated ( 1 1 ). However, our finding of adecreased brain-to-plasma tissue urea concentrationis consistent with that of other studies in the rat
( 13, 14), and there is some evidence that the perme-
ability of the central nervous system to urea in dogs is
higher than in several other species ( 15). In studiesusing [ ‘4C]urea in the rat, it appears that even understeady-state conditions, plasma urea concentration is
about 20% higher than brain urea concentration,
which is about 1 0% higher than that of cerebrospmnal
fluid (CSF) urea ( 1 6). The CSF appears to act as a
“sink” for urea: the production of CSF with a low urea
concentration relative to brain combines with the bulk
flow of CSF into the venous blood to maintain a
brain-to-CSF urea gradient.
.c
I.)
8
6
4
2
0
-2
-4
Cerebral Edema After Rapid Dialysis
1604 Volume 6 . Number 6 - 1995
TABLE 3. Major brain tissue organic osmolytes
Parameter Non-Uremic Cont rols Uremic, Non-DialyzedUremic, Post-Rapid
Dialysis
UreaConcentration (mM/I of brain water) 7 ± 1#{176} 73 ± 4#{176} 58 ± 4#{176}Content (mmol/kg dry wt) 30 ± 3#{176} 276 ± 16 231 ± 17
myo.lnositolConcentration (mM/L of brain water) 10.4 ± 1.2 9.9 ± 0.5 9.6 ± 0.2
Content (mmol/kg dry WI) 40 ± 4#{176} 37 ± 2 38 ± 1Taurine
Concentration (mM/L of brain water) 7.8 ± 0.4 8.5 ± 0.4 7.7 ± 0.3Content (mmol/kg dry wt) 30 ± 2 32 ± 2 31 ± 1
GlutamineConcentration (mM/L of brain water) 5.9 ± 0.2#{176} 6.6 ± 0.2 6.9 ± 0.2Content (mmol/kg dry wt) 22.9 ± 0.6 25.0 ± 0.8 27.6 ± 09b
GlutamateConcentration (mM/L of brain water) 9.7 ± 1 9.7 ± 1 8.8 ± 1Content (mmol/kg dry wt) 37 ± 4 36 ± 4 35 ± 4
a p < 0.05 versus all other groups.b p < 0.05 versus nonuremic group.
TABLE 4. Minor brain tissue organic osmolytes#{176}
.Osmolyte Nonuremic Controls, .
Uremic, NondialyzedUremic, Post-Rapid
‘
Dialysis
Betalne 3.84 ± 1.24 2.87 ± 0.63 2.23 ± 0.38
GPC 0.64 ± 0.09 0.48 ± 0.08 0.28 ± 0.OobAlanine 2.90 ± 0.1 1 3.02 ± 0.13 4.08 ± 0.46Aspartate 4.96 ± 0.71 5.25 ± 0.60 3.86 ± 0.66
Glycine 5.21 ± 0.23 5.22 ± 0.23 4.94 ± 0.20‘y.Aminobutyric Acid 9.47 ± 0.66 8.83 ± 0.60 9.00 ± 0.43Lysine 1.29 ± 0.12c 0.85 ± 0.07 0.91 ± 0.06
Serine 6.23 ± 0.18 5.24 ± 0.17 4.80 ± 0.15
Threonine 4.59 ± 0.28 3.89 ± 0.17 3.74 ± 0.10c
a Data are expressed as solute content of tissue. in millimoles per kilogram dry brain tissue weight.
b p < 0.05 versus nonuremic group.C p < 0.05 versus all other groups.
In contrast to our previous results, a small butsignificant decrease in the brain water of uremic
animals In comparison to that In nonuremic controlanimals was observed. Other investigators have foundno decrease in brain water over a similar time course
of acute renal failure (4, 1 3, 1 7). In the uremic animals
in this study. a significant increase in both plasmaglucose and taunine was observed, together increasing
“effective osmolality” by about 10 mosm/L or 2.5%.
Unlike most amino acids, the taurine pool is primarily
determined by renal excretion. Plasma taunine in pa-
tients with chronic renal failure has generally beenreported to be increased ( 18, 19). Elevated plasmataunine and glucose. as well as the rapidly rising
plasma urea in this model of acute renal failure, may
have contributed to the mild decrease in brain water
observed.
An Increase In brain-to-plasma osmolality, mea-
sured by freezing point depression after rapid dialysis
In dogs. forms the experimental basis for the “idlo-
Acute uremia After dialysis
IN�!NSU
Predicted Actual Predicted Actual
Figure 2. Predicted brain water based on changes in brainurea content alone compared with the actual changes inbrain water observed in animals after acute uremia andafter acute hemodialysis. NS, not significant.
genic osmole” hypothesis (4). However, it is generallyrecognized that the accuracy of this method and other
methods for the measurement of total tissue osmola-

Silver
Journal of the American Society of Nephrology 1605
lity is limited (20). The brain organic osmolytes mea-
sured in this study did not increase after rapid dialy-
515, indicating that “idiogenic osmoles” were not
formed during rapid dialysis. The results confirm
those of Zhou et at. , who described preliminary exper-
iments similar to this study (21).
The findings are also consistent with current con-cepts regarding the role of organic osmolytes In re-
sponse to osmotic stress. In studies of in vivo hyper-
natremia, cerebral bevels of organic osmolytesaccumulate in an adaptive manner to maintain cell
volume. However, this response is gradual-occurringoven the course of days-and it appears to be depen-dent on gene transcriptional I translational events and
the subsequent synthesis of transporters (22). Duringrapid correction of hypernatremia. cerebral edema
occurs because of the persistence (not the formation)of elevated bevels of brain inositob and amino acids. In
hyponatremia. brain organic osmolyte levels signifi-
cantby decrease within 24 h. and by 2 days, the brain
content of inositol, glutamine, and taunine has de-creased by 60 to 80% (23,24). Rapid correction ofhyponatnemia causes brain dehydration because cells
adapted to hypo-osmolality are unable to reaccumu-late organic osmolytes fast enough to keep pace withthe increasing serum sodium concentration. Thus,changes in brain organic osmolytes in response to
osmotIc stress are relatively gradual and occur in an
adaptive direction. Increases in brain organic Os-molytes in response to hypertonicity or the correction
of hypotonicity appear to be a considerably slower
process than the adaptive loss of these sobutes (8). In
contrast, the idiogenic osmole hypothesis proposes amaladaptive increase in organic solutes that occurs sorapidly that solute accumulates faster than water candiffuse into the brain.
Although they do not appear to increase after dial-
ysis, organic osmolytes might still contribute to cere-
bral edema in this setting. One study of acutely ure-
mic rats, in contrast to this study, found significantincreases in major brain osmobytes. possibly acting as
“protective” solutes in response to toxic levels of urea( 13). When plasma osmolality is reduced rapidly by
dialysis, the retention of these osmolytes (along with
urea) could potentially contribute to cerebral swell-ing-analogous to the brain swelling that occurs after
the rapid correction of hypennatremia. In our study,plasma taunine bevels were reduced by 2 mM/L during
dialysis with no significant change in the taunine
levels in brain tissue. This retained taunine may havecontributed slightly to brain swelling after dialysis.
However, this proposed mechanism is distinctly dif-
ferent from the idiogenic osmobe hypothesis, whichproposes that new solute forms during dialysis.
In sum, this study provides evidence In support of
the reverse urea effect as a major mechanism forcerebral edema observed after rapid dialysis and evi-dence against the Idlogenic osmole hypothesis. Fur-
then study to assess the contribution of these and
other pathogenic mechanisms to the development of
DDS is warranted.
ACKNOWLEDGMENTS
This work was funded in part by a grant-In-aid from the New York
State Affiliate of the American Heart AssocIation. The author thanksBarbara Schoeder for her technical assistance. Dr. Richard Sterns forhis helpful comments and criticisms, and Carolyn Guerrera for her
preparation of the manuscript.
REFERENCES
1. Kleeman CR: Metabolic coma. Kidney mt 1989:36:1142-1158.
2. Peterson HC, Swanson AG: Acute encephalopathy oc-curning during hemodialysis. Arch Intern Med 1964; 113:877-880.
3. Kennedy AC, Linton AL. Eaton JC: Urea levels in cere-brospinal fluid after hemodlalysis. Lancet 1962; 1 :4 10-411.
4. Arieff Al, Massry 5G. Barnlentos A, Kleeman CR: Brainwater and electrolyte metabolism in uremia: Effects ofslow and rapid hemodlalysis. Kidney Int 1973;4: 177-187.
5. Silver SM, DeSimone JA Jr. Smith DA, Sterns RH:Dialysis disequilibrium syndrome (DDS) In the rat: Roleofthe “reverse urea effect.” Kidney Int 1992:42: 16 1-166.
6. Strange K: Regulation of solute and water balance andcell volume in the central nervous system. J Am SocNephol 1992:3:12-27.
7. Trachtman H: Cell volume regulation: A review of cere-bral adaptive mechanisms and implications for clinicaltreatment of osmolal disturbances: II. Pedlatr Nephol1992:6:104-112.
8. Gullans SR: Control of brain volume during hyperosmo-bar and hypoosmolar conditions. Annu Rev Med 1993;44:289-301.
9. Wolff SD, Yancey PH, Stanton TS, Balaban RS: A simpleHPLC method for quantitating major organic solutes ofrenal medulla. Am J Physiol 1989;256:F954-F956.
10. Gunawan S. Walton NY, Treiman DM: High-performanceliquid chomatographic determination of selected aminoacids in rat brain by precolumn denivatizatlon withphenylisothiocyanate. J Chomatogr 1990:503:177-187.
1 1 . Arieff Al: Dialysis dIsequilibrium syndrome: Currentconcepts on pathogenesis and prevention. Kidney mt1994;45:629-635.
12. Bradbury MW. Coxon RV: The penetration of urea intothe central nervous system at high blood urea levels. JPhysiol 1962; 163:423-425.
13. Trachtman H, Futterweit 5, Tonidandel W, Gullans 5:The role of organic osmobytes in the cerebral cell volumeregulatory response to acute and chronic renal failure. JAm Soc Nephrol 1993:3:1913-1919.
14. Lien YH, Shapiro JI. Chan L: Effects of hypernatremiaon organic brain osmoles. J Clin Invest 1990;85: 1427-1435.
15. Rosenberg GA, Kyner WT: Gray and white matter brain-blood transfer constants by steady-state tissue clear-ance In cat. Brain Res 1980:193:59-66.
16. Johanson CE, Woodbury DM: Uptake of I 14-Cl-urea bythe In vivo chorold plexus-cerebrospinal fluid-brain sys-tern: Identification of sites of molecular sieving. J Physlol1978;275: 167-176.
1 7. Bedford JJ, Leader JP: Response of tissues of the rat toanisosmolality In vivo. Am J Physiol 1993;264:R1 164-Rl179.
18. Jung BC, Laidlaw SA, Kopple JD: Taunine levels inplasma and blood cells In patients undergoing routinemaintenance hemodialysis. Am J Kidney Dis 199 1 ; 18:74-79.
19. Smolin LA, Laidlaw SA, Kopple JD: Altered plasma freeand protein-bound sulfur amino acid levels in patientsundergoing maintenance hemodlalysis. Am J Clin Nutr1987:45:737-743.
20. Sweeney TE. Beuchat CA: Limitations of methods of
Cerebral Edema After Rapid Dialysis
1606 Volume 6 ‘ Number #{243}‘ 1995
osmometry: measuring the osmolality of biological flu-ids. Am J Physlol l993;264:R469-R480.
2 1 . Zhou H, Wang X, Margin DK, Lien YH: Organic Os-molytes are not Involved in dialysis disequilibrium syn-drome in rats with acute uremia. J Am Soc Nephol1993:4:899.
22. Strange K, Morrison R, Shrode L, Putnam R: Mecha-nism and regulation of swelling-activated inositol efflux
in brain glial cells. Am J Physiol 1993;265:C244-C256.23. Sterns RH, Baer J, Ebersol 5, Thomas D, Loh JW,
Kamm DE: Organic osmolytes in acute hyponatrernia.Am J Physiol 1993;264:F833-F836.
24. Lien YH. Shapiro JI, Chan L: Study of brain electrolytesand organic osmolytes during correction of chronic hy-ponatremia: Implications for the pathogenesls of centralpontine myelmnolysis. J ClIn Invest 199 1 ;88:303-309.