ceq wp45 taxes, expenditures, poverty and … · taxes, expenditures, poverty and income...
TRANSCRIPT

1
TAXES, EXPENDITURES, POVERTY AND INCOME DISTRIBUTION IN ARGENTINA
Working Paper No. 45 May 2016
Darío Rossignolo

TAXES, EXPENDITURES, POVERTY AND INCOME DISTRIBUTION IN ARGENTINA
Darío Rossignolo*
CEQ Working Paper No. 45 MAY 2016
ABSTRACT
Using standard fiscal incidence analysis, this paper estimates the impact of tax and expenditure policies on income distribution and poverty in Argentina with data from the National Household Survey on Incomes and Expenditures 2012-2013. The results show that fiscal policy has been a powerful tool in reducing inequality and poverty but that the unusually high levels of public spending may make the programs unsustainable.
Key words: Taxes, public expenditures, inequality, poverty
JEL classification: H2; I3; D3
______________________________________________________________________ *Associate Professor at the University of Buenos Aires. Researcher and consultant for international organizations. Email: [email protected], [email protected].
1
1. Introduction
Public policy design requires knowledge of how benefits and taxes are distributed across different welfare levels. This study evaluates the impact of taxes and public expenditures on income distribution and poverty to determine whether they reduce income inequality and poverty or, conversely, if they indirectly exacerbate income inequality.
This paper estimates the impact of tax and expenditure policies on income distribution and poverty amelioration in Argentina using the CEQ methodology with data from the National Household Survey on Incomes and Expenditures (ENGHo), which was conducted by the National Bureau of Statistics in Argentina from March 2012 to February 2013. Consequently, the paper uses the codes for taxes and public expenditures from 2012.
The study is organized as follows: section 2 briefly reviews the results of previous studies on the impact of taxes and expenditures on income distribution. Section 3 describes the Argentine context in terms of economic growth and public sector surplus; section 4 outlines Argentina’s tax structure and the quantitative evolution of its taxes and expenditures. Section 5 introduces the data source and incidence assumptions for the CEQ analysis of the impact of taxes and expenditures; section 6 presents the regulatory framework for the taxes and expenditures included in the incidence analysis. Section 7 summarizes the results of the incidence analysis on income distribution and poverty, and Section 8 offers concluding remarks.
2. Results of Previous Studies on the Argentina Case
Several studies on Argentina have analyzed the impact of taxes and expenditures, together or separately, on income distribution. However, very few have analyzed their impact on poverty (some have tried to capture the impact of specific social programs) and no one has estimated the impact of taxes on poverty. This is the first study to use CEQ methodology to examine the effects of taxes and expenditures on income inequality and poverty reduction in Argentina.
Some research on tax incidence analysis in Argentina is available. Gasparini (1998) performs an analysis of the distributional impact of the tax system for 1996, taking per capita income and per capita consumption expenditures as welfare indicators. In the first case, taxes are highly regressive; meanwhile, when per capita consumption is considered, the incidence is moderately progressive. Gómez Sabaini, Santiere, and Rossignolo (2002) analyze the impact of taxes on income distribution for 1997, considering per capita income adjusted for underreporting as a welfare measure. The incidence is regressive in this case, chiefly because of VAT and indirect taxes.
Gómez Sabaini and Rossignolo (2009) consider the incidence of taxes for 2006, considering again per capita income adjusted for underreporting. Here, the impact of taxes is moderately progressive, mainly due to export taxes and the increase in the importance of Income Tax and Payroll taxes, measured by the Gini coefficient. However, since differences in extremes (that is, decile 10 versus decile 1) increase, the authors determine that the system continues to have a

2
regressive impact. Gómez Sabaini, Harriague, and Rossignolo (2013) arrive at similar conclusions with information on taxes for 2008.
SPE (2002) and SPER (1999) perform different estimations on public expenditures for Argentina; their results show an unequivocal reduction in inequality. Gasparini (1999) arrives at similar results; benefits of public expenditures are received more strongly by lower income brackets.
In the case of poverty, several studies have analyzed the impact of specific programs on poverty reduction, such as Maurizio (2009), who explores the impact of different monetary transferson poverty, and Marchionni et al. (2008), who examine the impact of simulated tariff schemes.
The net effect of taxes and public expenditures on income distribution has been calculated in Gasparini (1999), SPE (2002), Gaggero and Rossignolo(2011), and Gómez Sabaini, Harriague, and Rossignolo (2013), among others. Although the methodologies differ to a certain extent (one study considers a balanced budget; another effective tax collection), all the studies find that the two highest income quintiles transfer resources to the lowest ones. Although the studies find that the magnitude of the redistributional impact varies, all of them note a significant equalizing effect. Table 1 in the Appendix synthesizes these results.
Following CEQ methodology, Lustig and Pessino (2013) assess the growing importance of noncontributory pensions in Argentina in the last decade, emphasizing the effect of government policies, such as the Asignación Universal por Hijo or the Moratoria Previsional through the Encuesta Permanente de Hogares. This analysis used data from ENGHo 2012-2013and from the tax side of the budget.
3. The Argentine Context Argentina is a South American country of middle economic development, with a per capita GDP of U$ 12,735(current U$) or U$ 22,301in PPP terms,1 and a projected population of about 42 million inhabitants in 2014, distributed over 3.7 million km2. Its political system is republican, representative and federal.
1IMF World Economic Outlook, October 2015. 2Gross Tax Burden, excluding reimbursements. 3“Extraordinary tax” comprises Current Account Credits and Debits and Export Duties.

3
Figure 1 Economic Growth in Argentina 2004-2014 Annual Percentage Change in Real GDP
Source: INDEC.
In economic terms, Argentina’s history has involved many crises and subsequent recoveries. The crisis that resulted from the termination of the currency board regime ended with a devaluation of the Argentine peso and a slump in economic activity (real GDP fell by 15.5% in 2001-2002) and with unemployment and poverty figures reaching high levels (unemployment climbed to 18.4% of the labor force, and 24.7% of the population suffered from extreme poverty in 2001, according to official statistics). The process of economic recovery began in 2003: production, investment, consumption and employment all rose. Between 2003 and 2007, the GDP grew 8.5% annually.
The Argentinean public sector is marked by a long history of structural imbalances. Figure 2 shows the progression of the primary and total surplus beginning in 2004. The public sector surplus declined from an average 2.8% of GDP between 2004 and 2008 to 0.4% between 2009 and 2013, while the primary surplus represented a 1.4% average and a 1.1% average deficit for the same periods. From 2009 on, budget surplus has been declining, with deficits for both cases from 2012 on.
9.2%
8.4%8.0%
3.1%
0.1%
9.5%
8.4%
0.8%
2.9%
0.5%
0.0%
1.0%
2.0%
3.0%
4.0%
5.0%
6.0%
7.0%
8.0%
9.0%
10.0%
2005 2006 2007 2008 2009 2010 2011 2012 2013 2014

4
Figure 2 Taxes on Banking Transactions, Export Duties, Primary and Total Surplus in Argentina
2004-2014
Source: Ministry of Economy and Public Finance.
The features of the tax policy implemented until the 2001 crisis were different from those of the past few years, when exceptional growth was achieved owing to the foreign sector and tax income. The fiscal surplus of the first part of the decade was mainly due to tax revenues increasing at a greater rate than expenditures, which was not the case after 2011.
4. Behavior of Tax Structure and Expenditures in Argentina
Argentina has experienced exceptional growth in tax burden in the last decade, reaching 32.5% of GDP in 20142. During these years, the country saw the greatest increasing and continuing tax-burden levels in its history. This was partially due to the major impact of “extraordinary taxes,”3which represented 4.3% of the GDP in 2008 (more than half of which resulted from export duties) and which, in 2010, decreased slightly but reached 4% of the GDP; elimination of the private-funded pension system also partially explains the rise in tax burden.
Additionally, sustained growth in tax collection from traditional taxation (VAT, income tax and payroll taxes) confirms the usual assumption that tax administration achievements are more effective during economy-recovery periods. 2Gross Tax Burden, excluding reimbursements. 3“Extraordinary tax” comprises Current Account Credits and Debits and Export Duties.
1.4 1.5 1.4 1.5 1.5 1.5 1.5 1.6 1.6 1.7 1.7
1.9 1.9 1.8 2.0
2.8
2.32.5 2.3 2.2
1.61.9
2.2
1.5 1.4
0.91.1
-0.5
0.2
-1.3
-2.0 -1.9
-2.5
3.23.0 2.9
2.5 2.5
1.2 1.4
0.2-0.2
-0.7-0.9
-3.0
-2.0
-1.0
0.0
1.0
2.0
3.0
4.0
5.0
2004 2005 2006 2007 2008 2009 2010 2011 2012 2013 2014
Perc
enta
ge o
f GD
P
Tax on banking transactions Export duties Total financial surplus Total primary surplus

5
The increase in tax burden in the last decade is related to the addition of taxes that were sporadically used in previous periods, such as export duties (withholdings) and current account debits and credits, and to other provisions that impacted Corporate and Personal Income Tax (no inflation adjustments of financial statements and thresholds).
The lack of immediate adjustment of thresholds and tax brackets helped increase tax revenues from Personal Income Tax. This process, known as fiscal drag or "bracket creeping," is illustrated by the fact that in 1997, almost 12.5% of taxable income was concentrated in the highest tax bracket, subject to the highest marginal tax rate; in 2011, that percentage was 58% (Gómez Sabaini & Rossignolo, 2014).
In 2008, Social Security contribution revenues gained importance, constituting the highest direct tax revenue source; resources from the eliminated capitalization system (implemented in the 1990s) were used by the government to establish the pay-as-you-go system.
On the expenditures side, public expenditures at all government levels have increased from 26% of GDP in 2004 to around 45% in 2013. The evolution of social expenditures in Argentina in the last decade can be divided in three stages (Gómez Sabaini, Harriague, & Rossignolo, 2013).
The first stage stems from the socioeconomic crisis that the country experienced at the beginning of the last decade, which led to the creation of several emergency programs to ameliorate the impact of the crisis, including Plan Jefes y Jefas de Hogar Desocupados (PJyJHD),Programa Ingreso para el Desarrollo Humano (IDH), Programa Remediar in the health arena, and Programa de Emergencia Alimentaria (PEA) in the nutritional arena.
In the second stage, between the economic recovery and the economic crisis in 2008, more structural solutions were implemented, such as the Moratoria Previsional (a sort of "early retirement program" with a moratorium for those who do not complete the 30-year requirement),and the Ley de Financiamiento Educativo to increase education spending to 6% of GDP. Additionally, the Plan Jefes y Jefas de Hogar Desocupados (PJyJHD) was divided in two components: Plan Familias por la Inclusión Social (PFIS) and Seguro de Capacitación y Empleo (SCE).
In the third stage, which started in 2008, the government’s main goal is to maintain income and employment at pre-crisis levels. To that end, the previously-mentioned elimination of the capitalization system led to the creation of the Sistema Integrado Previsional Argentino y Movilidad Jubilatoria (SIPA) and a mandated periodic increase in pensions. Additionally, the creation of a universal program, Asignación Universal por Hijo (AUH), extended the benefits that formal workers receive related to the number of children they have to those in the informal sector and the unemployed.
Aside from the increase in social expenditures, expenditures on economic services, i.e. subsidies to tariffs, have increased greatly, averaging 5% to 6% of GDP from 2012 to 2013. These

6
expenditures were primarily designed to prevent tariffs to services (mainly transportation and energy) from increasing in the area around greater Buenos Aires.4
5. Incidence Analysis: Methodological Notes
The following section summarizes the main features of the data source employed, following CEQ methodology.
5.1. Data Source
The main source of information for this report was the National Household Expenditure Survey (Encuesta Nacional de Gastos de los Hogares – ENGHo), conducted by the Federal Statistics and Census Institute (Instituto Nacional de Estadística y Censos – INDEC) between March 2012 and February 2013. The ENGHo is a large-scale survey that obtains detailed answers from about 20,960 households across the country (around 36.1 million total inhabitants).
The units analyzed by the survey are individual households in the country. An “individual household” is made up of any person or group of people, related or un-related, living in the same home under a family system and consuming food paid for by the same budget.
The ENGHo is a representative sample of 86.8% of the population. A percentage of the urban population and rural towns with fewer than 5000 inhabitants were excluded from the sample due to high administrative costs (INDEC, 2012).
The main survey variables used in this study are household expenditure and income. In order to define and analyze different domains and depict the households they include, the survey also contains information on demographic, occupational and educational variables, as well as housing characteristics, transfers in kind received and household goods.
5.2. Incidence Assumptions
The methodology used here to estimate the incidence of taxes and expenditures adopts different assumptions about the shifting of the tax burden because, in most cases, the person liable for the tax or the person entitled to receiving the benefit is not the person who ultimately bears the tax burden or effectively gets an increase in their income. Both sellers and buyers may adapt to the tax by shifting it in accordance with their different elasticities: the smaller the (offer or demand) elasticity, the smaller the possibility of shifting the tax and the higher the impact on the person bearing the burden.
Therefore, there are various alternatives for measuring the impact of taxes and estimating their incidence. In this study, as in the majority of studies based on a partial equilibrium framework, it is assumed that the burden generated by taxes on goods and services is fully shifted to consumers via a higher price. Even though this seems to be the most widely used method for approximating the compensating variation, there are some inherent difficulties in establishing these kinds of
4Lustig and Pessino (2013) analyze the sustainability of redistributional policies applied in Argentina.
7
hypotheses and, more importantly, some defects in other assignment mechanisms that should not be ignored.
This study assumes no tax evasion in general, which means that all the people due to pay taxes, according to their incomes or consumption expenditure behavior, bear the tax burden. However, if purchases have been made in the informal market, it is assumed that no taxes have been paid.
In order to account for the incidence of direct taxes, it is commonly assumed that the burden of PIT and other taxes related to income falls on the person required to pay them (income earner), i.e. the economic incidence is the same as the statutory incidence.
For Corporate Income Tax and Social Security contributions, the incidence assumption is not so straightforward. A general equilibrium model is necessary to account for the final incidence—specifically, for Social Security, how much of the burden is borne by employers and employees, and for CIT, how much is borne by capital owners or employers and how much is transferred on to consumers via a higher price. The latter is difficult to account for in a household survey, but the former can be calculated if it is assumed that the tax is completely borne by employees through a reduced salary. Consequently, CIT has been left aside.5
Information on direct taxes is rarely gathered directly by surveys; instead, surveys report earnings. Depending on the source of income, the amount reported is usually, though not always, after taxes. Salaried workers in the formal sector report income after taxes. For informal salaried workers, employers, independent workers, capital income earners, social security beneficiaries and people receiving pensions and transfers, reported income reflects earnings before taxes. To get at the tax burden, tax revenues should be computed from all these income sources, assuming that they are taxable income.
On the expenditure side, it is assumed that the beneficiaries of a program are the users and their families who receive free or subsidized public provisions. This assumption means that the potential benefits that could accrue to production factors are ignored, as are the externalities that may arise from the consumption of publicly provided goods (ideally, the equivalent variation for every individual would be calculated to assess the complete incidence).
6. Regulatory and Methodological Considerations of Taxes and Expenditures in the Incidence Analysis
This section explains the characteristics of the taxes and expenditures analyzed in this study. The indirect taxes considered were the Value Added Tax, excise taxes, fuel taxes and the provincial turnover tax; the direct taxes analyzed were Personal Income Tax, payroll taxes and other minimum taxes on income ("Monotributo"). These taxes represent about 71% of total tax 5 Due not only to the absence of relevant information (mainly data related to the decrease in disposable income of the producers once export taxes have been collected) but also to the different economic effects outside the scope of a standard, exclusively fiscal incidence analysis, export duties have been excluded from this analysis. Gómez Sabaini and Rossignolo (2009), and Gómez Sabaini, Harriague, and Rossignolo (2014), following a different methodology than the one used here, conclude that these taxes are progressive following the standard Gini and concentration coefficients.

8
revenues (national and provincial) for 2012; of that 71%, 80% could be simulated with the estimations provided here.
On the expenditure side, we have classified the Asignación Universal por Hijo as the flagship cash program. The Plan de Inclusión Previsional y Moratoria Previsional has been included in the Noncontributory Pensions category. In Other Cash & Near Cash Transfers, the programs Asignaciones Familiares, Seguro de Capacitación y Empleo, Programa Familias por la Inclusión Social, Becas Universitarias, Programa Jóvenes con Más y Mejor Trabajo, Seguro de Desempleo and Comedores Escolares y Comunitarios are included. Total public expenditures on education and health represent about 76% of total social expenditures, rising to 83% when Contributory Pensions are counted as a public transfer in 2012; these estimations account for about 62% of social expenditures estimated in this study. Meanwhile, economic subsidies to transportation, electricity and gas services have also been calculated. Table 1 presents the aggregate figures for taxes and public expenditures analyzed as percentage of GDP in 2012.
Due to discrepancies in the official Argentine statistics for the calculation of GDP, all calculations that involved the association of nominal values with values in the survey were "scaled down" by 22% to attempt to account for the difference in GDP calculated with year base 1993 and GDP with year base 2004.
6.1. Indirect Taxes
Value Added Tax (VAT): VAT is a consumption tax on all stages of the production and distribution of goods and services. It is not cumulative and uses the “tax against tax” system, where the balance between tax credits (charged to sales) and tax debits (charged to purchases) is paid to the seller every month. This procedure is equivalent to applying the tax on the value added at every elaboration stage. It is levied on imports in a similar way to domestic production, but exports are zero rated.
The general tax rate is 21%. There are few exemptions because most have been eliminated in successive reforms.6 There are also differential rates: the highest is 27% on the invoices of public services provided to companies that are liable for the tax; the lowest is 10.5% on new home sales and a very limited list of goods and services.7,8
6 Among exemptions with considerable tax collection importance in 2012 were books, brochures and similar printed material, natural ordinary water, milk without additives, buyers who are end consumers or tax-exempt individuals, medicines, goods at the resale stage and for which the tax has been paid at the import or manufacturer’s stage, medical services rendered through Health Insurance Services by trade unions, theater performances, international passenger and cargo transportation, and life insurance. 7The lowest tax rate includes some basic foods (meat, fruit, vegetables, bread), newspapers, magazines and periodical publications, goods at the selling stage to the general public, and domestic transportation services for passengers by land, water, or air, except for taxis and rental car services on routes less than 100 km. 8 In the case of exempt goods, the 1997 Input / Output table was used, with data from 1993. The taxable input proportion was estimated for each exempt good: the incidence of taxable inputs was estimated for the sales amount of exempt goods, and the same structure was applied to the total of VAT purchases deriving from the consumption of exempt goods.
9
Excise taxes (Impuestos internos): These taxes apply to the domestic sale and import of a specific list of goods and transactions: alcoholic beverages (20%), beer (8%), soft drinks and other nonalcoholic beverages (4% to 8%), automobiles and diesel engines (10%), and insurance (2.5%).
For all taxes on goods, the taxable basis includes the tax itself. The taxable basis is the net price billed by the responsible party, defined as the remainder after deduction of discounts and bonuses, financing interest, and the VAT generated by the operation. In the case of cigarettes, the taxable basis is the sale price to the end user, excluding the VAT; in the case of insurance, the taxable basis does not include the tax itself, which is the only case in domestic taxes where the legal or nominal rate is applied to the taxable basis.
Fuel tax: In 2012, liquid fuel and natural compressed gas were taxed (62% to 70%). Among fuels, the tax is applied to all forms of gasoline: solvent, turpentine, gas oil, diesel oil and kerosene. For gas, the tax falls on compressed natural gas for motor vehicles, distributed through pipelines. The tax must be applied in a single circulation stage for the sale of national or imported products. Importers of liquid fuel and companies that refine or market it are subject to the fuel tax, as are distributors of gas before it enters the pipeline.
The tax is calculated by applying the corresponding rate to the net sales price listed on the invoice or similar document for resellers at the dispatching plant, issued by the persons liable for its payment.9
Provincial Turnover Tax ("Ingresos Brutos"): This tax is an important source of revenue for the subnational governments and is applied by all provinces. It is a cascade tax because it falls on all stages of production and distribution of goods and services. It taxes gross income without deducting the tax already paid and cumulated through previous purchases in the production process. Because it forces vertical integration of firms and discriminates in favor of imports which do not contain taxes paid on every production stage, the provincial turnover tax alters neutrality.
Tax rates follow similar patterns across the country; however, rates vary highly due to differences in economic activities and corresponding jurisdictions. In general, the highest rates appear in Commerce and Services; intermediate rates are applied to Industrial activities, and the lowest rates occur in the Primary sector.
In order to calculate tax incidence, the aforementioned tax rates were applied to the data on consumption reported in the household survey. According to several authors including Rossignolo(2014),10 effective tax rates are about twice as high as rates on final consumption; consequently, rates on retail consumption have increased 150% in order to account for the taxes
9 Alternatively, although there is no reliable study in Argentina determining the percentage of fuel cost that is part of the transportation cost transferred to the consumer, at present, and basically due to the existence of transportation and fuel subsidies distorting relative values, we assumed that 30% of the tax is transferred. 10Rossignolo (2014) presents a calculation of the effective rate of this tax.

10
included at every production stage for every province. The methodology applied is the same as that for VAT and excise taxes; since the tax base excludes VAT, excises and fuel tax, this tax is the closest to input costs and should be included in the tax base of the previously mentioned taxes.
6.2. Direct Taxes
Personal Income Tax: PIT is a global type tax, structured with progressive rates; its taxable base has been expanded by several pieces of legislation. The Income Tax Act delineates four categories of income based on their source (land rent, capital gains, company and certain business brokers’ income, and personal income). A single taxpayer may generate income corresponding to one or more income categories at the same time. The calculation of the taxable income is based on the income and expenses corresponding to the four categories and on the participating interests in companies or activities.11
The tax is determined by taxable net income bracket, based on a sliding scale consisting of a fixed amount plus a rate increasing from 9% to 35% on the excess of each income bracket bottom level. Individuals paying income tax fall into one of the two following categories: self-employed taxpayers or salaried workers. Self-employed taxpayers (that is, independent workers registered as income tax payers) must pay income tax each fiscal year in five bi-monthly advance payments.
Other income taxes ("Monotributo"): One group of taxpayers, referred to here as small taxpayers, is subject to a simplified tax regime called Monotributo. This regime replaces the Income Tax and Value Added Tax with a single fixed-amount monthly tax plus contributions for Social Security and Health Insurance. Under this regime, the single tax payment is based on an income bracket and no further rules related to the assessment of income, deductions for dependents or special deductions are applied.
The tax levied is a fixed amount established according to the Monotributo category into which taxpayers fall. These categories are determined based on invoicing and/or the surface area of the facilities and/or the use of power during production.
Payroll taxes: As a part of the tax system, taxes on wages were analyzed, including contributions made by both the employee and the employer. In both cases, the amount collected is deposited into the Federal Tax Administration and that revenue is distributed according to the corresponding legal provisions.
11 There are numerous subjective and objective exemptions. The most important among the latter are those on interest accrued on saving accounts deposits, special saving accounts and term deposits, income derived from securities, shares, bonds, bills of exchange, notes and other securities issued or to be issued in the future by a governmental authority, the rental value of the residence when occupied by its owners, etc. The following items are not exempt: pensions, retirement payments, subsidies, and salaries received during medical leave.

11
For formal sector employees, the items considered are contributions to the social security system (11%), health insurance (3%), and the national pensions fund (3%), up to a ceiling of AR$ 21,248 monthly (maximum taxable base). This amounts to a total rate of 17%.
In the case of employers, the items considered are contributions to the social security system (12.71%), health insurance (6%), the national pension fund (1.62%), the fund for family allowances (5.56%) and the national employment fund (1.11%), which amounts to 27% of earnings in the formal sector. This rate pertains to employers whose activity is concentrated in the services sector; for other employers, the rate is 23%.
In the case of independent workers, the items considered are their contributions to the social security system (27%) and the national pensions fund (5%). These rates are applied to a scaled tax base that is progressive and differs between professionals and traders. These workers have been identified in the household survey by years of education.
6.3. Flagship Cash or Near Cash Transfer programs
Asignación Universal por Hijo Target population: Parents with dependent children under the age of 18 who are informal workers with an income lower than the minimum salary of the formal sector, unemployed people without unemployment benefits, or domestic service workers.
Targeting mechanism: A monthly monetary transfer of AR$ 270 per child in 2012, raised to AR$ 340 in September 2012. Benefits are received for each of up to five children. The first 80% of the benefit is received by direct deposit into a bank account; the remaining 20% is transferred with proof that the children are attending school and have received the compulsory vaccines. This benefit includes a means testing mechanism in the sense that beneficiaries cannot receive other social benefits while receiving Asignación Universal porHijo.
6.4. Non-contributory Pensions
Plan de Inclusión Previsional y Moratoria Previsional
Target population: In 2005, the government instituted an early retirement program through a moratorium for those who had not completed 30 years of service (Programa de Inclusión Previsional). In 2007, a program that allowed workers who had completed the required 30years of service but who were at least five years younger than the official retirement age (65 for men, 60 for women) to receive the pension (Jubilación Anticipada) was also instituted.
Targeting mechanism: For the Jubilación Anticipada, the transfer is equivalent to 50% of the corresponding benefit that the person would be entitled to receive at full retirement age, although it cannot be lower than the minimum pension. For the Prestación por Moratoria, the beneficiaries receive their transfer net of a reduction that corresponds to the number of years the person has not contributed to the system. As years of contribution cannot be established in this paper, the program simulated here compensates the pensioners who are receiving a lower-than-minimum pension in order to reach the minimum threshold.

12
Table 1 Government Spending and Revenue Structure in Percentage of GDP 2012
Source: Author´s calculations based on information from the Ministry of Economy and Public Finance.
Total Government Spending 42.1Primary Government Spending 40.1Social Spending (excludes contributory pensions) 19.9Direct Transfers (Total Cash & Near Cash Transfers) 5.2Flagship Cash or Near Cash Transfer program 0.4Noncontributory Pensions 2.8Other Cash & Near Cash Transfers 2.0Total In-kind Transfers 11.1Education 5.7Basic (primary and secondary) 4.4Tertiary and University 1.3Health 5.4Contributory 3.0Noncontributory 2.4Other Social Spending (not in incidence analysis) 3.6Contributory Pensions 6.8Non-Social Spending 13.4Indirect Subsidies 4.7Energy, fuel and mining 2.4Transportation 2.3Other Non-Social Spending (not in incidence analysis) 8.7
Memo: Total Subsidy of Contributory Pensions (equal to the deficit which is covered by general government revenue) 0.3
Debt ServicingInterest payments 2.0Amortization payments
Total RevenueTaxes 31.2%
Direct Taxes 2.1%Personal Income Tax 2.0%
Simplified Tax Regime (Monotributo ) 0.1%
VAT and Other Indirect Taxes 11.8%Other Taxes 17.3%
of which Social Security Contributions with Pensions (in sensitivity 1 analysis) 8.4%

13
6.5. Other Cash and Near Cash Transfers
Asignaciones Familiares
Target population: Salaried workers in the formal sector who have children up to 18 years of age and salaries under the limit as well as pensioners and unemployment compensation beneficiaries with children under 18. The program covers marriage, children, adoption, disabled children, among other monthly transfers, and school attendance for children, paid once a year.
Targeting mechanism: Formal salaried workers receive their benefits according to their income level and to the number of beneficiaries they declare. For instance, the fixed amount for every child in June 2012 was AR$ 270 if the worker’s salary was between AR$100 and AR$ 2.800; the amount decreased to AR$ 204 for a salary between AR$ 2.800 and AR$ 4.000, and to AR$ 136 for a salary between AR$ 4.000 and AR$ 5.200. These amounts varied by geographical zone, being higher in the southern region of the country. A household might be excluded from this benefit in the absence of either children or a head of household working in the formal sector, if the head of household is retired or unemployed and receiving unemployment benefits, or if the head of household is earning an income higher than the maximum allowed for the benefit (AR$ 5.200 per month in 2012).
Seguro de Capacitación y Empleo
Target population: Beneficiaries of the previous Programa Jefes y Jefas de Hogar, including those with greater employment prospects.
Targeting mechanism: The beneficiaries of the Jefes y Jefas de Hogar Program, which was created in 2002 to ameliorate effects of rising unemployment through an initial monthly transfer of AR$ 150, were divided in two groups according to their employment potential. Those considered more "employable" were assigned to the Seguro de Capacitación y Empleo, a 24-month monetary transfer of AR$ 225 for the first 18 months and AR$ 200 for the remaining six months. The beneficiaries must comply with regulations such as attending courses to increase their employment skills
Programa Familias por la Inclusión Social
Target population: The beneficiaries of the previous Programa Jefes y Jefas de Hogar, including those with fewer employment prospects.
Targeting mechanism: The beneficiaries of the Jefes y Jefas de Hogar Program, which was created in 2002 to ameliorate effects of rising unemployment through an initial monthly transfer of AR$ 150, were divided in two groups according to their employment potential. Those considered less "employable" were assigned to the Programa Familias por la Inclusión Social, which is received according to the number of dependent children under age 18, from two to six children. The benefit starts at AR$ 155 per child and increases to AR$ 380 for six children or more for families below the poverty line. The program is not compatible with other transfers.

14
Becas Universitarias
Target population: PNBU (Programa Nacional de Becas Universitarias)is for university students attending an officially recognized program of any national university; it excludes students in their last year of study and those planning to start their careers.
Targeting mechanism: Beginning in 2009, students have received AR$ 3000 in 10 installments throughout the year. There are other two compensation programs, Programa de Becas Bicentenario, for students preparing for scientific careers, and Programa Nacional de Becas de Grado, for students of information technology. This study might overestimate the amount received because it cannot establish which program the beneficiaries are studying.
Programa Jóvenes con Más y Mejor Trabajo
Target population: People between 18 and 24 years of age who neither work nor study.
Targeting mechanism: The beneficiaries must be unemployed, with incomplete primary or secondary education, and between 18 and 24 years of age. The amount of the transfer is AR$ 150 a month for 2 to18 months; in addition, transfers are made against the presentation of a project for which the beneficiary receives AR$ 4,000 per project.
Seguro de Desempleo
Target population: Workers who have lost their jobs through no fault of their own and have been unemployed for at least 36 months.
Targeting mechanism: A transfer of between AR$ 250 and AR$ 400, calculated as a percentage of the highest previous salary. Maximum coverage lasts one year.
Comedores Escolares y Comunitarios
Target population: Schools, clubs, etc., that serve meals to children or the unemployed.
Targeting mechanism: Monetary transfer related to the cost of milk or a basic food basket provided to feed children or adults below the poverty line.
6.6. Economic Subsidies Subsidies to economic sectors are directed to transportation, communications, energy and fuel, industry and agriculture, and other sectors. The most important subsidies are those for transportation, energy and fuel; transportation subsidies are mainly oriented to supply, whereas energy and fuel are oriented to both supply and demand. Subsidies to energy include fuel, gas and electricity; subsidies to transportation comprise tariffs for trains, subways, airplanes and buses.
After having been a net exporter of fuel in the 1990s and at the beginning of the 2000s, Argentina has become a net importer of fuel. The price of the imported gas oil is subsidized through a fiduciary fund, and the consumer receives the difference between the price of fuel within the internal market and the same product at international prices. For gas, there are two
15
kinds of subsidy: for those who receive gas through a pipeline, the subsidy is included in the reduced cost of imported gas, which is included in the tariff. Those who buy bottled gas pay a subsidized price in which the government gives the producers the difference between the market price and the subsidized price. The total amount paid varies depending on the volume of the previous year’s gas consumption. For electricity, a fiduciary fund has been created to subsidize tariffs for households. The subsidy depends on the volume of the previous year’s electricity consumption.
6.7. Education and Health
In 2006,the National Education Law was passed following the Education Financing Law, which extended compulsory education to the end of secondary school. Data show that when compulsory education is extended, attendance increases but that students also continue to drop out at the same ages as before the law was passed (Gómez Sabaini, Harriague & Rossignolo, 2013).
There are two educational systems at every level: a free, public education system, and a private system, which is subsidized. Primary education is managed by the municipalities, secondary education is the responsibility of the provinces, and university is administered at a national level (with several exceptions at all levels). The public education system serves the majority of students, accounting for 73% of total students in 2012, of which 28.2% are enrolled in primary public schools. Public universities enroll 79% of university students.
The results for the distributional impact of education aggregate expenditures for Basic Education, including initial, primary and secondary school, and Superior (universities and tertiary).12
The Argentine health system is split into several parts because different population groups access different providers. One component of health insurance provides coverage for the population dependent on formal wage earners or retired pensioners. Populations that are not covered have access to the public health system. The high income population has access to the private system.
For formal workers, health benefits are delivered mainly through health insurance systems of trade unions, for both the private and public sectors as well at national and provincial levels. These workers comprise the greatest share of the beneficiaries. Pensioners are covered by the health insurance system known as INSSJyP (PAMI), a subsystem that finances private health service providers. The public health system (hospitals) covers those who do not have a health insurance system.
It is worth noting that the population covered by the private system can also receive public system benefits. Public expenditures for health have risen to 5.4% of GDP, 2.4% of which belong to health insurance systems. Low complexity hospitals were decentralized to the
12For each educational level, the results for public and private subsidized education can be shown and are available from the author upon request.

16
provinces and municipalities in the 1990s, while the high complexity ones still remain under federal administration.
7. Expenditures, Taxes, Inequality and Poverty Reduction in Argentina: Main Results
This section presents several results of the CEQ analysis of the impact of taxes and public spending on poverty and inequality in Argentina. The main results will focus on the benchmark case, in which pensions are a part of market income, while results from the sensitivity analysis, where pensions are treated as a government transfer, will be presented as well.
7.1. Impact on Inequality and Poverty
The evolution of the Gini coefficient and headcount ratio (using the international poverty lines of US$2.50 PPP and US$4 PPP per day and the national moderate poverty lines) for the benchmark scenario and sensitivity analysis are presented in Table 2.
Table 2 Gini and Headcount Index for Different Income Concepts
Source: Author´s calculations based on ENGHo.
As shown in Table 2, market income Gini is higher than the net market income Gini, indicating that direct taxes (Personal Income Tax, Social Security Contributions and Monotributo) reduce inequality. Regarding poverty, however, the effect is the inverse, because a reduction in income due to direct taxes (mainly, in this case, Monotributo), results in a higher number of households lying below the poverty line.
When direct transfers are included in disposable income, reductions in both inequality and poverty are evident; disposable income Gini declines around 16% and extreme poverty falls by 65% in the benchmark case.
Post fiscal income includes the net effect of indirect taxes and economic subsidies. The high impact of the latter reduces poverty and more than compensates for the inequalizing effect of
Market Income
Net Market Income
Disposable Income
Post-fiscal Income
Final Income
Benchmark Case: pensions are part of market incomeGini 0.481 0.435 0.403 0.401 0.303Headcount index$2.5 PPP 4.7% 5.1% 1.8% 3.0%$4 PPP 12.3% 13.9% 7.3% 12.5%National Moderate PL 10.3% 12.0% 5.6% 9.7%Other Moderate PL (FIEL) 28.8% 33.1% 28.4% 37.8%
Sensitivity Analysis 1: pensions are a government transferGini 0.528 0.481 0.344 0.341 0.258Headcount index$2.5 PPP 8.5% 9.0% 1.8% 3.1%$4 PPP 17.3% 19.0% 7.3% 12.5%National Moderate PL 14.7% 16.8% 5.6% 9.8%Other Moderate PL (FIEL) 33.8% 39.3% 28.5% 37.9%

17
taxes; however, poverty increases because indirect taxes lie more heavily on low income consumers.
The reduction in poverty and inequality is further propelled by in-kind transfers in education and health, as shown when calculating the Gini index with final income: the final income Gini (compared to the market income Gini) declines by 24% in the benchmark case. When pensions are considered a government transfer, the impact is markedly higher.
7.2. Coverage and Effectiveness of Direct Transfers
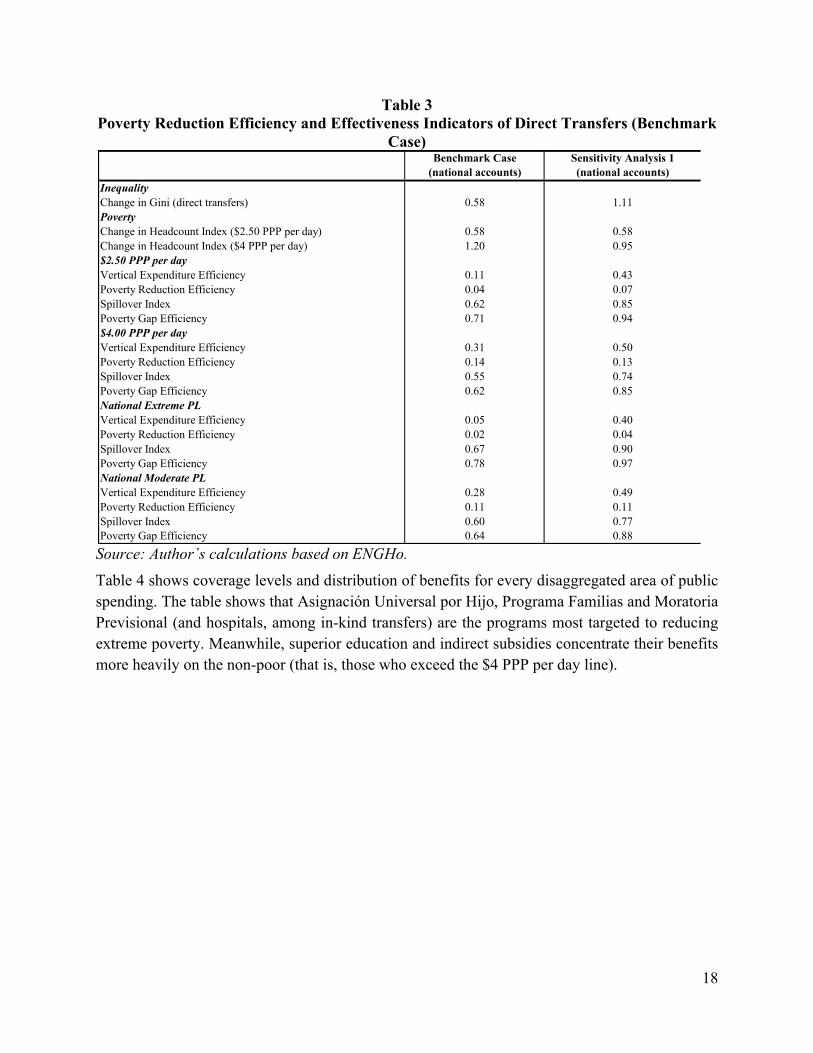
Table 3 presents indicators that measure the extent to which direct transfers are effective and efficient in reducing poverty (using both international and national poverty lines) for the benchmark and sensitivity analysis. The effectiveness indicator is defined as the effect on inequality (or on poverty) of the transfers being analyzed divided by their relative size (as a percent of GDP). As shown, Gini falls more significantly when pensions are considered a government transfer and is less relevant than the benchmark case when analyzing the reduction in moderate poverty.
The Vertical Expenditure Efficiency (VEE) indicator measures the amount of direct transfers that go to the poor. This indicator shows that 11% of direct transfers reach the extreme poor while 31% of direct transfers reach the total poor population (using international poverty lines). (The results were 43% and 50% in the sensitivity analysis). The spillover index (S) indicates how much of the spending that reached the poor was in excess of the strictly necessary amount required for the beneficiaries to reach the poverty line. As shown, the spillovers are high. The Poverty Reduction Efficiency (PRE) indicator is the product of VEE times S. Finally, the Poverty Gap Efficiency (PGE) measures the transfers’ effectiveness in reducing the poverty gap. PGE estimates indicate that direct transfers are more efficient in reducing extreme poverty gaps than in reducing total poverty gaps.
18
Table 3 Poverty Reduction Efficiency and Effectiveness Indicators of Direct Transfers (Benchmark
Case)
Source: Author´s calculations based on ENGHo. Table 4 shows coverage levels and distribution of benefits for every disaggregated area of public spending. The table shows that Asignación Universal por Hijo, Programa Familias and Moratoria Previsional (and hospitals, among in-kind transfers) are the programs most targeted to reducing extreme poverty. Meanwhile, superior education and indirect subsidies concentrate their benefits more heavily on the non-poor (that is, those who exceed the $4 PPP per day line).
(national accounts) (national accounts)Inequality Change in Gini (direct transfers) 0.58 1.11PovertyChange in Headcount Index ($2.50 PPP per day) 0.58 0.58Change in Headcount Index ($4 PPP per day) 1.20 0.95$2.50 PPP per dayVertical Expenditure Efficiency 0.11 0.43Poverty Reduction Efficiency 0.04 0.07Spillover Index 0.62 0.85Poverty Gap Efficiency 0.71 0.94$4.00 PPP per dayVertical Expenditure Efficiency 0.31 0.50Poverty Reduction Efficiency 0.14 0.13Spillover Index 0.55 0.74Poverty Gap Efficiency 0.62 0.85National Extreme PLVertical Expenditure Efficiency 0.05 0.40Poverty Reduction Efficiency 0.02 0.04Spillover Index 0.67 0.90Poverty Gap Efficiency 0.78 0.97National Moderate PLVertical Expenditure Efficiency 0.28 0.49Poverty Reduction Efficiency 0.11 0.11Spillover Index 0.60 0.77Poverty Gap Efficiency 0.64 0.88
Benchmark Case Sensitivity Analysis 1

19
Table 4 Coverage and Distribution of Benefits and Beneficiaries by Program
Source: Author´s calculations based on ENGHo. 7.3. Incidence Analysis
The incidence analysis has been calculated through the ratio of benefits to market income by market income deciles. The effect of direct taxes and direct transfers leads to a reduction in inequality; the highest decile by market income ranking is the one that bears the highest proportion of direct taxes. Meanwhile, in the case of direct transfers, the effect is the inverse, since the lowest market income deciles receive the highest proportion of transfers.
Indirect taxes show that the lowest market income deciles pay a higher proportion of their market income in taxes; this effect is partially mitigated by the indirect subsidies. In-kind transfers (health and education) fall heavily on the lowest market income deciles.
Groups:y < 2.5 2.5 < y < 4 y > 4
Health-Hospitals 14.7% 15.5% 69.8%Health-Contributory 1.0% 3.8% 95.2%Health-Contributory - elderly -INSSJyP 2.3% 4.8% 93.0%Education-Basic 5.6% 8.6% 85.8%Education-Tertiary and University 0.4% 1.3% 98.2%Transportation 1.1% 2.6% 96.2%Subsidies on bus tariffs 1.5% 3.0% 95.5%Subsidies on train tariffs 1.0% 2.8% 96.2%Subsidies on subway tariffs 0.0% 1.8% 98.2%Subsidies on airplane tariffs 0.0% 0.0% 100.0%Electricity 2.3% 3.2% 94.5%Gas red 0.8% 1.1% 98.1%Gas "Garrafa social" 3.5% 8.1% 88.4%Gas total 1.1% 1.9% 97.0%Combustibles directo 0.1% 0.2% 99.7%Combustibles indirecto 2.0% 3.0% 95.0%Asignaciones Familiares 2.9% 6.6% 90.5%Asignación Universal por Hijo 16.2% 21.7% 62.1%Plan de Inclusión Previsional y Moratoria Previsional 12.2% 22.5% 65.2%Seguro de capacitación y empleo 4.1% 2.8% 93.1%Programa Familias por la Inclusión Social 20.1% 36.7% 43.1%Becas universitarias 0.0% 0.0% 100.0%Programa jóvenes con más y mejor trabajo 3.3% 4.0% 92.7%Seguro de desempleo 7.4% 15.6% 77.1%Comedores escolares y comunitarios 7.2% 14.6% 78.2%Direct Cash Transfers 10.6% 18.4% 71.0%Total Non-contributory pensions 12.2% 22.5% 65.2%Total Contributory Pensions 0.5% 1.2% 98.3%Total Education Spending 4.3% 6.9% 88.8%Total Health Spending 6.8% 8.7% 84.5%Total CEQ Social Spending 6.4% 9.6% 84.0%Income shares 0.3% 0.9% 98.8%Population shares 4.1% 6.0% 89.9%

20
Table 6 shows the results on poverty. The picture is roughly similar; most impoverished households benefit strongly from direct and in-kind transfers (health and education); the richest receive a greatly reduced proportion of these benefits.
Table 5 Incidence of Taxes and Transfers on Income Distribution in Percentages (Benchmark
Analysis)
Source: Author´s calculations based on ENGHo.
Table 6 Incidence of Taxes and Transfers on Poverty in Percentages (Benchmark Analysis)
Source: Author´s calculations based on ENGHo.
Direct Taxes
Contributions
EXCLUDING
CONTRIBUTIONS TO PENSIONS
Non-contributory Pensions
Flagship CCT
Other Direct
Transfers (Targeted or Not)
All Direct Transfers
Indirect Subsidies
Indirect Taxes
Net Indirect Taxes
In-kind Education
In-kind Health
In-kind Transfers
Deciles 1 -0.4 -3.1 40.1 18.6 20.4 79.1 15.1 -41.1 -26.0 76.9 94.2 171.12 -0.3 -5.5 5.4 6.8 9.1 21.3 9.3 -28.4 -19.2 40.2 46.6 86.73 -0.3 -9.0 3.4 2.7 4.4 10.5 7.5 -24.1 -16.5 25.4 25.0 50.44 -0.2 -11.8 2.9 1.0 2.9 6.8 7.8 -23.0 -15.3 18.3 16.7 35.05 -0.3 -12.3 1.8 0.7 2.3 4.8 6.5 -22.1 -15.7 14.4 13.0 27.46 -0.2 -13.6 2.0 0.1 1.8 3.9 6.5 -21.8 -15.3 11.0 9.8 20.87 -0.2 -15.2 0.9 0.1 1.0 2.0 5.3 -21.0 -15.7 8.5 6.7 15.28 -0.4 -15.9 0.6 0.0 0.7 1.3 7.2 -19.9 -12.6 6.5 4.4 11.09 -1.9 -17.0 0.3 0.0 0.3 0.7 4.5 -18.9 -14.4 4.1 2.7 6.8
10 -10.9 -19.6 0.2 0.0 0.2 0.3 3.0 -15.0 -12.0 2.2 0.9 3.2
-4.4 -16.1 1.4 0.6 1.3 3.4 5.2 -19.1 -14.0 8.5 7.5 16.0Total Population
Group:
Direct Taxes
Contributions
EXCLUDING
CONTRIBUTION
S TO PENSIO
NS
Non-contribut
ory Pensions
Flagship CCT
Other Direct
Transfers
(Targeted or Not)
All Direct
Transfers
Indirect Subsidie
s
Indirect Taxes
Net Indirect Taxes
In-kind Educatio
n
In-kind Health
In-kind Transfers
-0.9 -1.1 60.8 98.9 86.5 246.2 36.6 -81.3 -44.7 321.3 437.1 758.3-0.4 -1.6 57.4 24.4 20.8 102.6 18.5 -47.3 -28.8 98.3 136.5 234.8-0.3 -3.5 33.7 13.9 17.9 65.5 13.3 -37.7 -24.4 61.9 69.1 131.0-0.3 -8.3 4.1 3.5 5.6 13.2 8.1 -25.3 -17.2 28.3 29.6 57.9-1.2 -15.5 0.9 0.2 1.0 2.1 5.9 -20.2 -14.3 7.8 6.2 13.9
-11.7 -19.8 0.1 0.0 0.2 0.3 2.6 -14.6 -12.0 2.1 0.8 2.9
-4.4 -16.1 1.4 0.6 1.3 3.4 5.2 -19.1 -14.0 8.5 7.5 16.0
y < 1.251.25 < = y < 2.502.50 <= y < 4.004.00 <= y < 10.0010.00 <= y < 50.0050.00 <= y
Total Population
21
7.4. Progressivity
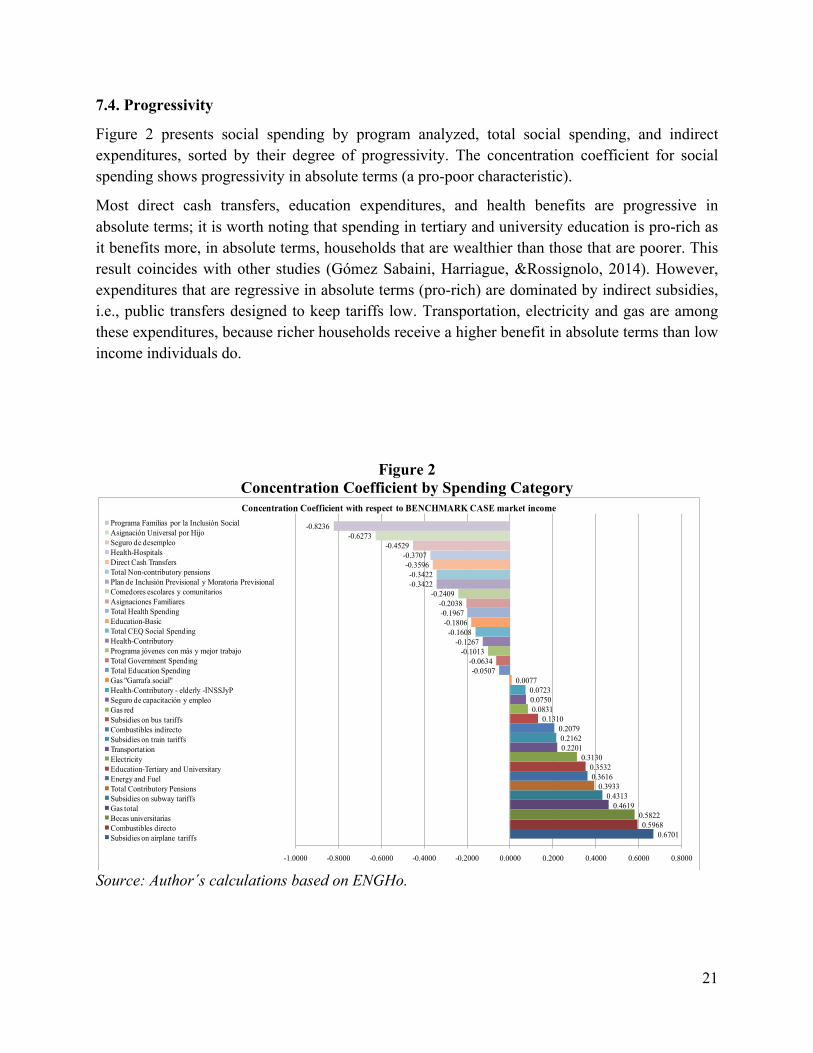
Figure 2 presents social spending by program analyzed, total social spending, and indirect expenditures, sorted by their degree of progressivity. The concentration coefficient for social spending shows progressivity in absolute terms (a pro-poor characteristic).
Most direct cash transfers, education expenditures, and health benefits are progressive in absolute terms; it is worth noting that spending in tertiary and university education is pro-rich as it benefits more, in absolute terms, households that are wealthier than those that are poorer. This result coincides with other studies (Gómez Sabaini, Harriague, &Rossignolo, 2014). However, expenditures that are regressive in absolute terms (pro-rich) are dominated by indirect subsidies, i.e., public transfers designed to keep tariffs low. Transportation, electricity and gas are among these expenditures, because richer households receive a higher benefit in absolute terms than low income individuals do.
Figure 2 Concentration Coefficient by Spending Category
Source: Author´s calculations based on ENGHo.
0.67010.5968
0.58220.4619
0.43130.3933
0.36160.3532
0.31300.22010.21620.2079
0.13100.08310.07500.0723
0.0077-0.0507
-0.0634-0.1013
-0.1267-0.1608
-0.1806-0.1967-0.2038
-0.2409-0.3422-0.3422
-0.3596-0.3707
-0.4529-0.6273
-0.8236
-1.0000 -0.8000 -0.6000 -0.4000 -0.2000 0.0000 0.2000 0.4000 0.6000 0.8000
Concentration Coefficient with respect to BENCHMARK CASE market incomePrograma Familias por la Inclusión SocialAsignación Universal por HijoSeguro de desempleoHealth-HospitalsDirect Cash TransfersTotal Non-contributory pensionsPlan de Inclusión Previsional y Moratoria PrevisionalComedores escolares y comunitariosAsignaciones FamiliaresTotal Health Spending Education-BasicTotal CEQ Social SpendingHealth-ContributoryPrograma jóvenes con más y mejor trabajoTotal Government SpendingTotal Education Spending Gas "Garrafa social"Health-Contributory - elderly -INSSJyPSeguro de capacitación y empleoGas redSubsidies on bus tariffsCombustibles indirectoSubsidies on train tariffsTransportationElectricityEducation-Tertiary and UniversitaryEnergy and FuelTotal Contributory PensionsSubsidies on subway tariffsGas totalBecas universitariasCombustibles directoSubsidies on airplane tariffs

22
Figure 3 Lorenz and Concentration Curves for Aggregate Public Expenditures
Source: Author´s calculations based on ENGHo. Figure 3 presents Lorenz and concentration curves for aggregate public expenditures and market income, while Figure 4 shows these curves for every income concept. Social expenditures, direct transfers and non-contributory expenditures are progressive in absolute (pro-poor) and relative terms, while indirect subsidies benefit the rich in absolute terms.
Figure 4 expresses the redistribution through taxes and public expenditures. The Lorenz curve corresponding to final income lies above that of market income, showing that public intervention improves income distribution.
0.2
.4.6
.81
Cum
ulat
ive
prop
ortio
n of
inco
me
0 .2 .4 .6 .8 1Cumulative proportion of population
45° line
C(p): total_gasto_social_pc_2
C(p): total_gasto_publico_pc_2
C(p): directtransferspc_2
C(p): nocontribpc_2
C(p): subsidios_totalespc_2
L(p): ipcf_market_income_2
Lorenz and Concentration Curves

23
Figure 4 Lorenz and Concentration Curves for Aggregate Public Expenditures
Source: Author´s calculations based on ENGHo 8. Conclusions
After the crisis in 2001, which generated an increase in poverty indicators and inequality, the government in Argentina instituted a series of policies intended to ameliorate inequality and reduce poverty. Among the policies introduced from 2002 to 2003 (Programa Jefes y Jefas de Hogar) and expanded from 2008 to 2009, programs such as Asignación Universal por Hijo and Moratoria Previsional have been the most effective. Additionally, in order to help expand aggregate demand, indirect (economic) subsidies were introduced to keep tariffs on electricity and transportation low for greater Buenos Aires residents.
On the tax side, an increase in revenues from direct taxes (income tax, social security contributions) through expansions in tax bases accompanied the nominal increase of traditional indirect tax revenues.
This study has introduced the CEQ methodology to analyze the impact of public expenditures and taxes on income distribution and poverty in Argentina using ENGHo survey data from 2012-2013. The results show a high degree of correction in both welfare indicators: market inequality is strongly reduced and poverty is highly ameliorated. However, due to indirect subsidies and
0.2
.4.6
.81
Cum
ulat
ive
prop
ortio
n of
inco
me
0 .2 .4 .6 .8 1Cumulative proportion of population
45° line
L(p): ipcf_market_income_2
C(p): ipcf_net_market_income_2
C(p): ipcf_net_disposable_income_2
C(p): ipcf_net_postindtsub_income_2
C(p): ipcf_net_final_income_2
Lorenz and Concentration Curves

24
programs like Asignaciones Familiares in the formal sector, there is still a high spillover effect when targeting the poor.
Additionally, the increase in the public deficit raises the question of whether this level of public expenditure can be sustained, given the fact that tax revenues have already reached a historic peak. A reduction in spending, without greatly altering the reductions in inequality and poverty, should necessarily consider reducing economic subsidies.

25
References
AFIP. (2013). “Anuario Estadísticas Tributarias, Año 2012.” Buenos Aires, Argentina.
ASAP. (2014). "Subsidios y compensaciones tarifarias en transporte."
ASAP. (2013). "Informe de ejecución presupuestaria de la Administración pública nacional."
Barreix, A., Roca, J.,& Villela, L. (2006). "La equidad fiscal en los países andinos." BID-Eurosocial.
Bucheli, M., Lustig, N., Rossi, M., & Amábile, F.(2013)."Social Spending, Taxes, and Income Redistribution in Uruguay." CEQ Working Paper No. 10, Center for Inter-American Policy and Research and Department of Economics, Tulane University and Inter-American Dialogue, REVISED July 2013.
Cowell, F. (1995).“Measuring inequality.”LSE Handbooks in Economic Series, Prentice Hall/Harvester Wheatsheaf.
Demery, L. (2003). "Analyzing the Impact of Social Spending," In F. Bourguignon& L. P. Da Silva, The Impact of Economic Policies on Poverty and Income Distribution. World Bank and Oxford University Press.
Dirección Nacional de Investigaciones y Análisis Fiscal (DNIAF), Ministry of Economy and PublicFinance. (2013). "Tributos vigentes en Argentina 2012."
Flood,C., Gasparini, L., Harriague, M.,& Velez, B. (1994). “El impacto distributivo del gasto público social en Argentina.” Ministerio de Economía y Obras y Servicios Públicos.
Gaggero, J. & Rossignolo, D. (2011): "Impacto del presupuesto sobre la equidad. Cuadro de situación, Argentina 2010" Documento de Trabajo N° 40, CEFID-AR
Gasparini, L. (1998). “Incidencia distributiva del sistema impositivo argentino.” In La reformatributaria en la Argentina. Fundación de Investigaciones Económicas Latinoamericanas.
Gasparini, L. (1999). “Incidencia distributiva del gasto público social y de la política tributaria argentina.” In La distribución del ingreso en la Argentina” Fundación de Investigaciones Económicas Latinoamericanas.
Gasparini, L.,& Cruces, G. (2009).“Desigualdad en Argentina. Unarevisión de la evidencia empírica.” DesarrolloEconómico,48-49(192-193).
Gasparini, L.,& Lustig, N. (2011).“The rise and fall of income inequality in Latin America.”Handbook of Latin American Economics.Oxford UniversityPress.
Gasparini, L.,& Porto, A. (1992). “Impacto distributivo del gasto público social.” DesarrolloEconómico, 31(110).
Gómez Sabaini, J. C., Harriague, M.,& Rossignolo, D. (2013). “Argentina. La situación fiscal y los efectos en la distribución del ingreso.” Desarrollo Económico, 52(207-208).

26
Gómez Sabaini, J. C. & Rossignolo, D. (2001): “Análisis de la incidencia de los impuestos y de la política fiscal sobre la distribución del ingreso en Argentina”, Noveno Congreso Tributario del CPCECABA
Gómez Sabaini, J.,& Rossignolo, D. (2009). “Argentina. Análisis de la situación tributaria y propuestas de reformas impositivas destinadas a mejorar la distribución del ingreso.” In S. Keifman, Reflexiones y propuestas para mejorar la distribución del ingreso en Argentina. Oficina de la Organización Internacional del Trabajo en Buenos Aires.
Gómez Sabaini, J.,& Rossignolo, D. (2014). “La tributación sobre las altas rentas en América Latina.” Serie Estudios y Perspectivas No. 13, ECLAC Montevideo Office.
Gómez Sabaini, J., Santiere, J.,& Rossignolo, D. (2002). “La equidad distributiva y el sistema tributario: un análisis para el caso argentino.” ILPES-CEPAL, Serie Gestión Pública.
Goñi, E., Lopez, H., & Servén, L. (2008).“Fiscal Redistribution and Income Inequality in LatinAmerica.”World Bank.
INDEC. (2012). "Muestra Maestra Urbana de viviendas de la República Argentina. Mmuvra 2011, Documento Metodológico." I Reunión del Grupo de Trabajo Sobre Encuestas a Hogares de la Conferencia Estadística de las Américas, Buenos Aires, October 2012.
Jaramillo Baanante, M. (2013)."The Incidence of Social Spending and Taxes in Peru." CEQ Working Paper No. 9, Center for Inter-American Policy and Research and Department of Economics, Tulane University and Inter-American Dialogue, REVISED May 2013.
Lambert, P. (1993).The Distribution and Redistribution of Income. Manchester University Press.
Lustig, N.,& Higgins, S. (2013). "Commitment to Equity Assessment (CEQ): Estimating the Incidence of Social Spending, Subsidies and Taxes Handbook."CEQ Working Paper No. 1, Center for Inter-American Policy and Research and Department of Economics, Tulane University and Inter-American Dialogue, September.
Lustig, N.,& Higgins, S. (2013).“Measuring Impoverishment: An Overlooked Dimension of Fiscal Incidence.” CEQ Working Paper No. 14.
Lustig, N.,& Pessino, C. (2013). "Social Spending and Income Redistribution in Argentina in the 2000s: The Rising Role of Noncontributory Pensions." CEQ Working Paper No. 5.
Lustig, N.,& Pessino, C. (2013)."¿Es la Argentina un modelo de políticas redistributivas?." PublicadoenBastión Digital Argentina.
Martínez-Vázquez, J. (2001).“El impacto de los presupuestos sobre los pobres. Incidencia fiscal y de beneficios.” mimeo Georgia State University
Marchionni, M., Sosa Escudero, W.,&Alejo, J. (2008). “La incidencia distributiva del acceso, gasto y consumo en los servicios públicos.” Documento de Trabajo CEDLAS N° 67, April.

27
Maurizio, R. (2009). “Políticas de transferencias monetarias en Argentina: Evaluación de su impacto sobre la pobreza y la desigualdad, y evaluación de sus costos.” In S. Keifman, Reflexiones y propuestas para mejorar la distribución del ingreso en Argentina. Oficina de la OrganizaciónInternacional del Trabajo en Buenos Aires.
Rossignolo, D. (2015). "Competencia tributaria vertical: una estimación empírica en impuestossobre los consumos en Argentina."Urban Public Economic Review, 21.
Rossignolo, D.,& Ramos, M. (2015). "Efectos distributivos de cambios discrecionales en la política fiscal en Argentina." Revista de Economía Política de Buenos Aires, 9(15).
Secretaria de Política Económica, DNPGS. (2002). “El impacto redistributivo de la Política Social en Argentina.” Serie: Gasto Público, Documento de trabajo: Nº GP/ 12.
Secretaría de Política Económica, DGSC. (2001). “Caracterización y Evolución del GastoPúblico Social 2000.”.Ministerio de Economía, Buenos Aires.
Secretaría de Programación Económica y Regional, DNPGS. (1999). “El impacto redistributivo del gasto público en los Sectores Sociales. Resultados provisorios.” Serie: GastoPúblico, Documento de trabajo: Nº GP/ 08.
Sahn, D.,& Younger, S. (2003)."Estimating the Incidence of Indirect Taxes in Developing Countries." In F. Bourguignon& L.P. Da Silva, The Impact of Economic Policies on Poverty and Income Distribution. World Bank and Oxford University Press.
Appendix
Table 1
Comparative Results of Studies on the Impact of Taxes and Expenditures on Income Distribution
Source: author´s calculations, based on the following references. References: 1: Gasparini, L. (1999); 2: Gasparini, L. (1999); 3: Gómez Sabaini, J. C. & Rossignolo, D. (2001); 4: Secretaria de Política Económica, DNPGS (2002); 5: Secretaria de Política Económica, DNPGS (2002); 6: Gasparini, L. & Cruces, G. (2009); 7: Gaggero, J. & Rossignolo, D. (2011); 8:Gaggero, J. & Rossignolo, D. (2011); 9:Gómez Sabaíni, J., Harriague, M. & Rossignolo, D. (2011); 10:Rossignolo, D. (2016): CEQ Masterworkbook, CEQ Institute, Tulane University; 11:Rossignolo, D. (2016): CEQ Masterworkbook, CEQ Institute, Tulane University
1 1992 Social public expenditure including pensions with financed with taxes 0.342 0.260 s/d 0.2592 1996 Social public expenditure including pensions with financed with taxes 0.362 0.274 s/d 0.2763 1997 Social public expenditure including pensions with financed with taxes s/d s/d s/d s/d4 1997 Social public expenditure excluding pensions and employment programs financed with taxes 0.548 s/d s/d 0.4355 1998 Social public expenditure excluding pensions and employment programs financed with taxes 0.548 s/d s/d 0.4306 2003 Social public expenditure excluding pensions financed with taxes 0.544 s/d s/d 0.4617 2010 Social public expenditure including pensions financed with taxes 0.479 0.345 0.472 0.2888 2010 Total public expenditure financed with taxes 0.479 0.324 0.472 0.2279 2008 Social public expenditure excluding social security and AUH financed with taxes 0.484 0.406 0.479 0.39710 2012 Total public expenditure analyzed without pensions with taxes analyzed 0.481 s/d s/d 0.30311 2012 Total public expenditure analyzed with pensions with taxes analyzed 0.528 s/d s/d 0.258
INDICES
Gini pre Gini after expenditures
Gini after taxes
Gini after taxes and expenditures
Ref.Base year
Universe

WHAT IS CEQ?
The CEQ logo is a stylized graphical representation of a Lorenz curve for a fairly unequal distribution of income (the bottom part of the C, below the diagonal) and a concentration curve for a very progressive transfer (the top part of the C).
Led by Nora Lustig since 2008, the Commitment to Equity (CEQ) project is an initiative of the Center for Inter-American Policy and Research (CIPR) and the Department of Economics, Tulane University, the Center for Global Development and the Inter-American Dialogue. The project’s main output is the CEQ Assessment, a methodological framework designed to analyze the impact of taxation and social spending on inequality and poverty in individual countries. The main objective of the CEQ is to provide a roadmap for governments, multilateral institutions, and nongovernmental organizations in their efforts to build more equitable societies.
Since its inception, the CEQ has received financial support from Tulane University’s Center for Inter-American Policy and Research, the School of Liberal Arts and the Stone Center for Latin American Studies as well as the Bill & Melinda Gates Foundation, the Inter-American Development Bank (IADB), the World Bank, the United Nations Development Programme’s Regional Bureau for Latin America and the Caribbean (UNDP/RBLAC), the Development Bank of Latin America (CAF), the African Development Bank, the International Fund for Agricultural Development (IFAD), the Canadian International Development Agency (CIDA), the Norwegian Ministry of Foreign Affairs, and the General Electric Foundation. www.commitmentoequity.org