cep_38
DESCRIPTION
geneTRANSCRIPT
Protein Determination Assays
Xin Li
Scott Group
05/10/2005
Quantitative Determination of Proteins• There is no completely satisfactory single
method to determine the concentration of protein in any given sample
• The choice of the method depends on the nature of the protein, the nature of the other components in the protein sample, desired speed ,accuracy and sensitivity of assay
Methods Used for Protein Determination
• Biuret Test
• Folin-Ciocalteu ( Lowry ) Assay
• Bicinchoninic Acid ( BCA ) Assay
• Dye-Binding ( Bradford ) Assay
• Ultraviolet Absorbance
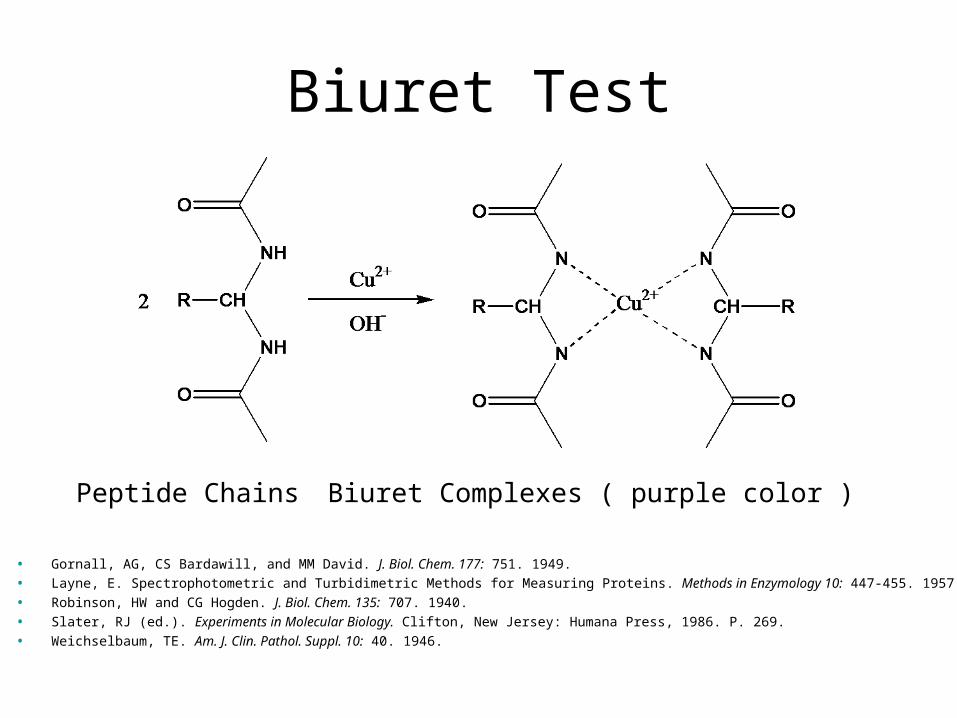
Biuret Test
Peptide Chains Biuret Complexes ( purple color )
• Gornall, AG, CS Bardawill, and MM David. J. Biol. Chem. 177: 751. 1949.
• Layne, E. Spectrophotometric and Turbidimetric Methods for Measuring Proteins. Methods in Enzymology 10: 447-455. 1957.
• Robinson, HW and CG Hogden. J. Biol. Chem. 135: 707. 1940.
• Slater, RJ (ed.). Experiments in Molecular Biology. Clifton, New Jersey: Humana Press, 1986. P. 269.
• Weichselbaum, TE. Am. J. Clin. Pathol. Suppl. 10: 40. 1946.
Biuret Test
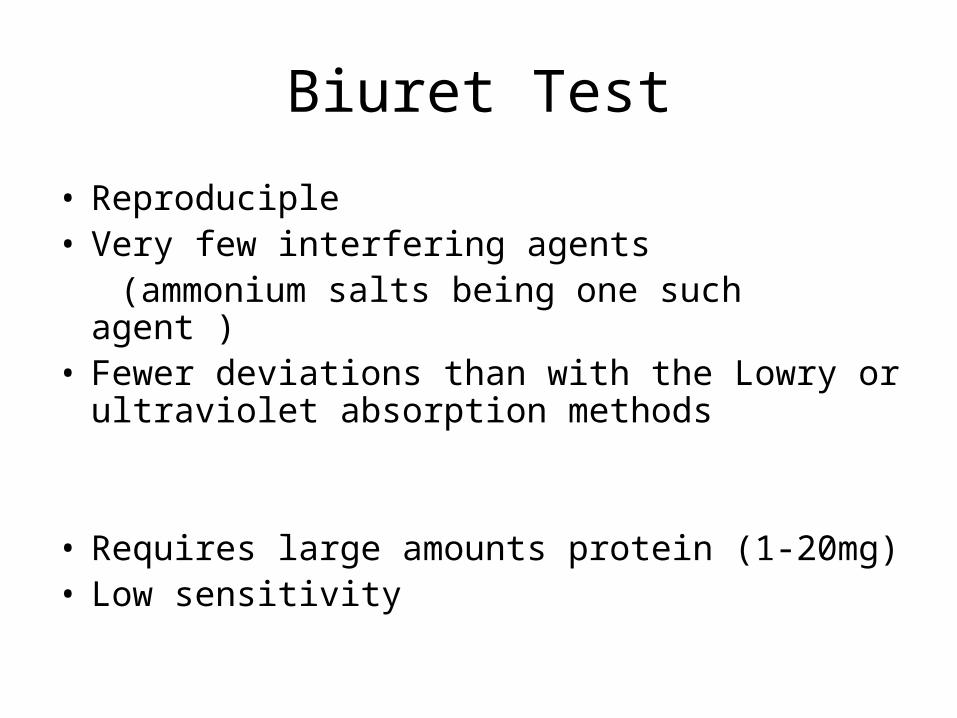
• Reproduciple• Very few interfering agents (ammonium salts being one such agent )• Fewer deviations than with the Lowry or
ultraviolet absorption methods
• Requires large amounts protein (1-20mg)• Low sensitivity
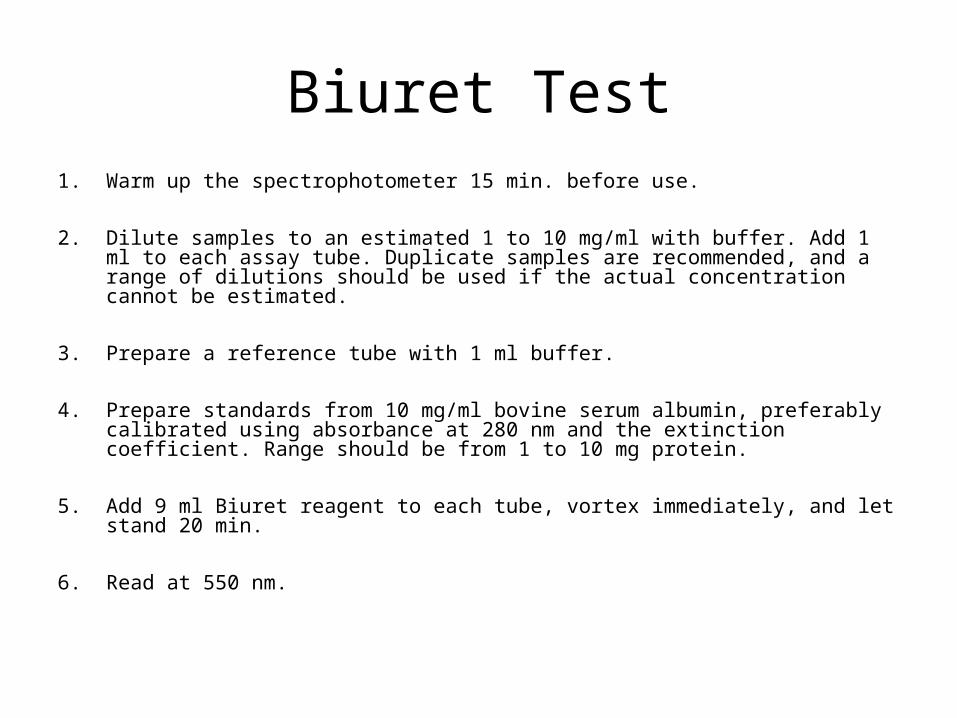
Biuret Test1. Warm up the spectrophotometer 15 min. before use.
2. Dilute samples to an estimated 1 to 10 mg/ml with buffer. Add 1 ml to each assay tube. Duplicate samples are recommended, and a range of dilutions should be used if the actual concentration cannot be estimated.
3. Prepare a reference tube with 1 ml buffer.
4. Prepare standards from 10 mg/ml bovine serum albumin, preferably calibrated using absorbance at 280 nm and the extinction coefficient. Range should be from 1 to 10 mg protein.
5. Add 9 ml Biuret reagent to each tube, vortex immediately, and let stand 20 min.
6. Read at 550 nm.
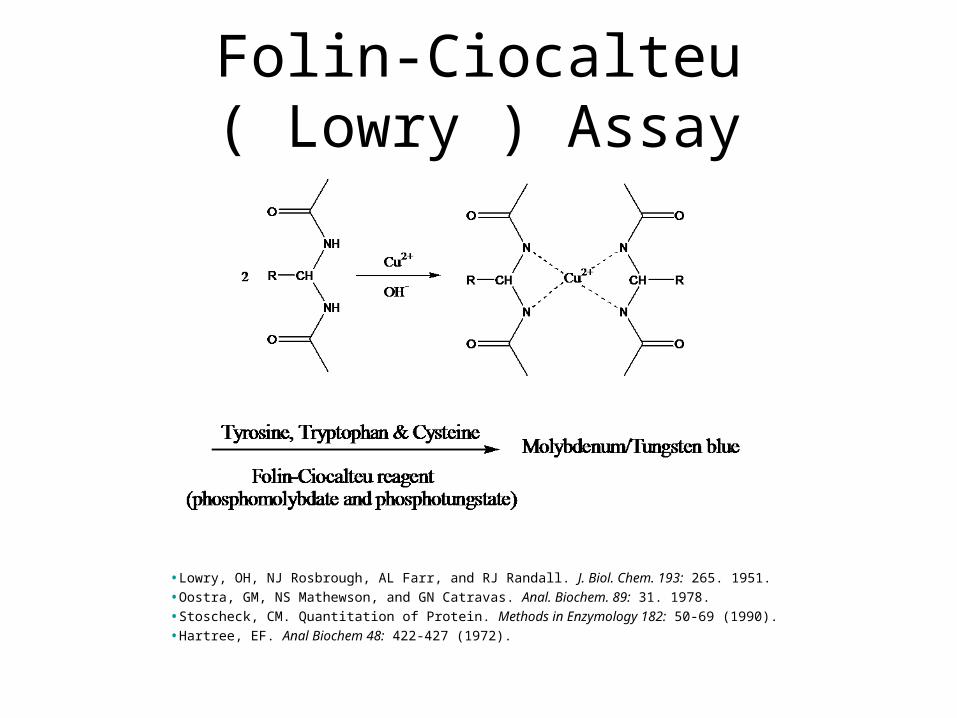
Folin-Ciocalteu ( Lowry ) Assay
•Lowry, OH, NJ Rosbrough, AL Farr, and RJ Randall. J. Biol. Chem. 193: 265. 1951.
•Oostra, GM, NS Mathewson, and GN Catravas. Anal. Biochem. 89: 31. 1978.
•Stoscheck, CM. Quantitation of Protein. Methods in Enzymology 182: 50-69 (1990).
•Hartree, EF. Anal Biochem 48: 422-427 (1972).
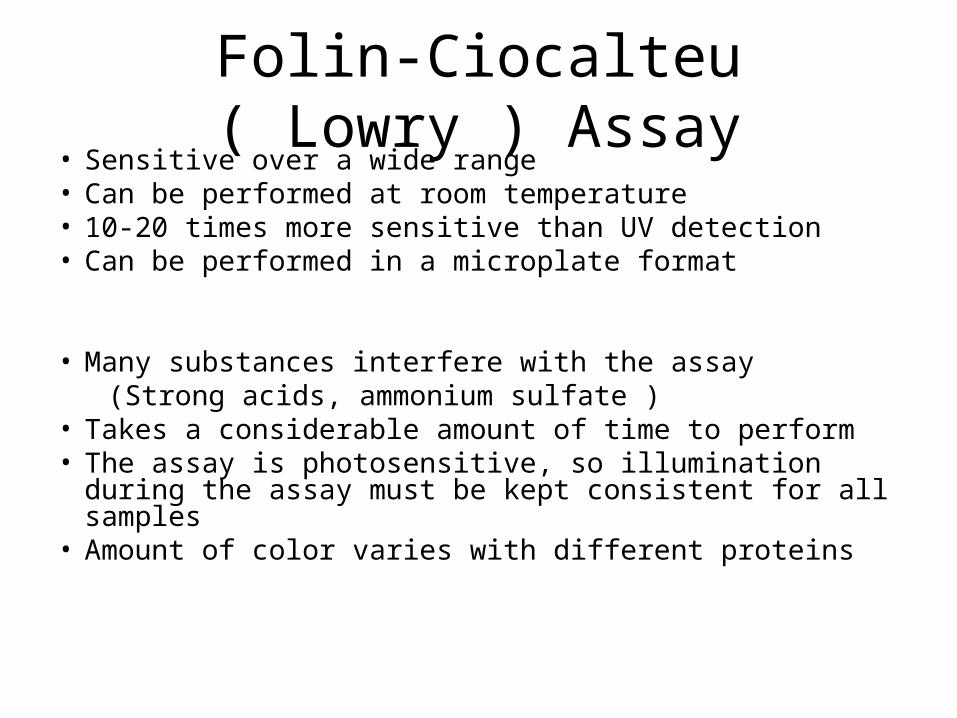
Folin-Ciocalteu ( Lowry ) Assay• Sensitive over a wide range • Can be performed at room temperature • 10-20 times more sensitive than UV detection • Can be performed in a microplate format
• Many substances interfere with the assay (Strong acids, ammonium sulfate )• Takes a considerable amount of time to perform • The assay is photosensitive, so illumination during the
assay must be kept consistent for all samples • Amount of color varies with different proteins
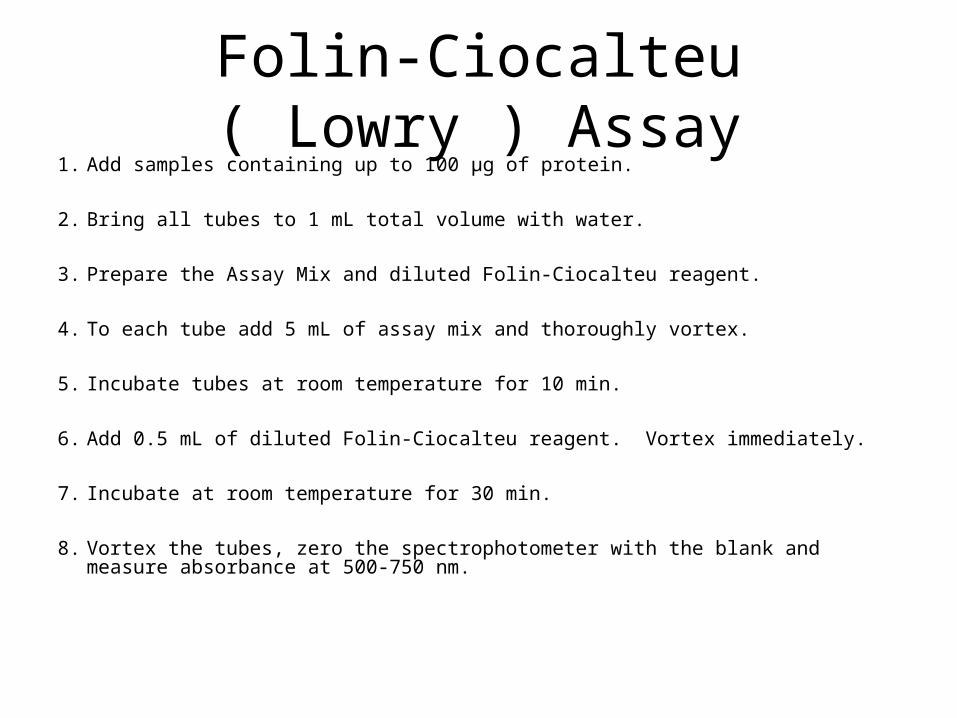
Folin-Ciocalteu ( Lowry ) Assay1. Add samples containing up to 100 µg of protein.
2. Bring all tubes to 1 mL total volume with water.
3. Prepare the Assay Mix and diluted Folin-Ciocalteu reagent.
4. To each tube add 5 mL of assay mix and thoroughly vortex.
5. Incubate tubes at room temperature for 10 min.
6. Add 0.5 mL of diluted Folin-Ciocalteu reagent. Vortex immediately.
7. Incubate at room temperature for 30 min.
8. Vortex the tubes, zero the spectrophotometer with the blank and measure absorbance at 500-750 nm.
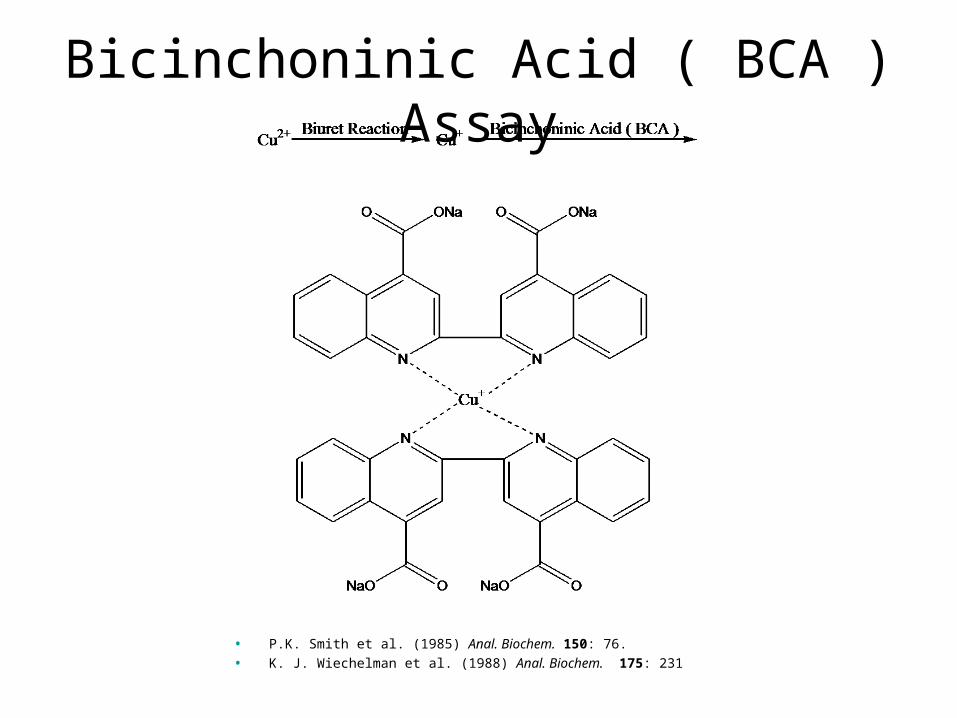
Bicinchoninic Acid ( BCA ) Assay
• P.K. Smith et al. (1985) Anal. Biochem. 150: 76.
• K. J. Wiechelman et al. (1988) Anal. Biochem. 175: 231
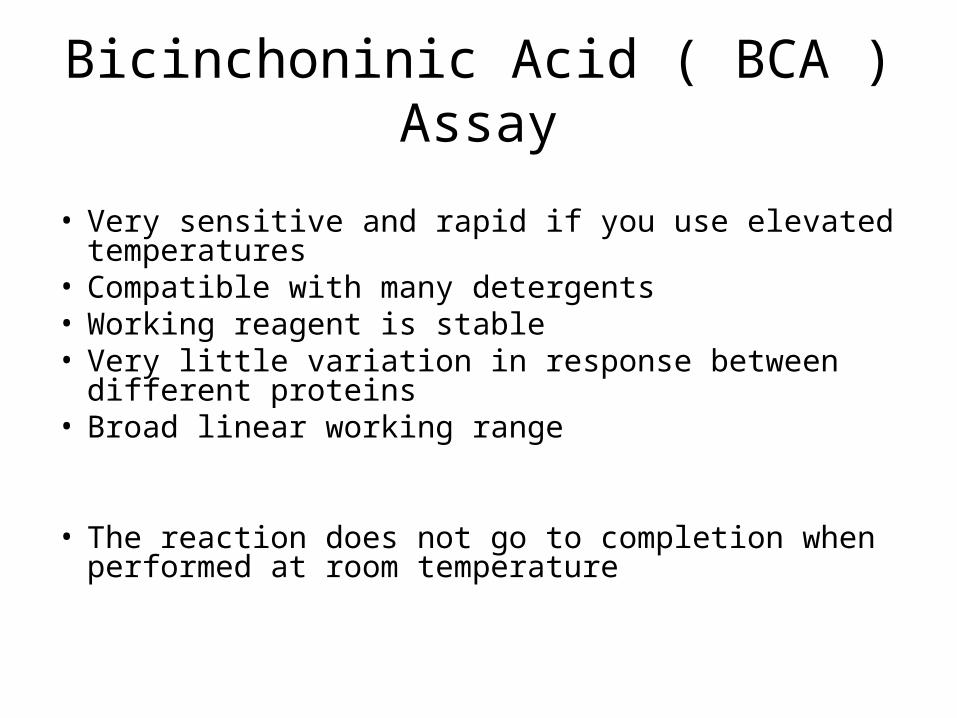
Bicinchoninic Acid ( BCA ) Assay
• Very sensitive and rapid if you use elevated temperatures
• Compatible with many detergents • Working reagent is stable • Very little variation in response between different proteins • Broad linear working range
• The reaction does not go to completion when performed at room temperature
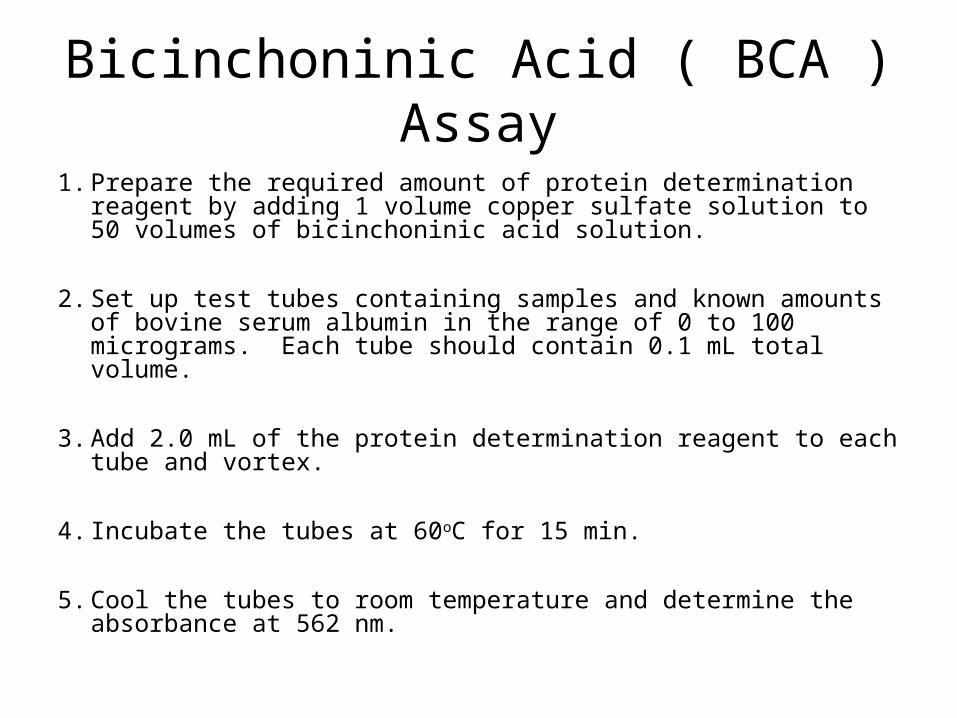
Bicinchoninic Acid ( BCA ) Assay
1. Prepare the required amount of protein determination reagent by adding 1 volume copper sulfate solution to 50 volumes of bicinchoninic acid solution.
2. Set up test tubes containing samples and known amounts of bovine serum albumin in the range of 0 to 100 micrograms. Each tube should contain 0.1 mL total volume.
3. Add 2.0 mL of the protein determination reagent to each tube and vortex.
4. Incubate the tubes at 60oC for 15 min.
5. Cool the tubes to room temperature and determine the absorbance at 562 nm.
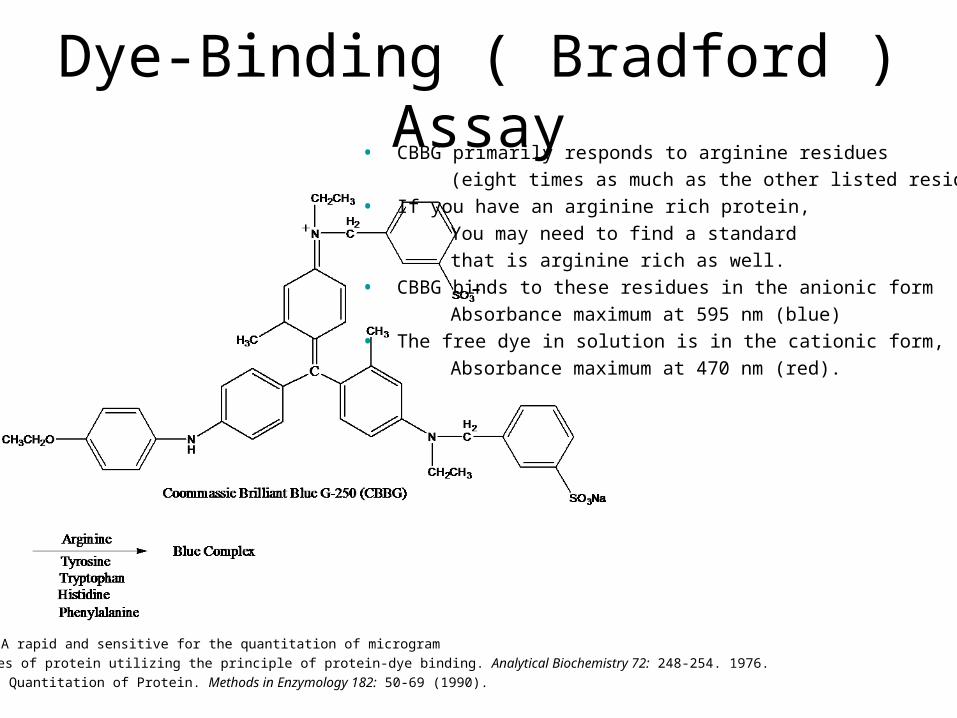
Dye-Binding ( Bradford ) Assay
• Bradford, MM. A rapid and sensitive for the quantitation of microgram quantitites of protein utilizing the principle of protein-dye binding. Analytical Biochemistry 72: 248-254. 1976.
• Stoscheck, CM. Quantitation of Protein. Methods in Enzymology 182: 50-69 (1990).
• CBBG primarily responds to arginine residues (eight times as much as the other listed residues)
• If you have an arginine rich protein, You may need to find a standard that is arginine rich as well.
• CBBG binds to these residues in the anionic form Absorbance maximum at 595 nm (blue)
• The free dye in solution is in the cationic form, Absorbance maximum at 470 nm (red).
Dye-Binding ( Bradford ) Assay• Fast and inexpensive • Highly specific for protein • Very sensitive [1-20 µg (micro assay) 20-200 µg (macro assay)] • Compatible with a wide range of substances • Extinction co-efficient for the dye-protein complex is stable
over 10 orders of magnitude (assessed in albumin) • Dye reagent is complex is stable for approximately one hour
• Non-linear standard curve over wide ranges • Response to different proteins can vary widely, choice of
standard is very important
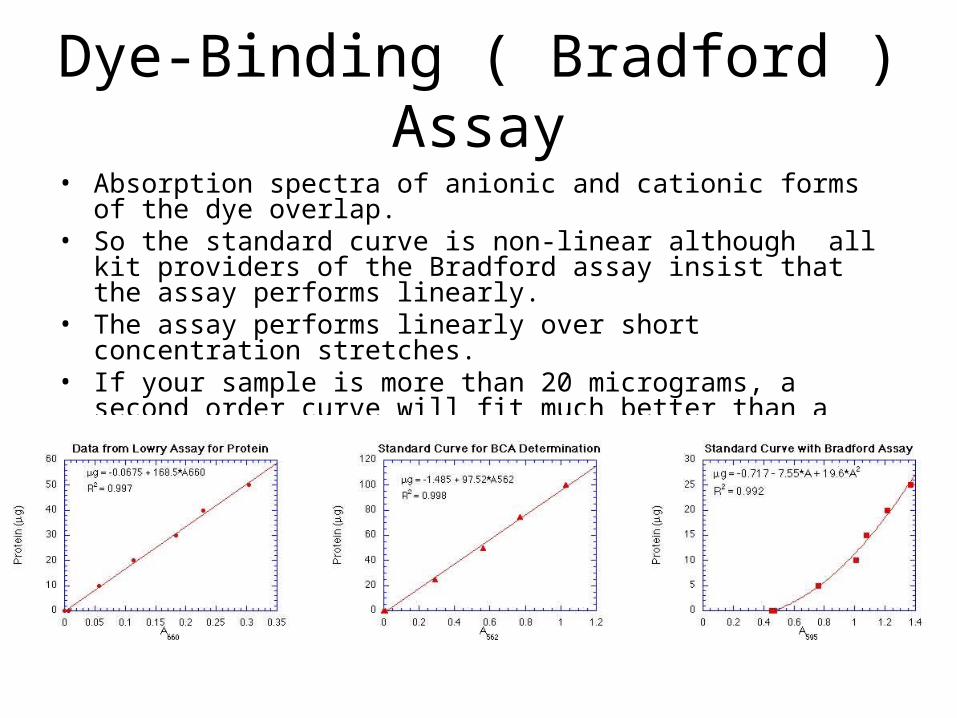
Dye-Binding ( Bradford ) Assay• Absorption spectra of anionic and cationic forms of the dye overlap.• So the standard curve is non-linear although all kit providers of the
Bradford assay insist that the assay performs linearly. • The assay performs linearly over short concentration stretches.• If your sample is more than 20 micrograms, a second order curve
will fit much better than a linear curve.
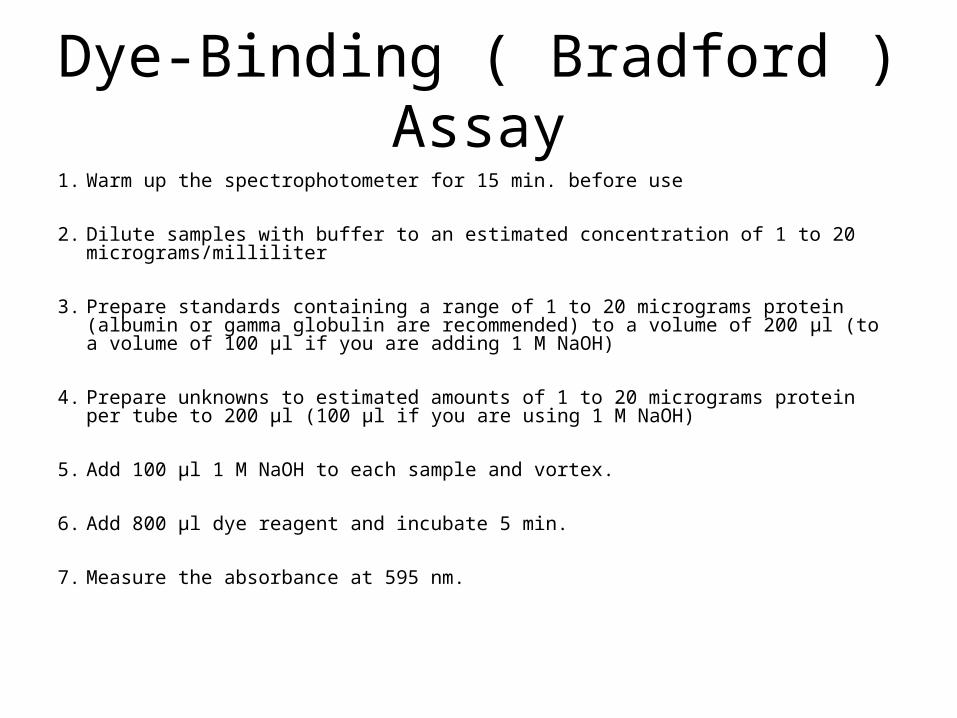
Dye-Binding ( Bradford ) Assay1. Warm up the spectrophotometer for 15 min. before use
2. Dilute samples with buffer to an estimated concentration of 1 to 20 micrograms/milliliter
3. Prepare standards containing a range of 1 to 20 micrograms protein (albumin or gamma globulin are recommended) to a volume of 200 µl (to a volume of 100 µl if you are adding 1 M NaOH)
4. Prepare unknowns to estimated amounts of 1 to 20 micrograms protein per tube to 200 µl (100 µl if you are using 1 M NaOH)
5. Add 100 µl 1 M NaOH to each sample and vortex.
6. Add 800 µl dye reagent and incubate 5 min.
7. Measure the absorbance at 595 nm.
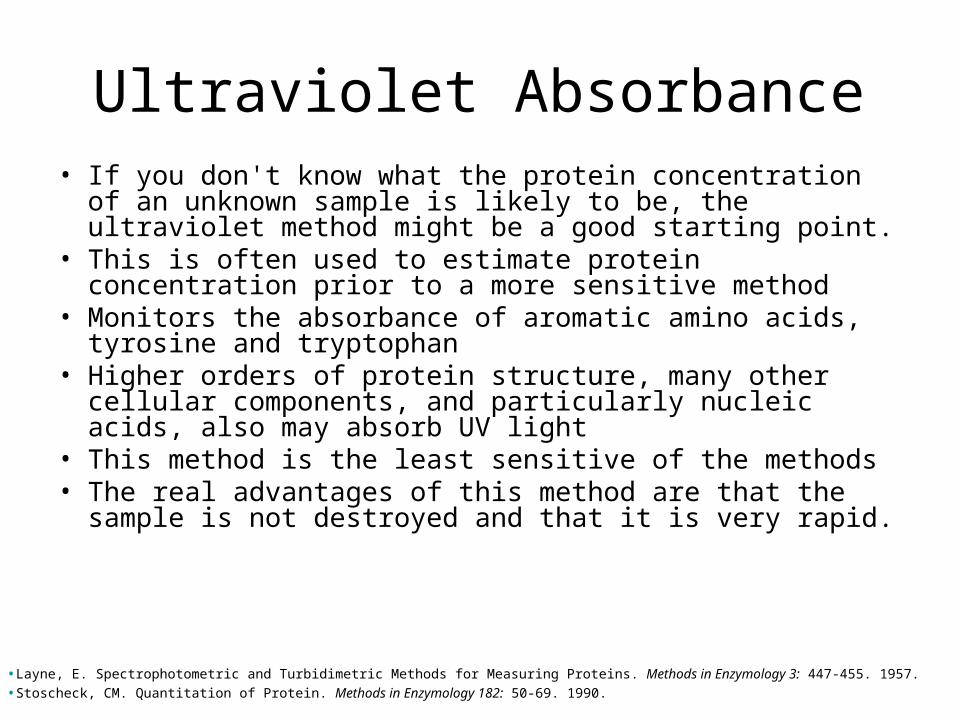
Ultraviolet Absorbance• If you don't know what the protein concentration of an
unknown sample is likely to be, the ultraviolet method might be a good starting point.
• This is often used to estimate protein concentration prior to a more sensitive method
• Monitors the absorbance of aromatic amino acids, tyrosine and tryptophan
• Higher orders of protein structure, many other cellular components, and particularly nucleic acids, also may absorb UV light
• This method is the least sensitive of the methods• The real advantages of this method are that the sample
is not destroyed and that it is very rapid.
•Layne, E. Spectrophotometric and Turbidimetric Methods for Measuring Proteins. Methods in Enzymology 3: 447-455. 1957.
•Stoscheck, CM. Quantitation of Protein. Methods in Enzymology 182: 50-69. 1990.
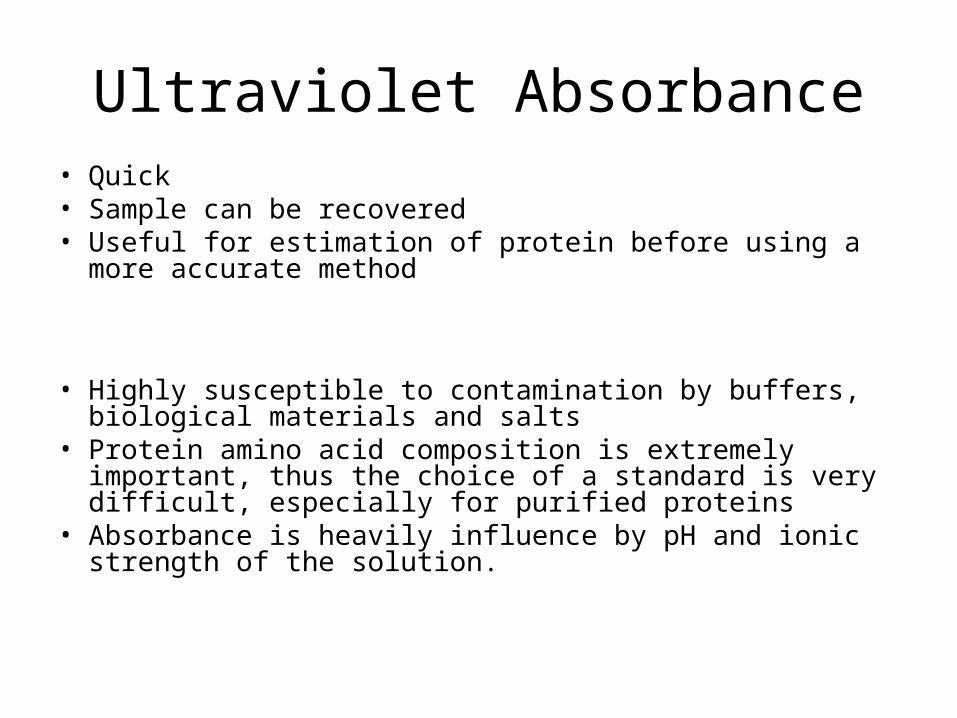
Ultraviolet Absorbance• Quick • Sample can be recovered • Useful for estimation of protein before using a more accurate
method
• Highly susceptible to contamination by buffers, biological materials and salts
• Protein amino acid composition is extremely important, thus the choice of a standard is very difficult, especially for purified proteins
• Absorbance is heavily influence by pH and ionic strength of the solution.
Ultraviolet Absorbance
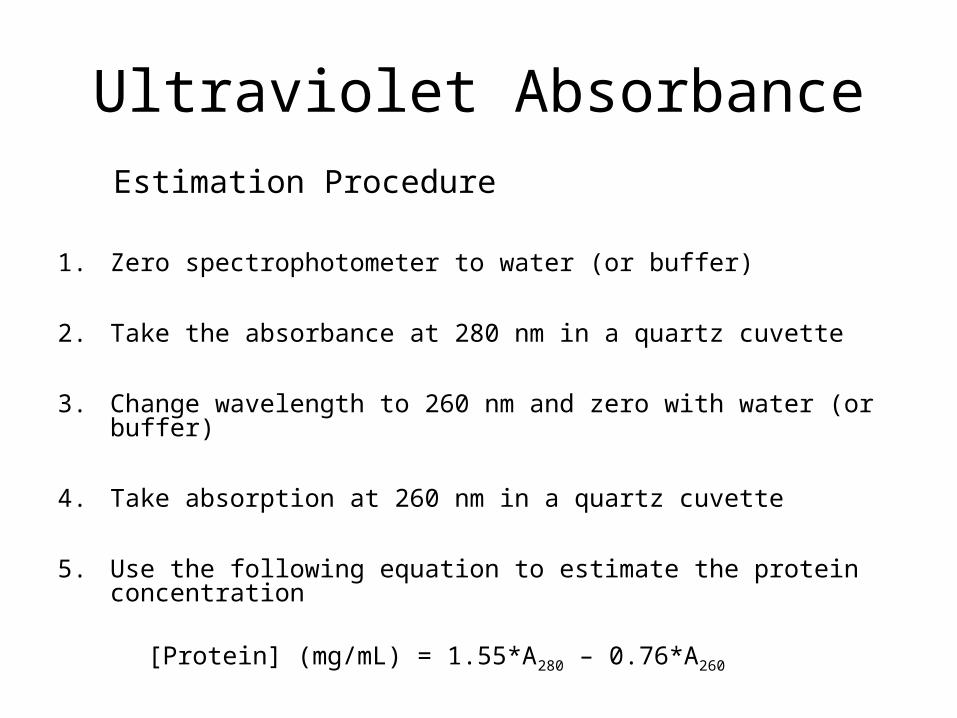
1. Zero spectrophotometer to water (or buffer)
2. Take the absorbance at 280 nm in a quartz cuvette
3. Change wavelength to 260 nm and zero with water (or buffer)
4. Take absorption at 260 nm in a quartz cuvette
5. Use the following equation to estimate the protein concentration [Protein] (mg/mL) = 1.55*A280 – 0.76*A260
Estimation Procedure
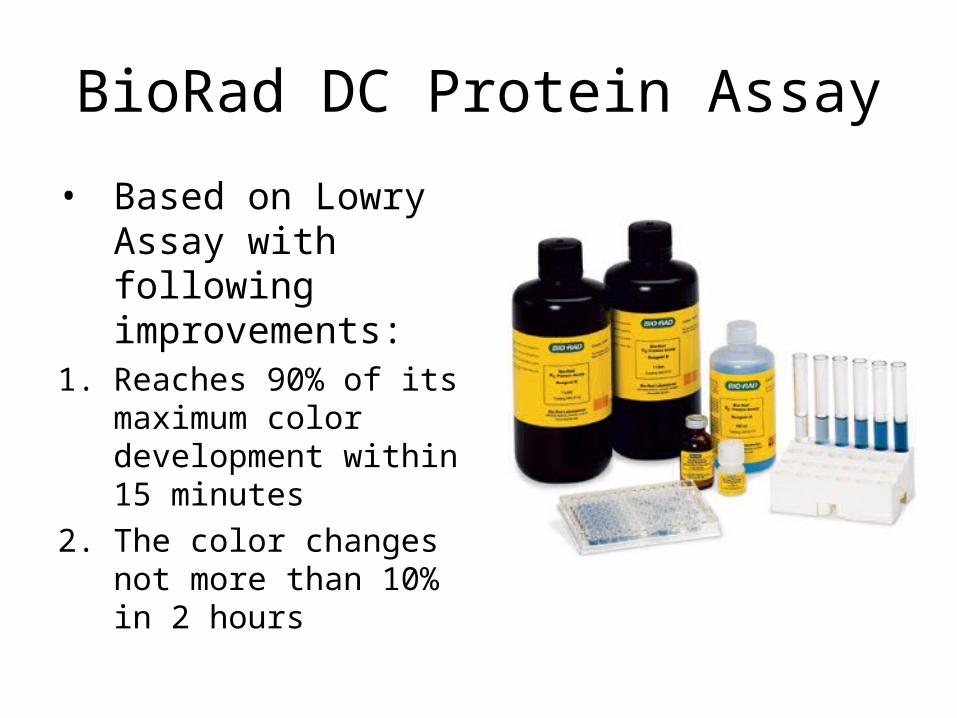
BioRad DC Protein Assay
• Based on Lowry Assay with following improvements:
1. Reaches 90% of its maximum color development within 15 minutes
2. The color changes not more than 10% in 2 hours
BioRad DC Protein Assay
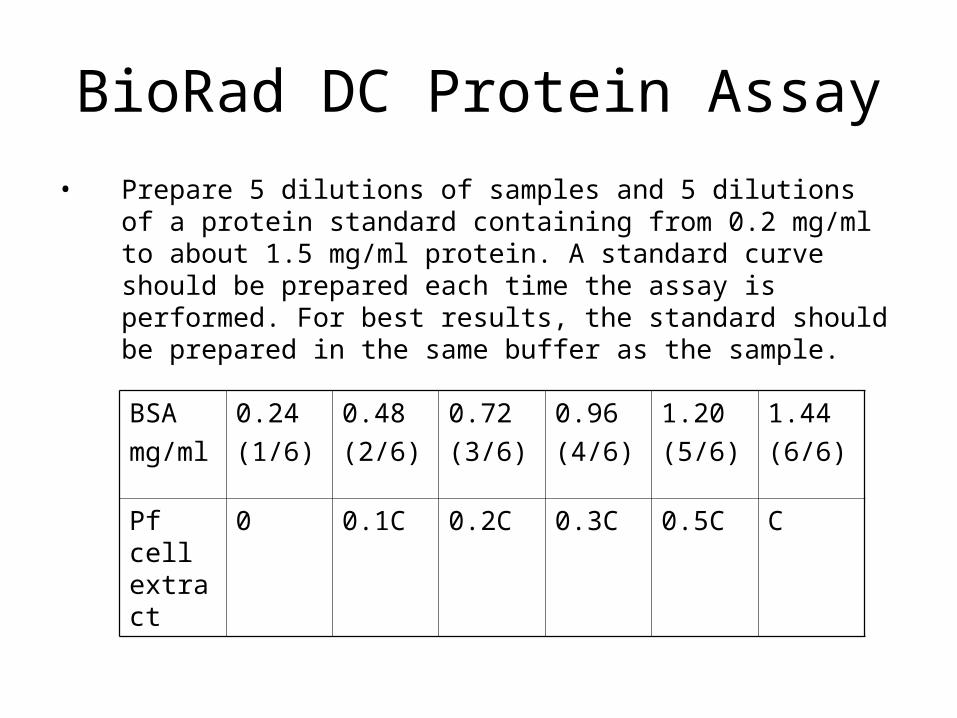
• Prepare 5 dilutions of samples and 5 dilutions of a protein standard containing from 0.2 mg/ml to about 1.5 mg/ml protein. A standard curve should be prepared each time the assay is performed. For best results, the standard should be prepared in the same buffer as the sample.
BSA
mg/ml
0.24
(1/6)
0.48
(2/6)
0.72
(3/6)
0.96
(4/6)
1.20
(5/6)
1.44
(6/6)
Pf cell extract
0 0.1C 0.2C 0.3C 0.5C C
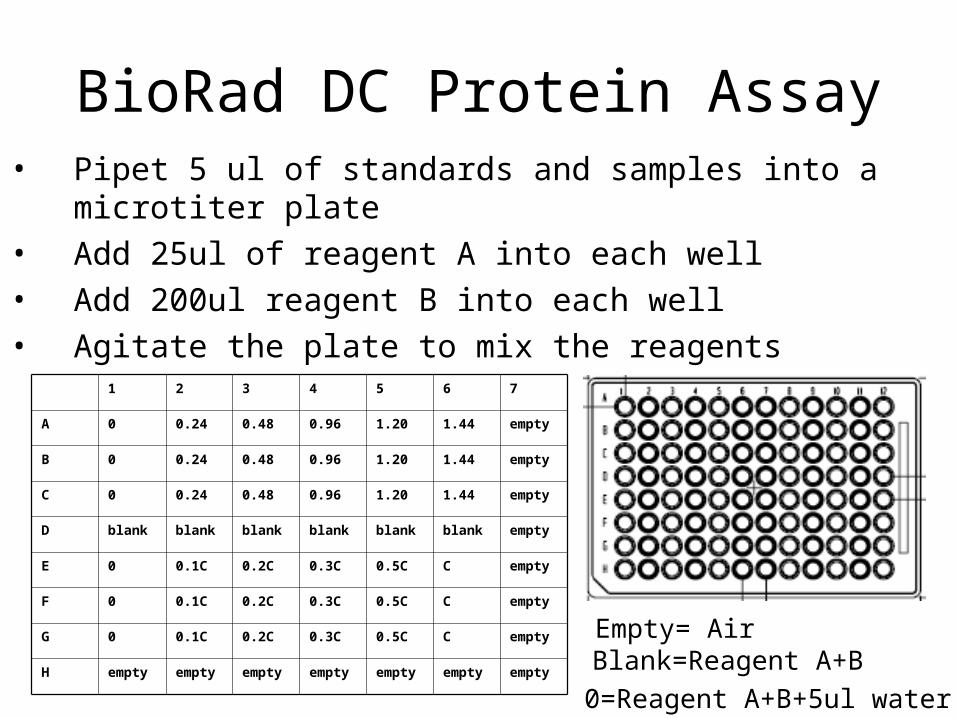
BioRad DC Protein Assay• Pipet 5 ul of standards and samples into a microtiter plate• Add 25ul of reagent A into each well• Add 200ul reagent B into each well• Agitate the plate to mix the reagents
1 2 3 4 5 6 7
A 0 0.24 0.48 0.96 1.20 1.44 empty
B 0 0.24 0.48 0.96 1.20 1.44 empty
C 0 0.24 0.48 0.96 1.20 1.44 empty
D blank blank blank blank blank blank empty
E 0 0.1C 0.2C 0.3C 0.5C C empty
F 0 0.1C 0.2C 0.3C 0.5C C empty
G 0 0.1C 0.2C 0.3C 0.5C C empty
H empty empty empty empty empty empty empty Blank=Reagent A+BEmpty= Air
0=Reagent A+B+5ul water
BioRad DC Protein Assay
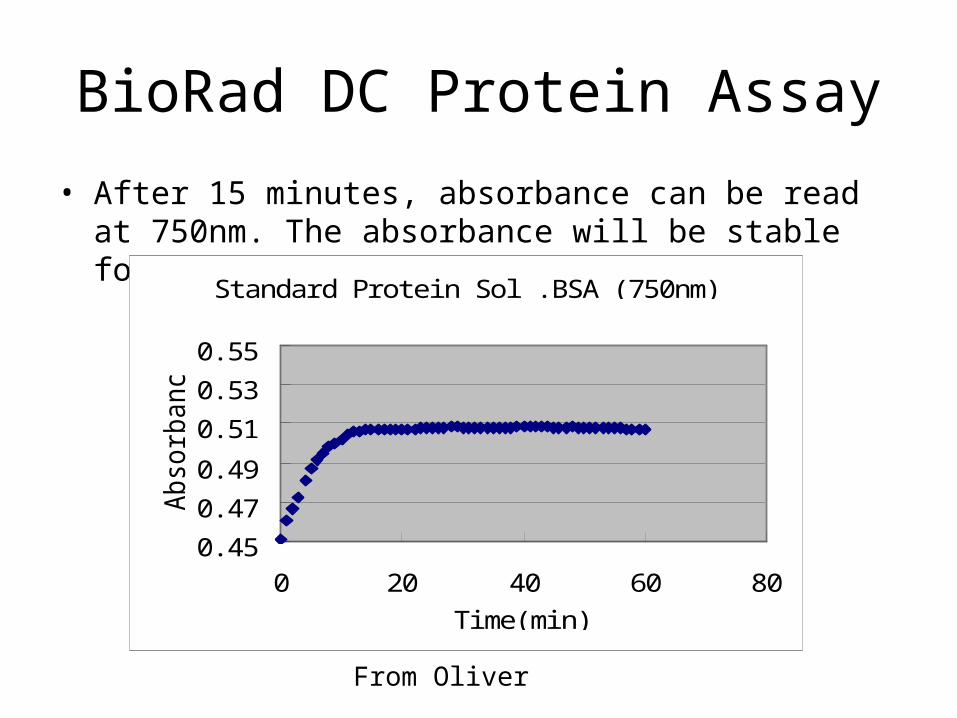
• After 15 minutes, absorbance can be read at 750nm. The absorbance will be stable for about 1 hour
Standard Protei n Sol . BSA (750nm)
0. 45
0. 47
0. 49
0. 51
0. 53
0. 55
0 20 40 60 80
Ti me(mi n)
Absorbance
From Oliver
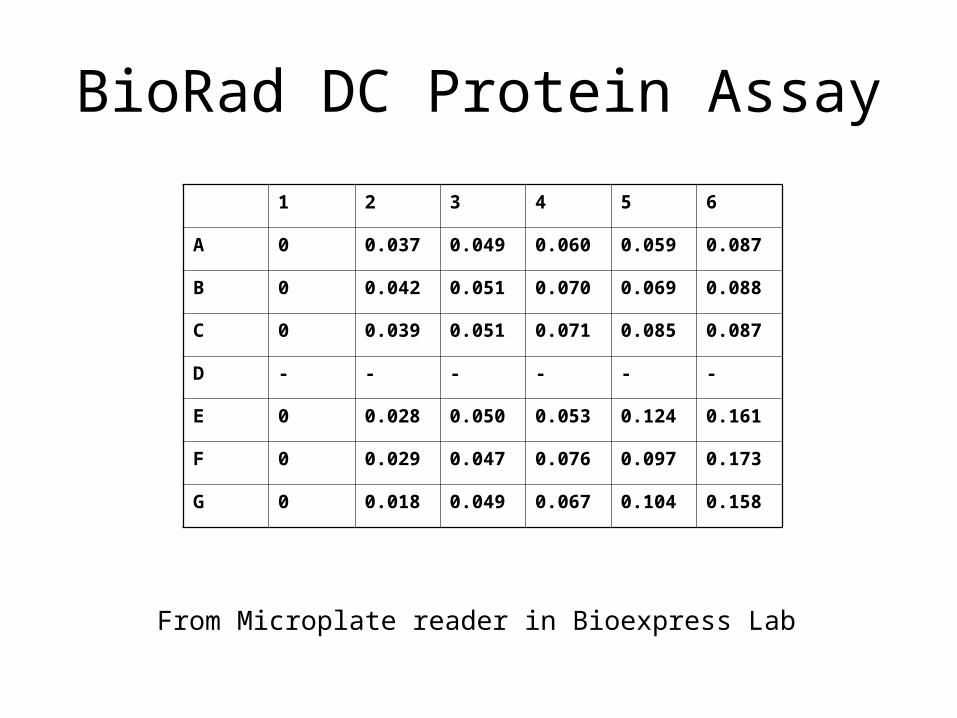
BioRad DC Protein Assay
1 2 3 4 5 6
A 0 0.037 0.049 0.060 0.059 0.087
B 0 0.042 0.051 0.070 0.069 0.088
C 0 0.039 0.051 0.071 0.085 0.087
D - - - - - -
E 0 0.028 0.050 0.053 0.124 0.161
F 0 0.029 0.047 0.076 0.097 0.173
G 0 0.018 0.049 0.067 0.104 0.158
From Microplate reader in Bioexpress Lab
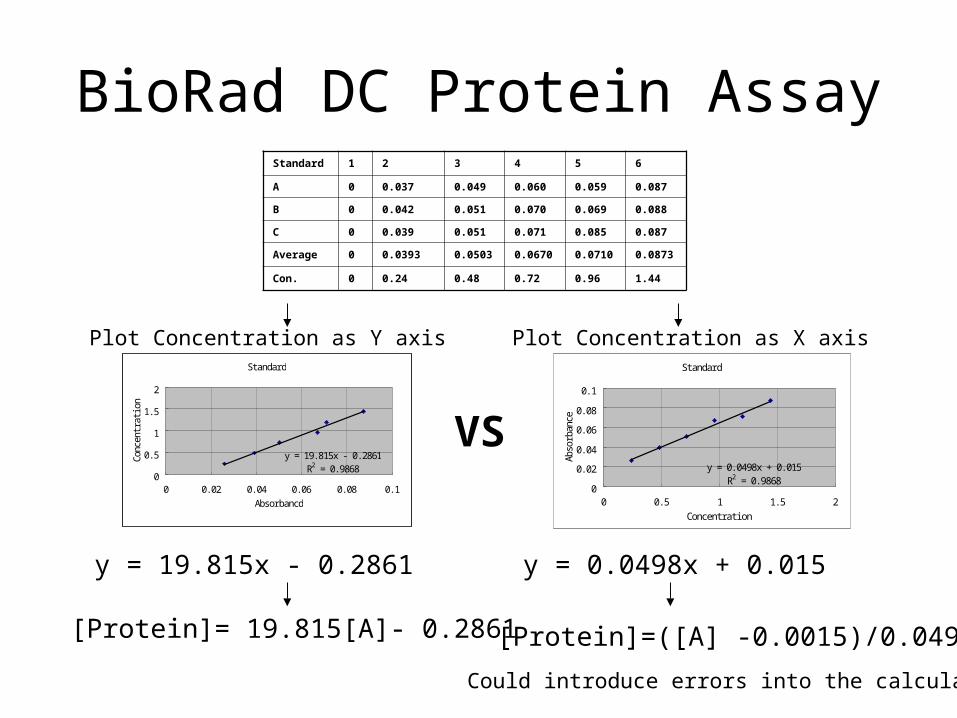
BioRad DC Protein AssayStandard 1 2 3 4 5 6
A 0 0.037 0.049 0.060 0.059 0.087
B 0 0.042 0.051 0.070 0.069 0.088
C 0 0.039 0.051 0.071 0.085 0.087
Average 0 0.0393 0.0503 0.0670 0.0710 0.0873
Con. 0 0.24 0.48 0.72 0.96 1.44
Standard
y = 19. 815x - 0. 2861R2 = 0. 9868
0
0. 5
1
1. 5
2
0 0. 02 0. 04 0. 06 0. 08 0. 1Absorbancd
Conc
entr
atio
n
Standard
y = 0. 0498x + 0. 015R2 = 0. 9868
0
0. 02
0. 04
0. 06
0. 08
0. 1
0 0. 5 1 1. 5 2Concentrati on
Abso
rban
cey = 19.815x - 0.2861
[Protein]= 19.815[A]- 0.2861
y = 0.0498x + 0.015
[Protein]=([A] -0.0015)/0.0498
Could introduce errors into the calculation
Plot Concentration as Y axis Plot Concentration as X axis
VS
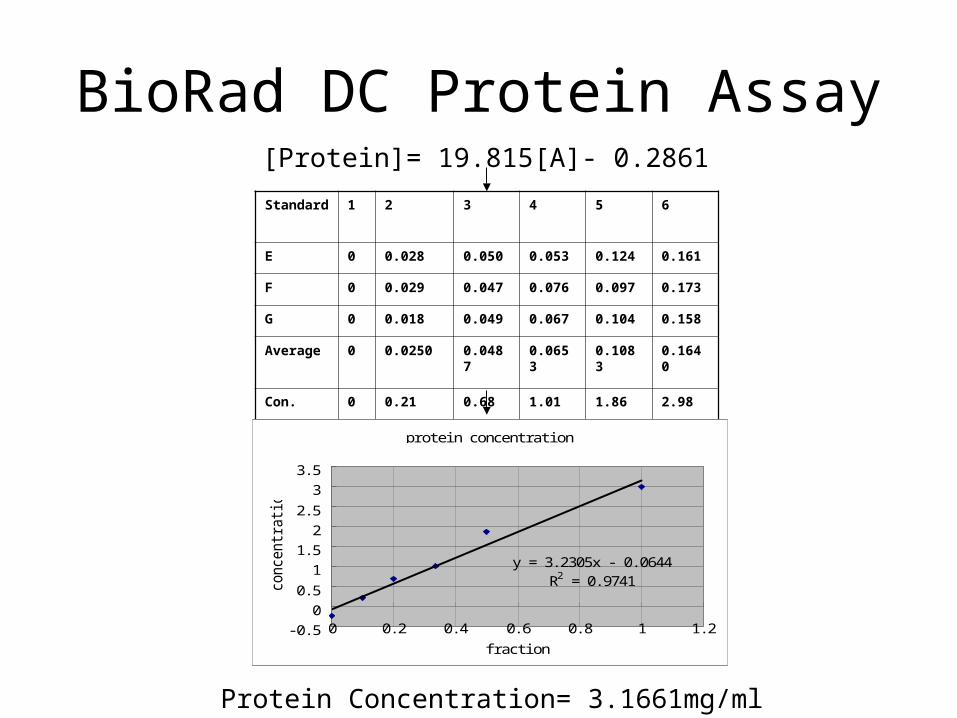
BioRad DC Protein Assay
Standard 1 2 3 4 5 6
E 0 0.028 0.050 0.053 0.124 0.161
F 0 0.029 0.047 0.076 0.097 0.173
G 0 0.018 0.049 0.067 0.104 0.158
Average 0 0.0250 0.0487 0.0653 0.1083 0.1640
Con. 0 0.21 0.68 1.01 1.86 2.98
Fraction 0 0.1 0.2 0.3 0.5 1protei n concentrati on
y = 3. 2305x - 0. 0644R2 = 0. 9741
-0. 50
0. 5
11. 5
22. 5
33. 5
0 0. 2 0. 4 0. 6 0. 8 1 1. 2
f racti on
conc
entra
tio
n
[Protein]= 19.815[A]- 0.2861
Protein Concentration= 3.1661mg/ml
Tips
• Use clean glassware and supplies • Make sure cuvettes are clean of all residues • Protein assays are strongly influenced by the
composition of the proteins present in your sample • Become familiar with spectrophotometry before
proceeding • Always let a spectrophotometer warm up for 15-20
minutes before using • Know the limits of the spectrophotometer with which you
are using
Tips
• Standard curves are not always linear • The protein used for your standard curve must make
sense • Make sure your standard curve covers the absorbance
range of your unknown with at least two points on either side
• Make sure that your protein solution behaves in a reproducible manner to the assay method by making a dilution curve
• Use buffer and water blanks to anchor down your standard curve
• Place the protein concentration on the y-axis of you standard curve plot so that you can use the best-fit equation directly for concentration determination