ceo pay has skyrocketed 1,322% since 1978
TRANSCRIPT

CEO pay has skyrocketed1,322% since 1978CEOs were paid 351 times as much as a typicalworker in 2020
Report • By Lawrence Mishel and Jori Kandra • August 10, 2021
• Washington, DC View this report at epi.org/232540
SECTIONS
1. Introduction • 2
2. Measuring CEOcompensation • 3
3. Analysis • 4
4. Dramatically high CEOpay does not simplyreflect the market forskills • 10
5. The connectionbetween CEO pay andoverall inequality • 14
6. Policyrecommendations:Reversing the trend• 16
Acknowledgments • 16
About the authors • 17
Notes • 17
References • 18
What this report finds: Corporate boards runningAmerica’s largest public firms are giving top executivesoutsize compensation packages that have grown muchfaster than the stock market and the pay of typical workers,college graduates, and even the top 0.1%. In 2020, a CEOat one of the top 350 firms in the U.S. was paid $24.2million on average (using a “realized” measure of CEO paythat counts stock awards when vested and stock optionswhen cashed in rather than when granted). This 18.9%increase from 2019 occurred because of rapid growth invested stock awards and exercised stock options. Using adifferent “granted” measure of CEO pay, average top CEOcompensation was $13.9 million in 2020, slightly below itslevel in 2019. In 2020, the ratio of CEO-to-typical-workercompensation was 351-to-1 under the realized measure ofCEO pay; that is up from 307-to-1 in 2019 and a bigincrease from 21-to-1 in 1965 and 61-to-1 in 1989. CEOs areeven making a lot more than other very high earners (wageearners in the top 0.1%)—more than six times as much.From 1978 to 2020, CEO pay based on realizedcompensation grew by 1,322%, far outstripping S&P stockmarket growth (817%) and top 0.1% earnings growth (whichwas 341% between 1978 and 2019, the latest dataavailable). In contrast, compensation of the typical workergrew by just 18.0% from 1978 to 2020.
Why it matters: Exorbitant CEO pay is a major contributorto rising inequality that we could safely do away with.CEOs are getting more because of their power to set payand because so much of their pay (more than 80%) isstock-related, not because they are increasing theirproductivity or possess specific, high-demand skills. Thisescalation of CEO compensation, and of executivecompensation more generally, has fueled the growth of top1.0% and top 0.1% incomes, leaving less of the fruits ofeconomic growth for ordinary workers and widening thegap between very high earners and the bottom 90%. Theeconomy would suffer no harm if CEOs were paid less (orwere taxed more).
How we can solve the problem: We need to enact policysolutions that would both reduce incentives for CEOs toextract economic concessions and limit their ability to doso. Such policies could include reinstating higher marginalincome tax rates at the very top; setting corporate tax rateshigher for firms that have higher ratios of CEO-to-worker
1

compensation; use of antitrust enforcement and regulation to restrain firms’—and byextension, CEOs’—excessive market power; and allowing greater use of “say on pay,”which allows a firm’s shareholders to vote on top executives’ compensation.
IntroductionChief executive officers (CEOs) of the largest firms in the U.S. earn far more today thanthey did in the mid-1990s and many times what they earned in the 1960s or 1970s. Theyalso earn far more than the typical worker, and their pay—which relies heavily on stock-related compensation—has grown much more rapidly than a typical worker’s pay.Importantly, rising CEO pay does not reflect rising value of skills, but rather CEOs’ use oftheir power to set their own pay. In economic terms, this means that CEO compensationreflects substantial “rents” (income in excess of their actual productivity). This isproblematic since this growing earning power of CEOs has been driving income growth atthe very top, a key dynamic in the overall growth of inequality.
Key findings
• Growth of CEO compensation (1978–2020). Using the realized compensationmeasure, compensation of the top CEOs increased 1,322.2% from 1978 to 2020(adjusting for inflation). Top CEO compensation grew roughly 60% faster than stockmarket growth during this period and far eclipsed the slow 18.0% growth in a typicalworker’s annual compensation. CEO granted compensation rose 970.2% from 1978 to2020.
• Growth of CEO compensation during the pandemic (2019–2020). The dramaticincrease in CEO compensation during the pandemic is remarkable. While millionswere out of work, CEOs’ realized compensation jumped 18.9% in just one year. Typicalworker compensation, of those who remained employed, did rise 3.9% over thatyear—and even that wage growth is overstated: Perversely, high job loss among low-wage workers skewed the average wage higher.
• Changes in the CEO-to-worker compensation ratio (1965–2020). Using the realizedcompensation measure, the CEO-to-worker compensation ratio was 21-to-1 in 1965. Itpeaked at 366-to-1 in 2000. In 2020 the ratio was 351-to-1. Most important, the ratiowas far higher than at any point in the 1960s, 1970s, 1980s, or 1990s. Using the CEOgranted compensation measure, the CEO-to-worker compensation ratio rose to203-to-1 in 2020, significantly lower than its peak of 386-to-1 in 2000 but still manytimes higher than the 45-to-1 ratio of 1989 or the 15-to-1 ratio of 1965.
• Changes in the composition of CEO compensation. The composition of CEOcompensation is shifting away from the use of stock options and toward the use ofstock awards. Vested stock awards and exercised stock options totaled $20.1 millionin 2020 and accounted for 83.1% of average realized CEO compensation.
• Changes in the CEO-to-top-0.1% compensation ratio. Over the last three decades,
2

compensation grew far faster for CEOs than it did for other very highly paid workers(the top 0.1%, or those earning more than 99.9% of wage earners). CEO compensationin 2019 (the latest year for which data on top wage earners are available) was 6.44times as high as wages of the top 0.1% of wage earners, a ratio 3.26 points greaterthan the 3.18-to-1 average CEO-to-top-0.1% ratio over the 1947–1979 period.
• Implications of the growth of CEO-to-top-0.1% compensation ratio. The fact thatCEO compensation has grown far faster than the pay of the top 0.1% of wage earnersindicates that CEO compensation growth does not simply reflect a competitive racefor skills (the “market for talent”) that also increased the value of highly paidprofessionals: Rather, the growing pay differential between CEOs and top 0.1%earners suggests the growth of substantial economic rents (income not related to acorresponding growth of productivity) in CEO compensation. CEO compensationappears to reflect not greater productivity of executives but the power of CEOs toextract concessions. Consequently, if CEOs earned less or were taxed more, therewould be no adverse impact on the economy’s output or on employment.
• Growth of top 0.1% compensation (1978–2019). Even though CEO compensationgrew much faster than the earnings of the top 0.1% of wage earners, that doesn’tmean the top 0.1% did not fare well. Quite the contrary. The inflation-adjusted annualearnings of the top 0.1% grew 341% from 1978 to 2019. CEO compensation, however,grew three times as fast!
• CEO pay growth compared with growth in the college wage premium. Over the lastthree decades, CEO compensation increased more relative to the pay of other very-high-wage earners than did the wages of college graduates relative to the wages ofhigh school graduates. This finding indicates that the escalation of CEO pay does notsimply reflect a more general rise in the returns to education.
Measuring CEO compensationWe focus on the average compensation of CEOs at the 350 largest publicly owned U.S.firms (i.e., firms that sell stock on the open market) by revenue. Our source of data is theS&P ExecuComp database for the years 1992 to 2020 and survey data published by theWall Street Journal for selected years back to 1965. We maintain the sample size of 350firms each year when using the ExecuComp data.1
We use two measures of CEO compensation, one based on compensation as “realized”and the other based on compensation as “granted.” Both measures include the samemeasures of salary, bonuses, and long-term incentive payouts. The difference is how eachmeasure treats stock awards and stock options, major components of CEO compensationthat change value from when they are first provided, or granted, to when they are realized.
The realized measure of compensation includes the value of stock options as realized (i.e.,exercised), capturing the change from when the options were granted to when the CEOinvokes the options, usually after the stock price has risen and the options values haveincreased. The realized compensation measure also values stock awards at their value
3

when vested (usually three years after being granted), capturing any change in the stockprice as well as additional stock awards provided as part of a performance award.
The granted measure of compensation values stock options and restricted stock awardsby their “fair value” when granted (Compustat estimates of the fair value of options andstock awards as granted determined using the Black Scholes model). For details on theconstruction of these measures and benchmarking to other studies, see Sabadish andMishel 2013.
AnalysisTrends in CEO compensation growthThis section examines several decades of available data to identify historical trends inCEO compensation.
Composition of CEO compensation
Stock-related components of CEO compensation constitute a large and increasing shareof total compensation: Realized stock awards and stock options were 73.1% of totalcompensation in 2016 ($12.6 million out of $17.2 million) and were 83.1% of totalcompensation ($20.1 million out of $24.2 million) in our sample for 2020. The growth ofthese stock-related components from 2016 to 2020 was the sole reason total CEOrealized compensation grew by $7.0 million from $17.2 million to $24.2 million, up 40.5%.Of the stock-related components of compensation, stock awards make up a growing sharewhile the share of stock options in CEO compensation packages has decreased over time.
There is a simple logic behind companies’ decisions to shift from stock options to stockawards in CEO compensation packages, as Clifford (2017) explains. With stock options,CEOs can only make gains: They realize a gain if the stock price rises beyond the price ofthe initial options granted and they lose nothing if the stock price falls. The fact that theyhave nothing to lose—but potentially a lot to gain—might lead options-holding CEOs totake excessive risks to bump up the stock price.
Stock awards, on the other hand, promote better alignment of a CEO’s goals withshareholders’ goals. A stock award has the value when given, or vested, and can increaseor decrease in value as the firm’s stock price changes. If stock awards have a lengthyvesting period, say three to five years, then the CEO has an interest in lifting the firm’sstock price over that period while being mindful to avoid any implosion in the stockprice—to maintain the value of what they have.
Growth in 2020
Realized CEO compensation (reported in Table 1) rose by $3.8 million, up 18.9%, to $24.2million from 2019 to 2020, almost entirely due to the increased value of exercised stock
4

options (we report executive compensation in millions, but dollar and percent changes arecalculated using unrounded data). The granted measure of CEO compensation, whichvalues stock options granted in 2020 (not those exercised), actually fell by $30,000, or0.2%, to 13.9 million. Thus, it seems the large growth of CEO compensation in 2020 wasdriven by executives cashing out their options at a time of high stock prices.
These results are in sync with the preliminary analyses (Mishel and Kandra 2021)previously reported. Mishel and Kandra (2021) analyzed the firms from the 2019 samplethat had reported their executive compensation by the end of April 2021. CEO realizedcompensation, including realized stock options and vested stock awards, rose 15.9% from2019 to 2020 among the 281 early reporting firms.
Long-term trends
Table 1 also presents the longer-term trends in CEO compensation for selected years from1965 to 2020.2 Our discussion of longer-term trends focuses mostly on the realizedcompensation measure of CEO compensation preferred in most economic analyses.
For comparison, the average annual compensation (wages and benefits of a full-time, full-year worker) of private-sector production/nonsupervisory workers (a group covering morethan 80% of payroll employment; see Gould 2020) is shown in Table 1, allowing us tocompare CEO compensation with that of a typical worker.
From 1995 onward, the table also identifies the average annual compensation ofproduction/nonsupervisory workers in the key industry of the firms included in the sample.We take this compensation as a proxy for the pay of typical workers in these particularfirms and use it to calculate the CEO-to-worker compensation ratio for each firm.
Finally, the table shows inflation-adjusted changes in the stock market, as measured bythe Dow Jones Industrial Average and S&P 500 Index.
CEO compensation (our realized measure) has, in general, risen and fallen along with theS&P 500 Index over the last five and a half decades. The period from 1965 to 1978 is anexception: Although the stock market fell by roughly half between 1965 and 1978, realizedCEO compensation increased by 78.9%.
Typical worker compensation saw relatively strong growth over that period—that is, strongrelative to subsequent periods, not relative to CEO pay or the pay of other earners at thetop of the wage distribution: Annual worker compensation grew by 20.0% from 1965 to1978, about a fourth as fast as CEO compensation growth.
Realized CEO compensation grew strongly throughout the 1980s but exploded in the1990s. It peaked at the end of the stock market bubble, in 2000, at about $22.2 million, a261% increase over just five years earlier in 1995 and a 1,204% increase over 1978. Thislatter increase exceeded even the growth of the booming stock market (513% for the S&P500 and 439% for the Dow) between 1978 and 2000. In stark contrast to both the stockmarket and CEO compensation, private-sector worker compensation increased just 0.6%from 1978 to 2000.
5

Table 1 CEO compensation, CEO-to-worker compensation ratio,and stock prices (2020$), selected years, 1965–2020
CEO annualcompensation
(thousands)
Private-sector production/nonsupervisory workers
annual compensation(thousands)
Stock market(indexed to
2020$)CEO-to-worker
compensation ratio
Year(s) Realized Granted
Allprivate-sector
workers
Workersin thefirms’
industries*S&P500
DowJones Realized Granted
1965 $951 $724 $43.2 NA 634 6,550 21.1 15.4
1973 $1,242 $946 $50.7 NA 561 4,825 23.4 17.2
1978 $1,701 $1,295 $51.8 NA 351 2,998 31.4 23.0
1989 $3,169 $2,413 $49.4 NA 653 5,074 61.4 45.0
1995 $6,148 $6,830 $49.4 $55.7 917 7,613 117.6 131.0
2000 $22,183 $22,205 $52.1 $58.2 2,151 16,164 365.7 386.1
2007 $19,670 $14,533 $54.3 $60.6 1,849 16,492 330.9 242.0
2009 $10,505 $10,809 $56.4 $62.9 1,147 10,746 177.6 178.3
2019 $20,351 $13,891 $58.9 $67.0 2,950 26,709 306.9 211.9
Projected2020
$24,194 $13,861 $61.2 $69.7 3,218 26,891 351.1 202.7
2019 FH $20,129 $13,677 $58.9 $67.4 2,950 26,709 302.6 207.7
2020 FH $23,930 $13,648 $61.2 $69.7 3,218 26,891 346.7 198.5
Percent change Change in ratio
1965–1978 78.9% 78.9% 20.0% NA -44.6% -54.2% 10.3 7.6
1978–2000 1,204.0% 1,614.5% 0.6% NA 513.0% 439.1% 334.3 363.1
2000–2007 -11.3% -34.6% 4.1% 4.1% -14.1% 2.0% -34.8 -144.1
2007–2009 -46.6% -25.6% 3.9% 3.8% -38.0% -34.8% -153.3 -63.7
2009–2020 130.3% 28.2% 8.5% 10.7% 180.7% 150.2% 173.5 24.3
2007–2020 23.0% -4.6% 12.7% 14.9% 74.1% 63.1% 20.2 -39.4
1978–2020 1,322.2% 970.2% 18.0% NA 817.0% 796.9% 319.7 179.7
2019–2020 18.9% -0.2% 3.9% 3.9% 9.1% 0.7% 44.2 -9.2
* Average annual compensation of the workers in the key industry of the firms in the sample.
Notes: Average annual compensation for CEOs at the top 350 U.S. firms ranked by sales is measured in two ways. Both includesalary, bonus, and long-term incentive payouts, but the “granted” measure includes the value of stock options and stock awardswhen they were granted, whereas the “realized” measure captures the value of stock-related components that accrues after optionsor stock awards are granted by including “stock options exercised” and “vested stock awards.” FH = First half. CEO-to-workercompensation ratios are based on averaging specific firm ratios in samples and not the ratio of averages of CEO and workercompensation. Ratios prior to 1992 are constructed as described in the CEO pay series methodology (Sabadish and Mishel 2013).
Source: Authors’ analysis of data from Compustat’s ExecuComp database, the Federal Reserve Economic Data (FRED) database fromthe Federal Reserve Bank of St. Louis, the Bureau of Labor Statistics’ Current Employment Statistics data series, and the Bureau ofEconomic Analysis NIPA tables.
When the stock market bubble burst in the early 2000s there was a substantial paringback of CEO compensation. By 2007, however, when the stock market had mostlyrecovered, realized CEO compensation reached $19.7 million, just $2.5 million below its2000 level. However, granted CEO compensation remained down, at $14.5 million in 2007,a substantial $7.7 million fall from the 2000 level.
The stock market decline during the 2008 financial crisis also sent CEO compensation
6

tumbling, as it had in the early 2000s, as realized CEO compensation dropped 46.6% from2007 to 2009. After 2009, realized CEO compensation resumed an upward trajectory,growing 130.3% from 2009 to 2020 so that CEO compensation exceeded its previouslevel from 2007 by 23.0%. In fact, the fast growth of CEO compensation in 2020 broughtrealized CEO compensation $2 million above its prior peak level in 2000 at the height ofthe stock market bubble.
To assess the role of CEO compensation in the overall increase in income and wageinequality of the last four decades it is best to gauge growth since 1978.3 For the periodfrom 1978 to 2020, realized CEO compensation increased 1,322.2%—more than 60%faster than stock market growth (depending on the market index used) and substantiallyfaster than the slow 18.0% growth in the typical worker’s compensation over the sameperiod (there was a large 3.9% jump in worker compensation in 2020, much of it likelyfrom a composition effect—low-wage workers missing from employment due to the COVIDcrisis). CEO granted compensation grew 970.2% over this period.
Trends in the CEO-to-worker compensation ratioTable 1 also presents trends in the ratio of CEO-to-worker compensation, using bothmeasures of CEO compensation. We compute this ratio, which illustrates the increaseddivergence between CEO and worker pay over time, in two steps:
• The first step is to construct, for each of the 350 largest U.S. firms, the ratio of theCEO’s compensation to the annual average compensation of production andnonsupervisory workers in the key industry of the firm (data on the pay of workers atindividual firms are not available).4
• The second step is to average that ratio across all 350 firms. Note, however, thattrends before 1995 are based on the changes in average top-company CEO andeconomywide private-sector production/nonsupervisory worker compensation.
The last two columns in Table 1 show the resulting ratio for both measures of CEO pay. Thetrends are depicted in Figure A.
How our metric differs from firm-reported metrics
The Securities and Exchange Commission (SEC) now requires publicly ownedfirms to provide a metric for the ratio of CEO compensation to that of the medianworker in a firm, as mandated by the Dodd-Frank financial reform bill of 2010(SEC 2015). Those ratios differ from those in this report in several ways:
▪ First, because of limitations in data availability, the measure of workercompensation in our ratios reflects workers in a firm’s key industry, notworkers actually working for the firm. The ratios reported to the SEC will
7
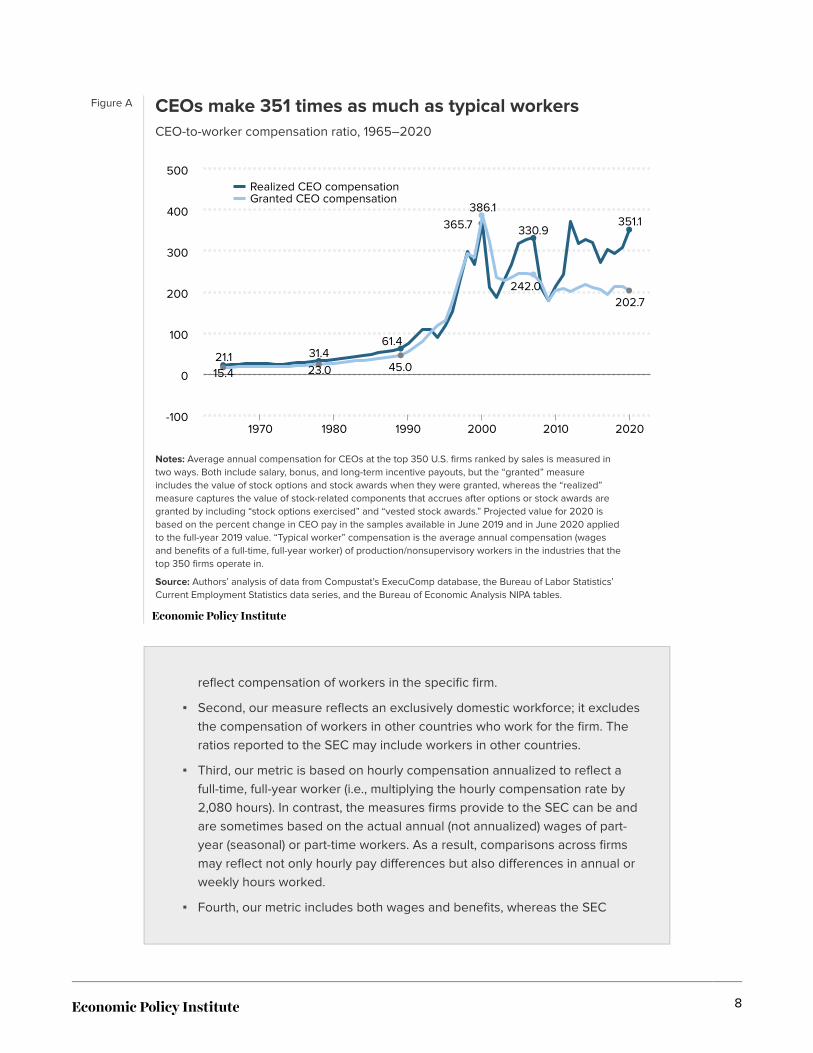
Figure A CEOs make 351 times as much as typical workersCEO-to-worker compensation ratio, 1965–2020
Notes: Average annual compensation for CEOs at the top 350 U.S. firms ranked by sales is measured intwo ways. Both include salary, bonus, and long-term incentive payouts, but the “granted” measureincludes the value of stock options and stock awards when they were granted, whereas the “realized”measure captures the value of stock-related components that accrues after options or stock awards aregranted by including “stock options exercised” and “vested stock awards.” Projected value for 2020 isbased on the percent change in CEO pay in the samples available in June 2019 and in June 2020 appliedto the full-year 2019 value. “Typical worker” compensation is the average annual compensation (wagesand benefits of a full-time, full-year worker) of production/nonsupervisory workers in the industries that thetop 350 firms operate in.
Source: Authors’ analysis of data from Compustat’s ExecuComp database, the Bureau of Labor Statistics’Current Employment Statistics data series, and the Bureau of Economic Analysis NIPA tables.
21.1 31.461.4
365.7 330.9351.1
15.4 23.0 45.0
386.1
242.0202.7
Realized CEO compensationGranted CEO compensation
-100
0
100
200
300
400
500
1970 1980 1990 2000 2010 2020
reflect compensation of workers in the specific firm.
▪ Second, our measure reflects an exclusively domestic workforce; it excludesthe compensation of workers in other countries who work for the firm. Theratios reported to the SEC may include workers in other countries.
▪ Third, our metric is based on hourly compensation annualized to reflect afull-time, full-year worker (i.e., multiplying the hourly compensation rate by2,080 hours). In contrast, the measures firms provide to the SEC can be andare sometimes based on the actual annual (not annualized) wages of part-year (seasonal) or part-time workers. As a result, comparisons across firmsmay reflect not only hourly pay differences but also differences in annual orweekly hours worked.
▪ Fourth, our metric includes both wages and benefits, whereas the SEC
8

metric focuses solely on wages.
▪ Finally, we use consistent data and methodology to construct our ratios; ourratios are thus comparable across firms and from year to year. The SECallows firms flexibility in how they construct the CEO-to-typical worker paycomparison; this means there is not comparability across firms—and ratiosmay not even be comparable from year to year for any given firm, if the firmchanges the metrics it uses.
There is certainly value in the new metrics being provided to the SEC, but themeasures we rely on allow us to make appropriate comparisons between firmsand across time. More information on the SEC CEO-to-worker compensationratio and our comparable measure can be found in Mishel and Kandra 2020.
As Table 1 and Figure A show, using the realized measure of CEO compensation, CEOs ofmajor U.S. companies earned 21 times more than the typical worker in 1965. This ratiogrew to 31-to-1 in 1978 and 61-to-1 by 1989. It surged in the 1990s, hitting 366-to-1 in 2000,at the end of the 1990s recovery and at the height of the stock market bubble.5
The fall in the stock market after 2000 reduced CEO stock-related pay, such as realizedstock options, and caused CEO compensation to tumble in 2002 before beginning to riseagain in 2003. Realized CEO compensation recovered to a level of 331 times worker payby 2007, still below its 2000 level. The financial crisis of 2008 and accompanying stockmarket decline reduced CEO compensation between 2007 and 2009, as discussedabove, and the CEO-to-worker compensation ratio fell in tandem.
Over the 2009–2020 period CEO pay resumed its upward trajectory and the 130.3% surgein realized CEO compensation brought the ratio to 351-to-1, above its 2007 level. Thoughthe realized CEO-to-worker compensation ratio remains below the value achieved in 2000at the peak of a stock market bubble, it is far higher than it was in the 1960s, 1970s, 1980s,and most of the 1990s.
The pattern using the granted measure of CEO compensation is similar. The CEO-to-worker pay ratio peaked in 2000, at 386-to-1, even higher than the ratio with the realizedcompensation measure. The fall from 2000 to 2007 was steeper than for the othermeasure, hitting 242-to-1 in 2007. The stock market decline during the financial crisisdrove the ratio down to 178-to-1 in 2009. The growth in granted CEO compensation overthe 2009–2020 period, at just 28.2%, was far less than for realized compensation, so theCEO-to-worker pay ratio recovered to only 203-to-1. This level is far lower than its peak in2000 but still far greater than the 1995 ratio of 131-to-1, the 1989 ratio of 45-to-1, or the1965 ratio of 15-to-1.
The exponential growth in the CEO-to-worker compensation ratio reflects the strikinglydifferent trajectory of CEO pay compared with typical worker pay. On the one hand, therehas been very little growth in the compensation of a typical worker since the late 1970s: Ithas grown just 19.5% over the 40 years from 1979 to 2020, despite a corresponding
9
growth of net economywide productivity of 59.7% (Mishel and Bivens 2021). The 1,322.2%growth in realized CEO compensation from 1978 (there are no data for 1979) to 2020 farexceeded the growth in productivity, profits, or stock market values in that period.
Dramatically high CEO pay does notsimply reflect the market for skillsThis section reviews competing explanations for the extraordinary rise in CEOcompensation over the past several decades. CEO compensation has grown a great dealsince 1965, but so has the pay of other high-wage earners. To some analysts, this suggeststhat the dramatic rise in CEO compensation has been driven largely by the demand for theskills of CEOs and other highly paid professionals. In this interpretation, CEOcompensation is being set by the market for “skills” or “talent,” not by managerial power orrent-seeking behavior.6 This explanation lies in contrast to that offered by Bebchuk andFried (2004) and Clifford (2017), who claim that the long-term increase in CEO pay is aresult of managerial power.
The “market for talent” argument is based on the premise that “it is other professionals,too,” not just CEOs, who are seeing a generous rise in pay. The most prominent exampleof this argument comes from Kaplan (2012a, 2012b). In the prestigious 2012 MartinFeldstein Lecture at the National Bureau of Economic Research, he claims:
In a follow-up paper for the Cato Institute, published as a National Bureau of EconomicResearch working paper, Kaplan expands this point:
However, the argument that CEO compensation is being set by the market for “skills” doesnot square with the available data corresponding to what Kaplan employed. Bivens andMishel (2013) address the larger issue of the role of CEO compensation in generatingincome gains at the very top and conclude that substantial rents are embedded in
Over the last 20 years, then, public company CEO pay relative to the top 0.1% hasremained relatively constant or declined. These patterns are consistent with acompetitive market for talent. They are less consistent with managerial power.Other top income groups, not subject to managerial power forces, have seensimilar growth in pay. (Kaplan 2012a, 4)"The point of these comparisons is to confirm that while public company CEOs earna great deal, they are not unique. Other groups with similar backgrounds—privatecompany executives, corporate lawyers, hedge fund investors, private equityinvestors and others—have seen significant pay increases where there is acompetitive market for talent and managerial power problems are absent. Again, ifone uses evidence of higher CEO pay as evidence of managerial power or capture,one must also explain why these professional groups have had a similar or evenhigher growth in pay. It seems more likely that a meaningful portion of the increasein CEO pay has been driven by market forces as well. (Kaplan 2012b, 21)
"
10
executive pay. According to Bivens and Mishel, CEO pay gains are not the result of acompetitive market for talent but rather reflect the power of CEOs to extract concessions.
Here we draw on and update Bivens and Mishel’s 2013 analysis to show that the evidencedoes not support Kaplan’s claim that “professional groups have had a similar or evenhigher growth in pay” than CEOs (Kaplan 2012b). Not even close. CEO compensation grewfar faster than compensation of very highly paid workers over the last few decades, whichsuggests that the market for skills was not responsible for the rapid growth of CEOcompensation.
Trends in the CEO-to-top-1% compensation ratioTo reach this finding, we use Kaplan’s series (Kaplan 2012b) on CEO compensation(through 2010 and updated forward using CEO realized compensation) and compare itwith the wages of the very highest wage earners in the top 0.1% (reflecting W-2 annualearnings, which includes exercised stock options and vested stock awards). We use topwage earners rather than top 0.1% household incomes, as Kaplan did, in order to make thecomparisons across earners.7 The wage benchmark seems the most appropriate onebecause it avoids issues of changing household demographics (e.g., increases in thenumber of two-earner households over time) and limits the income to labor income (i.e., itexcludes capital income, which is included in household income measures).
The data presented in Table 2 show the result of our analysis: We find that, contrary toKaplan’s findings, the compensation of CEOs has far outpaced that of the top 0.1% ofearners. We present the ratio of the average compensation of CEOs of large firms (theseries developed by Kaplan, incorporating stock options realized) to the average annualearnings of the top 0.1% of wage earners (based on a series developed by Kopczuk, Saez,and Song [2010] and updated by Mishel and Kandra [2020]) as a simple ratio and as alogged ratio (to convert it to a “premium,” defined as the relative pay differential betweentwo groups) for selected years from 1979 to 2019.
Both the simple ratios and the log ratios understate the relative pay of CEOs, becauseCEO pay is a nontrivial share of the denominator, a bias that has probably grown over timeas CEO relative pay has grown. If we were able to remove top CEOs’ pay from the top 0.1%category, it would reduce the average for the broader group.8
But even with this inherent bias, these ratios tell a striking story of excessive growth inCEO pay in recent decades: CEO compensation was 6.44 times the pay of the top 0.1% ofwage earners in 2019, substantially higher than the 4.36 ratio in 2007. CEO compensationgrew far faster than that of the top 0.1% of earners over the recovery from 2009 to 2019, asthe ratio spiked from 4.61 to 6.44. CEO compensation relative to the wages of the top0.1% of wage earners in 2019 far exceeded the ratio of 2.63 in 1989, a rise (+3.81) equal tothe pay of nearly four very-high-wage earners.9
The log ratio of CEO relative pay grew 90 log points from 1989 to 2019 with respect towage earners in the top 0.1%. CEO compensation grew more slowly than top 0.1% earningsover the 1979–1989 period, so longer-term comparisons back to 1979 show a lesser, but
11

Table 2 CEO-to-top-0.1% and college-to-high-school wage ratios,selected years, 1979–2019
Ratio Log ratio
CEO compensationto top 0.1% wage
earnersCollege-to-highschool wages
CEO compensationto top 0.1% wage
earnersCollege-to-highschool wages
1979 3.26 1.41 1.18 0.35
1989 2.63 1.59 0.97 0.46
1993 3.05 1.64 1.11 0.49
2000 7.77 1.75 2.05 0.56
2007 4.36 1.77 1.47 0.57
2009 4.61 1.74 1.53 0.55
2019 6.44 1.83 1.86 0.60
Change
1979–2007 1.10 0.35 0.29 0.22
1979–2019 3.17 0.42 0.68 0.26
1989–2019 3.81 0.24 0.90 0.14
Notes: Wages of top 0.1% of wage earners reflect W-2 annual earnings, which includes the value ofexercised stock options and vested stock awards. The college-to-high-school wage ratios compare hourlywages of workers who have a college degree with hourly wages of workers who have only a high schooleducation.
Source: Authors’ analysis of EPI State of Working America Data Library data on top 0.1% wages in Misheland Kandra 2020; data on wages by educational attainment from the EPI State of Working America DataLibrary; and data on CEO compensation from an extrapolation of Kaplan’s (2012b) CEO compensationseries.
still substantial, rise in CEO compensation relative to other top earners.
Figure B compares the CEO compensation to top 0.1% earnings ratios back to 1947. In2019 this ratio was 6.44, 3.26 points higher than the historical average of 3.18 over the1947–1979 period (a relative gain in wages earned by the equivalent of three very-high-wage earners).
That CEO compensation grew much faster than the earnings of the top 0.1% of wageearners is not because the top 0.1% did not fare well. The very highest earners—those inthe top 0.1% of all earners—saw their annual earnings (including realized stock options andvested stock awards) grow fantastically, though far less than the compensation of theCEOs of large firms: Top 0.1% annual earnings grew a healthy 341% from 1978 to 2019,though that was only a third as much as the 1,096% growth of our measure of realizedCEO compensation (see data in Table1).
If CEO pay growing far faster than that of other high earners is evidence of the presenceof rents, as Kaplan suggests, one would conclude that today’s top executives arecollecting substantial rents, meaning that if they were paid less there would be no loss ofproductivity or output in the economy.
The large discrepancy between the pay of CEOs and other very-high-wage earners alsocasts doubt on the claim that CEOs are being paid these extraordinary amounts because
12
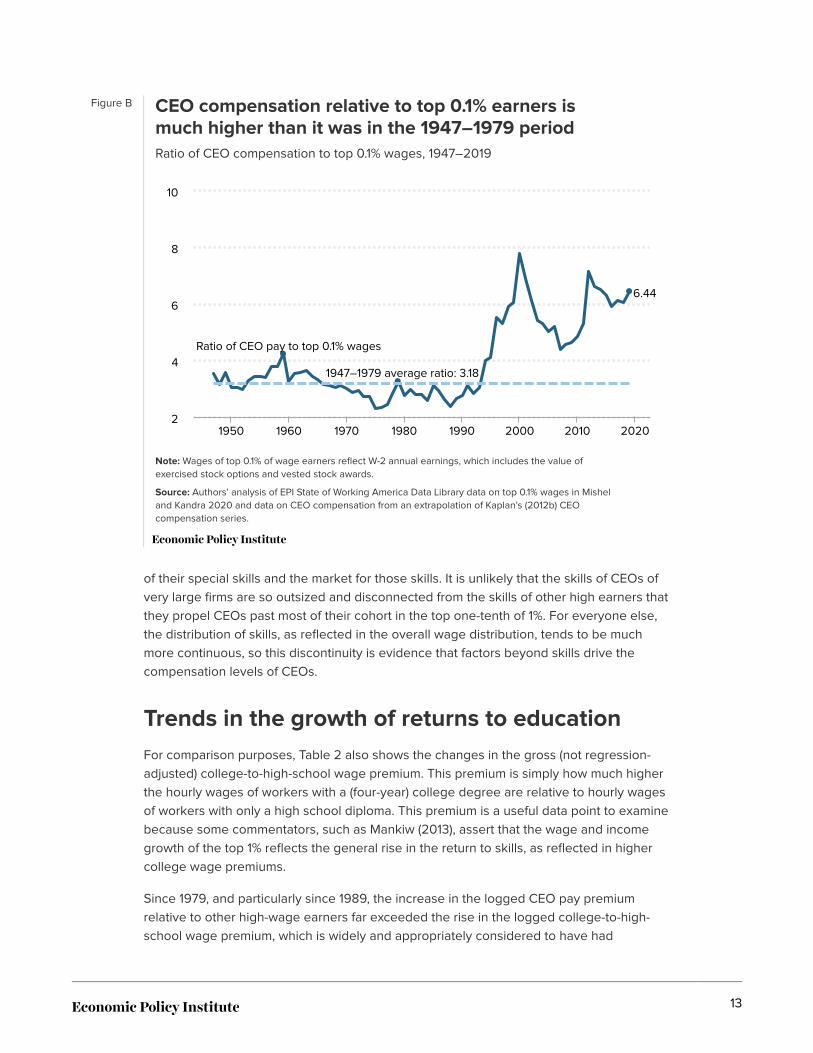
Figure B CEO compensation relative to top 0.1% earners ismuch higher than it was in the 1947–1979 periodRatio of CEO compensation to top 0.1% wages, 1947–2019
Note: Wages of top 0.1% of wage earners reflect W-2 annual earnings, which includes the value ofexercised stock options and vested stock awards.
Source: Authors’ analysis of EPI State of Working America Data Library data on top 0.1% wages in Misheland Kandra 2020 and data on CEO compensation from an extrapolation of Kaplan’s (2012b) CEOcompensation series.
Ratio of CEO pay to top 0.1% wages
1947–1979 average ratio: 3.18
6.44
1950 1960 1970 1980 1990 2000 2010 20202
4
6
8
10
of their special skills and the market for those skills. It is unlikely that the skills of CEOs ofvery large firms are so outsized and disconnected from the skills of other high earners thatthey propel CEOs past most of their cohort in the top one-tenth of 1%. For everyone else,the distribution of skills, as reflected in the overall wage distribution, tends to be muchmore continuous, so this discontinuity is evidence that factors beyond skills drive thecompensation levels of CEOs.
Trends in the growth of returns to educationFor comparison purposes, Table 2 also shows the changes in the gross (not regression-adjusted) college-to-high-school wage premium. This premium is simply how much higherthe hourly wages of workers with a (four-year) college degree are relative to hourly wagesof workers with only a high school diploma. This premium is a useful data point to examinebecause some commentators, such as Mankiw (2013), assert that the wage and incomegrowth of the top 1% reflects the general rise in the return to skills, as reflected in highercollege wage premiums.
Since 1979, and particularly since 1989, the increase in the logged CEO pay premiumrelative to other high-wage earners far exceeded the rise in the logged college-to-high-school wage premium, which is widely and appropriately considered to have had
13
substantial growth: The logged college wage premium grew from 0.46 in 1989 to 0.61 in2019, a far smaller rise than the logged ratio of CEO-to-top-0.1% earnings, a rise from 0.97to 1.83.
Mankiw’s claim that top 1% pay or top executive pay simply corresponds to the rise in thecollege-to-high-school wage premium is unfounded (Mishel 2013a, 2013b). Moreover, thedata we present here would show even faster growth of CEO relative pay if Kaplan’shistorical CEO compensation series (which we use as the basis for the ratios in Table 2)had been built using the Frydman and Saks (2010) series for the 1980–1994 period ratherthan the Hall and Liebman (1997) data.10
The stock market and CEO payThere is normally a tight relationship between overall stock prices and CEO compensation.Some commentators draw on this regularity to claim that CEOs are being paid for theirperformance since, in their view, CEOs’ goal is to raise stock prices.
However, the stock–CEO compensation relationship does not necessarily imply that CEOsare enjoying high and rising pay because their individual productivity is increasing (e.g.,because they head larger firms, have adopted new technology, or for other reasons). CEOcompensation often grows strongly when the overall stock market rises and individualfirms’ stock values rise along with it. This is a marketwide phenomenon, not one based inimproved performance of individual firms.
Most CEO pay packages allow pay to rise whenever the firm’s stock value rises; that is,they permit CEOs to cash out stock options regardless of whether the rise in the firm’sstock value was exceptional relative to comparable firms in the same industry. Similarly,vested stock awards increase in value when the firm’s stock price rises in simplecorrespondence to a marketwide escalation of stock prices. If corporate taxes are reducedand profits rise, leading to higher stock prices, is it accurate to say that CEOs have madetheir firms perform better?
The connection between CEO pay andoverall inequalitySome observers argue that exorbitant CEO compensation is merely a symbolic issue, withno consequences for the vast majority of workers. However, the escalation of CEOcompensation, and of executive compensation more generally, has fueled the growth oftop 1.0% and top 0.1% incomes, generating widespread inequality.
In their studies of tax returns from 1979 to 2005, Bakija, Cole, and Heim (2010, 2012)establish that the increases in income among the top 1% and top 0.1% of households weredisproportionately driven by households headed by someone who was either anonfinancial-sector “executive” (including managers and supervisors, hereafter referred toas “nonfinance executives”) or a financial-sector worker (executive or otherwise). Forty-
14
four percent of the growth of the top 0.1%’s income share and 36% of the top 1%’s incomeshare accrued to households headed by nonfinance executives; another 23% for eachgroup accrued to households headed by financial-sector workers (some portion of whichwere executives).
Together, finance workers (including some who are executives) and nonfinance executivesaccounted for 58% of the expansion of income for the top 1% of households and 67% ofthe income growth of the top 0.1%. The income growth of executives is the largest factorthat led top 0.1% and top 1.0% incomes to greatly increase over the last four decades.
Our data applies to the CEOs of the very largest firms. We presume that these CEOs setthe pay standards followed by other executives—of the largest publicly owned firms, ofsmaller publicly owned firms, of privately owned firms, and of major nonprofit firms(hospitals, universities, charities, etc.). If so, then CEO compensation is the largest driver oftop incomes.
Relative to others in the top 1%, households headed by nonfinance executives had roughlyaverage income growth; those headed by someone in the financial sector had above-average income growth; and the remaining top-1% households (nonexecutive, nonfinance)had slower-than-average income growth. These shares may actually understate the role ofnonfinance executives and the financial sector, because they do not account for increasedspousal income from these sources in those cases where the head of household is not anexecutive or in finance.11
High CEO pay reflects economic rents—concessions CEOs can draw from the economynot by virtue of their contribution to economic output but by virtue of their position ofpower. Alluding to the fictional town in the radio program A Prairie Home Companion,Clifford (2017) describes the Lake Wobegon world of setting CEO compensation that fuelsits growth: Every firm wants to believe its CEO is above average and therefore needs to becorrespondingly remunerated. But, in fact, CEO compensation could be reduced acrossthe board and the economy would not suffer any loss of output.
Another implication of rising pay for CEOs and other executives is that it reflects incomethat would otherwise have accrued to others: What these executives earned was notavailable for broader-based wage growth for other workers. (Bivens and Mishel [2013]explore this issue in depth.) It is useful, in this context, to note that wage growth for thebottom 90% would have been more than 70% faster over the 1979–2019 period had wageinequality not grown.12 Most of the rise of inequality took the form of redistributing wagesfrom the bottom 90%—whose share of wages fell from 69.8% to 60.9%—to the top1.0%—whose wage share nearly doubled, rising from 7.3% to 13.2%, with most of theincrease accruing to the top 0.1%, whose share of all wages grew from 1.6% to 5.0% (Misheland Kandra 2020).
15

Policy recommendations: Reversingthe trendSeveral policy options could reverse the trend of excessive executive pay and broadenwage growth. Some involve taxes:
• Implementing higher marginal income tax rates at the very top would limit rent-seeking behavior and reduce the incentives for executives to push for such high pay.
• Another option is to set corporate tax rates higher for firms that have higher ratios ofCEO-to-worker compensation. Clifford (2017) recommends setting a cap oncompensation and taxing companies on any amount over the cap, similar to the waybaseball team payrolls are taxed when salaries exceed a cap.
Other policies that could potentially limit executive pay growth are changes in corporategovernance, such as greater use of “say on pay,” which allows a firm’s shareholders tovote on top executives’ compensation.
Baker, Bivens, and Schieder (2019) review policies to restrain CEO compensation andexplain how tax policy and corporate governance reform can work in tandem: “Tax policythat penalizes corporations for excess CEO-to-worker pay ratios can boost incentives forshareholders to restrain excess pay,” but, “to boost the power of shareholders [to restrainpay], fundamental changes to corporate governance have to be made. One key exampleof such a fundamental change would be to provide worker representation on corporateboards.”
The CEOs examined in this report head large firms. These large firms, almost by definition,enjoy a degree of market power that some studies suggest has grown in recent decades.It seems that CEOs and other executives may have been prime beneficiaries of thesefirms’ greater market power. This suggests it could be beneficial to use the tools ofantitrust enforcement and regulation to restrain these firms’ market power. This would notonly promote economic efficiency and competition, but might help restrain executive payas well.
AcknowledgmentsThe authors thank the Stephen Silberstein Foundation for its generous support of thisresearch. Steven Balsam, an accounting professor at Temple University and author ofExecutive Compensation: An Introduction to Practice and Theory (2007) and EquityCompensation: Motivations and Implications (2013), has provided useful advice on dataconstruction and interpretation over the years. Steven Clifford, author of The CEO PayMachine: How It Trashes America and How to Stop It (2017), has also provided technicaladvice. Clifford served as CEO for King Broadcasting Company from 1987 to 1992 andNational Mobile Television from 1992 to 2000 and has been a director of 13 public andprivate companies.
16

About the authorsLawrence Mishel is a distinguished fellow and former president of the Economic PolicyInstitute. He is the co-author of all 12 editions of The State of Working America. His articleshave appeared in a variety of academic and nonacademic journals. His areas of researchinclude labor economics, wage and income distribution, industrial relations, productivitygrowth, and the economics of education. He holds a Ph.D. in economics from theUniversity of Wisconsin at Madison.
Jori Kandra is a research assistant at the Economic Policy Institute. In addition to her workon the CEO pay series, she has worked on the State of Working America 2020 wagesreport and the domestic workers chartbook, among other EPI publications. She has abachelor’s degree in economics from the University of Texas at Austin.
Notes1. In earlier reports our sample each year was sometimes fewer than 350 firms to the extent that
these large firms did not have the same CEO for most of or all of the year or the compensationdata were not yet available. In order to not let changes in sample size affect annual trends, weexamine the top 350 firms with the largest revenues each year for which there are data.
2. We chose which years to present in the table in part based on data availability. Where possible,we chose cyclical peaks (years of low unemployment).
3. A better comparison would be to the low-unemployment year of 1979, but those data are notavailable.
4. There are a limited number of firms, which existed only for certain years between 1992 and 1996,for which a North American Industry Classification System (NAICS) value is unassigned. Thismakes it impossible to identify the pay of the workers in the firm’s key industry. These firms aretherefore not included in the calculation of the CEO-to-worker compensation ratio.
5. As noted earlier, it may seem counterintuitive that the two ratios for 2000 are different from eachother when the average CEO compensation is the same. It is important to understand that (as wedescribe later in this report) we do not create the ratio from the averages; rather we construct aratio for each firm and then average the ratios across firms.
6. The managerial power view asserts that CEOs have excessive, noncompetitive influence over thecompensation packages they receive. Rent-seeking behavior is the practice of manipulatingsystems to obtain more than one’s fair share of wealth—that is, finding ways to increase one’s owngains without actually increasing the productive value one contributes to an organization or to theeconomy.
7. We thank Steve Kaplan for sharing his CEO compensation series with us (Kaplan 2012b). Theseries on the income of the top 0.1% of households that Kaplan used is no longer available.Moreover, as we discuss, the appropriate comparison is to other earners, not to households, whichcould have multiple earners and shifts in the number of earners over time.
8. Temple University professor Steve Balsam provided tabulations from the Capital IQ database ofannual wages of executives exceeding the wage thresholds (provided to him based on the Social
17

Security Administration data used in Mishel and Kandra 2020) that place them in the top 0.1% ofwage earners. There were 38,824 executives in publicly held firms in 2007; of those, 9,692executives were in the top 0.1% of wage earners. These 9,692 executives had average annualearnings of $4.4 million. Using Mishel et al.’s (2012) estimates of top 0.1% wages, we find thatexecutive wages make up 13.3% of total top 0.1% wages. One can gauge the bias of includingexecutive wages in the denominator by noting that the ratio of executive wages to all top 0.1%wages in 2007 was 2.14 but the ratio of executive wages to nonexecutive wages was 2.32. We donot have data that would permit an assessment of the bias in 1979 or 1989. We also lackinformation on the number and wages of executives in privately held firms: to the extent that theirCEO compensation exceeds that of publicly held firms, their inclusion would indicate an evenlarger bias. The Internal Revenue Service Statistics of Income (SOI) Bulletin reports that there werenearly 15,000 corporate tax returns in 2007 of firms with assets exceeding $250 million (IRS 2019).Given that the total number of publicly held firms in the United States was roughly 5,000 in 2007(Bloomberg 2018), the majority of these 15,000 tax returns had to have come from privately heldcompanies, meaning there is a much larger number of executives of large firms than we are ableto capture through data on publicly held firms.
9. A one-point rise in the ratio is the equivalent of the average CEO earning an additional amountequal to that of the average earnings of someone in the top 0.1%.
10. Kaplan (2012b, 14) notes that the Frydman and Saks series grew 289% whereas the Hall andLiebman series grew 209%. He also notes that the Frydman and Saks series grew faster than theseries reported by Murphy (2012).
11. The tax data analyzed categorizes a household’s income according to the occupation andindustry of the head of household. It is possible that a “secondary earner,” or spouse, has incomeearned as an executive or as a financial-sector worker. If the household is in the top 1.0% or top0.1%, but the head of household is not an executive or in finance, then the spouse’s contribution toincome growth will not be identified as being connected to executive pay or financial-sector pay.The discussion in this paragraph draws on Bivens and Mishel 2013.
12. This follows from the fact that over 1979–2019 annual earnings for the bottom 90% rose by26.0%, while the average growth across all earners was 44.6% (Mishel and Kandra 2020). Thatmeans that the bottom 90% would have seen their earnings grow 18.6 percentage points moreover the 1979–2019 period if they had enjoyed average growth (i.e., no increase in inequality, 44.6less 26.0).
ReferencesBaker, Dean, Josh Bivens, and Jessica Schieder. 2019. Reining in CEO Compensation and Curbingthe Rise of Inequality. Economic Policy Institute, June 2019.
Bakija, Jon, Adam Cole, and Bradley Heim. 2010. “Job and Income Growth of Top Earners and theCauses of Changing Income Inequality: Evidence from U.S. Tax Return Data.” Department ofEconomics Working Paper 2010-24, Williams College, November 2010.
Bakija, Jon, Adam Cole, and Bradley Heim. 2012. “Job and Income Growth of Top Earners and theCauses of Changing Income Inequality: Evidence from U.S. Tax Return Data.” Department ofEconomics Working Paper, Williams College, April 2012.
Balsam, Steven. 2007. Executive Compensation: An Introduction to Practice and Theory.
18
Washington, D.C.: WorldatWork Press.
Balsam, Steven. 2013. Equity Compensation: Motivations and Implications. Washington, D.C.:WorldatWork Press.
Bebchuk, Lucian, and Jesse Fried. 2004. Pay Without Performance: The Unfulfilled Promise ofExecutive Remuneration. Cambridge, Mass.: Harvard Univ. Press.
Bivens, Josh, and Lawrence Mishel. 2013. “The Pay of Corporate Executives and FinancialProfessionals as Evidence of Rents in Top 1 Percent Incomes.” Economic Policy Institute WorkingPaper no. 296, June 2013.
Bloomberg. 2018. “Where Have All the Public Companies Gone?” April 9, 2018.
Bureau of Economic Analysis (BEA). Various years. National Income and Product Accounts (NIPA)Tables [online data tables]. Tables 6.2C, 6.2D, 6.3C, and 6.3D.
Bureau of Labor Statistics (BLS). Various years. Employment, Hours, andEarnings—National [database]. In Current Employment Statistics [public data series].
Clifford, Steven. 2017. The CEO Pay Machine: How It Trashes America and How to Stop It. New York:Penguin Random House.
Compustat. Various years. ExecuComp [commercial database].
Federal Reserve Bank of St. Louis. Various years. Federal Reserve Economic Data (FRED) [database].
Frydman, Carola, and Raven E. Saks. 2010. “Executive Compensation: A New View from a Long-TermPerspective, 1936–2005.” Review of Financial Studies 23, no. 5: 2099–2138.
Gould, Elise, 2020. “The Labor Market Continues to Improve in 2019 as Women Surpass Men inPayroll Employment, but Wage Growth Slows.” Working Economics Blog (Economic Policy Institute),January 10, 2020.
Hall, Brian J., and Jeffrey B. Liebman. 1997. “Are CEOs Really Paid Like Bureaucrats?” NationalBureau of Economic Research Working Paper no. 6213, October 1997.
Internal Revenue Service (IRS). 2019. “SOI Bulletin Historical Table 12: Number of Business IncomeTax Returns, by Size of Business for Income Years, Tax Years 1990–2016, Expanded Version” (datatable). Excel file downloadable at https://www.irs.gov/statistics/soi-tax-stats-historical-table-12 (webpage when updated December 13, 2018).
Kaplan, Steven N. 2012a. “Executive Compensation and Corporate Governance in the U.S.:Perceptions, Facts, and Challenges.” Martin Feldstein Lecture, National Bureau of EconomicResearch, Washington, D.C., July 10, 2012.
Kaplan, Steven N. 2012b. “Executive Compensation and Corporate Governance in the U.S.:Perceptions, Facts, and Challenges.” National Bureau of Economic Research Working Paper no.18395, September 2012.
Kopczuk, Wojciech, Emmanuel Saez, and Jae Song. 2010. “Earnings Inequality and Mobility in theUnited States: Evidence from Social Security Data Since 1937.” Quarterly Journal of Economics 125,no. 1: 91–128.
Mankiw, N. Gregory. 2013. “Defending the One Percent.” Journal of Economic Perspectives 27, no. 3:21–24.
19

Mishel, Lawrence. 2013a. “Greg Mankiw Forgets to Offer Data for His Biggest Claim.” WorkingEconomics Blog (Economic Policy Institute), June 25, 2013.
Mishel, Lawrence. 2013b. “Working as Designed: High Profits and Stagnant Wages.” WorkingEconomics Blog (Economic Policy Institute), March 28, 2013.
Mishel, Lawrence, and Josh Bivens. 2021. “The Role of Policy Choices in Explaining WageSuppression and Wage Inequality.” International Productivity Monitor, Fall 2021 (forthcoming).
Mishel, Lawrence, Josh Bivens, Elise Gould, and Heidi Shierholz. 2012. The State of WorkingAmerica, 12th Edition. An Economic Policy Institute book. Ithaca, N.Y.: Cornell Univ. Press.
Mishel, Lawrence, and Jori Kandra. 2020. “Wages for the Top 1% Skyrocketed 160% Since 1979 Whilethe Share of Wages for the Bottom 90% Shrunk.” Working Economics Blog (Economic PolicyInstitute), December 1, 2020.
Mishel, Lawrence, and Jori Kandra. 2021. “Preliminary Data Show CEO Pay Jumped Nearly 16% in2020, While Average Worker Compensation Rose 1.8%.” Working Economics Blog (Economic PolicyInstitute), May 27, 2021.
Murphy, Kevin. 2012. “The Politics of Pay: A Legislative History of Executive Compensation.”University of Southern California Marshall School of Business Working Paper no. FBE 01.11.
Sabadish, Natalie, and Lawrence Mishel. 2013. “Methodology for Measuring CEO Compensation andthe Ratio of CEO-to-Worker Compensation, 2012 Data Update.” Economic Policy Institute WorkingPaper no. 298, June 2013.
Securities and Exchange Commission (SEC). 2015. “SEC Adopts Rule for Pay Ratio Disclosure: RuleImplements Dodd-Frank Mandate While Providing Companies with Flexibility to Calculate Pay Ratio.”Press release no. 2015-160, August 5, 2015.
20