century iron mines corporation - proactiveinvestors uk · century iron mines corporation 3 678 57...
TRANSCRIPT
Century Iron Mines Corporation
An Introduction to an Emerging
Canadian Iron Ore Company
February 2012
TSX: FER www.centuryiron.com Sustainable Development

2 Century Iron Mines Corporation
Forward Looking Statement
Except for statements of historical fact, this presentation contains certain “forward-looking information”
within the meaning of applicable securities law. Forward-looking information is frequently characterized by
words such as “plan”, “project”; “intend”, “believe”, “anticipate”, “estimate” and other similar words, or
statements that certain events or conditions “may” or “will” occur. Forward-looking statements are based
on the opinions and estimates of management at the date the statements are made, and are subject to a
variety of risks and uncertainties and other factors that could cause actual events or results to differ
materially from those anticipated in the forward-looking statements. Factors that could cause actual
results to differ materially from those in forward-looking statements include market prices for metals, the
conclusions of detailed feasibility and technical analyses, lower than expected grades and quantities of
mineralization and resources, mining rates and recovery rates and the lack of availability of necessary
capital, which may not be available to the Corporation on terms acceptable to it or at all, changes in and
the effect of government policies with respect to mineral exploration and exploitation, the ability to obtain
required permits, delays in exploration and development projects and the possibility of adverse
developments in the financial markets generally, potential environmental issues and liabilities associated
with exploration and development and mining activities. The Corporation is also subject to the specific
risks inherent in the mining business as well as general economic and business conditions. The
Corporation undertakes no obligation to update forward-looking information if circumstances or
management’s estimates should change except as required by law. The reader is cautioned not to place
undue reliance on forward-looking statements. More detailed information about potential factors that
could affect financial results is included in the documents that may be filed from time to time with the
Canadian securities regulatory authorities by the Corporation.

3 Century Iron Mines Corporation
678
57
735
246
981
151
532 683
475
1158
21
51 72
92 164
0
500
1000
1500
2000
2500
2001 2001-2011Growth
2011 2012-2021Growth (CRU)
2021 (CRU)
ROW China India
Global Crude Steel Growth Trend 2001 - 2021
850
640 1490
2303 813
Mtpa
Other
developing
economies 177
Developed
economies 69
Over the next 10 years:
The world will grow faster in the last
China will still grow 90% as much as the last
Developing economies will contribute over
90% of growth
Developing economies driving growth
Source: World Steel Association, CRU, Century
4 Century Iron Mines Corporation
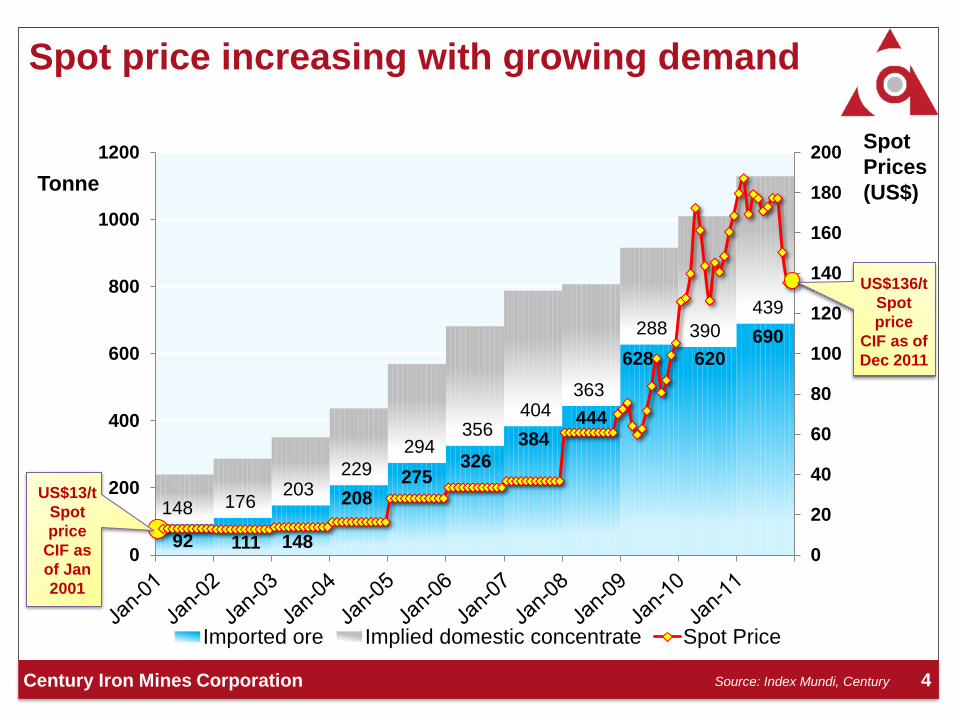
92 111 148
208 275
326
384 444
628 620
690
148 176 203
229
294 356
404 363
288 390
439
0
20
40
60
80
100
120
140
160
180
200
0
200
400
600
800
1000
1200
Tonne
Imported ore Implied domestic concentrate Spot Price
Spot price increasing with growing demand
US$13/t
Spot
price
CIF as
of Jan
2001
Spot
Prices
(US$)
Source: Index Mundi, Century
US$136/t
Spot
price
CIF as of
Dec 2011

5 Century Iron Mines Corporation
$10 Billion in Canadian Iron Ore in One Year (Acquisitions, Investments, Expansions More to come)
1 2 3 4 Century Iron (FER) $240M investment by WISCO & MinMetals
5 Consolidated Thompson (CLM.TO)
$5B acquisition by Cliffs Natural Resources
12 Iron Ore Company (IOC) $1B expansion from 25Mtpa to 50Mtpa at Carol Lake
13 ArcelorMittal (MT)
$2.1B expansion from 25Mtpa to 50Mtpa at Mt. Wright
7 Tata (TTM)
$300M DSO, $50M+$5B Taconite investment at
Millennium Iron Range
9 Adriana Resources (ADI.V) $120M investment by WISCO
10 Baffinland Iron Mines Corp. (BIM.TO)
$600M investment by ArcelorMittal
11 Advanced Explorations Inc. (AXI.V) $50m+$1B investment into Roche Bay
TOTAL: $10.41 Billion +

Financial Highlights & Capital Structure
Financial highlights Sept. 30, 2011 March 31, 2011
Cash and cash equivalents $90,423,431 4,958.672
Exploration and evaluation assets $27,521,076 14,231,007
Capital structure
Shares outstanding 94,853,275
Warrants and options outstanding 8,000,822
Fully diluted 100,854,097
Share Price (Feb. 2, 2012) $1.85
Market capitalization $175 million
Share structure
Founding shareholders and management 55.12%
WISCO (approx. 25%) and MinMetals (5%) – Strategic Partners 30%
Public shareholders 14.89%
Total 100.00%
6 Century Iron Mines Corporation

7 Century Iron Mines Corporation
Corporate Vision
TO BECOME ONE OF CANADA’S LARGEST IRON ORE
PRODUCERS
Promising iron ore assets in Canada • Surrounded by established infrastructure
• NI 43-101-compliant resources approaching 1 Bt
• In a rich and expanding iron ore region with huge resource potential
China focus • 2 Global Fortune 500 strategic partners, securing:
- Stable access to the Chinese market through two of China’s largest end-users, importers and traders
- Future access to substantial production capital

8 Century Iron Mines Corporation
Structure and Project Overview Corporate Structure Iron Ore Projects
Joint Venture
Champion
Minerals Inc.
(TSX: CHM)
Attikamagen
Project
40-49%
51-60%
(Note 2)
Minmetals
Exploration &
Development
(Luxembourg)
Limited S.à.r.l
WISCO
International
Resources
Development
& Investment
Ltd (PRC)
Approx.
5%
Approx.
25%
60%
Sunny Lake
Project
Duncan Lake
Project
Augyva Mining
Resources Inc.
(TSXV: AUV)
35-49%
100%
Four projects being
acquired from
Altius Minerals Inc.
(TSX: ALS)
100% (Note 3)
51-65%
(Note 1)
40%
Labrador Iron Mines Holdings Ltd. Projects
James Bay Area
Duncan Lake
Note 1: Currently a 51% interest with an option to increase to a 65% interest under an
option and joint venture agreement with Augyva Mining Resources Inc.
Note 2: Currently under an Option/JV Agreement with Champion Minerals Inc.
to earn up to a 51% then 60% interest
Note 3: On Sept 19, 2011, Century entered into an agreement with Altius Minerals Inc.
to acquire the 100% of four Altius properties under certain conditions.
Century Iron
Mines
Corporation
(TSX: FER)
3
3 1 2
4
9 Century Iron Mines Corporation
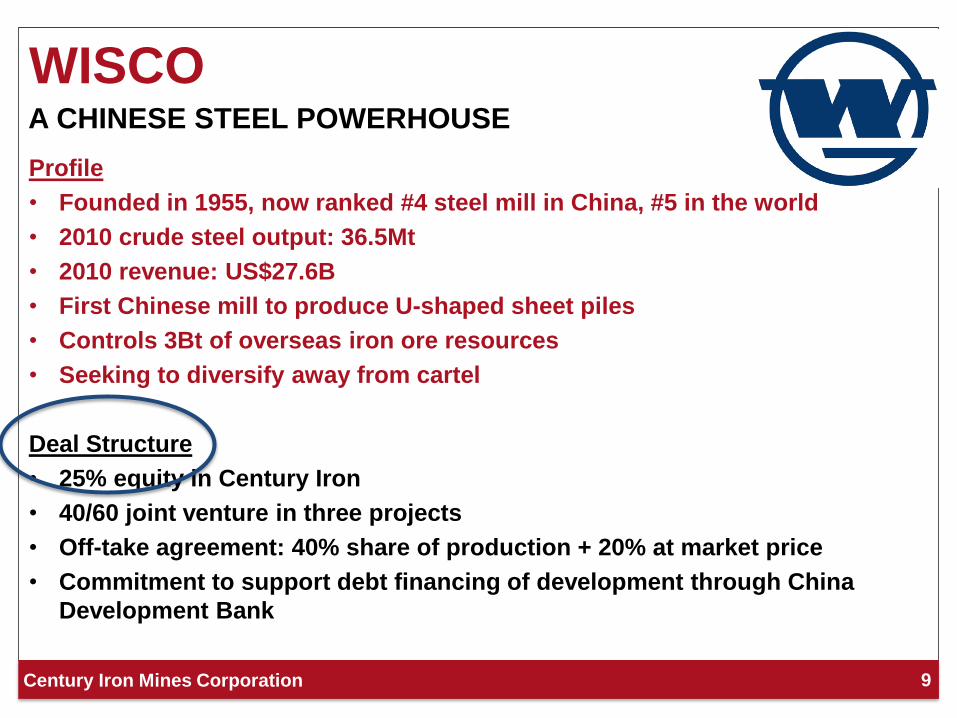
WISCO
Profile
• Founded in 1955, now ranked #4 steel mill in China, #5 in the world
• 2010 crude steel output: 36.5Mt
• 2010 revenue: US$27.6B
• First Chinese mill to produce U-shaped sheet piles
• Controls 3Bt of overseas iron ore resources
• Seeking to diversify away from cartel
Deal Structure
• 25% equity in Century Iron
• 40/60 joint venture in three projects
• Off-take agreement: 40% share of production + 20% at market price
• Commitment to support debt financing of development through China
Development Bank
A CHINESE STEEL POWERHOUSE

MinMetals
Profile
• Founded in 1950, active in development, production, trading, operations, logistics, finance and real estate; particular expertise in laboratory analysis
• 2010: Ranked #9 in China’s Top 500 Manufacturers, #30 in China’s top 500 Companies
• 2009 revenues US$27B
• Major international transactions:
- C$6.3B Equinox acquisition offer, April 2011
- US$1.35B acquisition of Oz Minerals’ assets (2nd largest zinc producer and 3rd largest mining company in Australia, 2009)
- C$437M acquisition of Northern Peru Copper jointly with Jiangxi Copper, January 2008
Deal Structure
• 5% equity in Century Iron
• Off-take agreement: 10% of production at market price
A LARGE-SCALE AND DIVERSIFIED CHINESE SOE
10 Century Iron Mines Corporation

11 Century Iron Mines Corporation
A Winning Formula for Success
30% Chinese Strategic
Partners
70% Canadian & public
investors
40% Chinese SOEs 60-70% Chinese
off-take
Securing success
• Financial structure:
• Capex requirement to enter production of only 13%
• Balance funded by end-user/banker
• 60-70% of end product pre-sold
• Access to technical competence of major international companies with successful experience in mega-projects
• Maintaining majority interest in all projects
60% Century (TSX: FER)
Up to 70% financing by debt capital by end user/banker
Equity JV/Project Market
Accretive &
Equity enhancing
12 Century Iron Mines Corporation
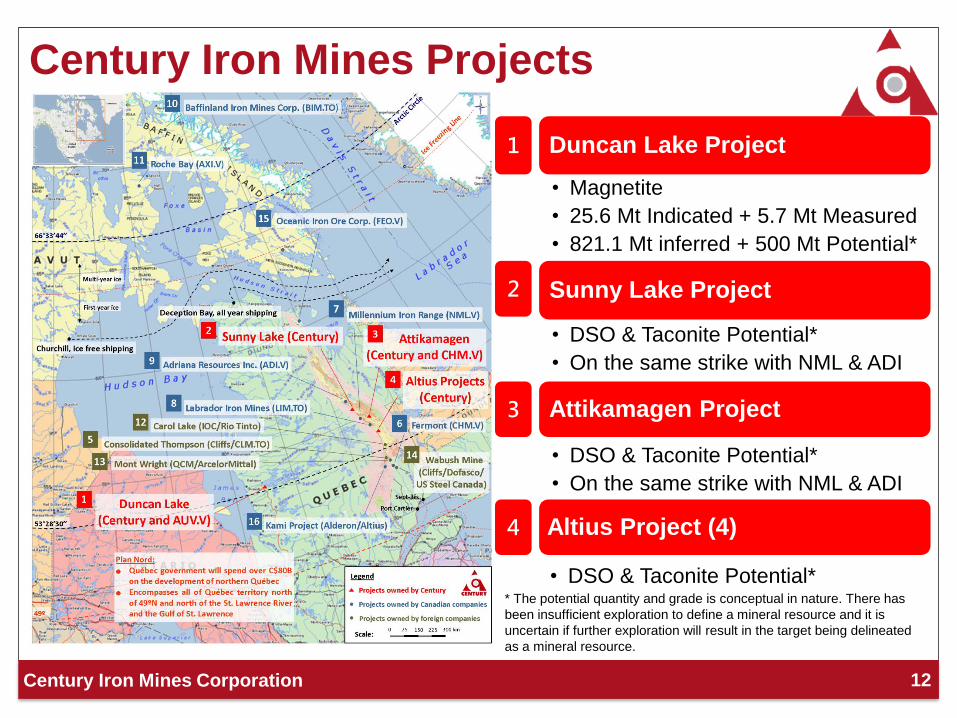
Century Iron Mines Projects
1
2
3
* The potential quantity and grade is conceptual in nature. There has
been insufficient exploration to define a mineral resource and it is
uncertain if further exploration will result in the target being delineated
as a mineral resource.
4
• DSO & Taconite Potential*
Altius Project (4)
Duncan Lake Project
• Magnetite
• 25.6 Mt Indicated + 5.7 Mt Measured
• 821.1 Mt inferred + 500 Mt Potential*
Sunny Lake Project
• DSO & Taconite Potential*
• On the same strike with NML & ADI
Attikamagen Project
• DSO & Taconite Potential*
• On the same strike with NML & ADI

13 Century Iron Mines Corporation
Duncan Lake Iron Project
• 10 km south of LG2 regional airport
• 50 km south of Radisson
• LG1 & LG2 of Hydro Quebec within 100 km
• 120 km (approx.) from James Bay
• Highway 109 goes through the property
connecting Matagami and Radisson
Mineral Resource Estimate Summary
Resource
category
Million
tonnes
Grade
%
Measured 5.7 23.29
Indicated 25.6 23.84
Inferred 821.1 24.56
Potential * 500.0 -
Well-Established Infrastructure
Duncan
Project
* The potential quantity and grade is conceptual in nature. There has been insufficient
exploration to define a mineral resource and it is uncertain if further exploration will result in
the target being delineated as a mineral resource.

14 Century Iron Mines Corporation
Duncan Lake – Exploration Programs
Magnetic Map of Duncan Lake Area
■ 99 claims
■ 4,615 hectares
■ 6 banded iron formation deposits identified along a 25km belt
• Roche Ltd.: completed environmental
scoping study; now performing
environmental baseline study
• On-going internal logistics study
• 2011 drilling program = 114 holes
drilled for 40,418 m
• 81 holes assayed and reported Dec.
19. 2011.
Completed Exploration Programs
In Progress
• 1973 drilling = 22 boreholes for
4,143m on deposits 3, 4, and 6
• 2008-2009 drilling = 52 holes
drilled for 10,461m
• Resource estimated by Met-Chem
• 51% JV and operator of the Duncan Lake Project
• Option agreement to earn up to 65%
Deposit 6

15 Century Iron Mines Corporation
Duncan Lake – Exploration Update
News release dated December
19, 2011
Selected Composite Assay results
Duncan Lake Core* Grade
Hole No.
From
(m)
To
(m)
Length
(m) FE%
DUN-11-239 118.5 208.8 90.3 21.5
DUN-11-244 253.1 385.5 132.4 31.3
DUN-11-349 285.9 449.3 163.4 23.4
DUN-11-76 170.4 250.5 80.1 21.7
DUN-11-81 170.4 258.8 88.4 30.2
Total holes assayed: 82
* Core length are down whole length and not true widths of
the minerals zones.

16 Century Iron Mines Corporation
Deposit
Tonnage (Mt)
Otherwise specified DTWR % Fe Head % Fe Conc. % Crude /
Concentrate M&I Inferred
Duncan -1 17.5 283.86 34.01 21.82 - 23.71 65.83 2.94
Duncan -2 5.83 78.8 38.77 27.40 -26.90 66.61 2.58
Duncan -3 154.72 31.08 24.83 68.93 3.22
Duncan -4 7.95 192.34 34.13 25.29 - 24.33 68.38 2.93
Duncan -5 32.77 25.35
Duncan -6 78.77 25.35
Other major Canadian magnetite / taconite deposits:
Range 2 to 4 Bt 1 to 2 Bt 26.00- 27.26 29.08 – 31.15 68.00 – 70.00 3.67 - 3.85
Duncan Lake – Grade & Recovery Analysis
• Final products from Duncan Lake will be iron concentrates and pellets
• Excellent grade, 65-69% Fe in final concentrate product
• Low silica content on Deposit 3 and 4 (coarser grains)
• Very low impurity (e.g. phosphorus and manganese in the concentrate)
• Good liberation, Davis Tube Tests resulting 85% passing 75 microns (200 mesh)
Head Assay WR
Deposit Samples FeT FeT SiO2 Al2O3 Fe2O3 MgO CaO Na2O K2O TiO2 MnO P2O5 Cr2O3 LOI
# Qty % % % % % % % % % % % % % % %
1 54 27.18 65.83 7.60 0.29 94.18 0.14 0.24 0.048 0.111 0.025 0.026 0.021 0.012 -2.87 34.01
2 57 31.01 66.11 7.11 0.27 94.58 0.24 0.11 0.038 0.122 0.035 0.015 0.024 0.014 -2.80 38.77
3 23 29.45 68.93 2.58 0.08 98.62 0.08 0.07 0.022 0.028 0.024 0.013 0.014 0.015 -2.46 31.08
4 10 27.11 68.38 4.61 0.12 97.83 0.07 0.08 0.027 0.053 0.020 0.017 0.019 0.014 -3.11 34.13
Total 144
In addition 42 tests on option 1
Concentrate AssaysLocation

17 Century Iron Mines Corporation
Water Canada, particularly Quebec, enjoys
abundant water, which is important for
concentration operations
Electricity
Located near Hydro-Québec’s James Bay
Robert-Bourassa hydro-electric power
plant on La Grande River, the world’s 10th
largest, which will provide low-cost energy
for the project
ABUNDANT WATER AND ELECTRICITY IN THE AREA
Direct Benefits:
• Reduced cost of construction and operation of facilities to supply water and electricity
• Long-term competitive advantage for concentration and pelletizing operations
Duncan Lake – Global Competitive Advantage

18 Century Iron Mines Corporation
Pipeline Solution in a
Well-Studied Area
• A planned 150km slurry pipeline1
between the hydro plant in
Radisson and the slurry receptor
plant on James Bay.
• Based on historic data and
compared with similar existing
pipeline systems in commercial
operations, the operating cost
is estimated at US$1.00~1.25 per
tonne2
• Plan Nord identifies a proposed
nearby deep-water port location
Note: 1) Where the pipeline crosses junctions or rivers, it will be constructed
above-ground with insulation or heat tracing techniques to reduce the negative
operational impact of extreme cold. 2) Based on publicly available sources and
management calculations.
Duncan Lake Project – Land Transportation
Robert-Bourassa, the world’s 10th -largest hydroelectric power plant
DUNCAN
PROJECT
LG1
LG2

19 Century Iron Mines Corporation
Shipping Considerations
• Commercial shipping in Hudson Bay
has been well established for 70+ years
(e.g. Port of Churchill)
• James Bay water depths permit deep-sea
marine terminal for Capesize vessels, 80-
100 metres in Hudson Bay.
• Up to 150 days of ice-free shipping,
year-round shipping with ice class vessels
• Possible future direct North-West
Passage to Asia
Ongoing Studies
• Identified two locations for port site
• Extensive shipping study is underway
• Partnering with shipping and engineering
companies to work out logistic options
Duncan Lake Project – Oceanic Shipping
20 Century Iron Mines Corporation
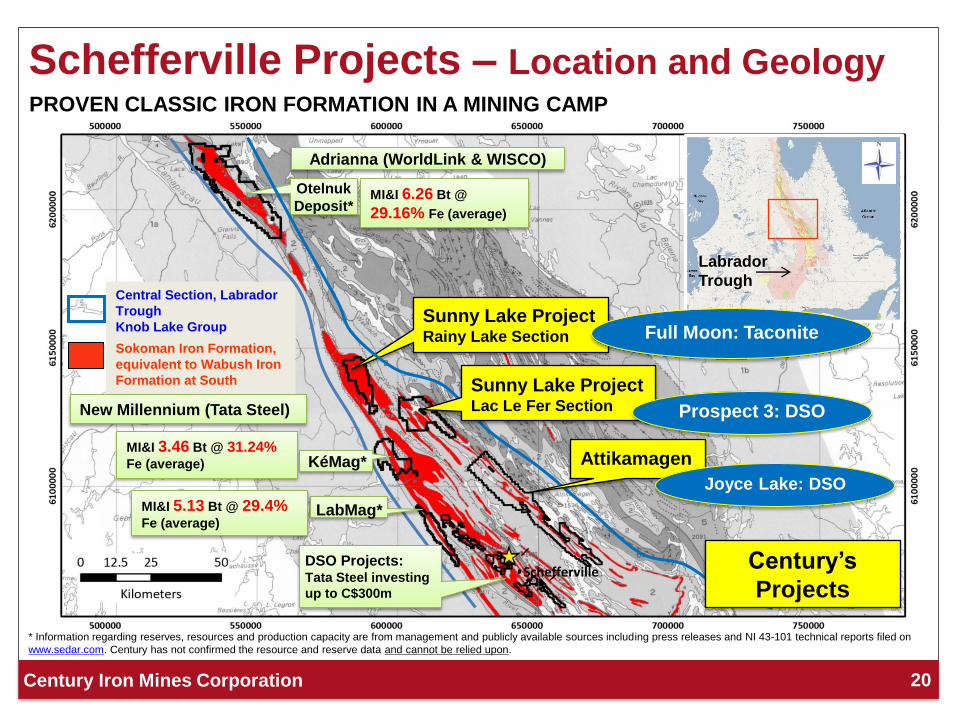
Schefferville Projects – Location and Geology
Central Section, Labrador
Trough
Knob Lake Group
Sokoman Iron Formation,
equivalent to Wabush Iron
Formation at South
Adrianna (WorldLink & WISCO)
New Millennium (Tata Steel)
Schefferville
Otelnuk
Deposit*
Labrador
Trough
Sunny Lake Project Lac Le Fer Section
Attikamagen
DSO Projects: Tata Steel investing
up to C$300m
Sunny Lake Project Rainy Lake Section
Century’s
Projects
LabMag*
KéMag*
MI&I 6.26 Bt @
29.16% Fe (average)
MI&I 3.46 Bt @ 31.24% Fe (average)
MI&I 5.13 Bt @ 29.4% Fe (average)
PROVEN CLASSIC IRON FORMATION IN A MINING CAMP
* Information regarding reserves, resources and production capacity are from management and publicly available sources including press releases and NI 43-101 technical reports filed on
www.sedar.com. Century has not confirmed the resource and reserve data and cannot be relied upon.
Joyce Lake: DSO
Prospect 3: DSO
Full Moon: Taconite

21 Century Iron Mines Corporation
MAGNETIC ANOMALIES IN RAINY LAKE/LAC LE FER AREA
• 530 mineral claims, covering 25,692
hectares in Labrador Trough region
• On strike from KeMag LaMag deposits
(8-9Bt) to the south and Lac Otelnuk
(6Bt) to the north.
• Volumetric Estimates (“MVE”) and
Taconite Tonnage Potential Estimates*
(“TTPE”) were also carried out resulting
in a TTPE to a depth of 250m of
between 9.98 to 20 Bt in the area
• Rainy Lake – in 2011 drilled 31 holes
6,387m [31 holes assayed and
reported]
• Lac Le Fer -- in 2011 drilled 2 RC* holes
198m and 5 DDH** holes 627m
*RC – Reverse Circulation
**DDH Diamond Drilling
Sunny Lake Iron Project
Rainy Lake Section (pg. 23)
Lac Le Fer Section
* The potential quantity and grade is conceptual in nature. There has been insufficient exploration to define a mineral
resource and it is uncertain if further exploration will result in the target being delineated as a mineral resource.
Feb 1, 2012 Press Release

22 Century Iron Mines Corporation
Sunny Lake – Rainy Lake Section
GEOLOGICAL CROSS SECTION OF FULL MOON TARGET
2.75km
EOH: 364m
EOH: 196m

23 Century Iron Mines Corporation
Sunny Lake – Rainy Lake Section (Full Moon)
News release dated December 6, 2011
Selected Composite Assay results Rainy Lake [Full Moon]
From To Core* Grade
Hole No. (m) (m) Length (m) FE%
RL-11-0001 75.5 318.0 242.5 27.9
RL-11-0002 30.9 372.0 341.1 28.4
RL-11-0003 24.2 248.0 223.8 30.2
RL-11-0004 27.0 228.4 201.4 28.4
Total holes assayed: 8 * Core lengths are down whole length and not true
widths of the minerals zones.
News release dated January 17, 2012
Selected Composite Assay results
Rainy Lake [Full Moon]
From To Core* Grade
Hole No. (m) (m) Length (m) FE%
RL-11-0801 67.2 304.0 236.8 30.1
RL-11-0401 5.4 323.6 318.2 29.5
RL-11-0402 4.5 269.4 264.9 31.0
RL-11-0404 15.0 267.0 252.0 30.3
RL-11-0004 13.0 285.4 272.4 30.4
Total holes assayed: 23
Latest Large Taconite Discovery

24 Century Iron Mines Corporation
Sunny Lake – Lac Le Fer Section (DSO Potential)
Prospect #2 Prospect #3
Sample Fe % Mn %
SiO2
% Sample Fe %
Mn
%
SiO2
%
5376 48.6 0.05 31.82 5383 56.4 0.36 15.1
5377 41.1 0.06 35.92 5384 59 0.08 15.42
5378 46.9 0.11 22.28 5385 59.5 0.11 13.9
5379 46.6 0.05 31.78 5386 41.4 0.25 37.48
5380 48.5 0.69 31.68 5387 67.1 0.22 1.88
5381 59.7 0.14 2.76 5388 58.4 0.11 10.65
Prospect #4 5391 50.8 0.55 23.4
9957 66.8 0.3 2.06 5392 63.8 0.22 5.91
9958 55.8 0.06 18.54 5394 57.7 0.17 14.08
Prospect #5 5395 59.4 0.11 13.12
9759 43.3 0.21 34.9 5396 58.8 0.22 4.03
9760 43.5 0.03 35.61 5397 63.3 0.17 6.06
9761 60.2 0.06 11.52 5398 62.1 1.83 5.34
9762 58.8 0.24 13.87 5399 57.6 0.28 14.24
Prospect #6 5400 42.8 4.32 28.43
9763 44.9 2.88 34.02 9751 61.2 2.67 6.98
9764 61.5 0.12 7.93 9752 67.4 0.1 2.27
9765 23.8 0.24 59.9 9753 66.6 0.23 3.46
9766 38.3 0.12 40.51 9961 63.1 0.28 7.72
9767 61.5 0.21 2.67 Fe samples > 55%*
9768 56.7 0.09 10.09
* Assay results from 1951 exploration
program (M. Tremblay)
25 Century Iron Mines Corporation
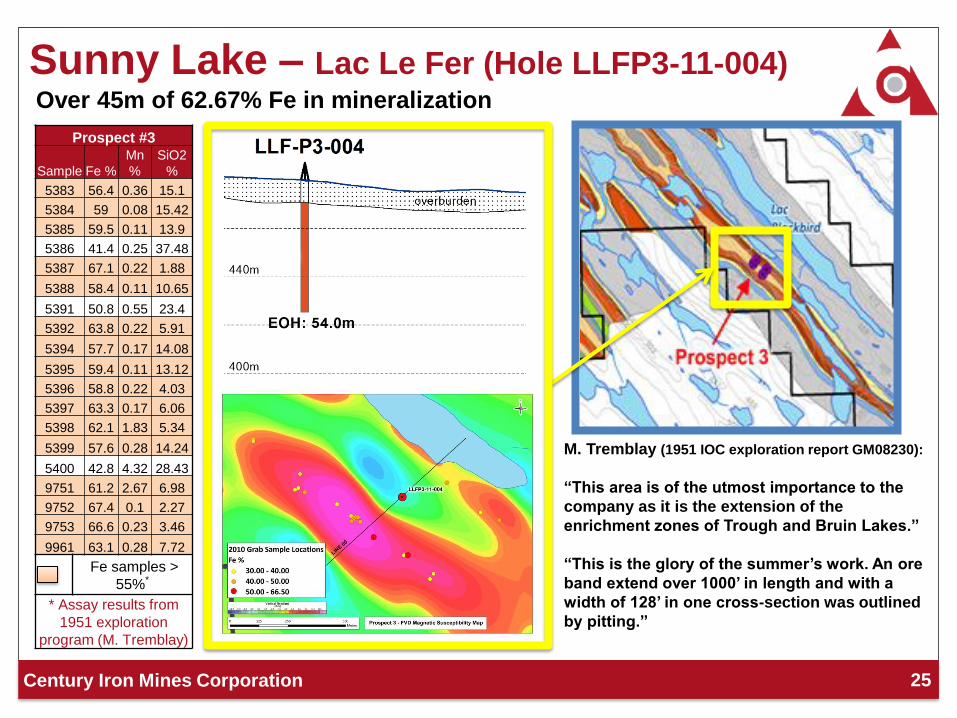
Sunny Lake – Lac Le Fer (Hole LLFP3-11-004)
Prospect #3
Sample Fe %
Mn
%
SiO2
%
5383 56.4 0.36 15.1
5384 59 0.08 15.42
5385 59.5 0.11 13.9
5386 41.4 0.25 37.48
5387 67.1 0.22 1.88
5388 58.4 0.11 10.65
5391 50.8 0.55 23.4
5392 63.8 0.22 5.91
5394 57.7 0.17 14.08
5395 59.4 0.11 13.12
5396 58.8 0.22 4.03
5397 63.3 0.17 6.06
5398 62.1 1.83 5.34
5399 57.6 0.28 14.24
5400 42.8 4.32 28.43
9751 61.2 2.67 6.98
9752 67.4 0.1 2.27
9753 66.6 0.23 3.46
9961 63.1 0.28 7.72
Fe samples >
55%*
* Assay results from
1951 exploration
program (M. Tremblay)
Over 45m of 62.67% Fe in mineralization
M. Tremblay (1951 IOC exploration report GM08230):
“This area is of the utmost importance to the
company as it is the extension of the
enrichment zones of Trough and Bruin Lakes.”
“This is the glory of the summer’s work. An ore
band extend over 1000’ in length and with a
width of 128’ in one cross-section was outlined
by pitting.”
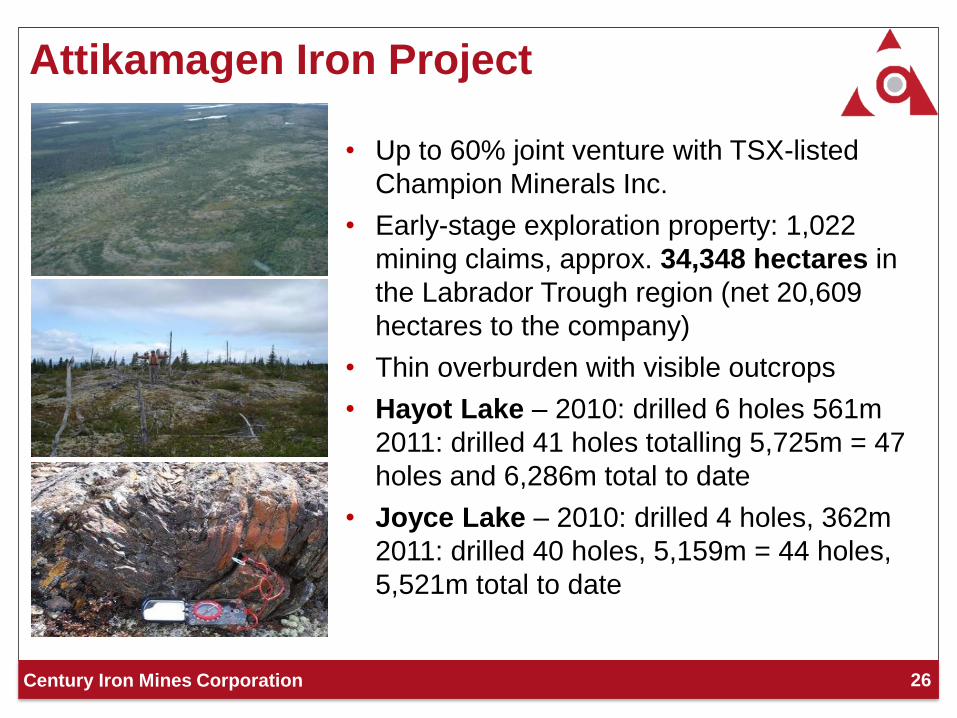
26 Century Iron Mines Corporation
• Up to 60% joint venture with TSX-listed
Champion Minerals Inc.
• Early-stage exploration property: 1,022
mining claims, approx. 34,348 hectares in
the Labrador Trough region (net 20,609
hectares to the company)
• Thin overburden with visible outcrops
• Hayot Lake – 2010: drilled 6 holes 561m
2011: drilled 41 holes totalling 5,725m = 47
holes and 6,286m total to date
• Joyce Lake – 2010: drilled 4 holes, 362m
2011: drilled 40 holes, 5,159m = 44 holes,
5,521m total to date
Attikamagen Iron Project

27 Century Iron Mines Corporation
Attikamagen – Joyce Lake Section
EXPLORATION UPDATE News release dated July 6, 2011 Selected Composite Assay results
Joyce Lake From To Core* Grade
Hole No. (m) (m) Length (m) FE%
JOY-11-06 3 142 139 52.80
includes 96 138 42 64.19
JOY-11-07 12 93 91 52.46
includes 12 54 42 65.26
JOY-11-09 2 126 123 46.64
includes 9 18 9 61.26
and 54 69 15 64.80
Total holes assayed: 4 * Core lengths are down whole length and not true widths of the
mineral zones.
News release dated December 8, 2011
Selected Composite Assay results Joyce Lake From To Core* Grade
Hole No. (m) (m) Length (m) FE%
JOY-11-10 3 123 120 42.63
includes 66 78 12 67.70
JOY-11-12 3 156 153 45.12
includes 129 156 27 60.15
JOY-11-14 3 63 60 45.68
includes 15 30 15 64.47
JOY-11-23 2 129 127 50.65
includes 48 81 33 61.15
and 102 114 12 66.28
Total holes assayed: 16

28 Century Iron Mines Corporation
Attikamagen – Hayot Lake Section
News release dated July 6, 2011 Selected Composite Assay results
Hayot Lake Core* Grade
Hole No. From (m) To (m) Length (m) FE%
HAY-10-06 11.8 104.4 92.6 31.59
HAY-10-07 71.2 163.1 91.9 32.34
HAY-10-08 12.8 109.5 96.7 32.46
HAY-10-09 102.0 232.0 130.0 31.55
HAY-10-10 86.7 197.6 110.9 32.30
Total holes assayed: 15
* Core lengths are down whole length and not true
widths of the minerals zones.
News release dated December 8, 2011 Selected Composite Assay results Hayot Lake Core* Grade
Hole No. From (m) To (m) Length
(m) FE%
HAY-10-16A 27.0 160.9 133.9 33.52
HAY-10-18 151.4 300.7 149.3 33.15
HAY-10-28A 19.9 149.0 129.1 32.16
HAY-10-30 8.0 137.0 129.0 32.98
HAY-10-32 3.0 161.0 158.0 31.17
Total holes assayed: 21
EXPLORATION UPDATE

Shipping From Canada to Asia
29 Century Iron Mines Corporation
Transportation – Iron Projects in Labrador Trough
Sept-Iles
Pointe-Noire
Port-Cartier
Ross Bay
Junction
Mont-Wright
Labrador City
Schefferville
Sunny Lake
Attikamagen
Railway Distance:
Schefferville to Ross Bay Junction: 217 km
Ross Bay Junction to Sept-Iles: 356 km
Labrador City to Ross Bay Jct: 58 km
Mont-Wright to Port Cartier: 400 km 0 50 100 km
Adriana
(WISCO)
• Existing Railway, in operation for
more than 50 years, is the
transportation facility for iron ore in
Eastern Québec and Labrador
• Major railways in operation include
QNSL and Cartier
• QNSL – Common Carrier, 573km
long, connecting Schefferville with
the Port of Sept-Iles
• The shortest route from
Attikamagen to Schefferville is
approximately 15km

30 Century Iron Mines Corporation
Port of Sept-Iles
• Located on the Gulf of St.
Lawrence
• Largest iron ore exporting port
in Canada - 25.1Mt in 2010
compared to 19.2Mt in 2009
• Port Zone consists of a 10 km
sheltered port zone, with a
natural ocean basin for ships
up to 400,000 dwt
• Main port is over 23.2 m in
depth
• Accommodates Capesize or
larger vessels
• Fully equipped, can be
operated year-round
• Mainly used by iron ore
companies in Québec and
Labrador.
Alumina
Plant
Multi user Berth
By Port of Sept Iles
• Natural shelters, deep water for
year round access by iron ore
ships
• Ability to expand as required
0 500 m
IOC Port

31 Century Iron Mines Corporation
Principal/Management Competence
• Successful business builders and value creators
• Resources of strategic partners WISCO/MinMetals available
Technical Competence
• WISCO/MinMetals, world-class operators in the business
Advanced Exploration and Development Funding
• Fully funded beyond BFS for most advanced project
• Fully funded to build out additional resources
Production Capital and Financing
• WISCO/MinMetals strategic partnership
• Successful capital market fundraising
Solid Fundamentals
32 Century Iron Mines Corporation
Century Iron Mines Corp.
Bob Leshchyshen
VP, Corporate Development and IR
(416) 977-3188 Ext. 109
CHF Investor Relations
Robin Cook
Senior Account Manager
(416) 868-1079 Ext. 228
Contact Information
33 Century Iron Mines Corporation
Appendix

0
20
40
60
80
100
120
140
160
180
200
Jan-8
2
Fe
b-8
3
Mar-
84
Apr-
85
Ma
y-8
6
Jun-8
7
Jul-88
Aug-8
9
Sep-9
0
Oct-
91
No
v-9
2
De
c-9
3
Jan-9
5
Fe
b-9
6
Mar-
97
Apr-
98
May-9
9
Jun-0
0
Jul-01
Aug-0
2
Sep-0
3
Oct-
04
No
v-0
5
De
c-0
6
Jan-0
8
Fe
b-0
9
Mar-
10
Apr-
11
US$
China CIF Iron Ore Fines 62%FE Spot Price in US$
34 Century Iron Mines Corporation
Spot Price of The Cheapest Base Metal: Iron Ore
The phenomenon of a base metal
with a fast growing demand side
of low industry concentration
against
a supply side of very high
industry concentration
Source: Index Mundi

0.0
50.0
100.0
150.0
200.0
250.0
31-Dec 31-Jan 29-Feb 31-Mar 30-Apr 31-May 30-Jun 31-Jul 31-Aug 30-Sep 31-Oct 30-Nov 31-Dec 31-Jan
62% FE CIF Spot Price in US$/t
FE 62% US$/t
US$/t
35 Century Iron Mines Corporation
• Sharp price drop, due to China’s tight liquidity policy and European debt crisis,
proved unsustainable
• Destocking, not market collapse
• Restocking- driven rebound
• Soft landing: Chinese fundamentals drive strong demand
Recent Iron Ore (62% Fe) Spot Price Trend
Source: Index Mundi

36 Century Iron Mines Corporation
Global Steel Production 2011 46% CHINA GROWTH STILL LEADS GLOBAL MARKET
Source: GFI, Century Iron Mines
2011 YoY% 2010 YoY% 2009
Total global crude steel production 1,490,060 7.56% 1,413,596 17.26% 1,219,715
China 683,265 9.03% 626,654 10.36% 567,842
Ex-China 806,795 2.52% 786,942 20.72% 651,873
European Union 177,431 2.62% 172,906 24.26% 139,143
Italy 26,603 11.31% 25,751 30.47% 19,737
Turkey 30,991 17.59% 29,002 14.61% 25,304
France 15,777 2.34% 15,416 20.10% 12,836
Germany 44,288 1.08% 43,815 34.11% 32,671
Ukraine 32,516 5.28% 33,559 12.78% 29,757
United States 79,197 7.01% 80,594 38.62% 58,142
Brazil 32,473 7.14% 32,820 23.82% 26,507
Iran 11,953 8.71% 11,995 10.32% 10,873
India 66,056 8.01% 66,848 18.09% 56,608
South Korea 62,496 17.14% 58,453 20.28% 48,598
Taiwan, China 20,351 15.37% 19,641 24.73% 15,747