centrifuge testing of multi block quay walls
TRANSCRIPT

SECED 2015 Conference: Earthquake Risk and Engineering towards a Resilient World 9-10 July 2015, Cambridge UK
CENTRIFUGE TESTING OF MULTI–BLOCK QUAY WALLS
Ioannis ANASTASOPOULOS1, Marianna LOLI2, Maria ANTONIOU3, Jonathan KNAPPETT4, and Andrew BRENNAN5
Abstract: Evidence from recent earthquakes has shown that quay walls are particularly vulnerable to seismic shaking. Being key components of commercial and passenger ports, their seismic damage may incur pronounced direct and indirect losses. To make things worse, the vast majority of ports in Europe’s high-seismicity areas (e.g., Greece, Italy), were designed and constructed several decades ago, according to obsolete seismic codes. Such quay walls are typically composed of multiple blocks, resting on top of each other without substantial shear connection. Although the seismic performance of modern single-block quay walls has been studied extensively, there is lack of knowledge on the response of existing quay walls. In a first attempt to tackle this problem, centrifuge model tests were conducted at the University of Dundee, using the Piraeus Port (Greece) as a case study. The paper presents the physical modelling approach and some first results of the centrifuge tests. Introduction Experience has shown that port facilities are particularly vulnerable to earthquakes. For example, the Industrial Container and Passenger Terminals of the Port of Kobe (Japan), have still not fully recovered from the indirect damage that was inflicted to it by the devastating 1995 Kobe Mw 7 earthquake. Today (20 years later), although the infrastructure has been fully restored (the direct damage is estimated to be of the order of $10 billion), the Port is still struggling to overcome the indirect damage it sustained (which exceeded $6 billion within only the first 9 months after the earthquake). Quay walls are particularly vulnerable to seismic loading. Such structures are key components of commercial and passenger ports and of waterfront industrial facilities and terminals and since the latter constitute a major part of the industrial chain, their seismic damage may have a significant impact on the economy of the affected region, in terms of direct and indirect losses. The seismic performance of single-block quay walls has been extensively studied analytically and experimentally. Analytical studies have focused on the developmentand exploitation of sophisticated effective-stress constitutive models, capable of simulating pore-pressure build-up, liquefaction, and lateral spreading [Iaiet al., 1998;Madabhushi & Zeng, 1998;Yang et al., 2001; Nozuet al., 2004;Berry& Madabhushi, 2007;Dakoulas&Gazetas, 2008; Alyamiet al., 2009]. A variety of experimental studies have been conducted, employing shaking table [Inagaki et al., 1996; Iai& Sugano, 2000] and centrifuge model testing [Zeng,1998; Lee, 2005]. The generation of excess pore pressures during seismic shaking has been shown to be a crucial factor. For example, Zeng [1998]showed that the generation of excess pore pressures in the surrounding soil leads to a complex behaviour that cannot be determined using conventional methods, such asthe Mononobe-Okabe [Okabe, 1926; Mononobe& Matsuo, 1929] and Richard & Elms [1979] methods, which are based on Coulomb’s limiting equilibrium method and Newmark’s sliding block concept, respectively. 1 Professor, University of Dundee, Dundee, UK, [email protected] 2 PhD Candidate, National Technical University of Athens, Athens, Greece, [email protected] 3Civil Engineer, MSc, University of Dundee, Dundee, UK, [email protected] 4Senior Lecturer, University of Dundee, Dundee, UK, [email protected] 5Senior Lecturer, University of Dundee, Dundee, UK, [email protected]

I. ANASTASOPOULOS, M. LOLI, M. ANTONIOU, J.A. KNAPPETT, A.J. BRENNAN
2
The effect of soil relative density and permeability has been found to play a crucial role in the dynamic performance of gravity quay walls. Yang et al. [2001] suggested that increasing the soil permeability around the wall improves its seismic performance. However, Dakoulas&Gazetas [2008]suggested that the increase of the relative density in the backfill rubble probably has a negative effect on the wall’s response. Although the lateral wall displacement and ground settlement of the backfill are reduced, the negative excess pore pressures (suction) tend to increase as the wall moves outwards. This is in accord with the earlier study of Lee [2005], whoconducted a series of centrifuge tests and recorded alternative negative and positive excess pore pressures in the backfill soil, with the negative values being significant for the lower permeability soils. This alternative ‘pumping and suction processes’ to the prevalence of lateral extension over lateral compression as the wall moves outwards. With respect to liquefaction phenomena, in most cases researchers suggested that the excess pore pressures generated in the vicinity of the quay wall remained in low levels, thus liquefaction was not induced near the structure [Inagaki et al., 1996; Iai& Sugano, 2000; Yang, 2001; Lee, 2005; Dakoulas&Gazetas, 2008]. This is attributed to the static shear stresses induced from the caisson weight to the foundation soil, leading it near to shear failure condition and permitting no further increase of excess pore pressures [Inagaki et al., 1996; Iaiet al., 1998; Iai& Sugano, 2000; Lee, 2005]. As with the current building stock, the vast majority of existing quay walls were designed and constructed several decades ago according to obsolete seismic codes.Typically composed of multiple blocks, such quay walls may be particularly vulnerable to strong seismic shaking. In contrast to single block quay walls, the performance of which has been studied extensively, there is a gap of knowledge on the seismic performance of multi-block quay walls.Pitilakis &Moutsakis [1989] studied numerically the performance of such a multi-block quay wall during the 1986 Kalamata MS 6.2 earthquake (Greece). However, the quay wall was simulated as a single block. Attempting to shed light onthis interesting system, an experimental study was conducted at the University of Dundee (UoD). This paper presents the physical modelling approach and some first results of the tests. Problem definition The present study is part of the ongoing research project“UPGRADE”, which aims at developing a robust methodology for systemic vulnerability assessment of existing port structures and facilities. The scope of the experiments is to gain insights on the seismic performance of such existing quay walls, and to provide the basis for model validation. A first such validation based on the tests presented herein can be found in Gerolymos et al. (2015). For this purpose, a multi-block quay wall of the port of Piraeus (Athens, Greece) is used as the prototype for the tests in terms of a case study. Twosets of centrifuge model tests were conducted, the first one modelling the existing quay wall, and the second one investigating the efficiency of retrofit measures, aiming to reduce the permanent displacements of the quay wall. This paper focuses on the first set of tests. As depicted in Fig. 1, the studied quay wall consists of 8 concrete blocks, placed on top of each other without any shear connection. The actual quay wall has a height of 17.4m, but because of restrictions related to the capacity of the centrifuge and the dimensions of the soil container, a slightly reduced (by roughly 20%) version was tested, having a total height of 13.86 m. The eight blocks differ from one another in terms of height and width, and the sea level is 2 m below the ground surface. Compared to single-block quay walls, such structures may develop additional modes of failure. The deformation pattern of a single-block quay wall involves seaward displacement, vertical settlement and rotation around the base. In the case of multi-block quay walls, the lack of shear connection between the concrete blocks may also lead to relative displacementsand rotations between the blocks. The latter can be detrimental, increasing the seismic vulnerability of the quay wall.

I. ANASTASOPOULOS, M. LOLI, M. ANTONIOU, J.A. KNAPPETT, A.J. BRENNAN
3
Figure 1. Geometry of the studied multi-block quay wall, Port of Piraeus (Athens, Greece)
Physical modelling approach A series of dynamic experiments on a scaled-down physical model of the quay wall were conducted using the UoDgeotechnical beam centrifuge and servo-hydraulic earthquake simulator. The centrifuge is an Actidyn C67-2 model, consisting of a 7m diameter rotating arm, equipped with a swinging platform that can carry a maximum payload of 1500 kg up to a maximum acceleration of 100 g. The earthquake simulator is an Actidyn Q67-2 mono-directional servo-hydraulic shaker with a payload capacity of 400kg, capable of reproducing a scaled earthquake motion within frequencies of 40 to 400Hz (0.4 to 4Hz prototype frequency at 100g or 0.8 to 8Hz at 50g). It is capable of simulating both artificial and real seismic motions of any waveform (Fig. 2). In order to be within the frequency range of the earthquake simulator, the original seismic motions need to be band pass filtered. Then, a preliminary centrifuge test is carried out using a “dummy” physical model, in order to calibrate the motions and allow the repeatable and accurate reproduction of each one.
Figure 2. Photo of the UoD centrifuge-mounted earthquake simulator.
67 [4.02]
28 [1.68]
41 [2.46]
6 [0.36]
12 [0.72]
14 [0.84]
29 [1.74]
29 [1.74]
25 [1.5]
25 [1.5]
33 [1.98]
27 [1.62]
100 [6]
20 [1.2]
20 [1.2]
120 [7.2]
231[13.86]
198[11.88]
67[4.02]
27 [1.62]
Dense SandDr ≈ 80 %
Scale 1:60Dimensions: mm / [m]Model [Prototype]
I. ANASTASOPOULOS, M. LOLI, M. ANTONIOU, J.A. KNAPPETT, A.J. BRENNAN
4
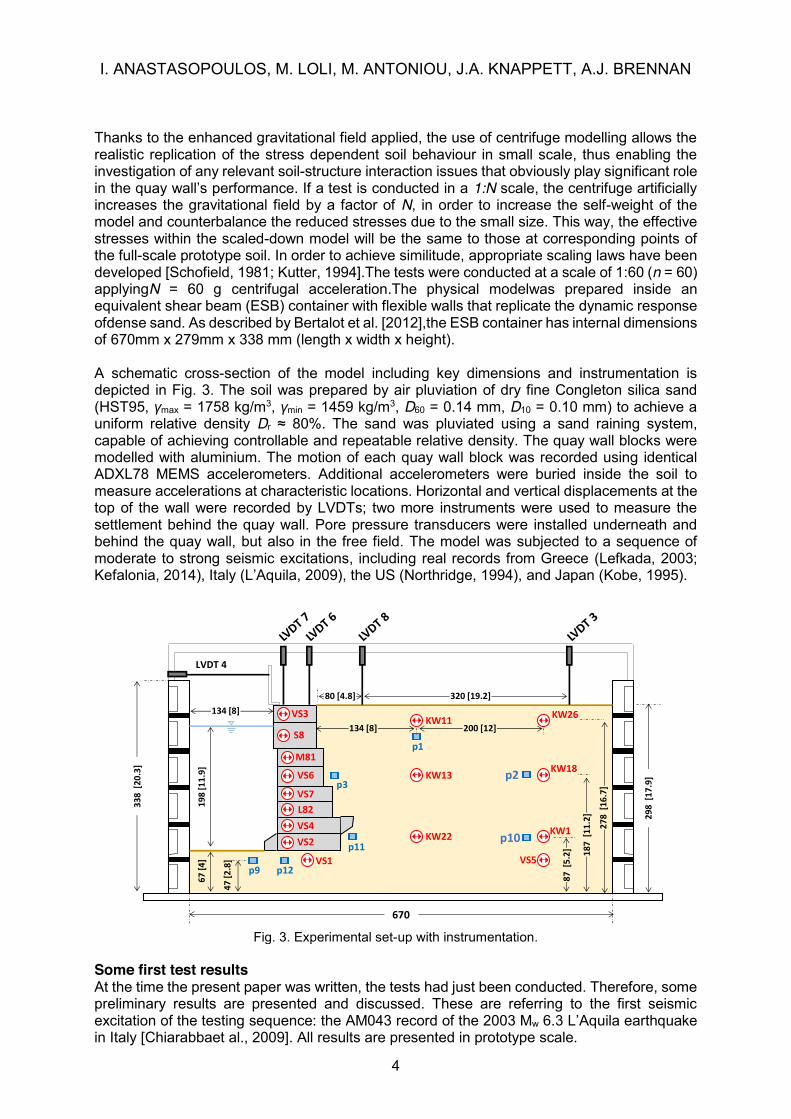
Thanks to the enhanced gravitational field applied, the use of centrifuge modelling allows the realistic replication of the stress dependent soil behaviour in small scale, thus enabling the investigation of any relevant soil-structure interaction issues that obviously play significant role in the quay wall’s performance. If a test is conducted in a 1:N scale, the centrifuge artificially increases the gravitational field by a factor of N, in order to increase the self-weight of the model and counterbalance the reduced stresses due to the small size. This way, the effective stresses within the scaled-down model will be the same to those at corresponding points of the full-scale prototype soil. In order to achieve similitude, appropriate scaling laws have been developed [Schofield, 1981; Kutter, 1994].The tests were conducted at a scale of 1:60 (n = 60) applyingN = 60 g centrifugal acceleration.The physical modelwas prepared inside an equivalent shear beam (ESB) container with flexible walls that replicate the dynamic response ofdense sand. As described by Bertalot et al. [2012],the ESB container has internal dimensions of 670mm x 279mm x 338 mm (length x width x height). A schematic cross-section of the model including key dimensions and instrumentation is depicted in Fig. 3. The soil was prepared by air pluviation of dry fine Congleton silica sand (HST95, γmax = 1758 kg/m3, γmin = 1459 kg/m3, D60 = 0.14 mm, D10 = 0.10 mm) to achieve a uniform relative density Dr ≈ 80%. The sand was pluviated using a sand raining system, capable of achieving controllable and repeatable relative density. The quay wall blocks were modelled with aluminium. The motion of each quay wall block was recorded using identical ADXL78 MEMS accelerometers. Additional accelerometers were buried inside the soil to measure accelerations at characteristic locations. Horizontal and vertical displacements at the top of the wall were recorded by LVDTs; two more instruments were used to measure the settlement behind the quay wall. Pore pressure transducers were installed underneath and behind the quay wall, but also in the free field. The model was subjected to a sequence of moderate to strong seismic excitations, including real records from Greece (Lefkada, 2003; Kefalonia, 2014), Italy (L’Aquila, 2009), the US (Northridge, 1994), and Japan (Kobe, 1995).
Fig. 3. Experimental set-up with instrumentation.
Some first test results At the time the present paper was written, the tests had just been conducted. Therefore, some preliminary results are presented and discussed. These are referring to the first seismic excitation of the testing sequence: the AM043 record of the 2003 Mw 6.3 L’Aquila earthquake in Italy [Chiarabbaet al., 2009]. All results are presented in prototype scale.
670
338
[20.
3]
298
[17.
9]
67 [4
]
47 [2
.8]
87 [
5.2] 18
7 [1
1.2]
278
[16.
7]
198
[11.
9]
134 [8]
134 [8] 200 [12]
80 [4.8] 320 [19.2]
VS3
S8
M81
VS6
VS7L82VS4VS2
VS1
KW18
KW11
KW13
KW22
KW26
VS5
KW1
p9
p2
p12
p11
p3
p1
p10
LVDT 4

I. ANASTASOPOULOS, M. LOLI, M. ANTONIOU, J.A. KNAPPETT, A.J. BRENNAN
5
The acceleration time histories at the eight blocks of the quay wall are presented in Fig. 4, along with a plot showing the distribution of peak acceleration with depth. The recorded motions were low-pass filtered at 10 Hz. As it would be expected, and as revealed by the distribution of the peak acceleration values with depth, the soil amplifies the seismic motion. In terms of peak values, an amplification factor of the order of 2 is observed. Figure 5 compares the acceleration time histories of the quay wall to the backfill and the (quasi) free-field soil at three characteristic depths. At the top of the quay wall (Fig. 5a), there is a substantial difference between the acceleration of the top block of the quay and that of the soil. The quay wall acceleration is definitely amplified, but the phase difference is rather small. Moving downwards, the differences are becoming progressively smaller (Figs. 5b, 5c). In all cases, there is no substantial difference between the backfill soil and the free-field. However, it should be noted that the ESB container boundary is not as far as it would be desired (an unavoidable compromise) and hence free field conditions are not fully achieved.
Fig. 4. Acceleration time histories recorded at the blocks of the quay wall, along with the distribution
of the corresponding maximum values (top).
VS3
S8
M81
VS6
VS7
L82
VS4
VS2
Peak Acceleration (g)
0
50
100
150
200
0 0.2 0.4
-0.4
-0.2
0
0.2
-0.342
a :
g
LAquilaAccelerations
VS3
-0.4
-0.2
0
0.2
-0.28
a :
g
S8
-0.4
-0.2
0
0.2
-0.224
a :
g
M81
-0.4
-0.2
0
0.2
-0.197
a :
g
VS6
-0.4
-0.2
0
0.2
-0.163
a :
g
VS7
-0.4
-0.2
0
0.2
-0.144
a :
g
L82
0 5 10 15 20-0.4
-0.2
0
0.2
-0.154
t : sec
a :
g
VS4
0 5 10 15 20-0.4
-0.2
0
0.2
-0.167
t : sec
a :
g
VS2
-0.4
-0.2
0
0.2
-0.342
a :
g
LAquilaAccelerations
VS3
-0.4
-0.2
0
0.2
-0.28
a :
g
S8
-0.4
-0.2
0
0.2
-0.224
a :
g
M81
-0.4
-0.2
0
0.2
-0.197
a :
g
VS6
-0.4
-0.2
0
0.2
-0.163
a :
g
VS7
-0.4
-0.2
0
0.2
-0.144
a :
g
L82
0 5 10 15 20-0.4
-0.2
0
0.2
-0.154
t : sec
a :
g
VS4
0 5 10 15 20-0.4
-0.2
0
0.2
-0.167
t : sec
a :
g
VS2

I. ANASTASOPOULOS, M. LOLI, M. ANTONIOU, J.A. KNAPPETT, A.J. BRENNAN
6
Fig. 5. Acceleration time histories at three characteristic depths: (a) at the top of the quay wall; (b) at
mid-height; and (c) at the bottom of the quay wall. Figure 6 illustrates the recorded displacement, settlement, and rotation time histories. During the seismic excitation, the quay wall accumulates 0.24 m of lateral displacement, which corresponds to 1.7% of its height (Fig. 6a): a non-negligible amount of deformation considering the intensity of the seismic excitation. As shown in Fig. 6b, the quay wall settlement reaches 0.04 m, which is almost twice the settlement of the free field soil (FF). The latter is due to the lateral movement of the wall and some limited dynamic compaction of the Dr≈ 80% sand. Quite interestingly, the settlement of the backfill soil (BF): 0.09 m. This pronounced increase of the settlement is attributed to the movement of the active soil wedge, which tends to follow the outward displacement of the quay wall. It is important to observe that the displacement at the top of the quay wall is mainly due to its lateral movement (sliding) and not rotation. The latter (Fig. 6c) does not exceed 0.4 degrees, and its residual value is almost half as much: 0.2 degrees. Comparing the time histories of lateral displacement and rotation, it may be concluded that the response of the wall is distinctly different in terms of swaying and rocking. While rocking-related displacement is recoverable to some extent, the same is not true for the swaying-related outward displacement of the wall. The lateral displacement is partly due to sliding displacement of the wall as a rigid body, and partly due to sliding displacements between the successive blocks of the quay wall. Although it was not possible to measure the relative displacement between the blocks (the LVDTs would have to be submerged), this was confirmed after the end of the testing sequence. In terms of performance assessment, the measured values are indicative of the vulnerability of such quay walls even for a seismic excitation of moderate intensity.
VS3
VS2VS1
KW18
KW11
KW13
KW22
KW26
VS5
KW1
VS6
-0.4
-0.2
0
0.2
a :
g
LAquilaAccelerations
VS3KW11KW26
-0.4
-0.2
0
0.2
a :
g
VS6KW13KW18
-0.4
-0.2
0
0.2
a :
g
VS2KW22KW1
0 2 4 6 8 10 12 14 16 18 20-0.4
-0.2
0
0.2
t : sec
a :
g
ExitationVS1VS5
-0.4
-0.2
0
0.2
a :
g
LAquilaAccelerations
VS3KW11KW26
-0.4
-0.2
0
0.2
a :
g
VS6KW13KW18
-0.4
-0.2
0
0.2
a :
g
VS2KW22KW1
0 2 4 6 8 10 12 14 16 18 20-0.4
-0.2
0
0.2
t : sec
a :
g
ExitationVS1VS5
-0.4
-0.2
0
0.2
a :
g
LAquilaAccelerations
VS3KW11KW26
-0.4
-0.2
0
0.2
a :
g
VS6KW13KW18
-0.4
-0.2
0
0.2
a :
g
VS2KW22KW1
0 2 4 6 8 10 12 14 16 18 20-0.4
-0.2
0
0.2
t : sec
a :
g
ExitationVS1VS5
-0.4
-0.2
0
0.2
a :
g
LAquilaAccelerations
VS3KW11KW26
-0.4
-0.2
0
0.2
a :
g
VS6KW13KW18
-0.4
-0.2
0
0.2
a :
g
VS2KW22KW1
0 2 4 6 8 10 12 14 16 18 20-0.4
-0.2
0
0.2
t : sec
a :
g
ExitationVS1VS5
(a)
(b)
(c)
(a)
(b)
(c)

I. ANASTASOPOULOS, M. LOLI, M. ANTONIOU, J.A. KNAPPETT, A.J. BRENNAN
7
Fig. 6. Time histories of: (a) horizontal displacement of the top block of the quay wall top block; (b) settlement of the quay wall (with reference to the middle of the top block), compared to the backfill
soil (LVDT 8) and the free field (LVDT 3); and (c) quay wall rotation. The recorded excess pore water pressure time histories are summarized in Fig. 7. At this point, it should be noted that the experiments were conducted using plain water and not a methylcellulose-water mixture. This was a deliberate decision in order to more realistically simulate the permeability of the rubble backfill material, despite the fact that the soil was modelled with sand. Unfortunately, PPT10 failed during the test and hence there is no free field measurement at 10.7 m depth. At 4.7 m depth (PPT2), a limited amount of excess pore water pressure can be observed. Behind the wall (PPT3 and PPT11), negative excess pore water pressures are measured implying suction due to the outward movement of the quay wall. This observation is in full accord with earlier experimental and numerical studies Lee, 2005; Dakoulas&Gazetas, 2008]. At the toe of the quay wall (PPT9 and PPT12), positive excess pore water pressures are recorded, which are attributed to the outward rotation and the settlement of the quay wall. Due to the large permeability of the soil, the developing excess pore water pressures are very far from leading to liquefaction.
-0.1
0
0.1
0.2
0.3
u :
m
LAquilaWall Displacements
-0.1
-0.08
-0.06
-0.04
-0.02
0
0.02
w :
m
BFFFWALL
0 2 4 6 8 10 12 14 16 18 20-0.1
0
0.1
0.2
0.3
0.4
thet
a :
deg
t : sec
(a)
(b)
(c)
0.24 m
0.04 m
0.25°

I. ANASTASOPOULOS, M. LOLI, M. ANTONIOU, J.A. KNAPPETT, A.J. BRENNAN
8
Fig. 7. Excess pore pressurestime histories at characteristic model locations.
Conclusions The paper has presented some preliminary experimental results on the seismic performance of multi-block quay-walls. Centrifuge model tests were conducted at the beam centrifuge of the University of Dundee, employing a centrifuge-mounted seismic simulator. An actual multi-block quay wall of the port of Piraeus (Athens, Greece) was used as the conceptual prototype, being subjected to seismic excitations of varying intensity. The results confirm the seismic vulnerability of such quay walls, indicating that the seaward displacement may reach 1.7% of the wall height (0.24 m) even for moderate seismic shaking, such as the one reported herein. The settlement of the wall and especially of the backfill soil is also not negligible (0.09 m), having implications for the post-seismic serviceability of adjacent utilities, such as cranes and pipelines. Most of the observed displacement is due to sliding displacement of the wall as a
9
2
12
11
3
1
10
(-0.78 m)
(-4.7 m)
(-10.7 m)
(-13.1 m)
-2
0
2
4
u
: k
Pa
LAquilaPore Pressures
PPT 1
-20
-10
0
10
u
: k
Pa
PPT 2PPT 3
-10
-5
0
5
u
: k
Pa
PPT 11
0 2 4 6 8 10 12 14 16 18 20-5
0
5
10
u
: k
Pa
t : sec
PPT 9PPT 12
-2
0
2
4
u
: k
Pa
LAquilaPore Pressures
PPT 1
-20
-10
0
10
u
: k
Pa
PPT 2PPT 3
-10
-5
0
5
u
: k
Pa
PPT 11
0 2 4 6 8 10 12 14 16 18 20-5
0
5
10
u
: k
Pa
t : sec
PPT 9PPT 12
-2
0
2
4
u
: k
Pa
LAquilaPore Pressures
PPT 1
-20
-10
0
10
u
: k
Pa
PPT 2PPT 3
-10
-5
0
5
u
: k
Pa
PPT 11
0 2 4 6 8 10 12 14 16 18 20-5
0
5
10
u
: k
Pa
t : sec
PPT 9PPT 12
-2
0
2
4
u
: k
Pa
LAquilaPore Pressures
PPT 1
-20
-10
0
10
u
: k
Pa
PPT 2PPT 3
-10
-5
0
5
u
: k
Pa
PPT 11
0 2 4 6 8 10 12 14 16 18 20-5
0
5
10
u
: k
Pa
t : sec
PPT 9PPT 12

I. ANASTASOPOULOS, M. LOLI, M. ANTONIOU, J.A. KNAPPETT, A.J. BRENNAN
9
rigid body, and between successive blocks. The observed rotation was not as intense, with its permanent value not exceeding 0.25 degrees. The recorded excess pore water pressure behind the wall were shown to be negative, implying suction due to the outward movement of the quay wall and confirming the findings of previous studies [Lee, 2005; Dakoulas&Gazetas, 2008]. At the toe of the quay wall (PPT9 and PPT12), positive excess pore water pressures were recorded, being in line with the outward rotation and settlement of the quay wall. Acknowledgement This research has been funded by the research program THALES, co-‐‑financed by the European Union (European Social Fund – ESF) and Greek national funds through the Operational Program "Education and Lifelong Learning" of the National Strategic Reference Framework (NSRF). Project ID "UPGRADE. REFERENCES Alyami M, Rouainia M, Wilkinson SM (2009) Numerical analysis of deformation behaviour of quay walls under earthquake loading,Soil Dynamics and Earthquake Engineering, 29(3): 525-536.
Berry AG, Madabhushi SPG (2007) Modelling of waterfront cantilever sheet pile walls subjected to earthquake loading, Geomechanics and Geoengineering, 2 (3): 207-218.
Bertalot D, Brennan AJ, Knappett JA, Muir Wood D, Villalobos FA(2012) Use of centrifuge modelling to improve lessons learned from earthquake case histories, Proc. 2ndEuropean conference on Physical Modelling in Geotechnics, Eurofuge 2012 (pp. 23-24).
Chiarabba C et al. (2009) The 2009 L'Aquila (central Italy) MW 6.3 earthquake: Main shock and aftershocks, Geophysical Research Letters, 36: L18308.
Dakoulas P and Gazetas G(2008) Insight into seismic earth and water pressures against caisson quay walls,Géotechnique, 58 (2), pp. 95-111.
Iai S, Ichii K, Liu H. and Morita T. (1998) Effective stress analyses of port structures,Soils and Foundations, Special Issue, 97-114.
Iai S. and Sugano T(2000) Shake table testing on seismic performance of gravity quay walls,Proc. 12th World Conference of Earthquake Engineering. Inagaki H, Iai S, Sugano T, Yamazaki H, and Inatomi T (1996) Performance of caisson type quay walls at Kobe Port,Soils and Foundations, Special Issue, pp. 119-136.
Kutter BL (1995) Recent advances in centrifuge modeling of seismic shaking, Proc. 3rd Int. Conf. on Recent Advances in Geotechnical Earthquake Engineering and Soil Dynamics, April 2-7, St. Louis, MI.
Lee CJ (2005) Centrifuge modelling of the behaviour of caisson-type quay walls during earthquakes,Soil dynamics and earthquake engineering, 25 (2): 117-131.
Madabhushi SPG, Zeng X (1998) Seismic response or gravity quay walls. II: Numerical modelling, Journal of Geotechnical and Geoenvironmental Engineering, ASCE, 124 (5): 418-427.
Mononobe N, Matsuo H (1929)On the determination of earth pressures during earthquakes,Proc. World Engineering Congress, 9: 179-187.
Nozu A, Ichii K, and Sugano T (2004) Seismic design of port structures,Journal of Japan Association for Earthquake Engineering, 4 (3):195-208.
Okabe S (1926) General theory of earth pressure,Journal of the Japanese Society of Civil Engineers, 12(1): 311.
Pitilakis K, and Moutsakis A (1989) Seismic analysis and behaviour of gravity retaining walls: The case of Kalamata harbour quay wall,Soils and foundations, 29(1): 1-17.
Richards R, Elms DG (1979) Seismic behavior of gravity retaining walls,Journal of the Geotechnical Engineering Division, 105(4), 449-464.
Schofield AN (1980) Cambridge geotechnical centrifuge operations, Géotechnique, 30(3): 227-268.

I. ANASTASOPOULOS, M. LOLI, M. ANTONIOU, J.A. KNAPPETT, A.J. BRENNAN
10
Gerolymos N, Tasiopoulou P, and Gazetas G (2015) Seismic performance of block-type gravity quay-wall: numerical modelling versus centrifuge experiment, SECED 2015 Conference: Earthquake Risk and Engineering towards a Resilient World, 9-10 July, Cambridge UK (submitted).
Yang Z, Elgamal A, Abdoun T, and Lee CJ (2001) A numerical study of lateral spreading behind a caisson-type quay wall, Proc. 4th Int. Conf. on Earthquake Geotechnical Engineering, San Diego, CA.
Zeng X (1998) Seismic response of gravity quay walls. I: Centrifuge modelling,Journal of Geotechnical and Geoenvironmental engineering, 124(5): 406-417.