centrifuge model test on the face stability of shallow...
TRANSCRIPT
RESEARCH PAPER
Centrifuge model test on the face stability of shallow tunnel
Gregor Idinger • Pelin Aklik • Wei Wu •
Ronaldo I. Borja
Received: 11 October 2010 / Accepted: 18 May 2011 / Published online: 22 June 2011
� Springer-Verlag 2011
Abstract This paper is an investigation of face stability on
a small-scale tunnel model in a geotechnical centrifuge. By
making use of symmetry, half of the tunnel cross section was
considered. The support at excavation face was provided by a
piston, which was adjusted during flight. Some aspects on the
collapse at tunnel face are investigated for different over-
burden pressures: failure mechanism, surface settlement,
stress acting at tunnel face, and the required face support
counteracting the earth pressure. Ground deformation was
observed through a transparent wall and measured by digital
image correlation. The results from centrifuge model tests
were compared with theoretical models.
Keywords Centrifuge modeling � Digital image
correlation � Face stability � Shallow tunnel
1 Introduction
As urban expansion increases and available land decreases,
new transportation and service networks need to be placed
underground. For easier access, in many cases, tunnels are
constructed at shallow depth and in the immediate vicinity
of existing infrastructure (e.g., foundations). Hence, tun-
nels in urban regions are often constructed in soft ground
conditions. The inherent problem associated with under-
ground construction in soft ground is that underground
excavation alters the stress field in the surrounding mate-
rial. Soil strata cannot bear superimposed loads, and thus,
ground deformation occurs. Most susceptible to collapse is
the tunnel face, which can result in a chimney-shaped
failure [9]. Usually, failure initiates near tunnel face and
propagates toward ground surface until either a stabilizing
arch is formed, or it reaches ground surface causing cave-
in. The latter is severe for shallow constructions. In urban
regions, even small surface settlement can cause damage to
surface buildings.
Shallow tunnels in soft ground are usually driven by shield
tunnel boring machine (TBM). Different techniques for face
support have been developed, including EPB (Earth Pressure
Balance) shield and slurry shield. They have something in
common in that support is applied by a pressurized medium.
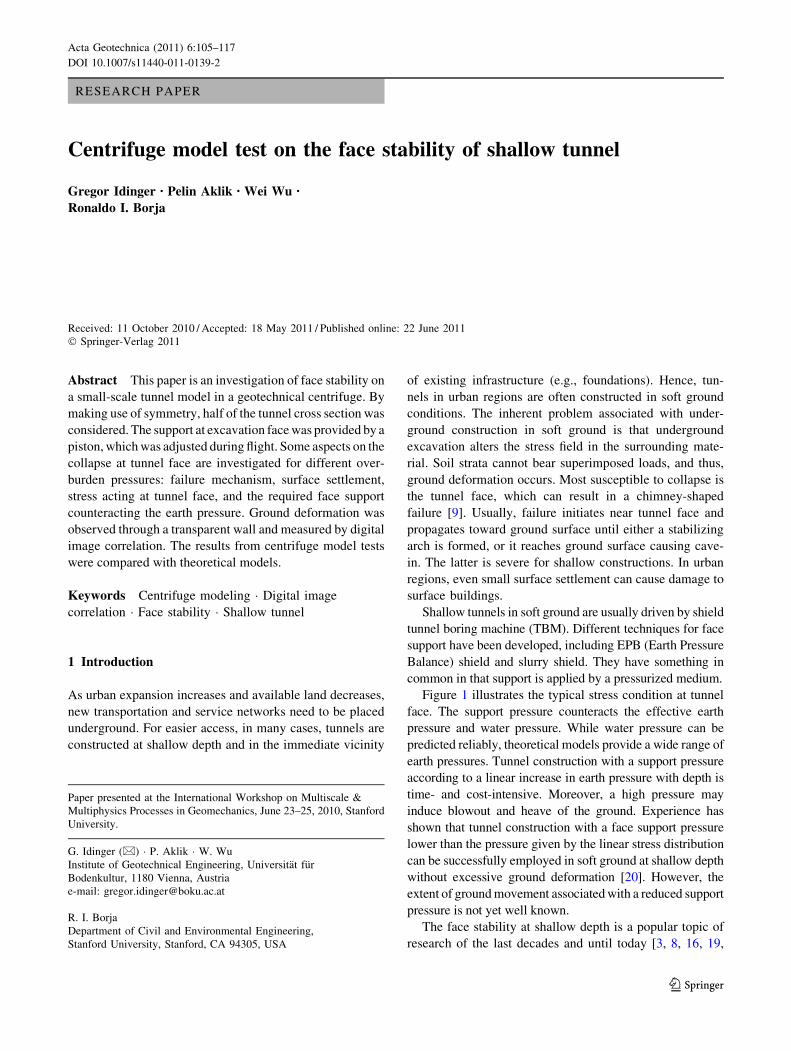
Figure 1 illustrates the typical stress condition at tunnel
face. The support pressure counteracts the effective earth
pressure and water pressure. While water pressure can be
predicted reliably, theoretical models provide a wide range of
earth pressures. Tunnel construction with a support pressure
according to a linear increase in earth pressure with depth is
time- and cost-intensive. Moreover, a high pressure may
induce blowout and heave of the ground. Experience has
shown that tunnel construction with a face support pressure
lower than the pressure given by the linear stress distribution
can be successfully employed in soft ground at shallow depth
without excessive ground deformation [20]. However, the
extent of ground movement associated with a reduced support
pressure is not yet well known.
The face stability at shallow depth is a popular topic of
research of the last decades and until today [3, 8, 16, 19,
Paper presented at the International Workshop on Multiscale &
Multiphysics Processes in Geomechanics, June 23–25, 2010, Stanford
University.
G. Idinger (&) � P. Aklik � W. Wu
Institute of Geotechnical Engineering, Universitat fur
Bodenkultur, 1180 Vienna, Austria
e-mail: [email protected]
R. I. Borja
Department of Civil and Environmental Engineering,
Stanford University, Stanford, CA 94305, USA
123
Acta Geotechnica (2011) 6:105–117
DOI 10.1007/s11440-011-0139-2
21, 23, 26, 27, 35]. Among others, Leca and Dormieux [15]
proposed a failure criterion for the tunnel face in cohesive
and frictional soil. Chambon and Corte [5, 6] reported on
centrifuge model tests where the support pressure for face
stability was measured. Despite the wide choice of pro-
posed models, only a few of them have been applied in
tunnel projects (e.g., Horn [9], Leca and Dormieux [15],
Anagnostou and Kovari [1, 2]). Only limited evidence for
their quality exists. Driving a shallow tunnel is still mainly
based on experience, since experimental data are rare and
well-documented projects involving collapse are barely
available.
To further assess the capability of theoretical models,
centrifuge tests were performed on a small-scale model in
dry sand. The influence of the overburden was examined
for three overburden-to-diameter ratios C/D, at 1.5, 1.0,
and 0.5. Collapse at tunnel face was induced in a dis-
placement-controlled manner by pulling a plate, which
provided the support, back into the tunnel. The prefailure
behavior and ground movement during failure were
recorded and analyzed by digital image correlation. The
extent of failure mechanism and surface settlement was
investigated, and the pressure at failure was measured.
Finally, an attempt to identify the depth at which a silo
effect emerges was made.
2 Centrifuge model
2.1 Centrifuge technique and scaling laws
The centrifuge technique was established in the early 1930s
by Philip B. Bucky [4, 17], who tested the geomechanical
behavior of a small-scale model under increased stress,
examining failure mechanism relating to the ultimate limit
state. In recent years, with new detailed and continuous
deformation measurement systems, the centrifuge technique
has been adopted increasingly for studying prefailure defor-
mation. Physical model tests in the centrifugal field allow for
well-controlled laboratory conditions, which is relevant for
conducting parametric studies and investigating failure
mechanisms. Observations from the small-scale model are
related to the prototype using well-established scaling laws
(Table 1). Centrifuge model tests have been shown to be
valuable in revealing mechanisms of soil deformation and
collapse, as well as for validating numerical models [29].
The mechanics of tunnel face instability is a gravity-
dependent phenomenon. Strength and stiffness of a soil
vary with the applied stress (i.e., influence of depth). While
large-scale models represent true soil response, they are
expensive to perform. On the other hand, a small-scale
model at 1 g is less expensive, well controllable, highly
instrumented, and easier to perform in series. Yet, these
experiments do not fully represent correct prototype
behavior, since the stress level is much lower than in the
field. In order to simulate a correct prototype situation in
the laboratory, it is crucial to replicate the in situ soil stress
field properly.
In a centrifuge, the small-scale model is subjected to an
acceleration field n times greater than earth’s gravity
acceleration constant, g. Thus, each soil particle in the
model weights n times more. As a result, the gradient of
body stress within the small-scale model will now be
similar to the prototype n times larger, ensuring similarity
of effective stress at equivalent depth in model and pro-
totype. This implies that a 1/n scale model will behave like
its full-scale prototype if subjected to a centrifugal accel-
eration of n times g. Thus, gravity-dependant processes are
correctly reproduced. Stress and strain in the prototype soil
mass are preserved, and the strain–stress curve of the
model is identical to one of the prototype.
Scaling laws are essential in order to transfer measured
data from the small-scale model to the prototype. In the
Fig. 1 Sketch of simplified stress condition at excavation face: face
support pressure, p, balancing the horizontal earth pressure ensuring
stability at excavation face (linear increase in earth pressure assumed)
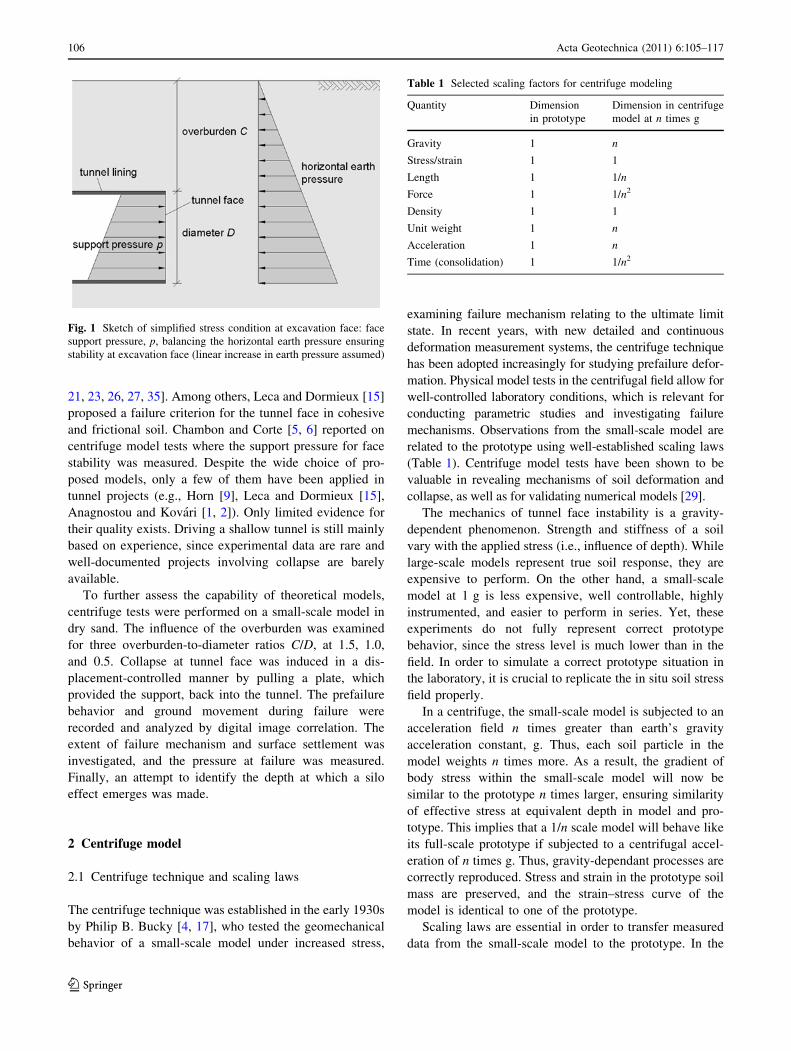
Table 1 Selected scaling factors for centrifuge modeling
Quantity Dimension
in prototype
Dimension in centrifuge
model at n times g
Gravity 1 n
Stress/strain 1 1
Length 1 1/n
Force 1 1/n2
Density 1 1
Unit weight 1 n
Acceleration 1 n
Time (consolidation) 1 1/n2
106 Acta Geotechnica (2011) 6:105–117
123
prototype, vertical stress, rvp, acting in a material of den-
sity, q, at depth hp is given by
rvp ¼ qghp; ð1aÞ
while the vertical stress in the model, rvm, at depth hm in
the same material within the gravity field of n times g in the
centrifuge is given by
rvm ¼ qnghm ð1bÞ
As explained earlier, the basic scaling law is derived from
stress similarity between the model and prototype. Thus,
for rvm = rvp, the depth hm is scaled by hm = hp/n. The
obtained scaling factor for length (i.e., distance, displace-
ment) is 1/n. Table 1 presents a selection of scaling factors.
2.2 Issues of centrifuge technique
In a modeling process on reduced scale, it is generally
rarely possible to replicate all details from the prototype.
Thus, some approximations have to be made (e.g., sim-
plified geometry). It is important to recognize that model
studies are not perfect and to be aware of its limitation.
Additional model imprecision can result from the centri-
fuge technique. Shortcomings, often referred as scaling
effects, are evaluated in this section.
First of all, in civil engineering, the earth’s gravity, g, is
simplified as being constant.1 However, the acceleration
field generated in a centrifuge slightly differs from the
prototype gravitational field because the acceleration force,
a, is proportional to the radius
a ¼ ng ¼ x2r ð2Þ
where x is the angular velocity and r is the radius to the
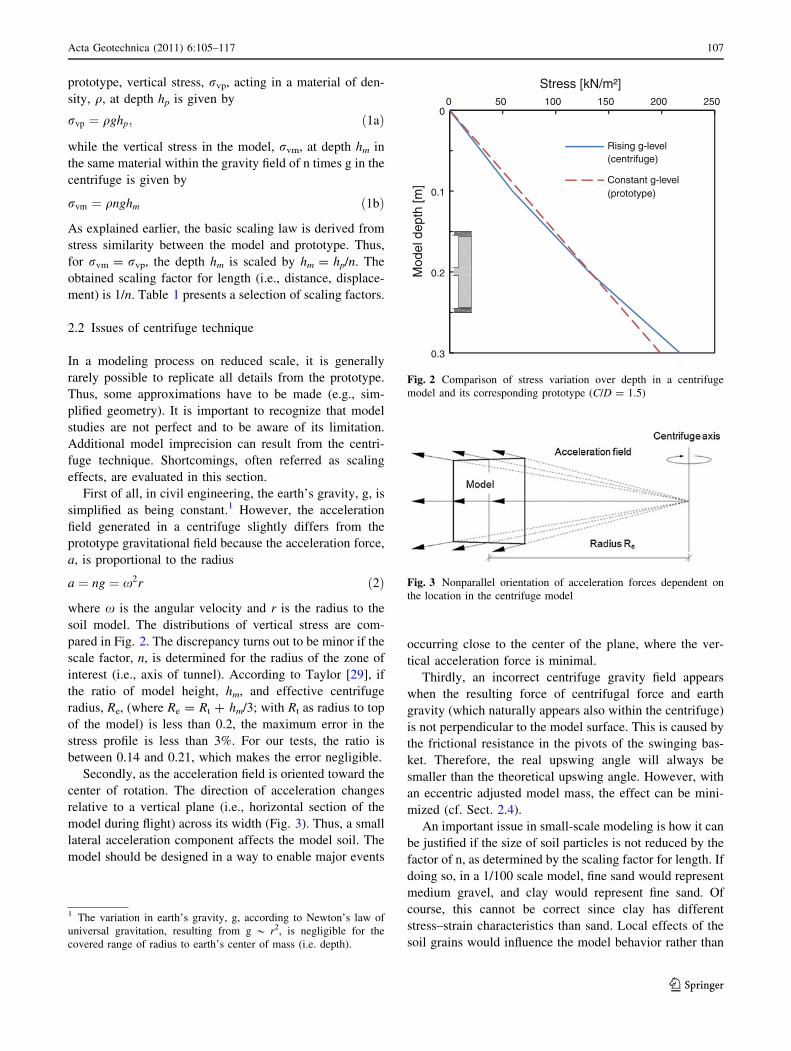
soil model. The distributions of vertical stress are com-
pared in Fig. 2. The discrepancy turns out to be minor if the
scale factor, n, is determined for the radius of the zone of
interest (i.e., axis of tunnel). According to Taylor [29], if
the ratio of model height, hm, and effective centrifuge
radius, Re, (where Re = Rt ? hm/3; with Rt as radius to top
of the model) is less than 0.2, the maximum error in the
stress profile is less than 3%. For our tests, the ratio is
between 0.14 and 0.21, which makes the error negligible.
Secondly, as the acceleration field is oriented toward the
center of rotation. The direction of acceleration changes
relative to a vertical plane (i.e., horizontal section of the
model during flight) across its width (Fig. 3). Thus, a small
lateral acceleration component affects the model soil. The
model should be designed in a way to enable major events
occurring close to the center of the plane, where the ver-
tical acceleration force is minimal.
Thirdly, an incorrect centrifuge gravity field appears
when the resulting force of centrifugal force and earth
gravity (which naturally appears also within the centrifuge)
is not perpendicular to the model surface. This is caused by
the frictional resistance in the pivots of the swinging bas-
ket. Therefore, the real upswing angle will always be
smaller than the theoretical upswing angle. However, with
an eccentric adjusted model mass, the effect can be mini-
mized (cf. Sect. 2.4).
An important issue in small-scale modeling is how it can
be justified if the size of soil particles is not reduced by the
factor of n, as determined by the scaling factor for length. If
doing so, in a 1/100 scale model, fine sand would represent
medium gravel, and clay would represent fine sand. Of
course, this cannot be correct since clay has different
stress–strain characteristics than sand. Local effects of the
soil grains would influence the model behavior rather than
0
0.1
0.2
0.3
0 50 100 150 200 250
Mod
el d
epth
[m]
Stress [kN/m²]
Rising g-level (centrifuge)
Constant g-level (prototype)
Fig. 2 Comparison of stress variation over depth in a centrifuge
model and its corresponding prototype (C/D = 1.5)
Fig. 3 Nonparallel orientation of acceleration forces dependent on
the location in the centrifuge model
1 The variation in earth’s gravity, g, according to Newton’s law of
universal gravitation, resulting from g * r2, is negligible for the
covered range of radius to earth’s center of mass (i.e. depth).
Acta Geotechnica (2011) 6:105–117 107
123

the soil appearing as a continuum, like in the prototype.
Thus, the prototype material is used for small-scale
modeling.
To minimize scaling effects on soil-structure interaction
due to the grain size, some critical ratios of characteristic
dimension of the structure to mean grain diameter, d50, are
available in the literature. The technical committee TC2
(Physical Modelling in Geotechnics) of the ISSMGE pro-
vides a catalog of collected scaling laws and similitude
questions in centrifuge modeling [30]. For the soil-struc-
ture interaction at tunnel face, the relation D/d50 [ 175 is
recommended [7]. With the model sand used in the cen-
trifuge tests, a D/d50 ratio of about 125 was reached.
Therefore, some caution is needed to appreciate the test
results. Furthermore, grain size effects have been detected
on the development of shear band patterns in a trap door
test simulating chimney collapse [22, 24, 34]. While col-
lapse load is not sensitive to the grain size, the propagation
of a collapsing chimney is sensitive to B/d50, even for a
ratio as large as 1,000, which cannot be modeled at small
scale [13, 28, 39]. For these reasons, a small-scale model
behaves stiffer than its prototype.
A proper method for checking scale effects is ‘‘modeling
of models’’. This is particularly useful when no prototype is
available to verify the centrifuge model test results. Cen-
trifuge models of different scales are tested at the appro-
priate acceleration level (e.g., scale of 1/50 at 50 g and
scale of 1/100 at 100 g). Thus, they correspond to the same
prototype. These models should predict the same behavior
and provide a check on the modeling process. However,
this technique was not implemented in this paper, due to
geometric limitations.
2.3 Measurement of soil deformation with digital
image correlation
Digital Image Correlation, DIC (also referred to as Particle
Image Velocimetry, PIV) was adopted to quantify soil
movement in the prefailure and regime. This technique
enables displacement measurement at potentially thou-
sands of points of the model with high accuracy [36–38].
DIC operates by tracking the soil texture (particular and
random orientation of grains in the model) within a digital
image and through successive images. For this purpose, the
initial image is subdivided into a mesh of patches. Each
patch covers a few sand grains and is characterized by a
unique spatial distribution of gray-scale values. Consider
one patch located at coordinates (ui, vi) in image i. To find
the location of this patch in the subsequent image i ? 1,
the correlation between the patch from image i (time = ti)
and its new position within a search zone around the ori-
ginal patch position in the subsequent image i ? 1
(time = ti?1) is evaluated (Fig. 4). At each position, the
correlation is calculated, resulting in a map of ‘‘degree of
match’’ over the entire search zone. The location with the
highest correlation indicates the new position of the patch
(u2, v2). For a satisfying adjustment, the correlation peak
has to exceed the random noise distortion. Otherwise, so-
called wild vectors are produced. The exact location of the
correlation peak is established to subpixel precision by
interpolation around the peak value [36].
The use of DIC is feasible if the soil possesses suitable
texture, otherwise texture has to be added by tracer parti-
cles. Natural sand fulfills this requirement (variable shaded
grains, light and shadows form between adjacent grains
when sand becomes illuminated) [37]. Thus, commonly
applied distractive target markers or colored soil layers
within the observed soil domain are not required.
A series of digital images, taken by a digital still camera,
is the underlying data for the DIC calculation. The soil
deformation between two images is calculated in image
space. Displacement vectors are translated from image
space (units of pixel) to real space (e.g., units of millime-
ter) by camera calibration. The calibration includes cor-
rections for effects of lens distortion, camera orientation,
and refraction through the observation window. Therefore,
stationary reference points with defined real space coordi-
nates are drawn onto the acrylic. For a satisfying correction
of image distortion, reference points have to be distributed
over the whole field of view. At least 15 reference points
are recommended [33]. However, one should be aware that
the area covered by a reference point is not visible and
therefore interpreted as being stationary. This constraint
should not affect zones of great interest, like a slip surface.
Thus, knowledge of the anticipated failure mechanism is
auxiliary, e.g., gain from a pretest or basic soil mechanic
calculation.
Fig. 4 Principle of digital image correlation
108 Acta Geotechnica (2011) 6:105–117
123
The precision of digital image correlation depends
strongly on patch size and less on the image content [36]. A
larger patch size would lead to improved precision, though
the number of measurement points within an image is
smaller. Thus, larger patches ‘‘smear’’ the measured data in
the area of a high shear strain gradient (i.e., slip surfaces
are not detected). For successful deformation measure-
ment, the smallest strain throughout the field of interest
must be captured. Assuming a prefailure deformation of
0.01% is within a zone of a few centimeters, the required
resolution in detecting movement is a few micrometers. In
literature, uncertainties of 100 lm are thought to be suffi-
cient to compare the experimental observations with results
of numerical analyses [10, 18]. In a screening test, where a
photograph of sand grains was subjected to pure horizontal
displacement, a standard error of 16 lm (0.08%) was
evaluated. Thus, the achieved accuracy of the system was
found to be satisfactory.
2.4 Centrifuge and material properties
Tests were carried out with the geotechnical centrifuge in
Vienna. The beam centrifuge has a nominal radius of 1.3 m
and is capable of generating a maximum acceleration of up
to 200 g at a load capacity of 10,000 g-kg. The platform
size is 0.54 9 0.56 m2. The model tunnel was placed
inside a box made of aluminum plates of thickness 15 mm
with inner dimensions of 440 9 155 9 400 mm (width 9
depth 9 height). An acrylic plate with a thickness of
30 mm was attached as front wall.
The eccentric test assembly was mounted with the heavy
part (soil-filled model box) on the inner side of the
swinging platform adjacent to the centrifuge axis (lower
side during flight). Therefore, a higher upswing angle of
the swinging platform was achieved, minimizing the effect
of pivot friction of the swinging platform. An upswing
angle of about 88� was observed (frictionless upswing
angle at 50 g is arctan (50/1) = 88.9�).
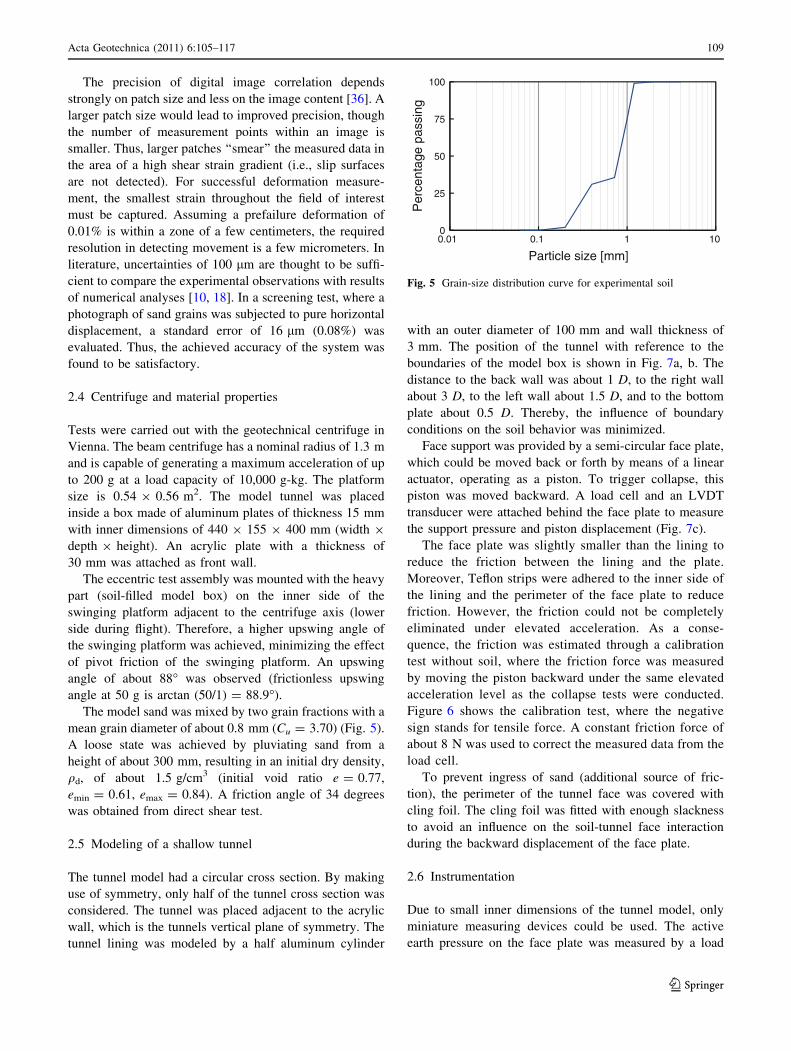
The model sand was mixed by two grain fractions with a
mean grain diameter of about 0.8 mm (Cu = 3.70) (Fig. 5).
A loose state was achieved by pluviating sand from a
height of about 300 mm, resulting in an initial dry density,
qd, of about 1.5 g/cm3 (initial void ratio e = 0.77,
emin = 0.61, emax = 0.84). A friction angle of 34 degrees
was obtained from direct shear test.
2.5 Modeling of a shallow tunnel
The tunnel model had a circular cross section. By making
use of symmetry, only half of the tunnel cross section was
considered. The tunnel was placed adjacent to the acrylic
wall, which is the tunnels vertical plane of symmetry. The
tunnel lining was modeled by a half aluminum cylinder
with an outer diameter of 100 mm and wall thickness of
3 mm. The position of the tunnel with reference to the
boundaries of the model box is shown in Fig. 7a, b. The
distance to the back wall was about 1 D, to the right wall
about 3 D, to the left wall about 1.5 D, and to the bottom
plate about 0.5 D. Thereby, the influence of boundary
conditions on the soil behavior was minimized.
Face support was provided by a semi-circular face plate,
which could be moved back or forth by means of a linear
actuator, operating as a piston. To trigger collapse, this
piston was moved backward. A load cell and an LVDT
transducer were attached behind the face plate to measure
the support pressure and piston displacement (Fig. 7c).
The face plate was slightly smaller than the lining to
reduce the friction between the lining and the plate.
Moreover, Teflon strips were adhered to the inner side of
the lining and the perimeter of the face plate to reduce
friction. However, the friction could not be completely
eliminated under elevated acceleration. As a conse-
quence, the friction was estimated through a calibration
test without soil, where the friction force was measured
by moving the piston backward under the same elevated
acceleration level as the collapse tests were conducted.
Figure 6 shows the calibration test, where the negative
sign stands for tensile force. A constant friction force of
about 8 N was used to correct the measured data from the
load cell.
To prevent ingress of sand (additional source of fric-
tion), the perimeter of the tunnel face was covered with
cling foil. The cling foil was fitted with enough slackness
to avoid an influence on the soil-tunnel face interaction
during the backward displacement of the face plate.
2.6 Instrumentation
Due to small inner dimensions of the tunnel model, only
miniature measuring devices could be used. The active
earth pressure on the face plate was measured by a load
0
25
50
75
100
0.01 0.1 1 10
Per
cent
age
pass
ing
Particle size [mm]
Fig. 5 Grain-size distribution curve for experimental soil
Acta Geotechnica (2011) 6:105–117 109
123

cell. The mean pressure was calculated by dividing the
measured force by the area of the tunnel face. Compression
and tensile forces were measured to an accuracy of 0.12 N.
The LVDT transducer measured the axial displacement of
the tunnel plate with an accuracy of 0.625 lm.
A linear actuator converted the rotation of a step motor
into translational displacement. Thereby, the face support
was manipulated during flight by remote control. One step
(rotation of 1.8�) was equal to a movement of 10.5 lm.
The tunnel plate was moved back at a constant rate of one
step per 5 s.
A digital still camera (CCD) was attached to a rigid
frame, with the camera lens inserted through a tightly fit-
ting aluminum block. In addition, the small gap between
lens and fitting was filled with layers of Teflon strips to
provide a stable mount. This arrangement avoided the
downward displacement of the lens due to the increased
gravity level, and preserved a constant image frame during
flight (Fig. 8). The distance from camera lens to the plane
of observed soil deformation behind the acrylic wall was
approximately 260 mm, providing a field of view of about
350 9 250 mm. Pictures were taken at a resolution of
3456 9 2592 pixels, coming up to a size of 9 MP. At this
resolution, 1 mm had an extent of about 10 pixels. By that,
a sand grain with a diameter of 1 mm was expressed by
about 80 pixels. With the chosen patch size for image
correlation of 32 9 32 pixels, one patch includes about 10
sand grains. This patch size assured high accuracy as well
as high spatial resolution.
To receive a photo series over the whole experiment, it
was essential to have a remote control software for the
camera and thereby a connection to a computer within the
centrifuge. Therefore, a netbook was mounted close to
the centrifuge axis since the acceleration force decreases at
smaller radii (i.e., \ 10 g during a 50 g test). The netbook
was operated by a computer in the control room via
Ethernet connection over slip rings.
-15
-10
-5
00 1 2 3 4 5
For
ce d
iffer
ence
[N
]Displacement [mm]
Measurement
Mean value
Fig. 6 Calibration of face plate and tunnel shell at 50 g
Fig. 7 Schematic sketch of tunnel model: a front view and b top
view on model box, c longitudinal section and cross section A-A of
the tunnel
Fig. 8 Model assembly mounted on swinging platform
110 Acta Geotechnica (2011) 6:105–117
123
3 Results
The experimental results on required face support pressure,
failure initialisation mode, failure propagation, ground
deformation, and surface settlement are presented in this
section.
Centrifuge model tests have been carried out for three
overburden-to-diameter ratios: C/D = 1.5 (test T1, T2),
C/D = 1.0 (T3, T4, T5), and C/D = 0.5 (T6). Tests T2,
T4, and T5 were performed for model validation. The model
was accelerated up to 50 g in progressive steps, which
corresponds to a prototype tunnel of 5.0 m in diameter. The
prototype overburden above tunnel crown was about 7.5, 5.0,
and 2.5 m, respectively. The tests were stopped at a piston
displacement, dp, of 5 mm (equal to 5% of D).
3.1 Support pressure
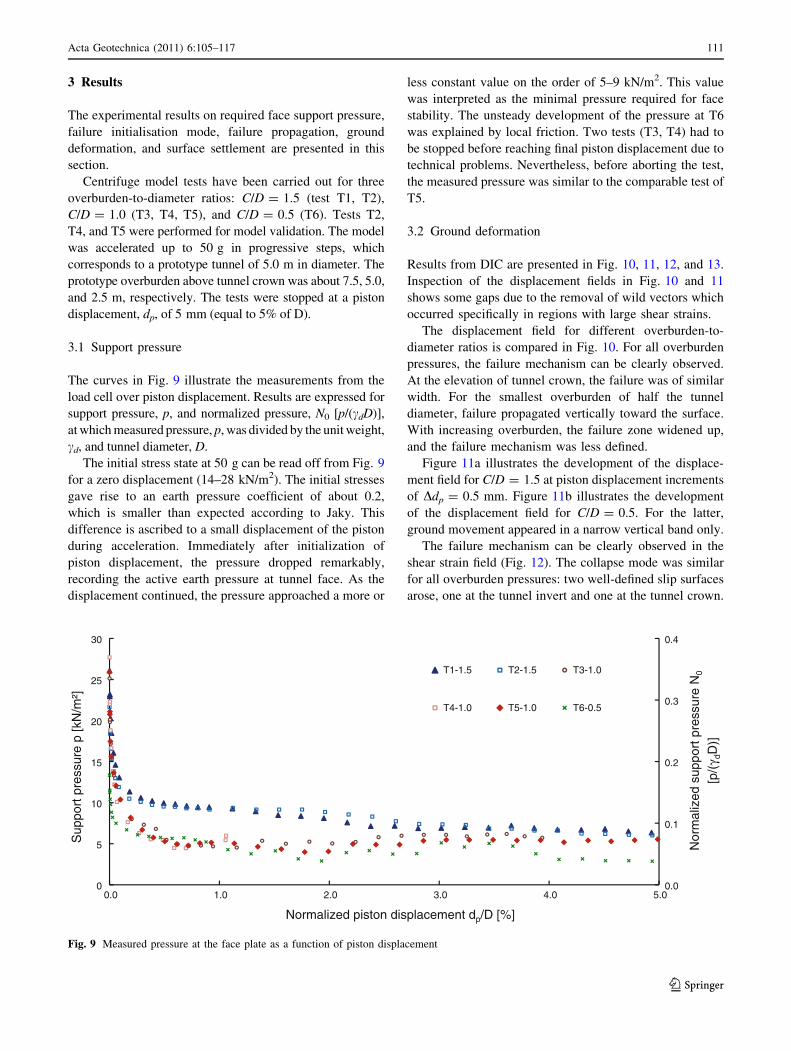
The curves in Fig. 9 illustrate the measurements from the
load cell over piston displacement. Results are expressed for
support pressure, p, and normalized pressure, N0 [p/(cdD)],
at which measured pressure, p, was divided by the unit weight,
cd, and tunnel diameter, D.
The initial stress state at 50 g can be read off from Fig. 9
for a zero displacement (14–28 kN/m2). The initial stresses
gave rise to an earth pressure coefficient of about 0.2,
which is smaller than expected according to Jaky. This
difference is ascribed to a small displacement of the piston
during acceleration. Immediately after initialization of
piston displacement, the pressure dropped remarkably,
recording the active earth pressure at tunnel face. As the
displacement continued, the pressure approached a more or
less constant value on the order of 5–9 kN/m2. This value
was interpreted as the minimal pressure required for face
stability. The unsteady development of the pressure at T6
was explained by local friction. Two tests (T3, T4) had to
be stopped before reaching final piston displacement due to
technical problems. Nevertheless, before aborting the test,
the measured pressure was similar to the comparable test of
T5.
3.2 Ground deformation
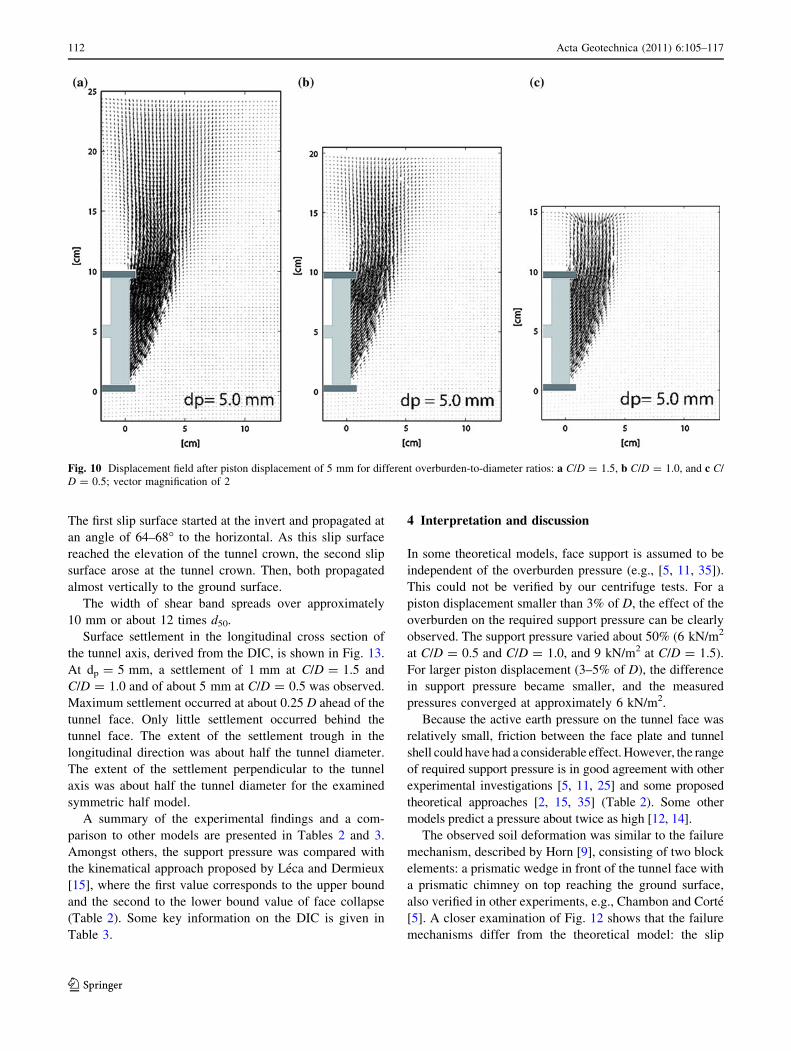
Results from DIC are presented in Fig. 10, 11, 12, and 13.
Inspection of the displacement fields in Fig. 10 and 11
shows some gaps due to the removal of wild vectors which
occurred specifically in regions with large shear strains.
The displacement field for different overburden-to-
diameter ratios is compared in Fig. 10. For all overburden
pressures, the failure mechanism can be clearly observed.
At the elevation of tunnel crown, the failure was of similar
width. For the smallest overburden of half the tunnel
diameter, failure propagated vertically toward the surface.
With increasing overburden, the failure zone widened up,
and the failure mechanism was less defined.
Figure 11a illustrates the development of the displace-
ment field for C/D = 1.5 at piston displacement increments
of Ddp = 0.5 mm. Figure 11b illustrates the development
of the displacement field for C/D = 0.5. For the latter,
ground movement appeared in a narrow vertical band only.
The failure mechanism can be clearly observed in the
shear strain field (Fig. 12). The collapse mode was similar
for all overburden pressures: two well-defined slip surfaces
arose, one at the tunnel invert and one at the tunnel crown.
0.0
0.1
0.2
0.3
0.4
0
5
10
15
20
25
30
0.0 1.0 2.0 3.0 4.0 5.0
Nor
mal
ized
supp
ortp
ress
ure
N0
[p/(
γ dD
)]
Sup
port
pre
ssur
ep
[kN
/m²]
Normalized piston displacement dp/D [%]
T1-1.5 T2-1.5 T3-1.0
T4-1.0 T5-1.0 T6-0.5
Fig. 9 Measured pressure at the face plate as a function of piston displacement
Acta Geotechnica (2011) 6:105–117 111
123
The first slip surface started at the invert and propagated at
an angle of 64–68� to the horizontal. As this slip surface
reached the elevation of the tunnel crown, the second slip
surface arose at the tunnel crown. Then, both propagated
almost vertically to the ground surface.
The width of shear band spreads over approximately
10 mm or about 12 times d50.
Surface settlement in the longitudinal cross section of
the tunnel axis, derived from the DIC, is shown in Fig. 13.
At dp = 5 mm, a settlement of 1 mm at C/D = 1.5 and
C/D = 1.0 and of about 5 mm at C/D = 0.5 was observed.
Maximum settlement occurred at about 0.25 D ahead of the
tunnel face. Only little settlement occurred behind the
tunnel face. The extent of the settlement trough in the
longitudinal direction was about half the tunnel diameter.
The extent of the settlement perpendicular to the tunnel
axis was about half the tunnel diameter for the examined
symmetric half model.
A summary of the experimental findings and a com-
parison to other models are presented in Tables 2 and 3.
Amongst others, the support pressure was compared with
the kinematical approach proposed by Leca and Dermieux
[15], where the first value corresponds to the upper bound
and the second to the lower bound value of face collapse
(Table 2). Some key information on the DIC is given in
Table 3.
4 Interpretation and discussion
In some theoretical models, face support is assumed to be
independent of the overburden pressure (e.g., [5, 11, 35]).
This could not be verified by our centrifuge tests. For a
piston displacement smaller than 3% of D, the effect of the
overburden on the required support pressure can be clearly
observed. The support pressure varied about 50% (6 kN/m2
at C/D = 0.5 and C/D = 1.0, and 9 kN/m2 at C/D = 1.5).
For larger piston displacement (3–5% of D), the difference
in support pressure became smaller, and the measured
pressures converged at approximately 6 kN/m2.
Because the active earth pressure on the tunnel face was
relatively small, friction between the face plate and tunnel
shell could have had a considerable effect. However, the range
of required support pressure is in good agreement with other
experimental investigations [5, 11, 25] and some proposed
theoretical approaches [2, 15, 35] (Table 2). Some other
models predict a pressure about twice as high [12, 14].
The observed soil deformation was similar to the failure
mechanism, described by Horn [9], consisting of two block
elements: a prismatic wedge in front of the tunnel face with
a prismatic chimney on top reaching the ground surface,
also verified in other experiments, e.g., Chambon and Corte
[5]. A closer examination of Fig. 12 shows that the failure
mechanisms differ from the theoretical model: the slip
Fig. 10 Displacement field after piston displacement of 5 mm for different overburden-to-diameter ratios: a C/D = 1.5, b C/D = 1.0, and c C/
D = 0.5; vector magnification of 2
112 Acta Geotechnica (2011) 6:105–117
123

surface arising from the invert is curved instead of a
straight line, and the movement of the wedge is orientated
downward along its inclination instead of horizontal
toward the tunnel. However, the different friction between
soil and acrylic wall might have led to a reduced mea-
surement of the soil displacement.
Fig. 11 Displacement field at a C/D = 1.5 and b C/D = 0.5 for piston displacement increments of Ddp = 0.5 mm; vector magnification of 2
Acta Geotechnica (2011) 6:105–117 113
123

At higher overburden-to-diameter ratios, the extent
of the chimney was wider, especially near the ground
surface. This was partly due to the low initial density of
sand in our tests. Centrifuge tests on dense sand in the
literature show that the failure mechanisms are clearer
delineated [11].
The failure mechanism, in particular the location of
slip surfaces, could be observed after small piston
displacement. In the field of shear strain, the propagation
path of the two slip surfaces was already detected at a small
piston displacement.
At the final face displacement of 5% of D only at the
overburden ratio of C/D = 0.5, collapse propagated until
ground surface. At the piston displacement of 3% of D, the
rate of ground settlement increased to about 1.0 mm for
Ddp = 0.5 mm.
Fig. 12 Contours of shear strain at a C/D = 1.5 and b C/D = 0.5 for piston displacement increments of Ddp = 0.5 mm
114 Acta Geotechnica (2011) 6:105–117
123

For an overburden ratio of C/D = 1.0 and C/D = 1.5,
slip surfaces propagated until 50 mm and 100 mm below
the surface, respectively. After a piston displacement of 3%
of D, no noteworthy evolution of slip surfaces occurred
(Fig. 12a). Instead of a further propagation of the shear
zones, a funnel without sharply defined borders formed at
ground surface.
The grain size might had some effect on the test result.
The ratio of grain diameter, or alternatively the width of the
shear band, to the width of the chimney is different to the
ratio in the prototype. This may have some bearing when
the support pressure is compared with the prototype.
However, grain size has less effect on the failure
mechanism.
Terzaghi [31, 32] explained the arching theory with a trap
door model. The active mode was used to study the silo
problem, which is similar to the earth pressure on a tunnel
lining at a certain depth. For the three investigated overbur-
den-to-diameter ratios, C/D = 1.0 seemed to mark a critical
depth, since surface settlement was smaller than expected and
similar to the settlement at a higher overburden pressure
(Fig. 13). Therefore, some arching effects might have
evolved. A similar threshold with the overburden equal to the
tunnel diameter is also found in the literature (e.g., [12]).
-7
-5
-3
-1
-2 0 2 4 6 8 10 12 14
Set
tlem
ent [
mm
]Distance to tunnel face [cm]
C/D=1.5
C/D=1.0
C/D=0.5
Fig. 13 Surface settlement at piston displacement dp = 5 mm
Table 2 Summary on support pressure
Required support pressure [kN/m2] C/D = 1.5 C/D = 1.0 C/D = 0.5
Centrifuge test 6.5–9.5 4.5–6.0 3.0–6.0
After Leca and Dormieux [15] 6.8–52.5 6.8–41.3 6.8–30.0
After Kirsch [11] 6.7–12.0 6.0–11.3 5.3–13.5
After Vermeer et al. [35] 7.5–10.5 7.5–10.5 7.5–10.5
After Anagnostou and Kovari [2] 6.0–12.7 6.0–12.4 3.0–12.0
After Chambon and Corte [5] 3.0–6.0 3.0–6.0 3.0–6.0
Table 3 Summary on ground deformation
DIC analysis C/D = 1.5 C/D = 1.0 C/D = 0.5
Test No. for DIC analysis T1 T5 T6
Standard error \0.5 [pixel] 0.449 0.035 0.040
Failure propagation after 5 mm piston displacement until 85 mm below surface 50 mm below surface Surface
Inclination of wedge to horizontal d [�] 68.0 66.5 64.0
Max. settlement [mm] 0.95 1.03 5.51
Acta Geotechnica (2011) 6:105–117 115
123
5 Conclusions
The required face support for shallow tunnel in cohesion-
less soil was found to be dependent on the overburden,
especially at a small piston displacement (\3% of D).
Measured pressure at tunnel face was close to the upper
bound solution for frictional material proposed by Leca and
Dormieux [15], as well as to other experimental and ana-
lytical examinations. Since the minimum support pressure
required for face stability was sought after, this finding is
quite reasonable. However, one should be aware that the
pressure measured in our experiment might underestimate
the required support pressure due to reasons explained
earlier.
Face collapse occurred in a narrow vertical band. The
slip surface arising from tunnel invert propagated at an
angle of about 45� ? u/2 to the horizontal until it turned
more or less vertical. The particle flow within the failure
zone was oriented parallel to this slip surface.
Arching effects were observed to occur at an overburden
ratio of C/D = 1.0. For smaller ratios, the unreduced
body stress acted at tunnel face. At the overburden ratio
C/D = 1.0 and C/D = 1.5, slip surfaces developed only
marginally toward ground surface after a piston displace-
ment of 3% of D. Further soil ingress was provided by a
funnel formed at the ground surface. This resulted in the
wider settlement trough observed at bigger overburden.
Acknowledgments This research was supported by the Austrian
Geomechanics Society (OGG). The second author is grateful for the
support from the Otto Pregl Foundation for Geotechnical Funda-
mental Research. The authors are grateful for the support from Malcolm
Bolton and Stuart Haigh from Schofield Centre at Cambridge
University.
References
1. Anagnostou G, Kovari K (1994) The face stability of slurry
shield-driven tunnels. Tunn Undergr Space Technol 9(2):
165–174
2. Anagnostou G, Kovari K (1996) Face stability conditions with
earth-pressure-balanced shields. Tunn Undergr Space Technol
11(2):165–173
3. Atkinson JH, Mair RJ (1981) Soil mechanics aspects of soft
ground tunneling. Ground Eng 14(5):20–38
4. Bucky BP (1931) The use of models for the study of mining
problems, Technical publication No.425, American institute of
mining and metallurgical engineers, pp 3–28
5. Chambon P, Corte JF (1994) Shallow tunnels in cohesionless soil:
stability of tunnel face. ASCE J Geotech Eng 120(7):1148–1165
6. Chambon P, Corte JF, Garnier J, Konig D (1991) Face stability of
shallow tunnels in granular soils, Proceedings of the Centri-
fuge’91 Conference, 13–14 June. Boulder, Colorado, pp 99–105
7. Chambon P, Couillaud A, Munch P, Schurmann A, Konig D
(1995) Stabilite0 du front de taille d’un tunnel: Etude de l’effet
d’e0chelle, in Geo 95
8. Davis EH, Gunn MJ, Mair RJ, Seneviratne HN (1980) The sta-
bility of shallow tunnels and underground openings in cohesive
material. Geotechnique 30(4):397–416
9. Horn M (1961) Horizontaler Erddruck auf senkrechte Abs-
chlussflachen von Tunneln, in Landeskonferenz der ungarischen
Tiefbauindustrie. German translation by STUVA, Dusseldorf
10. Kirsch A (2009) On the face stability of shallow tunnels in sand,
Advances in geotechnical engineering and tunnelling No.16,
Logos, Berlin
11. Kirsch A (2010) Experimental investigation of the face stability
of shallow tunnels in sand. Acta Geotech 5(1):43–62
12. Kolymbas D (2005) Tunnelling and tunnel mechanics—a rational
approach to tunnelling, Springer Verlag, Berlin
13. Kutter BL, Chang J-D, Davis BC (1995) Collapse of Cavities in
Sand and Particle Size Effects, In: Proceedings international
conference, Centrifuge ‘94, Singapore, Leung CF, Lee F-H, Tan
TS (eds), Balkema, Rotterdam, pp 809–815
14. Krause T (1987) Schildvortrieb mit flussigkeits- und erdgestutzter
Ortsbrust, No. 24 in Mitteilung des Instituts fur Grundbau und
Bodenmechanik der Technischen Universitat Braunschweig
15. Leca E, Dormieux L (1990) Upper and lower bound solutions for
the face stability of shallow circular tunnels in frictional material.
Geotechnique 40(4):581–606
16. Lee KM, Rowe RK (1989) Deformations caused by surface
loading and tunneling: the role of elastic anisotropy. Geotech-
nique 39(1):125–140
17. Ling HI (2010) A tribute to Philip Barnett Bucky (1899–1957)
Father of centrifuge modeling in geomechanics. Acta Geotech
5(1):83–85
18. Mahr M (2006) Ground movements induced by shield tunneling
in non-cohesive soils, Advances in geotechnical engineering and
tunneling No. 15, Logos, Berlin
19. Mair RJ (1979) Centrifugal modelling of tunneling construction
in soft clay, PhD Thesis, University of Cambridge
20. Mair RJ, Taylor RN (1997) Bored tunnelling in the urban envi-
ronment. In: Proceedings of the 14th international conference on
soil mechanics and foundation engineering, Hamburg, vol 4,
pp 2353–2385
21. Mashimo H, Suzuki M (1998) Stability conditions of tunnel face
in sandy ground. In: Proceedings of the centrifuge ‘98 confer-
ence, Tokyo, Japan, 23–25 September, pp 721–725
22. Meguid MA, Saada O, Nunes MA, Mattar J (2008) Physical
modeling of tunnels in soft ground: a review. Tunn Undergr
Space Technol 23(2):185–198
23. Melix P (1987) Modellversuche und Berechnungen zur Standsi-
cherheit oberflachennaher Tunnel, Veroffentlichungen des Insti-
tutes fur Bodenmechanik und Felsmechanik der Universitat
Fridericiana, Karlsruhe
24. Park SH, Adachi T, Kimura M, Kishida K (1999) Trap door test
using aluminum blocks. In: Proceedings of the 29th symposium
of rock mechanics J.S.C.E., pp 106–111
25. Plekkenpol JW, van der Schrier JS, Hergarden HJ (2006) Shield
tunnelling in saturated sand - face support pressure and soil
deformations. In: Bezuijen A, van Lottum H (eds) Tunnelling: a
decade of progress, GeoDelft 1995–2005. Taylor & Francis,
London
26. Rowe RK, Kack GJ (1983) A theoretical examination of the
settlements induced by tunneling: from cases history. Can Geo-
tech J 20(2):299–314
27. Sterpi D, Cividini A, Sakurai S, Nishitake S (1996) Laboratory
model tests and numerical analysis of shallow tunnels, In: Pro-
ceedings of the international symposium on eurock ‘96—ISRM,
Torino, Vol.1. Balkema, Rotterdam, pp 689–696
28. Stone KJL, Muir Wood D (1992) Effects at dilatancy and particle
size observed in model tests on sand. Soils Found 32(4):43–47
116 Acta Geotechnica (2011) 6:105–117
123

29. Taylor RN (1995) Geotechnical centrifuge technology. Blackie
academic and professional, Glasgow
30. Technical Commitee 2 of ISSMGE—Physical modelling in
geotechnics (2007) Catalogue of scaling laws and similitude
questions in centrifuge modelling
31. Terzaghi K (1936) Stress distribution in dry and in saturated sand
above a yielding trap-door. In: Proceedings of the international
conference on soil mechanics, Vol. 1. Harvard University. Press,
Cambridge, MA, pp 307–311
32. Terzaghi K (1943) Theoretical Soil Mechanics. Wiley, New York
33. Thusyanthan I, White DJ, Take WA (2008) Deformation mea-
surement using digital imaging and PIV (Particle Image Veloci-
metry) technique, Lecture sheets, University of Cambridge
34. Vardoulakis I, Graf B, Gudehus G (1981) Trap-door problem
with dry sand: a statical approach based upon model test kine-
matics. Int J Numer Anal Methods Geomech 5:57–78
35. Vermeer P, Ruse N, Marcher T (2002) Tunnel heading stability in
drained ground. Felsbau 20(6):8–24
36. White DJ, Take WA (2002) GeoPIV: Particle Image Velocimetry
(PIV) Software for use in geotechnical testing, Technical report,
University of Cambridge
37. White DJ, Take WA, Bolton MD (2001) Measuring soil defor-
mation in geotechnical models digital images and PIV analysis,
10th International Conference on Computer Methods and
Advances in Geomechanics. Tuscan, Arizona, pp 997–1002
38. White DJ, Take WA, Bolton MD (2003) Soil deformation mea-
surement using particle image velocimetry (PIV) and photo-
grammetry. Geotechnique 53(7):619–631
39. White RJ, Stone KJL, Jewell JJ (1994) Effect of particle size on
localisation development in model tests on sand, In: Proceedings
international conference, centrifuge ‘94, Singapore, Leung CF,
Lee F-H, Tan TS (eds), Balkema, Rotterdam, pp 817-822
Acta Geotechnica (2011) 6:105–117 117
123