centre for building performance research new zealand ... · pdf filenew zealand building...
TRANSCRIPT
Centre forBuildingPerformanceResearch
NEW ZEALAND BUILDINGMATERIALS EMBODIEDENERGY COEFFICIENTS DATABASEVolume II - Coefficients
Andrew AlcornPeter Wood
Research and publication by theCentre for Building Performance ResearchVictoria University of Wellington
Prepared for theBuilding Research Association of New ZealandWellington
November 1998
NEW ZEALAND BUILDING MATERIALS EMBODIED ENERGY COEFFICIENTS DATABASEVolume II - Coefficients
Andrew AlcornPeter Wood
Edition 1: November 1998
ISSN 1172-563XISBN 0-475-50017-2
Report SeriesCentre for Building Performance Research Report
Alcorn, A.Wood, P.
NEW ZEALAND BUILDING MATERIALS EMBODIED ENERGY COEFFICIENTS DATABASEVolume II - Coefficients
Centre for Building Performance Research,Victoria University of Wellington,P.O. Box 600, Wellington, New Zealand.
Phone + 64 4 802 6200 Facsimile + 64 4 802 6204 E-mail [email protected]
The Document Register is provided at the back.
New Zealand Building Materials Embodied Energy Coefficients Database. Vol. II - Coefficients i
TABLE OF CONTENTS
EXECUTIVE SUMMARY iiTable of Energy Coefficients iiiAcknowledgements iv
1 INTRODUCTION 11.1 History 1
2 METHODOLOGY 22.1 Process-Based Hybrid Analysis 22.2 Comparison of Hybrid and Input-Output Analysis 2
2.2.1 Aggregation and Price Level Variation 32.2.2 Conclusion 4
2.3 IFIAS Levels 42.4 Existing Manual System for Computing Embodied Energy 4
2.4.1 Material/Product 52.4.2 Who and How Much 52.4.3 Composition 52.4.4 Manufacturing Process 52.4.5 Inputs and Their Values 62.4.6 Output 62.4.7 Prices 72.4.8 Source, Age and Confidentiality of Data 72.4.9 Other Comparative Data 7
2.5 Weighting of Data 72.6 Value ranges 82.7 Influences on Energy Coefficients 82.8 Materials Requiring Information 82.9 Gaps in the Coefficients Table 9
3 FURTHER WORK 103.1 Updating of the Database 103.2 Extending the Database into other Areas of Environmental Impact 103.3 Example 11
4 CONCLUSION 12
5 REFERENCES 13
APPENDICESAppendix A Embodied Energy Coefficients - Alphabetical A1 - A4Appendix B Process Records of New and Upgraded Materials B1 - B28Appendix C Example of Gas Fired Kiln Dried Dressed Softwood C1 - C13
Document Register
New Zealand Building Materials Embodied Energy Coefficients Database. Vol. II - Coefficients ii
Centre for Building Performance Research, Victoria University of Wellington
EXECUTIVE SUMMARY
This report describes the production of a database for embodied energy coefficients forBRANZ Contract 85055. The database aspects of the contract are dealt with in VolumeI. The embodied energy coefficients, their background and derivation, are described inVolume II.
In 1983 NZERDC published Energy Cost of Houses and Light ConstructionBuildings.1 This has since been used world wide as a reference document on embodiedenergy. The investigation was completely redone in 1995.2 In 1997 BRANZ contractedthe CBPR to extend and improve the results of the 1995 work and to develop acomputer database to enable the efficient handling and updating of embodied energyinformation. A number of deficiencies had been identified with the 1995 investigation.The goal of the 1997 study was to rectify these deficiencies, providing a system bywhich an enhanced set of embodied energy coefficients for New Zealand buildingmaterials could be routinely maintained and expanded.
A database specification was developed for the collection and processing of embodiedenergy information. The commercial program SimaPro fits most of the criteria in thisspecification. The SPOLD format used by SimaPro provides an internationallyrecognised format for the collection and exchange of data on all environmental impacts,not just embodied energy. The program itself is in use around the world: ATHENA,Canada; BRE, UK; Eco-Quantum, Netherlands; Franklin Life Cycle Inventory, USA;Sintef environmental building, Norway. The advantages afforded by its user-friendlyinterface, SPOLD structured data format, encompassing of other environmental impactsand industry acceptance far outweigh the limitations of the program identified in theimplementation of the New Zealand embodied energy database.
The collection of data for all environmental impacts of New Zealand building materialswill be a large task, but using SimaPro it may be tackled as resources permit. Theexample SimaPro “project” described in Volume I, Section 4 shows, for a standardhouse, how embodied energy data might be used by industry. A report on say, CO2
production or ozone depleting emissions would look the same, and would be as easyto use as this energy report.
With such a tool at their disposal manufacturers would be able to ascertain thedownstream effects of alternative ingredients, in terms of embodied energy initially, andin full LCA terms eventually, given the necessary data collection. This is likely toprovide some with a worthwhile marketing lever. To exploit fully this potential in theSimaPro database will require the following discrete pieces of work:i collection of environmental impact data for New Zealand building materials;ii establishment of weighting factors by which a single index of environmental
impact might be constructed from the data collected in (i) above;iii creation of a set of standard buildings within SimaPro to facilitate comparisons
of alternate building constructions for houses, commercial buildings, etc;iv exploration with the BIA of the feasibility of the inclusion of LCA performance
specification in the NZBC.

New Zealand Building Materials Embodied Energy Coefficients Database. Vol. II - Coefficients iii
Centre for Building Performance Research, Victoria University of Wellington
Table of Energy Coefficients, MJ/kg and MJ/m3
Calcium carbonate 1.3Cellulose pulp 14.3Cement, average 9.0 17 550 cement, dry process 7.7 15 020 cement, wet process 10.4 20 280 cement grout 1.9 4 560 cement mortar 2.1 3 360 fibre cement board 10.9 15 550 soil-cement 0.7 1 420Ceramic brick, old technology 7.7 1 580 pipe 6.8 13 880 refractory brick 5.7 12 830Concrete block-fill 1.4 3 150 block-fill, pump mix 1.5 3 430 grout 1.7 2 380 17.5MPa pump mix 1.2 2 830Earth, raw adobe, straw stabilised 0.22 360 adobe, cement stabilised 0.67 1 130 clay 0.07 45 clay for cement 0.1 65 rammed soil cement 0.73 1 450Insulation wool (recycled) 20.9 200Paper kraft 13.9Plaster, gypsum 3.8 5 480Stainless steel, average 50.4 395 640Steel, imported, structural 35.9 281 820Timber kiln dried, average, dressed 5.09 2 200 kiln dried, gas fired, dressed 8.2 3 550 kiln dried, waste fired, dressed 3.1 1 340Water, reticulated 0.003 3.3

New Zealand Building Materials Embodied Energy Coefficients Database. Vol. II - Coefficients iv
Centre for Building Performance Research, Victoria University of Wellington
Acknowledgements
The authors would like to thank the Building Research Association of New Zealand(BRANZ) for its funding support and Michael Camilleri, Nigel Isaacs and RomanJaques of BRANZ for their helpful assistance.
Our thanks go to those from private companies who provided data for the energycoefficients calculations.
Lastly we would like to thank our colleagues at the CBPR, in particular Dr GeorgeBaird and Michael Donn for their unstinting support and comment.

New Zealand Building Materials Embodied Energy Coefficients Database. Vol. II - Coefficients 1
Centre for Building Performance Research, Victoria University of Wellington
1 INTRODUCTION
Volume I of this report deals with the database aspects of BRANZ Contract 85055.Volume II deals with the embodied energy coefficients aspects. It outlines the VictoriaUniversity embodied energy research that forms the basis of this database.
The hybrid analysis method used in this study, and other analysis methods arediscussed. The existing manual system of analysis, before the adoption of the SimaProdatabase system, is described, as well as issues relating to the application of the analysisto the SimaPro database program. Avenues for further work are also presented. Theappendices present: an updated and upgraded table of energy coefficients; records ofmaterials upgraded or added since the equivalent 1995 tables; and examples of the sortof data stored in the NZEE SimaPro database on specific materials.
1.1 History
In 1983 the NZERDC published George Baird and Chan Seong Aun’s report EnergyCost of Houses and Light Construction Buildings.1 This publication has been usedworld wide as a reference document for researchers and others interested in embodiedenergy analysis, and is still quoted in some recent research publications.
The investigation, acknowledged by Baird and Chan to be a preliminary one, wascompletely redone in 1995 by Andrew Alcorn and George Baird, funded by theBuilding Research Association of New Zealand (BRANZ) and Victoria University.With the help of Hugh Grant, a research assistant funded by Victoria University’sSummer Research Grant scheme, the total number of building materials for whichembodied energy coefficients were obtained was significantly extended. These werepublished as Embodied Energy Coefficients of Building Materials.2
In 1997 BRANZ contracted the CBPR to extend and improve the results of the 1995work and to develop a computer database to enable the efficient handling and updatingof embodied energy information. The database aspects are dealt with in Volume 1 ofthis report.
Since the 1995 investigation, some of the energy coefficients listed have beensuperceded by changing technology in the industry, or by the closure of factories. Forother materials it has consistently proved to be impossible to get data from NewZealand sources, either because it has not been collected to a sufficient level, or becausecommercial sensitivity persuades manufacturers to withhold the information. In thesecases data had been used from overseas sources for the 1995 study. In some cases ithad been impossible to get appropriate figures either from New Zealand or overseassources.
The goal of the current study was to rectify these deficiencies, in the process ofproviding a system by which an enhanced table of embodied energy coefficients forNew Zealand building materials could be routinely maintained and expanded.
New Zealand Building Materials Embodied Energy Coefficients Database. Vol. II - Coefficients 2
Centre for Building Performance Research, Victoria University of Wellington
2 METHODOLOGY
2.1 Process-Based Hybrid Analysis
Hybrid analysis was described by theorists in the early 1970s3 but not used, as far as canbe ascertained, in any large scale energy research until Alcorn developed and appliedthis process-based hybrid analysis method in the 1995 report. The hybrid system usedin this study combines the best attributes of the process analysis and the input-outputanalysis methods, as well as incorporating statistical analysis where appropriate. Theadvantages are, primarily, accuracy and specificity for process analysis and a globalcoverage of energy transactions for input-output analysis. A description of the steps inthe hybrid analysis forms Section 2.4.
2.2 Comparison of Hybrid and Input-Output Analysis
Between the Baird and Chan(1983) and Alcorn(1995) reports, there had beensignificant changes in technology and improvements in energy efficiency. Theseaccounted for some of the differences between the two reports’ findings on buildingmaterials’ energy intensities. Far greater differences between the two reports were,however, attributable to the different analysis methods; predominantly input-outputanalysis in Baird and Chan, compared to process-based hybrid analysis in Alcorn.
Sawmilling is one example of improvements in efficiency during the twelve yearsbetween the reports. It is now common for sawmills to derive considerable energy fromwaste materials, giving an efficiency improvement to the sawmill industry in the orderof 15% during the years between the studies.4 There has also been a shift towardslarger, more efficient sawmills, with smaller, older, less efficient mills closing. Over thesame interval over 50% of New Zealand’s cement production shifted from wet processmanufacture to the more efficient dry process manufacture. In addition, new, moreefficient plant was introduced to the steel industry in 1987.5
Due to electricity shortages, rises in the price of energy, and economic conditionsgenerally becoming more difficult for manufacturers, the tendency has been for gainsin energy efficiency in all areas of manufacturing. There are also continuous incrementalimprovements as new machinery is introduced. This would suggest that an across theboard improvement would be seen between the Baird and Chan(1983) andAlcorn(1995) studies. This is not the case, however.
While nearly three-quarters of the materials do show a drop, by an average of 41%, theremainder show a rise averaging 46%. This is broadly consistent with a general trendto increased energy efficiency. However, the large percentage increase in more thana quarter of the figures suggests that other factors are operating. Half of the figuresshowed a variation averaging 64%. The main factor in the differences is the embodiedenergy analysis methods employed by the two studies.6
Baird and Chan(1983) used, for example, information from a process analysis for theircement and pre-cast concrete figures.7,8 Equivalent figures in Alcorn, using a hybridanalysis method, show a moderate decrease, not inconsistent with the changes in thecement and concrete industry. For cement mortar and ready-mix concrete, however,Baird and Chan use an input-output analysis. Alcorn’s hybrid analysis figures aresignificantly lower: 47% and 39% respectively.

New Zealand Building Materials Embodied Energy Coefficients Database. Vol. II - Coefficients 3
Centre for Building Performance Research, Victoria University of Wellington
2.2.1 Aggregation and Price Level Variation
In comparing the mainly input-output analysis results of Baird and Chan(1983) with thehybrid analysis results of Alcorn(1995), it was discovered that the principal reasons forinaccuracy of the input-output method in its application to New Zealand buildingmaterials were both the aggregation of materials with dissimilar (sometimes highlydissimilar) manufacturing methods into one “industry”, and the effects of pricing. (TheNew Zealand Standard Industrial Classification system [NZSIC] is used by StatisticsNew Zealand to classify the New Zealand economy into approximately 600 industries.These are aggregated into some 80 categories for its approximately 5 yearly economicinput-output studies.)9
The problem of aggregation can be illustrated with the “Non-Metallic Minerals”category. It comprises
a wide range of concrete, clay, glass, plaster, masonry and asbestos products.Included are crockery, plumbing and bathroom fixtures of porcelain andearthenware, refractory insulator elements, mirrors, pottery, clay bricks andpipes, cement, lime, plaster of paris, ready mixed concrete, and concreteproducts such as pipes, fencing posts, blocks, tiles, power poles and specialpre-cast units for the building and civil engineering industries.9
Some of these materials use a lot of heat in their manufacture, such as glass products,with energy coefficients of some 16 to 26MJ/kg, while others require a simple mixingof ingredients for their manufacture, such as concrete products, with energy coefficientsof 0.9 to 2MJ/kg. If issues of price variation could be removed from these differentmaterials, an input-output analysis, by having them aggregated in one category, wouldsuggest that they all had equal energy coefficients.
The problem of price variation may be illustrated with aluminium which, because of itsparticular production requirements, has an extremely high energy coefficient. It has adisproportionate effect on the Basic Metal Industries category which, in the 1995Statistics New Zealand input-output study,10 includes primary production of all metals.The pricing of raw aluminium in New Zealand is dependent on world prices, and doesnot accurately reflect the large amount of energy that is used to produce it. Cheapelectrical energy in New Zealand is indeed one reason for aluminium being producedhere.
Price variation at the retail level can also cause input-output analysis to produce verydeceptive results for particular materials. Pullen11 quotes aluminium at 179.44MJ/kg.For aluminium foil he quotes 494.63MJ/kg. This may be taken to suggest that theprocess of rolling the aluminium out into foil requires 316MJ/kg or 176% of theoriginal smelting energy. Clearly the reason is not a highly energy intensive rollingprocess but that foil is an expensive way of buying a kilogram of aluminium. Becausefoil is expensive on a $/kg basis compared to aluminium ingots, and because input-output analysis attributes energy on a MJ/$ basis, serious anomalies like the one aboveare not unusual. This example is from within an input-output analysis.
A problem of the input-output method related to price level variation is that of physicalflows being assumed to be proportional to dollar flows. For example, in Baird andChan, using input-output analysis, the figure for aggregate is very high when comparedto the figure for sand. Both materials generally come from the same physical source,but sand can be expected to require slightly more processing to produce, either in

New Zealand Building Materials Embodied Energy Coefficients Database. Vol. II - Coefficients 4
Centre for Building Performance Research, Victoria University of Wellington
crushing or simply in extra sieving and consequently can be expected to have a veryslightly higher energy intensity. In this case a MJ/$ figure for the “Mining andQuarrying” category was used. Since sand and aggregate cost the same to produce andto buy, and are sold by volume, 1m3 of sand and 1m3 of aggregate will have equalembodied energy attributed to them. Since sand is some 60% heavier, however, theenergy per kg appears to be much lower for sand instead of slightly higher.
2.2.2 Conclusion
Recent attempts by Treloar12 are aimed at improving the accuracy of input-outputanalysis. They run the risk of negating the main advantage of the input-output method,that of being quick and simple, and making it laborious and time consuming (thetraditional criticism of process analysis) while still being unable to escape the inherentcoarseness of the data collection via economic survey methods. Treloar states: “Theeconomic sector energy intensities may be inherently unreliable, but their validity is not adirect concern [of his report] because it is difficult and time consuming to verify theeconomic sector energy intensities individually.” The approach adopted in the researchreported here has been to avoid both the inherent unreliability and the time consumingverification task by using a process-based hybrid analysis.
Basing a hybrid analysis on process analysis retains the accuracy and specificity for thefirst, easily acquired, two or three levels of inputs which account for usually in excessof 90% of the final figure, but escapes the excessive amount of time needed to acquirethe last few percent of the total. These last few percent are gained by statistical analysisor input-output analysis. The errors described above that are inherent in these lastmethods are inescapable, but are only applicable to perhaps 5% of the final figure.
2.3 IFIAS Levels
In the early 1970s the International Federation of Institutes for Advanced study (IFIAS)published their Energy Analysis Workshop on Methodology and Convention reports.13
They identified four levels in the definition of system boundaries for energy analysis.These guidelines have been frequently used by analysts. It has been found in this studyand in Alcorn(1995), however, that the IFIAS levels and boundaries definitions bearonly vague resemblance to the actuality of collecting and analysing energy data. It canbe difficult deciding which IFIAS level is appropriate to quote for any one energycoefficient, since the pieces of contributing data come from many different sources andmay have a range of notional IFIAS levels. Consequently the practice of stating IFIASlevels has been dispensed with in this study
2.4 Existing Manual System for Computing Embodied Energy
Prior to developing a database to manage the information from energy analyses, anexamination was made of the manual method used to calculate embodied energycoefficients. While there are variations for each different material, the basic approachto gathering information is similar. The following description lists the steps used.
New Zealand Building Materials Embodied Energy Coefficients Database. Vol. II - Coefficients 5
Centre for Building Performance Research, Victoria University of Wellington
2.4.1 Material / Product.
The product or material is clearly defined. There may be several related materialsunder one sub-heading, such as the various types and strengths of concrete. There maybe outwardly similar materials from different sources or manufacturing processes, suchas aggregate from river or virgin rock sources, that need to be clearly differentiated.The necessary distinctions and categorizations sometimes do not become apparent untilsome of the further information is gathered.
The use of a particular material is noted, plus the usual method of assessing the quantityused in a building: by weight, volume or area. The attributes of a material are noted asappropriate: the density, coverage per unit, specific heat, insulation value, etc.
2.4.2 Who and How Much
The major and minor players in the field are identified. This may be nationally, suchas in the case of concrete production, or include international players, such as in thecase of steel production. Industry umbrella organisations, such as the Cement andConcrete Association, are useful sources of information and are noted. Governmentdepartments or agencies are sometimes sources of basic, and occasionally specific, data.The total national production and the total national usage are identified, either from anumbrella organisation, or from the totals of the industry players. The quantity ofmaterial or product supplied by each player is identified. With this information a choiceis made of which, or all, sources to sample for a process energy analysis.
The addresses and other contact details of all firms and organisations are recorded,along with who the contact person is within the organisation and who has given therequired information. The conditions under which the information is given are alsorecorded. Firms often require that the origin of their information is kept confidential,although this applies more to details of their manufacturing processes than informationon the state of the industry.
2.4.3 Composition
The process of manufacture and the constituent ingredients of the material areidentified. Some of these constituent ingredients will be other materials from the list,such as aggregate used in concrete. Many of the ingredients, while not buildingmaterials in their own right, will require a process analysis to be undertaken to establishtheir energy content, such as limestone quarrying in the production of cement (asdistinct from limestone as a dimension stone for construction purposes).
2.4.4 Manufacturing Process
The manufacturing process is detailed. This identifies the exact constituent ingredientsand the direct energy inputs. The plant and machinery required to produce the materialis also noted at this stage, in order to identify the capital equipment energy.
New Zealand Building Materials Embodied Energy Coefficients Database. Vol. II - Coefficients 6
Centre for Building Performance Research, Victoria University of Wellington
2.4.5 Inputs and their Values
The inputs are listed as the direct energy inputs and the energy of the constituentingredients. The energy value of the constituent ingredients is obtained from theappropriate source or calculated from available figures or calculated through a separateprocess analysis for that ingredient.
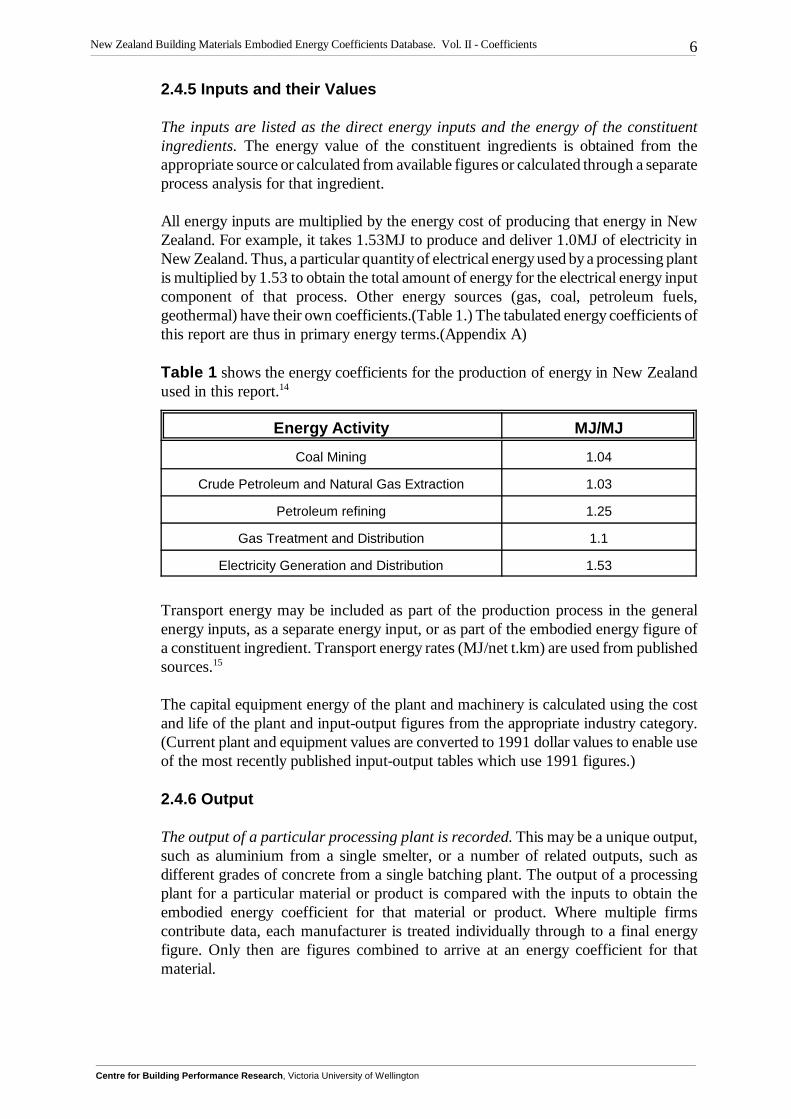
All energy inputs are multiplied by the energy cost of producing that energy in NewZealand. For example, it takes 1.53MJ to produce and deliver 1.0MJ of electricity inNew Zealand. Thus, a particular quantity of electrical energy used by a processing plantis multiplied by 1.53 to obtain the total amount of energy for the electrical energy inputcomponent of that process. Other energy sources (gas, coal, petroleum fuels,geothermal) have their own coefficients.(Table 1.) The tabulated energy coefficients ofthis report are thus in primary energy terms.(Appendix A)
Table 1 shows the energy coefficients for the production of energy in New Zealandused in this report.14
Energy Activity MJ/MJ
Coal Mining 1.04
Crude Petroleum and Natural Gas Extraction 1.03
Petroleum refining 1.25
Gas Treatment and Distribution 1.1
Electricity Generation and Distribution 1.53
Transport energy may be included as part of the production process in the generalenergy inputs, as a separate energy input, or as part of the embodied energy figure ofa constituent ingredient. Transport energy rates (MJ/net t.km) are used from publishedsources.15
The capital equipment energy of the plant and machinery is calculated using the costand life of the plant and input-output figures from the appropriate industry category.(Current plant and equipment values are converted to 1991 dollar values to enable useof the most recently published input-output tables which use 1991 figures.)
2.4.6 Output
The output of a particular processing plant is recorded. This may be a unique output,such as aluminium from a single smelter, or a number of related outputs, such asdifferent grades of concrete from a single batching plant. The output of a processingplant for a particular material or product is compared with the inputs to obtain theembodied energy coefficient for that material or product. Where multiple firmscontribute data, each manufacturer is treated individually through to a final energyfigure. Only then are figures combined to arrive at an energy coefficient for thatmaterial.
New Zealand Building Materials Embodied Energy Coefficients Database. Vol. II - Coefficients 7
Centre for Building Performance Research, Victoria University of Wellington
2.4.7 Prices
Where they are available, prices are recorded for retail, trade, factory gate (cost ofproduction) and for constituent ingredients. The date of these prices is also recorded.
2.4.8 Source, Age and Confidentiality of Data
The source of data is recorded in as much detail as possible: the company it has comefrom; if it is published data; the person who has made the data available. The date thedata was received and the time period the data relates to is also recorded. Theconfidentiality of data is specifically recorded and highlighted. The confidentialityrequirements of the data supplier are noted. For example, the data supplier may requirethat the source of the data is not revealed, or that the data is only used as a componentin a larger calculation which cannot be used to detect the source or details of the datasupplied.
2.4.9 Other Comparative Data
Available comparative data for materials from historical or overseas sources is noted.This data quite often comes to light during the researching of a material. The particularsof this data, such as the type of analysis used to produce it, are noted. All sources andthe age(s) of such data are noted.
2.5 Weighting of Data
Once data for a particular material has been collected there are often choices to bemade about conflicting data items. It is often necessary to choose one figure or set offigures over another, or to combine figures but to apportion them appropriately.Factors in the reliability or applicability of data used to produce an embodied energycoefficient for a particular building material include:
• The country of origin of the data• The country where a material or ingredient is produced• The size of the organisation producing the data• Political or market forces affecting the organisation producing the data• Market or other factors influencing the period in which the data was gathered• The relative size, within a New Zealand industry, of the organisation producing
the data• The completeness of the data• The completeness of records from which the data is drawn• The reliability of records from which the data is drawn• The age of the data• The relevance of the time period of the data• The consistency of time periods for different pieces of data• The level of detail of the data• The representativeness of the factory or plant producing the data
This is not an exhaustive list but indicates the factors that need to be considered inweighting, giving credence to or choosing one set of data over another. The ultimate
New Zealand Building Materials Embodied Energy Coefficients Database. Vol. II - Coefficients 8
Centre for Building Performance Research, Victoria University of Wellington
aim of the exercise is to produce results that most accurately reflect the current stateof production of a particular material for the whole of New Zealand, in terms of energyused. The decision about whether to include particular data is made by the researcherat each step of the analysis process. The question to be answered each time is: “Doesthis data accurately reflect, or is it likely to accurately reflect, the current New Zealandposition for this material, or is there other data available which would give a betterrepresentation of the position?” If there is better data available, within the resources tohand, it must be used.
There may be cases where data exists, without any other comparable or alternative databeing available, but because of the degree of uncertainty of its accuracy it should notbe used.
Clearly, data which represents a large majority of the output from a particular industryis likely to give a highly indicative energy coefficient for that particular material. Aproblem in sampling a large proportion of an industry, however, is that data collectionaccuracy is likely to vary more than data from a single carefully conducted sampling.Thus, one in-depth, specific and detailed sample can give a more reliable figure, evenwhen extrapolated out for an entire industry, than a wide series of samples with agreater average inaccuracy. The best result, given that time and resources are alwayslimited, may sometimes be obtained by having one very detailed sample coupled witha wide but less certain sample within an industry.
2.6 Value Ranges
Putting a percentage uncertainty figure on some of the data can be difficult. It is useful,however, to look at the range of the data and to make calculations using both the mostoptimistic and most pessimistic values at each step of the calculations to provide a‘High value, Low value’ range. This system has been used in this study. SimaPro havealso adopted this approach in their format.16
2.7 Influences on Energy Coefficients
Factors that have considerable bearing on the final energy coefficient are firstly whetherheat, and how much, is needed in the manufacturing process, followed by the amountof physical force needed in the manufacturing process. Transport, especially if it is byan efficient means such as sea transport tends to have only a small influence on the finalresult. Fuel type, internal wastage and efficiency of the manufacturing plant all havea noticeable, but usually rather less significant bearing on the final result.
2.8 Materials Requiring Information
At the start of this study a list was made of the New Zealand building materials thatwere either missing from the 1995 study or which required further upgrading, usuallybecause of reliance on overseas data. Clearly there are a very large number of buildingmaterials used in New Zealand and a much larger number of proprietary buildingproducts. It was evident that a selection needed to be targeted, although the finaloutcome of which materials it was possible to obtain sufficient data for was, and is,always uncertain. A target list of materials for which new or upgraded embodied energycoefficients would be desirable was drawn up. These were materials that relied

New Zealand Building Materials Embodied Energy Coefficients Database. Vol. II - Coefficients 9
Centre for Building Performance Research, Victoria University of Wellington
on at least some overseas data, or had deficiencies in the New Zealand source of thedata, or were notably absent from the materials listed in Alcorn(1995). The list is asfollows:
acrylic - polymethyl methacrylate - asphalt - masticbitumen fibre boardbutyl rubber - roofing membranecarpet - all typesceiling tilescement mortarceramic - vitreous chinaconcrete - polymer fibre reinforced,
pre-cast, roofing tile, steelfibre reinforced
copper wireearth, raw - rammed soil-cementfabrics - cotton, wool, syntheticsfastenersGRP - polyester glass fibre laminateglass - coated, double gazed, blocks,
figured, foamed, mirror,wired
insulation - wood wool panels,m i n e r a lwool, fibreglass, polyester
paper - recycled, wallplaster, gypsumplastics - ABS, polyester,polypropylenerubber - natural latex, syntheticsealants and adhesivesstainless steelsteel - imported sections,
galvanised straw - baledstraw - compressed straw panelstaps, and other plumbing productstimber - all typeszinc
2.9 Gaps in the Coefficients Table
The response rate to requests for information from manufacturers was noticeably lessfor the current study compared to 1995. The reduction in cooperation appears to be aresult of tighter operating conditions for manufacturers where fewer staff or less timeis available to obtain the necessary information. There was also a general warinessabout the commercial sensitivity of the information. This was not often backed up witha cogent reason, such as a specific competitor who may benefit from obtaining theinformation, but was simply a reticence to divulge information in a competitiveeconomic environment.
One significant material for which data could not be obtained because of “commercialsensitivity” was fibreglass insulation. Since insulation is used in the vast majority ofbuildings constructed in New Zealand, and has a significant bearing on the energyconsumed in operating a building, this is of considerable importance to an accurateunderstanding of the lifetime energy use of buildings.
In cases such as this overseas figures have to be relied on. Such overseas figures tendto be reasonably close to New Zealand figures for industries that have similarmanufacturing processes and energy sources. In general, however, figures from NewZealand manufacturers tend to be lower than overseas ones because of this country’seasy access to natural gas and coal and our heavy reliance on hydro generatedelectricity, which is less energy intensive to produce than fossil fuel generatedelectricity, a more common source in many other countries. While available overseasdata for fibreglass insulation production is likely to be similar to accurate New Zealanddata, it is quite likely that the overseas figure is inflating the energy picture for NewZealand produced fibreglass insulation.

New Zealand Building Materials Embodied Energy Coefficients Database. Vol. II - Coefficients 10
Centre for Building Performance Research, Victoria University of Wellington
3 FURTHER WORK
3.1 Updating of the Database
Information on specific building materials and assemblies continues to come to light ona regular basis. Data on the production of primary energy, input-output tables for thenational economy and surveys of various industries (transport, for example) becomeavailable from time to time. These all have a bearing on the energy coefficients ofbuilding materials. With the manual system that has been used up until now, it has beennecessary to recalculate each material whenever new data comes to light. The adoptionof the SimaPro computer database to manage the information means that each smallpiece of data can be inserted and the effects on all dependent materials areautomatically propagated throughout the database. This means that it is worthwhile tocollect small amounts of data or to devote small allotments of time, as it is available,to the database, as the results will be significant. With the previous manual system itwas necessary to devote large blocks of time and effort to get results that would beaccurate and have a significant bearing on the available list of coefficients.
With this database in place it is now appropriate to ask the question of how best to a) maintain and update the database; andb) publish the output of the database at regular, say 6 monthly, intervals.
3.2 Extending the Database into other Areas of Environmental Impact
By providing a strong framework for the data, SimaPro prompts the collection andupdating of appropriate energy data. The same strong framework, by providing a seriesof categories of other environmental impacts, prompts the collection of data useful notonly to an understanding of the energy use of buildings, but also to an understandingof the full environmental impact that buildings have over their lifetime. (See VolumeI, 2.3 Energy and LCA Analysis)
The categories of environmental effects for which SimaPro analyses materials andprocesses are:
Energy useGreenhouse gas emissionOzone layer depletionCarcinogen emissionPesticide emissionHeavy metals emissionSolid waste production
Summer and winter smogproductionEutrophication of soil and waterAcidification of soil and waterUse of raw materials
CO2 is probably the best target for future work. Obtaining the data necessary for itsinclusion into the embodied energy database would be relatively simple. This hasalready been done for some of the entries, where figures existed for certain processes.17
A detailed study of a portion of the timber industry enabled the inclusion of somedetailed emissions for some timber materials.18 This is the sort of data that would ideallybe collected for all materials.

New Zealand Building Materials Embodied Energy Coefficients Database. Vol. II - Coefficients 11
Centre for Building Performance Research, Victoria University of Wellington
There are two issues that need to be addressed when considering extension of thedatabase into environmental impacts beyond embodied energy. The first and mostsignificant is the weightings and priorities that will be included in the databasedescribing how each will be combined with all the other effects to produce a singleindex of environmental impact. The second issue is the collection of data on theseenvironmental impacts.
The weighting or significance of the categories of environmental impact for NewZealand would usefully form the subject of further research. The assumptions made andthe importance attributed to each category of environmental effect for the originalEuropean application of SimaPro cannot be safely applied to the New Zealand contextwithout thorough examination. A preferable course would be to establish, from theground up, a New Zealand database within SimaPro that used specific pieces ofinformation from the existing SimaPro European databases after they had been foundto be applicable to the New Zealand situation.
The collection of data in all fields of environmental impact could be undertakenforthwith, without the need to establish a weighting of environmental impacts. Theweightings could be developed simultaneously with the new data collection. Thedatabases that come with SimaPro should be seen as potentially valid sources ofinformation. Much of New Zealand’s plastic resin, for example, comes from Europe,and figures for it from the SimaPro databases, together with additional data such astransport inputs, could be directly applicable to the process record of plastics in NewZealand.
3.3 Example
Appendix C shows the example of gas fired kiln dried dressed softwood, a commonmaterial in New Zealand construction, used to illustrate how the SPOLD format withinthe SimaPro program stores and manages data, and the sort of manipulation andreporting from the data that can be undertaken. The full process record is provided,since the data for this material is not confidential to the CBPR, as it is contained in areport to BRANZ.18
The sort of graphical and numerical display shown could not be done without thedatabase program except by expending quantities of time and effort. Equally, thetraceability of the data and assumptions used in the background calculations areinherent attributes of the method.

New Zealand Building Materials Embodied Energy Coefficients Database. Vol. II - Coefficients 12
Centre for Building Performance Research, Victoria University of Wellington
4 Conclusion
The embodied energy coefficients database, now existing within the SimaProframework, is at a point where the next big step in establishing useful and widelyapplicable guidelines for environmentally responsible building, based on sound anddetailed knowledge, is ready to be taken. The SPOLD format used by SimaProprovides an internationally recognised format for the collection of data onenvironmental impacts. The full collection of data for all environmental impacts is likelyto be a large task but using SimaPro it may be tackled as resources permit. Ongoingdevelopment of the SimaPro program by its makers can be expected to further improvethe usability of the database. With these advances the uptake of the facility by thebuilding industry and wider New Zealand public can be anticipated. The exampleSimaPro “project” described in Volume I, section 4 shows for a standard house howthis data might be used by industry.
The potential value of the database to building specifiers and product and materialsmanufacturers is significant. With such a tool at their disposal manufacturers would beable to ascertain the downstream effects of alternative ingredients, in terms of energyinitially, and in full LCA terms given the necessary data collection. This is likely toprovide some with a worthwhile marketing lever. The ability to connect the publicinterest in minimising environmental impacts with a marketing potential for businesseshas the potential to precipitate environmentally beneficial changes in the New Zealandbuilding industry. It should give some companies within the industry the economicincentive to cater to public concern for the environment.
To fully exploit this potential in the SimaPro database will require the following discretepieces of work:i collection of environmental impact data for New Zealand building materials for
entry into the existing database structure (in the following priority order):a) CO2;b) Other greenhouse gases;c) Ozone depleting substances;d) Pesticides;e) Carcinogens;f) Smog generating substances;g) Solid waste, heavy metals emissions, eutrophication, acidification;
ii establishment of weighting factors by which a single index of environmentalimpact might be constructed from the data collected in (i) above;
iii creation of a set of standard building projects within SimaPro to facilitatecomparisons of alternate building constructions for houses, commercialbuildings etc. This work would use the earlier work of Baird and Chan (BIAChouse), Treleaven19 (5 storey commercial building) and Honey and Buchanan20
(timber buildings);iv exploration with the BIA of the feasibility of LCA performance specification
inclusion in the NZBC.
New Zealand Building Materials Embodied Energy Coefficients Database. Vol. II - Coefficients 13
Centre for Building Performance Research, Victoria University of Wellington
5 REFERENCES
1. Baird, G., and Chan, S.A., 1983. Energy Cost of Houses and Light Construction Buildings.School of Architecture, Victoria University of Wellington. NZERDC Report No. 76.Wellington.
2. Alcorn, Andrew, 1995. Embodied Energy Coefficients of Building Materials. Centre forBuilding Performance Research, Victoria University of Wellington, Wellington.
3. Bullard, Clark W., Penner, Peter S., Pilati, David A.,1976. Net Energy Analysis: Handbookfor Combining Process and Input-Output Analysis. Energy Research Group, Centre forAdvanced Computation, University of Illinois at Urbana-Champaign, Urbana, Illinois.
4. Forest Research Institute, 1994. Wood Processing Survey Results. New Zealand ForestResearch Institute, Rotorua.
5. Newby, M.,1995 Personal communications with M. Newby. Pacific Steel Limited, Auckland.
6. Alcorn, A., Baird, G., Haslam, P., 1997. The Energy Embodied in Building Materials -Updated New Zealand Coefficients and Their Significance. IPENZ Transactions, CivilEngineering Section, Volume 24, No. 1/CE, Wellington.
7. Noble, J., Clarke, R.B. and Naylor, T., 1976 Energy Use in the Kilning Drying and HeatCuring Industries. NZERDC Report No.11.University of Auckland, Auckland.
8. Dawson, S.M., 1978 Energy Requirements of Inputs to Agriculture in New Zealand.NZERDC Report No.41.University of Auckland, Auckland.
9. Department of Statistics, 1991. Inter-Industry Study of the New Zealand Economy 1986-87.Department of Statistics, Wellington
10. Statistics New Zealand, 1995. Inter Industry Transaction Study At The 80 Industry Levelfor 1991. Prepared for Victoria University. Statistics New Zealand, Wellington.
11. Pullen, Stephen, 1995. Master of Building Science Thesis. Submitted to Department ofArchitecture, University of Adelaide, Adelaide.
12. Treloar, Graham, 1996. The Environmental Impact of Construction - A Case Study.Monograph, Australia and New Zealand Architectural Science Association, Sydney.
13. I.F.I.A.S., 1975. Workshop on Energy Analysis and Economics. Workshop Report 9,International Federation of Institutes for Advanced Study, Stockholm.
14. Baines, J.T., Peet, N.J., 1995. 1991 Input-Output Energy Analysis Coefficients. TaylorBaines and Associates, Commissioned by CBPR, Wellington
15. Collins, Chris, 1993. Transport Energy Management Policies: Potential in New Zealand.Energy Efficiency and Conservation Authority, Wellington.
16. Pré Consultants B.V., 1997. SimaPro Program Reference. Pré Consultants B.V., Amersfoort.
17. Baines, J.T. (Ed.), 1993. New Zealand Energy Information Handbook: Energy Data,Conversion Factors, Definitions. Taylor Baines and Associates, Christchurch.

New Zealand Building Materials Embodied Energy Coefficients Database. Vol. II - Coefficients 14
Centre for Building Performance Research, Victoria University of Wellington
18. Gifford, John, Ford-Robertson, Justin, Robertson, Kimberly, Hall, Peter, 1998. Life CycleAssessment of Sawn Lumber: Inventory Analysis. New Zealand Forest Research InstituteLtd., Rotorua.
19. Treleaven, C. D., 1993. The Embodied Energy Content and Thermal Performance ofCommercial Office Type Low Rise Multi Storey Buildings Constructed from a Range ofBuilding Materials. Diploma of Environmental Studies, Research Report, Victoria Universityof Wellington, Wellington.
20. Honey, Brian G., Buchanan, Andrew H., 1992. Environmental Impacts of the New ZealandBuilding Industry. Research Report 92/2, Department of Civil Engineering, University ofCanterbury, Christchurch.

New Zealand Building Materials Embodied Energy Coefficients Database. Vol. II - Coefficients 15
Centre for Building Performance Research, Victoria University of Wellington
Victoria University of Wellington Document Register 3.61School of Architecture
LOGO OR ACRONYM
CBPR Centre for Building PerformanceResearch(CBPR Report Series)
RECIPIENT'S REF/CODE85055
AUTHOR'S REF/CODER 346
TITLENew Zealand Building Materials EmbodiedEnergy Coefficients DatabaseVolume II - Coefficients
SERIES TITLECentre for Building Performance ResearchReport
SPONSOR'S REF/CODE85055
REPORT DATENovember 1998
AUTHORAndrew Alcorn, Peter Wood
ISSN/ISBN NUMBERISSN 1172-563XISBN 0-475-50017-2
AUTHOR ORGANISATIONCentre for Building Performance Research,Victoria University of Wellington,P.O. Box 600, Wellington, New Zealand
DISTRIBUTIONSponsor.
SPONSORING ORGANISATIONBuilding Research Association of NewZealand,Moonshine Rd, Judgeford,Wellington.
-report available from:
Sponsor organisation
KEYWORDSenergy, embodied energy, building materials,energy intensity, environmental impact,building construction, life cycle, life cycleassessment, materials, construction,SimaPro
ENQUIRES/COMMENT TO: Director, Centre forBuilding PerformanceResearch,Victoria University ofWellington,P.O. Box 600,Wellington, N.Z.
PAGES: 66
ABSTRACTThe aim of the project was to generate extended and upgradedlistings of the embodied energy coefficients of building materialsused in New Zealand, and to provide a computer database tomanage this information. A process-based hybrid analysis method ofenergy analysis was used for this study. The updated listings ofenergy coefficients for some building materials are tabulatedalphabetically in units of MJ per kg, and in MJ per m3.
Figures, Tables & References provided

New Zealand Building Materials Embodied Energy Coefficients Database. Vol. II - Coefficients 16
Centre for Building Performance Research, Victoria University of Wellington
SUPPLEMENTARY NOTES
November 1998 REPRODUCTION OF COMPLETED PAGE IS AUTHORISED
DISCLAIMER
The best efforts of the author and publisher have been applied to the preparation of this report, however, neither author norpublisher make any warranty of any kind, expressed or implied, with regard to the information contained in this report. Nowarranty is made as to the accuracy, completeness or usefulness for any particular purpose of the information. No liabilityis accepted for any loss or damage, however caused, arising from reliance on or use of any information or arising from theabsence of information or any particular information in this report.

Centre forBuildingPerformanceResearch
Published by: Centre for Building Performance Research, Victoria University of Wellington, P.O. Box 600, Wellington, New Zealand Telephone (64)(4) 802 6200 Facsimile (64)(4) 802 6204 [email protected]