central tendency. overview central tendency is a statistical measure that identifies a single...
Post on 19-Dec-2015
226 views
TRANSCRIPT

Central TendencyCentral Tendency
OverviewOverview Central tendency is a statistical
measure that identifies a single score as representative on an entire distribution. The goal of central tendency is to find the single score that is most typical or most reprehensive of the entire group.

THE MEANTHE MEAN
The mean for a distribution is the sum of the scores divided by the number of scores.
The formula for population is :-
Sample mean =
X∑
Nμ =
X∑
nX =

THE WEIGHED MEANTHE WEIGHED MEAN often in necessary to combine two
sets of scores and then find the overall mean for the combined group.
The solution to this problem is straightforward if you remember the definition of the mean :
X∑
nX =

Computing The Mean From A Computing The Mean From A Frequency Distribution TableFrequency Distribution Table
Table 3–1 : statistics quiz scores for a section of π = 8 students.
QUIZ (X) SCORE
109876
ƒ
12401
ƒX
10183206

Characteristics Of The MeanCharacteristics Of The Mean
1- Changing a score or introducing a new score changing the value of any score will change the mean. For example , the quiz scores for psychology lab section consist of
9, 8, 7, 5, and 1 The mean for this sample is
=X∑
nx
55
30=
5= 6.00

Characteristics Of The MeanCharacteristics Of The Mean
2- Adding or subtracting a constant from each score.
Table 3.2 amount of food (in grams) consumed during baseline session.
RAT'S IDENTIFICATION AMOUNT (X) A 6 B 3 ∑X= 26
C 5
D 3 n=6 E 4
F 5 X=4.33

Characteristics Of The MeanCharacteristics Of The Mean
3- Multiplying or dividing score by a constant If every score in a distribution is multiplied by a constant value, the mean will be changed in the same way.

THE MEDIANTHE MEDIAN
The median is the score that divides a distribution exactly in half.
13579
MEDIANMEDIAN

THE MODETHE MODE
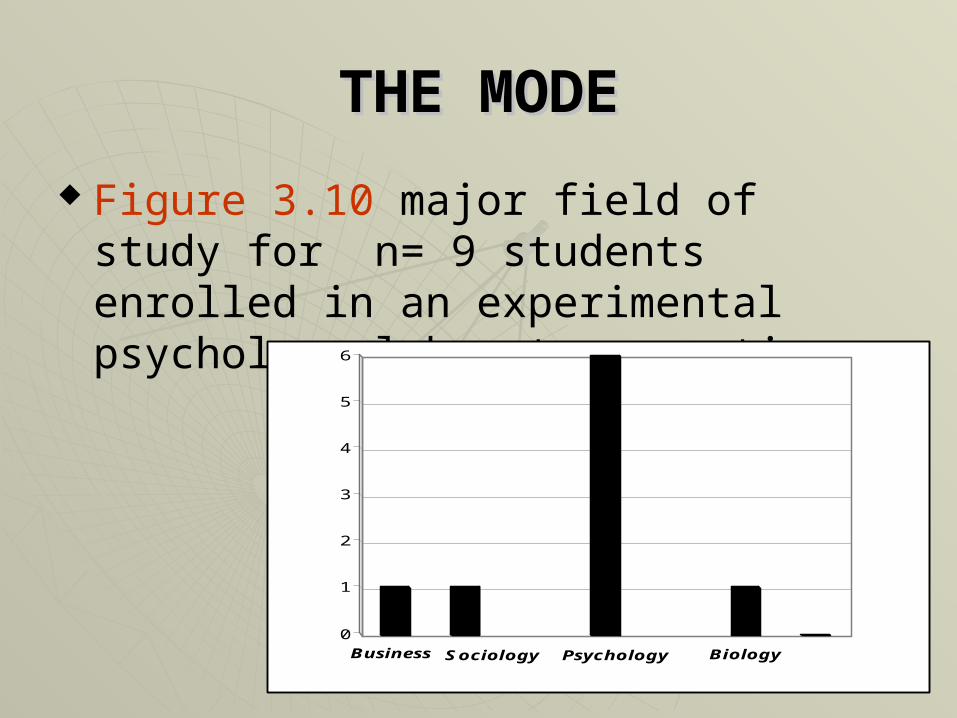
The mode is the score or category that has the greatest frequency .

THE MODETHE MODE
Figure 3.9Figure 3.9 the relationship between the relationship between time of day and number of fish time of day and number of fish caught.caught.
12345678910111213141516012345678910
Frequency
Noon Tim of day
THE MODETHE MODE
Figure 3.10 major field of study for n= 9 students enrolled in an experimental psychology laboratory section.
Business
Sociology Psychology Biology
0
1
2
3
4
5
6

CENTRAL TENDENCY AND THE SHAP OF THE DISTRIBUTION
Figure 3.16 measures of central tendency for three symmetrical distributions: normal, bimodal, and rectangular.
Symetrical Distribution
mode modemeanmedian
Symmetrical distributuon
medianmode
mean

CENTRAL TENDENCY AND THE SHAP OF THE DISTRIBUTION
Figure 3.17 measures of central tendency for skewed distributions.
Skewed distribution
Negative Skew
Skewed distribution
Positive skew
medianmea
nmod
e
meanmedia
nmode