central research library document collection …
TRANSCRIPT

ORNL-3480 UC-34 - Physics
SOLID STATE DIVISION
ANNUAL PROGRESS REPORT
FOR PERIOD ENDING MAY 31, 1963 "
I CENTRAL RESEARCH LIBRARY DOCUMENT COLLECTION
DO NOT TRANSFER TO ANOTHER PERSON If you wish someone else to see this document, send in name with document and the library vlll arrange a loam.
I
LIBRARY LOAN COPY ,
UNION CARBIDE CORPORATION for the
U.S. ATOMIC E N E R G Y COMMISSION1

ORNL-3480
Contract No. W-7405-eng-26
SOLID STATE DIVISION
ANNUAL PROGRESS REPORT
For Period Ending May 31, 1963
D. S. Billington, Director J. H. Crawford, Jr., Associate Director
DATE ISSUED
OAK RIDGE NATIONAL LABORATORY Oak Ridge, Tennessee
operated by UNION CARBIDE CORPORATION
for the U. 5. ATOMIC ENERGY COMMISSION


Table of Contents and Summary
PART 1. THEORY
1. STUDIES ASSOCIATED WITH THE THEORY OF RADIATION DAMAGE
COMPUTER STUDIES O F T H E SLOWING DOWN OF ENERGETIC ATOMS IN CRYSTALS M. T. Robinson and 0. S. Oen ........................................................................................................................................ 3
Computer s tud ies of the slowing down of energetic atoms in c rys ta l s have predicted that penetrat ions will depend on the crystallographic orientation of the incident par t ic les , an effect which h a s recently been confirmed experimentally. Calculat ions for fcc, bcc, and diamond s t ructures a l l show the importance of channeling in the slowing down of energetic primaries.
RANGES OF ENERGETIC ATOMS IN SOLIDS FOR A THOMAS-FERMI P O T E N T I A L 0. S. Oen and M. T. Robinson ........................................................................................................................................ 5
A Thomas-Fermi p'otential h a s been used to calculate the ranges of atoms having energies from 1 to 100 kev T h e calculated ranges are shorter than those found for a Bohr screened Coulomb
The Thomas-Fermi resu l t s give a somewhat c loser fi t to experimental data although most data lie be- slowing down in a random solid. potential. tween the calculated range curves for these two potentials.
SELF- ANNEAL O F FRENKEL PAIRS I N LARGE RAD1 ATION-INDUCED DISPLACEMENT CASCADES G. Leibfr ied and D. K. Holmes ...................................................................................................................................... 6
The fraction of defec ts in a cascade which anneal because of mechanical instability is calculated as a func- tion of increasing defect density, assuming a fixed s i z e for the annealing volume.
EFFECT O F CHANNELlNG ON DISPLACEMENT-CASCADE THEORY 0. S. Oen and M. T. Robinson ........................................................................................................................................ 6
Channeling of energetic atoms in crystal lat-
t i c e s reduces the number of displaced atoms in a cascade, s ince channeled atoms tend to d iss ipa te their energy in subthreshold collisions.
Abstract of published paper: Appl. Phys . Le t ters 2, 83 (1963).
LONG-RANGE CHANNELING E F F E C T S IN IRRADIATED CRYSTALS C. Lehmann and G. Leibfried ........................................................................................................................................ 7
The range distribution of energetic atoms traveling along channels between atomic chains i n c rys ta l s is calculated analytically. Numerical resul ts are given for copper atoms in copper. From an adequate ana lys i s of experimental da ta on long ranges of primaries, shot onto crystals in low-indexed directions, information can b e obtained about the interatomic potential at d i s tances of about half the la t t ice spacing.
Abstract of paper to be published in the loumal o/ Appl i ed P h y s i c s .
... 111

iv
HIGHER-ORDER MOMENTUM APPROXIMATION IN CLASSICAL COLLISION THEORY C. Lehmann and G. Leibfr ied ........................................................................................................................................ 7
The classical small-angle scat ter ing for repulsive Higher-order approximations g ive cr i ter ia for convergence
Power potent ia ls , the exponentially screened Coulomb potential, a purely expo- T h e quantum mechanical l i m i t s of t h i s classical treatment
Abstract of published paper: 2. P h y s i k 172, 465 (1963). central potent ia ls is treated as a perturbation problem. and an est imate of the accuracy. nential potential, and cutoff potent ia ls are discussed. are investigated.
2. THEORY OF ELECTRON STATES
E F F E C T O F A LARGE MAGNETIC F l E L D ON T H E FERMI L E V E L O F A M E T A L J. H. Barrett ...................................................................................................................................................................... 8
A calculation h a s been made of the shift of the Fermi leve l by a large magnetic field and the change t h i s I t is shown that the effect is likely to be observable for bismuth in a 100- c a u s e s in the magnetic susceptibility.
ki logauss field.
BOUNDARY DEGENERACIES IN B RI LLOUIN ZONES H. C. Schweinler .............................................................................................................................................................. 9
When several points of the boundary of an extended Brillouin zone are (a) congruent (in respec t to the Iat t ice translations) to the s a m e point of the reduced zone, (b) on the same sphere about the origin, but (c ) not re la ted to one another by the rotations of the point group, a new type of degeneracy of energy sur faces ar ises .
E F F E C T O F CORRELATlON ON T H E HYPERFINE INTERACTION I N LITHIUM K. F. Berggren and R. F. Wood ...................................................................................................................................... 10
It is shown that a well-correlated wave function can give a very good value of the hyperfine interaction i n atomic lithium. I t is shown that the usual interpretation of the resu l t s obtained for lithium with the unrestricted Hartree-Fock method is not entirely acceptable .
Abstract o f published paper: Phys. Rev. 130, 198 (1963).
3. STUDIES ON DEFECTS IN IONIC CRYSTALS
EXCITED STATES OF T H E F-CENTER R. F. Wood ........................................................................................................................................................................ 11
T h e F-center e lectronic wave function is expressed in the linear combination of atomic orbi ta ls approxima- The atomic orbi ta ls used a re those usually assoc ia ted with the conduction band of the perfect crystal (e.g.,
Exci ted s t a t e s of symmetries other than tha t usual ly assoc ia ted tion. the 2s and 2p lithium orbi ta ls in the case of LiCI). with opt ical t ransi t ions are found. The K-band h a s not been found thus far.
ELECTRONIC STRUCTURE O F T H E M-CENTER A. Meyer and R. F. Wood ................................................................................................................................................ 12
The as- Electronic propert ies of the M-center in LiCl are calculated in the Heitler-London approximation. sumptions of t h e calculat ions are discussed, and resu l t s are presented and compared with experiment.
.

V
PART II. CRYSTAL PHYSICS
4. X-RAY DIFFRACTION
ANOMALOUS TRANSMISSION OF X RAYS IN COPPER CRYSTALS M. C. Wittels, F. A. Sherrill, and F. W. Young, Jr. .................................................................................................... 17
Publ ished in Appl. Phys. Let ters 2, 127 (1963). X rays were anomalously transmitted i n nearly perfect copper c rys ta l s up to 1.3 mm thick. Photographs taken of t h i s phenomenon apparently reveal individual imperfections.
V E R T I C ALL Y RO T A T I N G DO U BL E- C R Y ST A L X- R A Y SP EC T R OM E T E R M. C. Wittels, F. A. Sherrill, and A. C. Kimbrough .................................................................................................... 20
Summary of a paper to b e presented at the 13th Annual Conference on Applications of X-Ray Analysis, Denver, Colorado, August 8, 1963. A versat i le instrument used in x-ray line-width measurements in ten ths of seconds h a s been developed. It is also useful for Borrmann studies.
X-RAY L l N E WIDTHS O F NEARLY PERFECT COPPER CRYSTALS M. C. Wittels, F. A. Sherrill, and F. W. Young, Jr. .................................................................................................... 22
By means of the double-crystal technique, x-ray l ine half-widths as small as
T h i s i s in c lose agreement with the predicted value for a perfect crystal Submitted for publication.
3.0 s e c have been measured in copper. using the Darwin theory.
GRAPHITE-STORED ENERGY IN T H E OGR M.C.Wittels .................................................................................................................................................................... 2 5
T h e resu l t s of the 1962 annealing operation of the ORNL Graphite Reactor are shown and compared with the two previous annealing programs.
5. ELECTRON MICROSCOPY
FISSION TRACKS IN SINGLE CRYSTALS O F UO, T. S. Noggle ...................................................................................................................................................................... 29
Summary of a paper to be presented at 21st Annual Meeting of the Electron Microscope Society of America, The observation of f i ss ion t racks i n s ingle c rys ta l s of U 0 2 resu l t s from Denver, Colorado, August 28-31, 1963.
diffraction contrast effects and occurs only in the surface region of the crystals.
THIN FILMS AND FOILS T. S. Noggle ...................................................................................................................................................................... 3 1
Studies to evaluate the parameters affect ing fission-track registration in thin films and preliminary s tudies Examples of high-resolution micrographs obtained with a of thin foi ls of Cu-15 at. 7% Al and of Cu are described.
new electron microscope are given.
STRUCTURE O F VAPOR DEPOSITS Derek Walton .................................................................................................................................................................... 33
Expressions are derived for the number of par t ic les of Abstract of a paper to b e submitted for publication. deposit formed during condensation of a vapor onto an inert substrate.

vi
COMMENT ON "FORMATION CONDITIONS OF THIN EPITAXIAL GERMANIUM FILMS ON SINGLE CRYSTAL SUBSTRATES" BY B. W. SLOOPE AND C. 0. T I L L E R
Derek Walton .................................................................................................................................................................... 33
A theoretical expression for the epi taxial tem- Submitted for publication in the /ournu1 of Applied Physics. perature i s shown to be in reasonable agreement with experimental data.
6. SPIN RESONANCE
ELECTRON SPIN-LATTICE RELAXATION AT D E F E C T SITES: E 'CENTERS I N SYNTHETIC QUARTZ AT 3 KILO-OERSTEDS
J. G. Cast le , Jr., R. A. Weeks, D. W. Feldman, and P. G. Klemens ........................................................................ 35
Abstract of published paper: Phys. Rev. 130, 577 (1963). The temperature dependence of the spin-lattice The dominant feature of the Raman re- relaxation time of the E ; and E ; centers was measured from 250 to 1.3OK.
laxation is a temperature variation of about T3, which is much slower than expected by s tandard theory.
DIRECT F I E L D E F F E C T S IN T H E HYPERFINE SPECTRA O F A PARAMAGNETIC DEFECT IN QUARTZ: T H E E ; CENTER
R. A. Weeks ...................................................................................................................................................................... 35
The observation of a hyperfine interaction with a paramagnetic center i n COG' gamma-ray-irradiated synthet ic quartz h a s been found to be the c a s e in which the quantizing field at the nucleus, from which t h e interaction a r i ses , is the laboratory field and not the field due to the paramagnetic center.
EFFECTS O F IRRADIATION ON POLARIZATION CURRENTS I N GLASS R.A.Weeks ...................................................................................................................................................................... 38
Additional support for the hypothesis that the polarization currents in several g l a s s e s are ohmic in character h a s been adduced. T h e peak i n the enhancement of the polarization currents a s a function of CoGo gamma-ray d o s e h a s been verified. T h e d a t a are interpreted as an indication that the peak is primarily attributable to those polariza- tion processes with the largest character is t ic times.
7. SUPERCONDUCT1 VI TY
LONGITUDINAL CRITICAL CURRENTS I N COLD-DRAWN SUPERCONDUCTING ALLOYS S. T. Sekula, R. W. Boom, and C. J. Bergeron ............................................................................................................ 41
Anomalous longitudinal cr i t icaI currents A single-layer force-free toroid was constructed i n
Hel ical current flow i s suggested as an explanation of t h e
Abstract of published paper: Appl. Phys. Letters 2, 102 (1963). were observed in several cold-drawn superconducting samples. light of these data, but the resul t was ,inconclusive. critical-current behavior.
SMALL SUPERCONDUCTING MAGNET WITH HOMOGENEOUS F I E L D R. H. Kernohan, S. T. Sekula, P. G. Huray, and J. B. Sanders ................................................................................ 42
A uniform-field superconducting solenoid h a s been constructed for u s e in low-temperature magnetic meas- T h e maximum field at ta inable is 11 kilo-oersteds, and axial field measurements ind ica te agreement with urements.
design calculations.

. . .
vii
MAGNETIZATION STUDIES O F SUPERCONDUCTORS S. T. Sekula, R. H. Kernohan, a n d P . G. Huray .......................................................................................................... 43
Hysteretic effects and a long Critical-current behavior is to be examined
Magnetization curves for superconducting al loys a re now being obtained. superconducting tail are prominent features of the cold-drawn materials. for correlation with the magnetic transition.
CRITICAL CURRENTS IN Nb-Zr ALLOYS R. W. Boom, S. T. Sekula, and C. J. Bergeron ............................................................................................................ 44
Resul t s of t e s t s on Nb-Zr a l loys in high magnetic f ie lds are Abstract of a paper submitted for publication. presented. The behavior of t e s t solenoids in external f ie lds is also given, and several inferences are discussed.
PART 111. METALS
8. INVESTIGATIONS OF METAL SURFACES
F. W. Young, Jr., L. D. Hulett, Ugo Bertocci, L. H. Jenkins , and J. R. Savage
GROWTH O F COPPER CRYSTALSOF LOW DISLOCATION DENSITY ........................................................................ 49
The growth direction of c rys ta l s grown by the Bridgman technique was random for ident ical growth condi- tions, but the dislocation densi ty was an inverse function of the angular deviation of the growth direction from the (111) zone. Ef fec ts of thermal s t r e s s e s during both seeded and unseeded growth are a l so discussed.
ANOMALOUS TRANSMISSION X-RAY TOPOGRAPH O F A COPPER CRYSTAL ........................................................ 49
Methods of crystal prep,aration and handling are discussed, and the resu l t s obtained a s well as the conclu- s ions which can b e drawn concerning dis locat ions and other structural features are pointed out in some detail.
T H E ROLE O F CRYSTAL IMPERFECTIONS I N T H E CHEMICAL REACTIVITY OF COPPER SURFACES ........ 5 1
Abstract of paper to be published in the Proceedings of the ASM-AIME Symposium, Oc t . 27-28. 1962, N e w Yo&. The poss ib le role of crystal imperfections, particularly dislocations, i n the nucleation of s t e p s is reviewed, and the k ine t ics of the growth of e tch p i t s at dis locat ions on (111) surfaces i s presented. Resul t s are interpreted in terms of kinematic dissolution theory.
KlNETICS OF LEDGE FORMATION AND MOTION .......................................................................................................... 51
Effec ts of crystal geometry on the formation and motion of ledges on copper sur faces 0 to 2'removed from Preliminary resu l t s on the effects of solution composition and dissolut ion rate are included. the ( I l l ) are reported.
FORMATION O F ELECTROCHEMICAL ETCH P I T S ON T H E I l l I ) FACE O F COPPER ........................................ 5 3
Abstract of paper submitted to the journal o/ the Electrochemical Society . The influence of current density, solution composition, and s l ight misorientations of the surface from the (111) on the formation of e tch p i t s at dis- locat ions have been studied.
SURFACES O F COPPER CRYSTALS AT CHEMICAL EQUILIBRIUM I N SOLUTlONS CONTAlNlNG COPPER .................................................................................................................................................................................. 5 3
To explain the development of face ts on only a portion of a spherical crystal exposed to coppercontaining solutions, equilibration experiments were conducted. Resul t s are d iscussed i n terms of re la t ive s tabi l i ty of orienta- t ions and differences in exchange current density.

... V l l l
ANODIC DISSOLUTION OF COPPER SINGLE CRYSTALS I N SOLUTIONS CONTAINING COPPER. . .................... 5 5
Current and potential re la t ions are used to explain the roles of iodide and bromide in the formation of etch p i t s on the (111) and a l so to determine exchange current dens i t ies on various orientations. -
9 . LOW-TEMPERATURE IRRADIATION STUDIES
R. R. Coltman, C. E. Klabunde, D. L. McDonald, J. K. Redman, and G. F. Fielder
NEW LOW-TEMP ERATURE IRRADIATION FACILITY .................................................................................................... 57
Construction of a new low-temperature irradiation facility located a t the Bulk Shielding Reactor is near completion. The thermal-neutron flux i s 2.5 x 1 0 l 2 neutrons cm s e c . The heat capaci ty of the new refrigera- tion system is at l e a s t 20 w at 3.6OK. T e s t s on a mockup of a proposed converter tube, which produces a f iss ion neutron flux of 6 x 10 lo neutrons
- 2 - 1
sec- and needs no external cooling, are satisfactory.
LOW-TEMP ERATURE IRRADIATION OF BERYLLIUM O X I D E .................................................................................... 6 3
Publ ished paper by D. L. McDonald: Appl. P h y s . L e t t e r s 2, 175 (May 1, 1963). By the u s e of thermal con- ductivity measurements, considerable recovery below room temperature is seen in B e 0 after neutron irradiation a t 100°K.
10. ELASTICITY AND ANELASTICITY STUDIES
DOSE DEPENDENCE OF T H E DISLOCATION BREAKAWAY STRESS IN NEUTRON-IRRADIATED COPPER AS MEASURED BY AMPLITUDE-DEPENDENT INTERNAL FRICTION
D. 0. Thompson and V. K. Pare' .................................................................................................................................... 65
Measurements of amplitude dependence of internal friction in irradiated copper were made in order to obtain T h e dose de- information on the s t r e s s necessary to break dis locat ions away from radiation-defect pinning points.
pendence of the breakaway s t r e s s was found to b e similar to the d o s e dependence of radiation hardening.
FINITE-AMPLITUDE ULTRASONIC WAVES I N SOLIDS D. 0. Thompson and M. A. Breazeale .......................................................................................................................... 68
A large-amplitude ultrasonic wave is propagated in the sample. Because of the non-Hooke's-law nature of the medium at finite amplitudes, harmonics of t h i s wave are generated a s the wave progresses. Measurement of the fundamental and the second harmonic component have been made in polycrystalline aluminum. A theoretical ana lys i s of the problem should give quantitative information about the third-order e las t ic cons tan ts of the solid.
A technique h a s been developed for observing third-order e las t ic i ty i n solids.
11. AI+ ION BOMBARDMENT OF METAL SURFACES
A. L. Southern and D. R. Burrowbridge ........................................................................................................................ 72
Atom-ejection pat terns Pa t te rns obtained from ei ther cadmium or magnesium did
Mass and energy ana lyses are reported on the
Yield measurements were made on additional or ientat ions of monocrystalline copper. were obtained for the three low-index p lanes of CujAu. not show structure.
A dual-beam m a s s spectrometer was received and installed. posi t ive ions ejected from two copper monocrystals.
L

. .
ix
PART IV. NONMETALS
12. SEMICONDUCTOR STUDIES
EFFECT OF DISORDERED REGIONS ON Co60 PHOTON-INDUCED DEFECTS IN GERMANIUM J. W. Cleland, R. F. Bass , and J. H. Crawford, J r ..................................................................................................... 79
The apparent p-type carrier concentration and acceptor level position of Co60 photon-irradiated germanium samples are shown to be dependent on the number of fast-neutron-induced disordered regions.
PHOTON-/ NDUCED LATTICE- DEFECT INTRODUCTION RATES I N SEMICONDUCTING MATERIALS J . W. Cleland and R. F. B a s s ........................................................................................................................................ 80
The calculated and observed ratio of defect introduction ra tes is compared for several semiconducting ma- ter ia ls for five different incident photon energies.
NEUTRON-INDUCED LATTICE-DEFECT INTRODUCTION RATES IN GERMANIUM AND SILICON J. W. Cleland and R. F. B a s s ........................................................................................................................................ 8 1
T h e apparent ra te of introduction of lattice defec ts in G e and Si w a s obtained af ter thermal, f iss ion spec- trum, and monoenergetic neutron irradiations.
DEVELOPMENT OF A COMPOSITE DEFECT IN GAMMA-IRRADIATED GERMANIUM BY ANNEALING J ay C e e Pigg .................................................................................................................................................................... 84
The 0.09-ev leve l previously reported in gamma-irradiated germanium has been studied to attempt to identify Current d a t a indicate that t h i s leve l may be assoc ia ted with an oxygen-vacancy the center that is responsible.
complex.
DEFECT PRODUCTION AND ANNEALING I N n-TYPE GERMANIUM J ay Cee Pigg .................................................................................................................................................................... 8 4
The rate of defect production in gamma-irradiated n-type germanium is observed to be a function of the im- purity concentration of the sample studied.
KINETICS OF ANNEALING AND COMPLEX FORMATION IN GAMMA-IRRADIATED n-TYPE GERMANIUM J a y C e e Pigg and J. H. Crawford, Jr. .......................................................................................................................... 86
The analysis of the annealing kinet ics of gamma-irradiated n-type germanium h a s been extended, subject to the assumption that the energy leve ls of the vacancy are not appreciably different in number and position from those of the SbV complex. T h i s ana lys i s yields an activation energy for vacancy motion of 0.75 ev and a binding energy for the SbV complex of 0.55 ev.
RADIATION EFFECTS IN CADMIUM SULFIDE (PART I ) J. W. Cleland and R. F. B a s s ........................................................................................................................................ 88
T h e apparent removal ra te of conduction electrons i n n-type CdS was obtained a s a function of CoG0 photon and thermal-neutron irradiations.
RADIATION E F F E C T S I N CADMIUM SULFIDE ( P A R T I I ) R. 0. Chester .................................................................................................................................................................... 89
In undoped CdS crystals , CoG0 gamma rays produce a carrier introduction rate of 0.006 electron per absorbed Hall d a t a indicate that a number of shal low leve ls photon as well as a marked increase i n photoconductivity.
probably account for these effects.
MINORITY CARRIER TRAPS IN GAMMA-IRRADIATED, ARSENIC-DOPED GERMANIUM 0. L. Curtis, Jr., and J. H. Crawford, Jr. .................................................................................................................... 90
Arsenic-doped germanium i s shown to develop minority carrier t raps on annealing after CoG0 gamma irradia- tion. Invest igat ions of annealing of both minority carrier t raps and recombination centers are described.
X
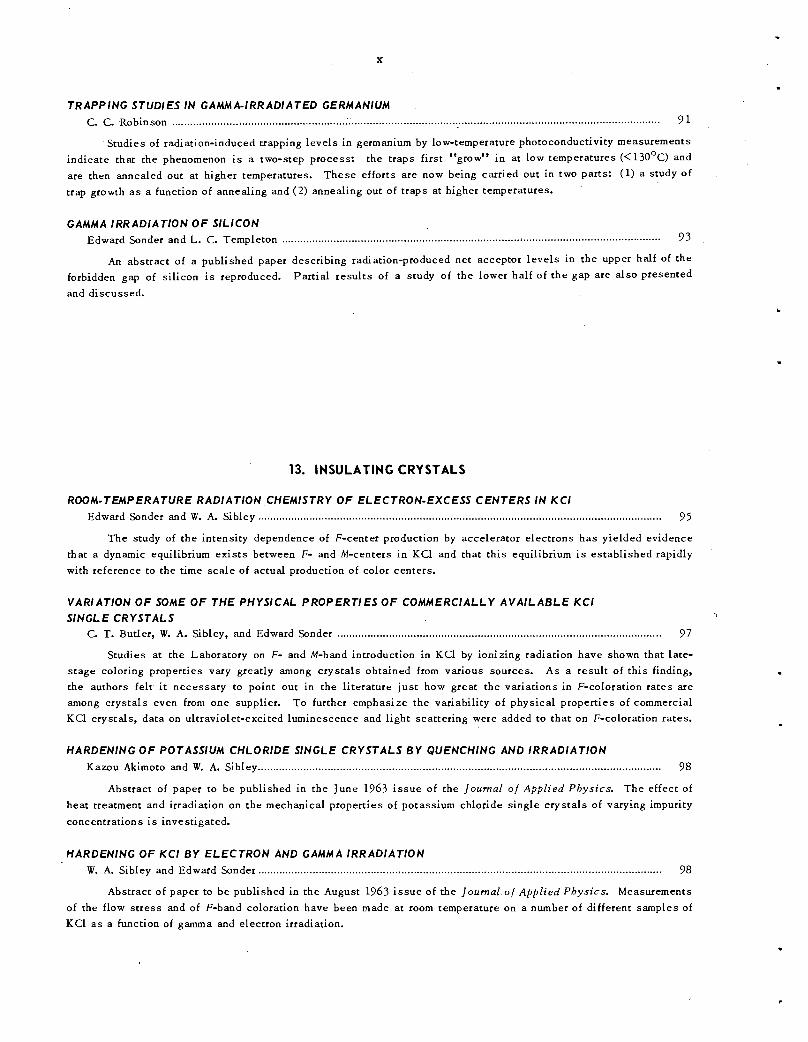
T R APP ING ST UDI ES IN G AMM A-I RR AD/ AT ED GERM AN IUM C. C. Robinson ................................................................................................................................................................ 9 1
Studies of radiation-induced trapping leve ls in germanium by low-temperature photoconductivity measurements the t raps f i rs t “grow’* in a t low temperatures (<13OoC) and
T h e s e e f for t s are now being carried out in two parts: (1) a study o f indicate that the phenomenon i s a two-step process: are then annealed out at higher temperatures. trap growth a s a function of annealing and (2) annealing out of t raps a t higher temperatures.
.
GAMMA I RR ADlATlON 0 F SILICON Edward Sonder and L. C. Templeton ............................................................................................................................ 93
An abstract o f a published paper describing radiation-produced net acceptor l e v e l s in the upper half of the Par t ia l resu l t s of a ‘study of the lower half of the gap are a l so presented forbidden gap of s i l icon is reproduced.
and discussed.
13. INSULATING CRYSTALS
ROOM-TEMPERATURE RADIATION CHEMISTRY OF ELECTRON-EXCESS CENTERS IN KCI Edward Sonder and W. A. Sibley .................................................................................................................................... 95
The study of the intensi ty dependence of F-center production by accelerator e lectrons h a s yielded evidence that a dynamic equilibrium e x i s t s between F- and M-centers i n KC1 and that t h i s equilibrium is es tab l i shed rapidly with reference to the time s c a l e of actual production of color centers.
VARIATION OF SOME OF T H E PHYSICAL PROPERTIES OF COMMERCIALLY AVAILABLE KCI SINGLE CRYSTALS 1
C. T. Butler, W. A. Sibley, and Edward Sonder .......................................................................................................... 97
Studies a t the Laboratory on F- and M-band introduction in KC1 by ionizing radiation have shown that late- s tage coloring properties vary greatly among crys ta l s obtained from various sources. As a resu l t of t h i s finding, the authors felt i t necessary to point out in the l i terature jus t how great the var ia t ions in F-coloration ra tes are among crys ta l s even from one supplier. To further emphasize the variability of physical propert ies of commercial KCl crystals , data on ultraviolet-excited luminescence and l ight scat ter ing were added to that on F-coloration rates.
HARDENING O F POTASSIUM CHLORIDE SINGLE CRYSTALS B Y QUENCHING AND IRRADIATION Kazou Akimoto and W. A. Sibley .................................................................................................................................... 98
The effect of heat treatment and irradiation on the mechanical propert ies of potassium chloride s ingle c rys ta l s of varying impurity concentrations i s investigated.
Abstract of paper to be published in the June 1963 i s s u e of the Journal of A p p l i e d P h y s i c s .
HARDENING OF KCI BY ELECTRON AND GAMMA IRRADIATION W. A. Sibley and Edward Sonder .................................................................................................................................... 98
Abstract of paper to be published in the August 1963 i s s u e of the Joumal.of A p p l i e d P h y s i c s . Measurements of the flow s t r e s s and of F-band coloration have been made at room temperature on a number of different samples of KCl as a function of gamma and electron irradiation.
L

xi
LIGHT SCATTERING I N ALKALI HALIDE SINGLE CRYSTALS W.A.Sibley. ...................................................................................................................................................................... 98
Light-scattering techniques have been used to determine the character of the dominant scat ter ing units in KCI and their s ize , shape, and concentration. It i s found that for Harshaw and Isomet KC1 the scat ter ing is from impurity c louds surrounding edge dis locat ions and that these cylindrical scat ter ing uni ts have a length of about 3 x cm and a radius of less than 2.5 x IO" cm.
14. PURE MATERIALS PROGRAM PURE MATERIALS PROGRAM
J. W. Cleland .................................................................................................................................................................... 108
T h i s program i s concerned with the development of improved techniques of ini t ia l purification, crystal growth, and final a s s a y as required for the production of research-quality specimens of immediate and long-range interest.
RESEARCH MATERIALS INFORMATION CENTER T. F. Connolly .................................................................................................................................................................. 108
T h i s report very briefly descr ibes the purpose and present s ta tus of the Research Materials Information Center. I t also includes a short description of the first aperiodic bulletin of avai lable and desired materials.
GROWTH OF SINGLE-CRYSTAL HgS 0. E. Schow I11 ................................................................................................................................................................ 109
Polycrystal l ine m a s s e s have been ob- Crystal growth from the m e l t under He pressure h a s been explored. tained by t h i s technique.
Co6' GAMMA- R AD1 AT10 N-I NDUCED POINT DEFECTS IN B i Z T e j M. J. Smith ........................................................................................................................................................................ 109
Extended exposures of Bi 2Te3 to CoGo gamma radiation apparently resul t i n the production of tellurium vacancies and interlaminar c lus te rs of tellurium interstitials. Evidence of an effect on impurity-band conduction at low temperature is observed.
Abstract of paper submitted for publication i n the Journal of Appl ied P h y s i c s .
DETERMINATION OF T H E NONSTOICHIOMETRIC DOPING MECHANISM IN Bi2Seg '
M. J. Smith ........................................................................................................................................................................ 109
Vaporcrys ta l l ine equilibrium s tudies indicate that the nonstoichiometric doping mechanism i n Bi *Se3 is subtractive i n nature (Le., selenium atoms occupy normal selenium s i tes , but some bismuth sites are vacant).
Publ ished paper: Appl . Phys . L e t t e r s 1, 79 (1962).
DETERMINATION O F EXCESS OXYGEN I N Cu20 SINGLE CRYSTALS M. J. Smith ........................................................................................................................................................................ 11 1
A procedure i s being developed which employs magnetic suscept ibi l i ty measurements to a s s a y the excess An attempt is being oxygen content in Cu20.
made to correlate e x c e s s oxygen concentrations with electr ical properties. Preliminary measurements indicate that the technique h a s merit.
POTASSIUM CHLORIDE SINGLE CRYSTALS C. T. Butler and J. R. Russel l ...................................................................................................................................... 112
The ultimate aim of the pure KCI program is to produce very pure single c rys ta l s of KCl having a l so a low concentration of physical imperfections. T h e more immediate aim of the program t h i s p a s t year h a s been to further improve the growing apparatus and to learn by chemical ana lys i s of many different c rys ta l s jus t which impurities are reduced (or increased) in concentration by a particular treatment.

xii
P A R T V. RADIATION M E T A L L U R G Y
15. RADIATION METALLURGY
RADIATION EMBRITTLEMENT O F REACTOR PRESSURE VESSELS '
M. S. Wechsler and R. G. Berggren .............................................................................................................................. 119
A review is given of low-temperature brittleness, neutron-irradiation effects on pressure-vessel s tee ls , fundamentals of radiation damage a s applied to t h e calculation of displacement production r a t e s i n reactor environments, and radiation enhancement of metallurgical reactions.
Abstract of published paper: Nucl. Sa/ety 4(1), 42 (1962).
TENSILE PROPERTIES O F IRRADIATED T Y P E 330 NICKEL ALLOY R. G. Berggren, W. J. Stelzman, and T. N. Jones ...................................................................................................... 119
Sheet tens i le samples of type 330 nickel alloy were irradiated in a par t ia l fuel element i n the ORR. Meas- urements after irradiation indicated an increase in the yield s t r e s s and ultimate tens i le s t r e s s and a decrease in the elongation. Also, a yield point was induced, and the ra te of work hardening was decreased.
E F F E C T O F NEUTRON BOMBARDMENT ON T H E STRESS-RUPTURE PROPERTIES O F SOME STRUCTURAL ALLOYS
N. E. Hinkle ...................................................................................................................................................................... 124
Abstract o f paper presented at the ASTM Symposium on Radiation E//ects on Metals and Neutron Dosimetry, T h e resu l t s of in-pile stress-rupture t e s t s i n the ORR on Inconel Los Ange les , Oct. 1-5, 1962 (to be published).
600, 304 s ta in less steel, Zircaloy-2, and an Nb-l% Zr alloy are described.
IN -P ILE STRESS-RUP TURE EXPERIMENTS W. E. Brundage ................................................................................................................................................................. 125
A description is given of in-pile stress-rupture experiments on tube-burst samples of Zircaloy-2 and ASTM A212B pressure-vessel steel.
IRRADIATION E F F E C T S ON T H E MECHANICAL PROPERTIES O F IRON AND IRON-BASE ALLOYS N.E.Hinkle ...................................................................................................................................................................... 128
A brief review is given of the effect of neutron irradiation on the mechanical propert ies of iron and iron-base alloys. An irradiation experiment on Armco iron tens i le samples is described, and future p lans are outlined.
IN TERNAL-FRICTION MEASUREMENTS IN IRON-NI TRO GEN ALLOYS J .T .Stan ley .................................................................................................................................................................... 131
Preliminary Apparatus h a s been developed for the in-pile measurement of low-frequency internal ' friction. measurements have been made in the ORNL Graphite Reactor on an iron-nitrogen alloy.
ATOMIC REARRANGEMENTS I N COPPER-NICKEL ALLOYS W. Schiile, J. M. Williams, B. C. Kelley, andM. S. Wechsler .................................................................................... 134
Previous work h a s indicated that neutron irradiation promotes a cluster ing reaction in copper-nickel alloys. The possible role of inters t i t ia l migration i s discussed, and a present ly operating experiment in the ORNL Graphite Reactor i s described.
TEMPERATURE AND FLUX DEPENDENCE O F RADIATION-ENHANCED DIFFUSION IN CIJ-A~ J. M. Williams, J. H. Barrett, M. S. Wechsler, W. Schi le , and B. C. Kelley .......................................................... 135
The flux and temperature dependence of the radiation-enhanced ordering in Cu-A1 h a s been measured for freshly prepared samples and for samples given a thermal cycling treatment in the reactor. T h e resu l t s are analyzed in terms of the theory of radiation-enhanced diffusion.
.
.
.

... X l l l
FUNDAMENTAL ASPECTS OF RADIATION EFFECTS ON DIFFUSION-CONTROLLED REACTIONS IN ALLOYS
M. S. Wechsler .................................................................................................................................................................. 142
Abstract of paper presented at the ASTM Symposium on Radiation Effects on Meta l s and Neutron Dosimetry, A review is given of the theory of diffusion, with special emphasis
The theory is compared with recent experimental L o s A n g e l e s , Oct. 1-5, 1962 (to b e published). on the freezing-in problem and on radiation-enhanced diffusion. work on the effect of radiation on ordering reactions in alloys.
PUBLICATIONS, PAPERS, AND SEMINARS
PUBLICATIONS AND PAPERS .....................................................................................................................................
JOURNAL ARTICLES ....................................................................................................................................................
BOOKS AND PROCEEDINGS ........................................................................................................................................
.................................................... .................................................................................................
PAPERS PRESENTED AT TECHNICAL MEETINGS ................................................................................................
REPORTS ISSUED ..........................................................................................................................................................
SEMINARS ..............................................................................................................................................................................
SOLID STATE SEMINARS AT ORNL ............................................................................................................................
EDUCATIONAL LECTURES AND SEMINARS ............................................................................................................
CONFERENCES ..............................................................................................................................................................
145
145
146
148
148
150

Part 1. Theory D. K. Holmes
.


1. Studies Associated with the Theory of Radiation Damage
COMPUTER STUDIES OF THE SLOWING DOWN OF ENERGETIC ATOMS IN CRYSTALS
M. T. Robinson 0. S. Oen
Our s tudies of the slowing down of energetic atoms in crystals with the IBM 7090 computer program RANGE I1 (ref 1) have been continued. The incidence of channeling' was s o great when the Bohr exponentially screened Coulomb potential was employed that its u s e was discontinued. Instead, a Born-Mayer (purely exponentia1)potential was used, with parameters suggested by Gibson et a L 2 to describe the interactions of copper atoms. With th i s potential, which is reasonably realistic for the most important interatomic separations (around half the crystal nearest- neighbor distance), it was possible to compute penetrations, of 1- to 10-kev copper atoms into copper monocrystals, which are of plausible magnitude. These results provided two immediate conclusions:
1. The penetrating component observed by Davies e t a L 4 i n the slowing down of several ions in aluminum monocrystals can b e attributed to the influence of channeling on the trajectories of the primaries.
2. The penetrations of ions into monocrystals should be sensitive functions of the initial crystallographic direction of the incident particles,
'M. T. Robinson and 0. S. Oen, Solid Stnte Div. Ann. Progr. Rept . Aug. 3 1 , 1962, ORNL-3364, pp 5-11.
2 J. B. Gibson, A . N. Goland, M. Milgram, and G. H. Vineyard, Phys . R e v . 120, 1229 (1960).
3For dera i l s s e e M. T. Robinson and 0. S. Oen, Appl ;
4 J . A . Davies, B. Domeij, and J. Uhler, Arkiv F y s i k
Phys . L e t t e r s 2, 30 (1963).
24, 377 (1963), and earlier references there cited.
the penetrations in fcc crystals decreasing in the order <011> , < 001 > , < 112 >, < 013 >, < 11 1 > .
Figure 1.1 displays our calculated integral penetration distributions for 5-kev copper atoms slowing down to 25 ev in copper. The prediction of crystallographic sensitivity of the penetration, shown by this figure, has recently been verified experimentally for 40-kev 8 5 K r + ions slowing down in a l ~ m i n u m . ~ Some of the experimental data are shown in Fig. 1.2. The striking similarities between Figs. 1.1 and 1.2 give u s considerable confidence in the essent ia l correctness of our model.
5G. R. Piercy, F. Brown, J. A. Davies, and M. McCargo, P h y s . R e v . Le t t e r s 10, 399 (1963).
UNCLASSI FlED ORNL-LR-DWG 78177
IO0
n
a .5
0 L + d 2
~ ro-' W >
0 z
w J m 5
E 2
5
2 40-2
z P 5
[r k 2
I \ I I I
r i I I I I I I I 1 1
0 50 IO0 450 200 250 300 350 400 450 500 PENETRATION DEPTH (angstroms)
Fig. 1.1. Integral Penetration Distributions Calcu-
lated for 5-kev Copper Atoms Slowing Down to 25 ev i n
Copper, According to a Truncated Born-Mayer Potential.
The init ial directions of the primaries are shown on the
curves. ,
. 3

4
UNCLASSIFIED ORNL-DWG 63-178
IO" n
a W a
A L to-' > + 0 z v) W J 10-2
i7 2 u
8 10-3 z
+ u LT
0
a
0 . 1000 2000 3000 4000 5000 LL IO-^
PENETRATION DEPTH (angslroms)
Fig. 1.2. Integral Penetrations Observed [Phys . Rev. Letters 10, 399 (1963)] for 40-kev 85Krt Ions Slowing
Down in Monocrystalline Aluminum. The three principal
directions all make angles of 28' with the crystal sur-
face normal (marked I). The penetration depth scale
has been corrected for angle of incidence.
In order to study the effects of crystal symmetry on the slowing-down problem, independently of changes in the interatomic potential, calculations were performed for copper atoms slowing down not only in fcc copper but a lso in hypothetical bcc and diamond-structure "copper." All three structures have the same nearest-neighbor distance; some other properties are l isted in Table 1.1. Figure 1.3 displays the median penetrations for 1- to 10-kev copper atoms, starting isotropically from latt ice sites, in each of the three structures. The dif- ferences are determined primarily by the differences in densit ies of the three solids, although small structural effects are a lso evident. In Fig. 1.4 are shown median penetrations calculated for copper atoms incident upon low-index surfaces of monocrystalline targets of each of the three structures. The effects of density are largely overridden by those of channeling. Study of this figure and its comparison with Fig. 1.3 shows the following points:
1. Channeling leads to a crystallographic sensitivity of the penetration in a l l three crystals.
2. The effects of channeling are the greatest in the diamond structure, but are nearly a s great in the other cases.
3. The order of the median penetrations is the same as that which is predicted from the "trans- parency"' of the various crystallographic direc- tions.
GA. L. Southern, W. R. Willis, and M . T. Robinson, I . Appl. Phys . 34, 153 (1763).
Table 1.1. Some Crystallographic Properties of the
"Copper" Targets
Nearest-neighbor dis tance: 2.5562 A
FCC BCC Diamond
Coordination number 12 8 4
Latt ice constant , A 3.6150 2.9516 5.7032
Relative density 1.0000 0.9186 0.4593
80
70
60 - Y)
E 0 $ 50 +
0
z t-
+ W z W a
- 0 2 40
z 30 Q n z W
20
40
0
UNCLASSIFIED ORNL-LR-DWG 78172
ISOTROPIC INITIAL PRIMARIES TRUNCATED BORN-MAYER POTENTIAL
0 2 4 6 8 40 INITIAL PRIMARY ENERGY ( k e v )
Fig. 1.3. Median Penetrations Calculated for In i t ia l ly
Isotropic Copper Atoms Slowing Down to 25 ev i n
"Copper" According to a Truncated Born-Mayer Po.
ten tia I.
5
0.02
2x10³
\ 4 ='/2 NEAREST NEIGHBOR - 1
DISTANCE FOR COPPER - LATTICE
UNCLASSIFIED ORNL-LR-DWG 78173
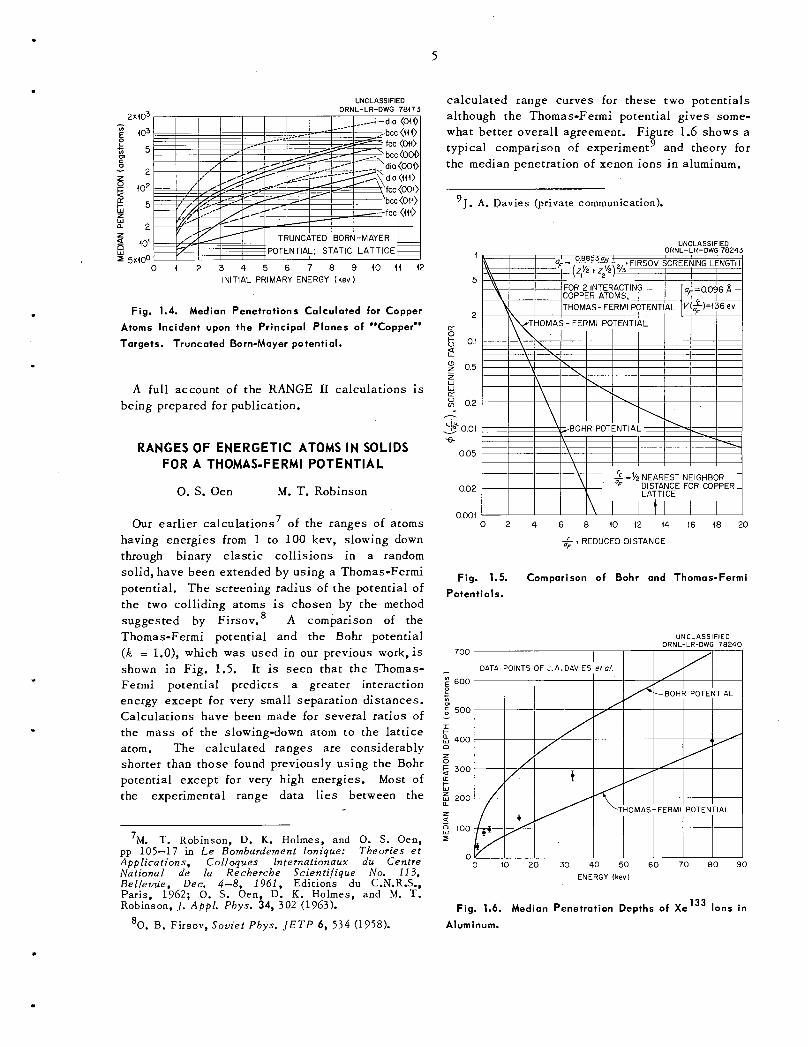
0 4 2 3 4 5 6 7 8 9 40 4 1 42 INITIAL PRIMARY ENERGY (kev 1
Fig. 1.4. Median Penetrations Calculated far Copper
Atoms Incident upon the Principal Planes of "Copper"
Targets. Truncated Born-Mayer potential.
A full account of the RANGE I1 calculations is being prepared for publication.
RANGES OF ENERGETIC ATOMS IN SOLIDS FOR A THOMAS-FERMI POTENTIAL
0. S. Oen M. T. Robinson
Our earlier calculations7 of the ranges of atoms having energies from 1 to 100 kev, slowing down through binary elastic collisions in a random solid, have been extended by using a Thomas-Fermi potential. The screening radius of the potential of the two colliding atoms is chosen by the method suggested by Firsov.' A comparison of the Thomas-Fermi potential and the Bohr potential (k = l.O), which was used in our previous work,is shown in Fig. 1.5. It is seen that the Thomas- Fermi potential predicts a greater interaction energy except for very small separation distances. Calculations have been made for several ratios of the m a s s of the slowing-down atom to the lattice atom. The calculated ranges are considerably shorter than those found previously using the Bohr potential except for very high energies. Most of the experimental range data lies between the
'M. T. Robinson, D. K. Holmes, and 0. S. Oen, pp 105-17 in L e Bombardement lonique: Theor ie s e t Appl ica t ions , Co l loques Internationaux du Centre National d e la Recherche Scientifique No. 113, Bellevu'e, Dec . 4 -8 , 1961, Editions du C.N.R.S., Par i s , 1962; 0. S. Oen, D. K. Holmes, and M. T. Robinson, J . Appl . Phys . 34, 302 (1963).
calculated range curves for these two potentials although the Thomas-Fermi potential gives some- what better overall agreement. Figure 1.6 shows a typical comparison of experiment9 and theory for the median penetration of xenon ions in aluminum.
9J. A. Davies (private communication).
1
5
2 n 8 0.1 2
0.5 z W W n % 0.2 .--- * 0.01 8-
0.05
UNCLASSIFIED ORNL-LR-DWG 78243
0 2 4 6 8 10 12 14 16 18 20
-L 1 REDUCED DISTANCE OF
Fig. 1.5. Comparison of Bohr and Thomas-Fermi
Potentials.
UNCLASSIFIED ORNL-LR-DWG 78240
700
- E 600 0 y1 CD
500 I
X
k 400 n z
300 cc + W
$ 200
z 5
2 100
0 0 10 20 30 40 50 60 70 80 90
ENERGY (kev)
Fig. 1.6. Median Penetration Depths of Xe133 Ions in
'0 . B. Firsov, Sovie t Phys . J E T P 6, 534 (1758). Aluminum.
.
6
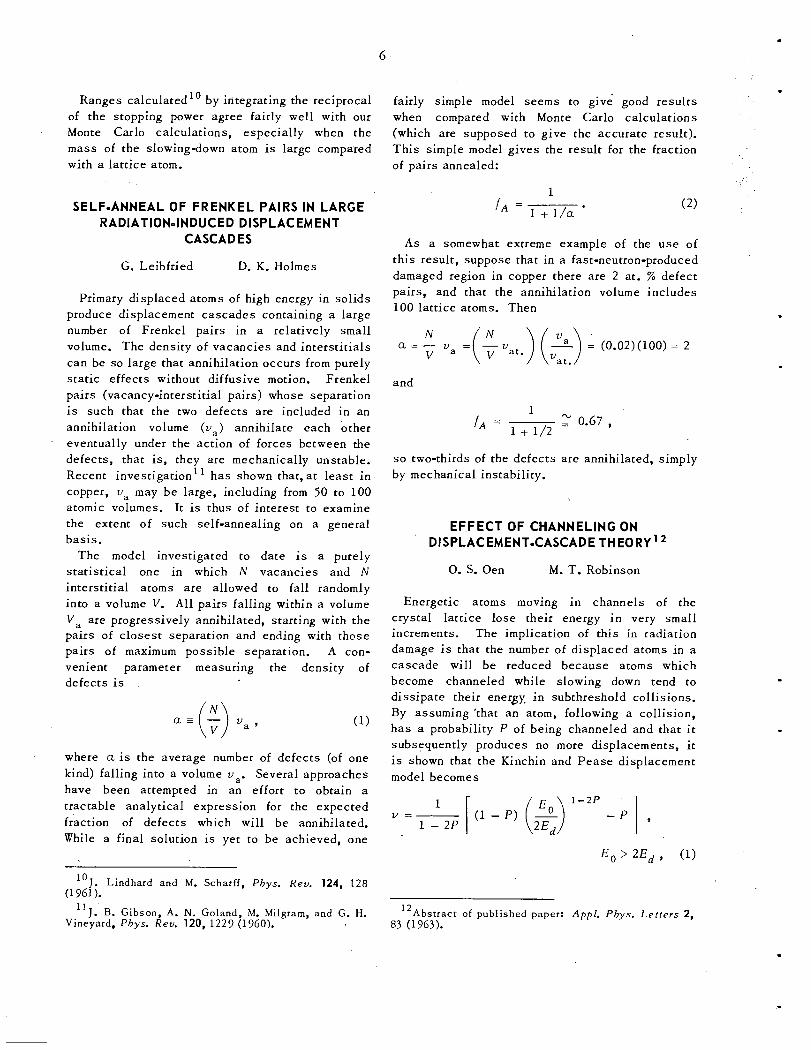
Ranges calculated' by integrating the reciprocal of the stopping power agree fairly well with our Monte Carlo calculations, especially when the m a s s of the slowing-down atom is large compared with a latt ice atom.
SELF-ANNEAL OF FRENKEL PAIRS IN LARGE RADIATION-INDUCED DISPLACEMENT
CASCADES
G. Leibfried D. K. Holmes
Primary displaced atoms of high energy in solids produce displacement cascades containing a large number of Frenkel pairs in a relatively s m a l l volume. The density of vacancies and intersti t ials can be so large that annihilation occurs from purely s ta t ic effects without diffusive motion. Frenkel pairs (vacancy-interstitial pairs) whose separation is such that the two defects are included in an annihilation volume (va> annihilate each other eventually under the action of forces between the defects, that is, they are mechanically unstable. Recent investigation1 h a s shown that, a t least in copper, va may be large, including from 50 to 100 atomic volumes. It is thus of interest to examine the extent of such self-annealing on a general basis.
The model investigated to date is a purely s ta t is t ical one in which N vacancies and N intersti t ial atoms are allowed to fall randomly into a volume V. A l l pairs falling within a volume Va are progressively annihilated, starting with the pairs of c losest separation and ending with those pairs of maximum possible separation. A con- venient parameter measuring the density of defects is
where a is the average number of defects (of one kind) falling into a volume va . Several approaches have been attempted in an effort to obtain a tractable analytical expression for the expected fraction of defects which will be annihilated. While a final solution is yet to be achieved, one
'OJ. Lindhard and M. Scharff, Phys . Rev. 124, 128 (1 961 1.
"J. B. Gibson, A. N. Goland, M. Milgram, and G. H. Vineyard, Phys . Rev. 120, 1229 (1960).
fairly simple model s e e m s to give good results when compared with Monte Carlo calculations (which are supposed to give the accurate result). This simple model gives the result for the fraction of pairs annealed:
1
l A = 1 + l / a
A s a somewhat extreme example of the u s e of this result, suppose that in a fast-neutron-produced damaged region in copper there are 2 at. % defect pairs, and that the annihilation volume includes 100 latt ice atoms. Then
N
and
1
f A = 1+1/2 s o two-thirds of the defects by mechanical instability.
n, - - 0.67 ,
are annihilated, simply
EFFECT OF CHANNELING ON DISPLACEMENT-CASCADE THEORY' *
0. S. Oen M. T. Robinson
Energetic atoms moving in channels of the crystal lat t ice lose their energy in very s m a l l increments. The implication of this i n radiation damage is that the number of displaced atoms in a cascade will be reduced because atoms which become channeled while slowing down tend to dissipate their energy, in subthreshold collisions. By assuming 'that an atom, following a collision, h a s a probability P of being channeled and that it subsequently produces no more displacements, it is shown that the Kinchin and Pease displacement model becomes
12Abstract of published paper: Appl. Phys . Let ters 2 , 83 (1963).

7
.
where v is the total number of displaced atoms in a cascade initiated by a primary of energy E , and E d is the displacement threshold energy. Ex- pression (1) predicts that the number of displace- ments depends on E , to some power less than unity. This is in the right direction to remove the disagreement between experiment and theory.
LONG-RANGE CHANNELING EFFECTS IN IRRADIATED CRYSTALS’ 3* ’ C. Lehmann G. Leibfried
If an energetic atom, a primary, s lows down in a lattice, i t has the possibility of traveling long distances without essent ia l interaction along almost force-free channels bordered by close- packed atomic chains. This effect h a s not been considered until recently, because for the sake of simplicity the lattice mostly has been replaced by a corresponding random arrangement. This
channeling” behavior has been found in machine calculations by Robinson, Holmes, and O e d 5 which take the lattice structure into account. In this paper the behavior of a primary moving along a channel bordered by the , most densely packed directions is investigated analytically. Numerical results are given for a copper primary moving in a copper crystal, but the results can be easily ex- tended to other cases. Two potentials are used: an exponentially screened Coulomb potential after Bohr, used also in the machine calculations and
1 1
l3T0 be published in Journal o j Applied Phys ics .
‘*The paper mentioned in the l a s t progress report (Sol id State Div. Ann. Progr. Rept. Aug. 31, 1962, ORNL-3364, p 13) h a s been completely rewritten. In the meantime long-range chann ling in single c rys ta l s has been shown experimentally fG. R. Piercy, F. Brown, J . A. Davies, and M. McCargo, Phys. Rev. Letters 10, 399 (196311, and hence the first version of the paper has lo s t i t s hypothetical character. The experi- mental feasibil i ty h a s now been taken into account, and an ana lys i s i s given of how to obtain, from experi- mental da ta on long ranges, information about the atomic interaction potential at d i s tances of about half the la t t ice spacing. The mathematical treatment is more concise, and more resu l t s of numerical calcula- tions are added.
”M. T. Robinson, D. K. Holmes, and 0. S. Oen, Bull . Am. Phys. SOC. 7(3), 171 (1962); M. T. Robinson and 0. S. Oen, Appl. Phys. Let te rs 2, 30 (1963). .
thought to give an adequate description for relatively high energies and s m a l l interatomic distances; and a purely exponential potential after Born-Mayer, better suited for relatively low energies and large atomic distances. The maximum ranges are very large: for 10 kev in the order of l o 3 lattice parameters for the Born-Mayer potential and up to lo7 for the Bohr potential. Presumably, the Born-Mayer potential is a better description for these events. The investigation is confined to motions near the channel axis. Therefore, we only obtain the range distribution near the maximum range. From an adequate analysis of experimental data on long ranges of primaries, shot onto crystals in low-indexed directions, one can obtain information about the potential at dis tances of about half the lattice spacing.
HIGHER-ORDER MOMENTUM APPROXIMATION IN CLASSICAL COLLISION THEORY
C. Lehmann G. Leibfried
The classical scattering of two particles with repulsive central forces is calculated for small scattering angles using perturbation theory. The potential is considered a s a perturbation. The first approximation is the well-known “momentum approximation.” Higher-order approximations pro- vide criteria for convergence a n d allow esti- ma t ion of the accuracy of the approximation. Furthermore, the conditions of validity of the momentum approximation are discussed for cut-off potentials, Power potentials, the exponentially screened Coulomb potential, and a purely ex- ponential potential are investigated in detail, especially the latter two. The method is demon- strated numerically by an example which corre- sponds to the interaction of copper atoms. Also, the quantum mechanical l i m i t s of this c lass ical treatment are investigated.
~
“Abstract of published paper: Z. Phys ik 172, 465 (1963).
a

2. Theory of Electron States
EFFECT OF A LARGE MAGNETIC FIELD ON THE FERMI LEVEL OF A METAL
J. H. Barrett
Electron orbits in a metal are quantized in the presence of a magnetic field. The effects of such quantization appear in the magnetic susceptibility, magnetoresistance, Hall effect, and other phe- nomena. A s one aspect of the theory of such
There will be two relatively simple cases to consider. Case I is that in which the (a) and (b) ellipsoids contain all of the carriers; ca se I1 is that i n which there are enough other carriers present to hold the Fermi level constant regardless of the effect of the magnetic field on the (a) electrons. In any case the Fermi level is deter- mined by the condition ne = nh. The number of electrons or holes enclosed by an ellipsoid at absolute zero is given by
phenomena, some consideration has been given to the secondary effect of the magnetic field on these
It has been shown that this latter effect is small i f &ac << E,, where oc = e B / m c c is the cyclotron frequency and mc the cyclotron effective mass. Hence the effect of the field on the Fermi level is usually neglected. However, this effect will be large i f &ac >> E , for a large fraction of the electrons and holes in the metal. Fulfillment of the condition+ac >> E , is aided by having mc and E , small.
A metal that seems likely to fulfill these con- ditions is bismuth. Its Fermi surface is known to include (a) three nearly ellipsoidal electron surfaces and (b) one ellipsoidal hole surface. In addition there is evidence for one or more additional portions of the Fermi ~ u r f a c e . ~ For a 100-kilogauss field directed along a bisectrix direction, *ac/E, = 4 for two of the three (a) ellipsoids and - 8 for the third one.
phenomena through its effect on the Fermi level. 1
2
where
md = density of s t a t e s effective mass,
A = ‘/z (spin-orbit splitting)/(cyclotron split-
n m a x = maximum n for which the quantity under ting),
the square root is positive.
For#oC << E,, Eq. (1) becomes
For c a s e I, Eq . (1) can be used to calculate the effect of a magnetic field on the Fermi level. The simplest way to detect this effect is by measuring the magnetic susceptibility. The contribution of
* Yi-Han Kao, P h y s . R e v . 129, 1122 (1963).
3L. S. Lerner, P h y s . Rev . 130, 605 (1963). ‘R. B. Dingle, Proc. Roy. SOC. AZ11, 500 (1952);
P. N. Argyres, 1. Phys . Chem. Sol ids 4, 19 (1958).
8

9
.
an ellipsoid to the susceptibility a t absolute In collaboration with the Superconductivity Group zero is an experiment is being planned to study the high-
f (::)3'2(?)2{ 'Ex [ ~ ( ~ + - - A ) + a c - E F ] [ E F - 1 ( n + 5 - A ) 5 a c ] 1 1 / 2
2 n'O x = - T -
377 m C
Equations (1) and (2) have been used to calculate x for case I. The results are plotted in Fig. 2.1. For case I1 the Fermi level will remain constant, and Eq . (2) suffices to calculate x. These results are a l so plotted in Fig. 2.1.
The plotted curves were calculated for the absolute zero of temperature, and collision broadening was neglected. The effects of a non- zero temperature and of collision broadening will be to smooth out the oscillations in the curves. Their effects will be pronounced in the vicinity of 25 kilogauss ( 1 0 5 / B = 4) but will not change the nature of the curves at fields approaching 100 kilogauss.
7 \ \
UNCLASSIFIED ORNL-D\
I I I 63-220 '
Q \ 0 1 2 3 4 5 6
qo%, RECIPROCAL MAGNETIC FIELD (gauss- ' )
Fig. 2.1. Plot of the Magnetic Susceptibility vs the
Reciprocal of the Magnetic Field.
field dependence of the susceptibility of bismuth utilizing the 100-kilogauss facility of the Oak Ridge Magnet Laboratory.
BOUNDARY DEGENERACIES IN BRlLLOUlN ZONES
H. C. Schweinler
Associated with a la t t ice of points 2.d in real space (n' integral; 2 , . [z2 x z31 f 0) is a reciprocal
la t t ice of points hi 6' (hi integral; b2 - 2' = ai j ) . The s e t of planes which are the perpendicular bisectors of the line segments from the origin to each other lattice point of reciprocal space partitions this space into polyhedral regions. The interior points of these polyhedral regions form three-dimensional open se t s of points representing general propagation vectors. The boundary of each such polyhedron is composed of (a) two-dimen- sional open sets (the faces, excluding edges and vertices), (b) one-dimensional open sets (the edges, excluding vertices), and (c) zero-dimensional s e t s (the vertices). The points which can be joined to the origin by a straight-line segment which intersects 1 perpendicular-bisecting planes form the interior of the (I + 1)th Brillouin zone. These points can be mapped by reciprocal la t t ice translations onto the interior of the first Brillouin zone.
W e shal l be primarily concerned with the image of the boundufies of the higher Brillouin zones in the first zone or its boundary. Thus, for each extended zone after the first, there is induced a partition of the first zone by the translational images of the boundaries of the extended zone. Special interest is attached to points in the reduced zone from a given extended zone whose inverse . images l ie on a sphere about the origin
I
+. +.
I

and,- accordingly, are degenerate in the limiting case of vanishing periodic potential. Bouckaert, Smoluchowski, and Wigner4 have treated the case in which the inverse images are related by the point symmetry of the lattice; accordingly, we concentrate on the case in which the inverse images are related by la t t ice translations only, or by lattice translations and the operations of the point group. Several examples have been given' for the two-dimensional square lattice.
Secular equations have been se t up for the prototype case of the motion of a quantum mechanical particle in a periodic potential. The energy is considered a s a function of the (small) deviation vector of the propagation vector from a boundary value. Separate cases ar ise for bound- ar ies of types (a), (b), and (c) listed in the first paragraph, requiring individual treatment.
10
with the use of well-correlated wave functions, are reported. An analysis of the wave functions is made in terms of operators which resolve the general doublet function into two components, one of which is characterized by a spatially symmetric core function. The calculations show that this component with the spatially symmetric core can give very good values for both the energy (-7.47630 atomic units) and the hyperfine inter- action (98.8% of exptl). The inclusion of the second doublet component and some quarter component in the wave function h a s very little effect on either the energy or the hyperfine inter- action. These results are discussed and compared with those obtained with the unrestricted Hartree- Fock (UHF) method. The conclusion is reached that the usual interpretation of the resul ts obtained for lithium with the UHF method is not entirely acceptable.
EFFECT OF CORRELATION ON THE HYPERFINE INTERACTION IN LITHIUM'
R. F. Wood K. F. Berggren 7
' The results of calculations of the hyperfine interaction in the ground state of lithium, made
*L. P. Bouckaert, R. Smoluchowski, and E. P. Wigner, Phys . Rev. 50, 58 (1936).
Solid State Diu. Ann. Progr. R e p t . Aug. 31, 1962,
Phys. Rev. 130, 198
ORNL-3364, p 22.
' Abstract of published paper: (1963).
Uppsala University, Uppsala, Sweden.

.
3. Studies on Defects in Ionic Crystals
3
U
EXCITED STATES OF THE F-CENTER
R. F. Wood
Calculations are being carried out on the electronic structure of the F-center in an effort to determine whether or not there are bound s ta tes other than the two responsible for the main F-band.
The Hamiltonian of the F-electron in the crystal is written as
--t N 1
2 % = - - v 2 + V ( ? - R g ) ,
g=1
--t N 1
2 % = - - v 2 + V ( ? - R g ) ,
g=1
+ where V(7’ - R ) is the potential due to the gth ion. The vacancy is located at the lattice site, denoted by g = 0.
The wave function is expanded as a linear combination of atomic orbitals (LCAO) of the alkali ions. Only the lowest unoccupied orbitals, that is, those usually associated with the con- duction band in the perfect crystal, have been chosen. For example, the 2 s and 2p lithium functions are used in the lithium halides. The wave function is written a s
g
where g again runs over the ions and p runs over the atomic orbitals o n any one ion.
In the first approximation, the sum over g in- cludes only the first-nearest-neighbor (Inn) ions of the vacancy. In the second approximation, second-nearest-neighbor alkali ions (27272) are included in the wave function; in the third approxi- mation 3nn alkal is are included, etc. Group theoretical considerations give a great simplifi- cation of the secular determinant which resul ts from the usual variation problem. The symmetry
of the F-center i n an alkali halide is octahedral, and s o the eigenvectors of our problem will belong to one of the five irreducible representations (ten i f the inversion operation is included in the group) of the octahedral group. The multiplication table of the octahedral group then shows that optical transitions are allowed from the ground s ta te (I?: symmetry) to the excited states of r, symme- try. A l l other optical transitions /Tom the ground s t a t e are forbidden.
In the first approximation, for LiC1, there are only two bound s ta tes of the problem - one going with r: and one going with - and the transition between these two s ta tes accounts very well for the main F-band. No other levels of any symmetry are bound (have negative energy) a t this s tage of approximation, although there are two which are very nearly bound.
In the second s tage of approximation, that is, including 2nn lithium ions, two additional levels become bound, one of r: symmetry and one of r: symmetry, corresponding to the two roots which are almost bound in the first approximation. No additional level of r,, which might correspond to a second excited state accessible to the ground state by a purely optical transition, appears.
These additional bound levels might have some rather important consequences s ince they could presumably act a s electron traps. Such s t a t e s might account for the long lifetime of the principal excited state. The nonappearance of a second excited s ta te of r, symmetry is somewhat puzzling. Experimentally, it is always found that a band of low height occurs just to the high-energy s ide of the main F-band. This is the K-band, and it h a s almost always been attributed to a second excited state of the F-center. Since it is an optical band, it should have r, symmetry. We are extending our calculations to 3nn lithium ion sites in a search for such a band.
11

12
The accuracy of these calculations is not great. The occurrence of many three-center integrals which we have calculated only approximately degrades the accuracy somewhat. Also, we have neglected many factors which would have to be included in a more accurate calculation, for example, distortions, exchange effects, which a re only partially included here, polarization, etc. On the other hand, we are probably justified in being optimistic because the calculations do give
, the main F-band with considerable accuracy and the two levels involved in th i s band seem to lie at about the right place on a n energy scale.
ELECTRONIC STRUCTURE OF THE M-CENTER
A. Meyer R. F. Wood
The color center responsible for the M absorption and emission bands is now considered to cons is t of two F-centers bound together a t nearest- neighbor halide sites. Thus, if the F-center is considered as the lattice analogue of the hydrogen atom in free space, the M-center can' be considered a s the lslttice analogue of a hydrogen molecule, an F-center molecule.
W e are carrying out calculations of the electronic structure of the M-center based on this model. We are using the Heitler-London method i n which the spatial part of the singlet ground-state wave function can be written as
Here $' and $b are the F-center wave functions at sites a and b respectively. The excited-state functions are similar in form but modified to conform to the symmetry of the excited states. W e a re using F-center functions of the vacancy- centered type, that is,
where +o is a function, centered at the vacancy, which describes the major portion of the charge density. The +j's are orbitals on the neighboring ions and the c j ' s are determined by orthogonality conditions. For simplicity, we have taken a simple hydrogenic-like form for +o, after Wood and Korringa,' although the form used by Kojima2 and Gourary and Adrian3 would b e slighty more accurate.
For the Hamiltonian we have taken
L L g =1
N + - 9 -9
g =1 + V ( r 2 - R g ) - V(f1 - R a ) - V(T1 - R b )
+ +
where Rub is the interaction energy of the two vacancies and the form of V is generally assumed to b e simple Coulombic.
Thus far, we have carried out calculations for LiCl with resul ts which a re rather encouraging. Experimentally, it is found that there a re a number of different M absorption l ines associated with each F line. Group theoretical considerations show that, on the bas i s of the model we are using, one can expect an excited state of xu symmetry (we u s e the homonuclear diatomic molecule notation here for convenience) and two excited states of nu symmetry with a small splitting between the last two. In Table 3.1 we show our resul ts for t he transition energies compared with the experimental work on KC1 extrapolated to LiCl.
'R . (1 961 1.
2T. Kojima, J . Phys. SOC. Japan 12, 908 (1957) .
F. Wood and J. Korringa, Phys. Rev. 123, 1138
3B. S. Gourary and F. J. Adrian, Phys. Rev. 105, 1180 (1957).
Table 3.1. Energies of the F- and M-Bands in L i C l
Energy (ev) Symmetry of Excited Band
Experimental Theoretical State' Designation
F 3.1 3.3
M1 X U -2.0 2.5
-., 3.0 '"3.8 M 2 n u
Uncertain "U -3.0 + Aeb -3.8 k A,
'The symmetry notation i s that for a homonuclear dia- tomic molecule and is not strictly applicable here, but we use i t for convenience.
bThe spli t t ing A, is smal l - of the order of a few hun- dredths to a few tenths of an electron volt. Its s ign h a s not been es tab l i shed for LiCI.

. 1 3
The discrepancy between theory and experiment for the F-band ar i ses primarily from the use of a 2p function for the excited state instead of the 3p function indicated by Wood and Korringa. The table indicates that the relative dis tances between the bands are given quite well by our calculations. This seems to be a theoretical verification of the assumed model. We have not yet calculated the splitting, A,, of the two II states, but indications are that it is very sma l l . The splitting is brought about directly by the inclusion of the ion orbitals in the F-center wave function. In a purely continuum model this splitting would be absent.
Our calculations a l so indicate that the “binding energy” is greater in the excited state ( “ 1 . 1 3 ev) than in the ground state ( - 0 . 3 4 ev). W e interpret this to mean that it should be easier to form M-centers from F-centers when one or both of the F-centers is in an excited state than when both F-centers are in their ground states.
W e intend to continue our calculations by turning now to LiF, which is a crystal of more experi- mental interest than is LiCI.
.


Part II. Crystal Physics M. K. Wilkinson

.
\

4. X-Ray Diffraction
ANOMALOUS TRANSMISSION OF X RAYS IN COPPER CRYSTALS'
M. C. Wittels F. A. Sherrill F. W. Young, Jr.
The anomalous transmission of x rays is the phenomenon in perfect or nearly perfect crystals for which the apparent absorption coefficient of x rays becomes abnormally small when an inci- dent beam undergoes a Bragg reflection during passage through the crystal. This effect was f i rs t observed on quartz;2 in later experiments it w a s observed on germanium,' and ~ i l i c o n . ~ The possibility of observing and meas- uring anomalously transmitted x rays in copper became apparent during earlier studies' in which Lang9 topographs were used. This effect has not previously been reported in a metal, to our knowledge; this report presents our initial find- ings concerning this phenomenon in nearly perfect crystals of copper.8*10
Several crystals 1 cm x 1 c m x Z (Z varying from 0.05 mm to 1.3 mm), with the l - c m 2 face
'Published in Appl. P h y s . L e t t e r s 2, 127 (1963).
2G. Borrmann, Phys ik . Z . 42, 157-62 (1941).
3H. N. Campbell, /. Appl. P h y s . 22, 1139-42 (1951).
*G. L. Rogosa and G. Schwartz, Phys . Rev . 87, 995-98 (1952).
5G. Brogren and 0. Adell, Arkiu Fys ik 8 , 97-112,
'L. P. Hunter, Koninkl. N e d A k a d Wetenschap.,
7B. Okkerse, Phi l ip s Research Laboratory, Eind-
8M. C . Wittels, F. A. Sherrill, and F. W. Young, Jr.,
'A. R. Lang, Acta Met. 5 , 358 (1957).
'OF. W. Young, Jr., Bull. A m Phys . SOC. 7 , 215
40 1-26 (1945).
' PTOC.., Ser. B 61, 214-19 (1958).
hoven, Netherlands, personal communication, 1961.
Appl . Phys . L e t t e r s 1, 22 (1962).
( 1962).
(110), were prepared by acid sawing and polish- ing;" and from a set of (111) planes normal to this (110) surface, the Bragg conditions were adjusted for simultaneous observation of the anomalous transmitted and reflected beams. The incident radiation was Cu K a l monochromated by (111) reflection from a perfect silicon crystal; and, although second-order short-wavelength x rays were not eliminated during the recording of the anomalous transmissions, measurable intensit ies were st i l l easily observed when the potential on the x-ray tube was dropped to 1 2 kv. This was true for a l l except the thickest crystal ex- amined, which w a s 1.3 mm thick.
The anomalous x-ray transmissions were ob- served by two techniques. In one method crystals were slowly rocked through the (111) reflecting position, and the Geiger counter intensit ies of the transmitted and reflected beams were recorded as a function of rocking angle. In the second method the two beams were recorded simultane- ously on emulsions when the crystals were fixed a t the peak (111) reflecting positions. It w a s observed that the anomalous transmitted and reflected beams were always approximately equal in intensity, in agreement with previous3 find- ings. Also, as expected, the intensit ies de- creased with increasing crystal thickness; but a detailed study of this property h a s not yet been completed.
One crystal, 0.15 mm thick, gave a peak count rate of the anomalous transmitted beam of 1100 quanta/sec, while the 1.3-mm crystal gave a similar peak count rate of only 30 quanta/sec. The narrow width of the transmitted and reflected beams i n a 1-mm-thick crystal is demonstrated in the rocking curves shown in Fig. 4.1, where the somewhat enhanced background in the c a s e
"F. W. Young, Jr., and T. R. Wilson, Rev . Sci. Instr. 32 , 559 (1961).
17

70
60
50
U c
al v) \ v)
c
8 40
c
2 30 u
20
10
0
18
UNCLASSIFIED ORNL-DWG 63-2207
Fig. 4.1. Rocking Curves; Anomalous transmitted (T) and reflected beams ( R ) for a 1-mm-thick copper crystal;
h= 1.54 A.
of the anomalous transmitted beam is due to the weak normal transmitted beam in the region near 09 The anomalous effect for this same crystal is recorded in Fig. 4.2, which shows the images of the transmitted and reflected beams that were obtained simultaneously. The long thin l ine at the bottom of the figure is the direct beam image taken with the crystal and collimation removed from the path. Some distortion in the reflected beam image is due to both the emulsion thickness and the fact that the flat plate was set a t right angles only with respect to the trans- mitted beam. The gradual variation in intensity along the length of the transmitted beam image is due to a substantial change of imperfection concentration along the length of the crystal traversed by the transmitted beam. Apparent individual imperfections are revealed as light images in Fig. 4.3, which represents a magnifica- tion of a portion of the anomalous transmitted beam image shown in Fig. 4.2.
The reflected (111) beam associated with the anomalous transmission of Ag K a l radiation on the s a m e 1-mm-thick crystal was used in making a Lang topograph of the entire crystal (shown in Fig. 4.4). The light streaks and areas correspond to imperfections in this crystal, but a detailed understanding of these defects is not presently at hand. The large white area in the lower por- tion of the photograph corresponds to a region of imperfections so dense that they were not re- solved. The section of the crystal from which Fig. 4.2 was obtained is indicated by the short arrows in Fig. 4.4; it confirms the existence of a variable density of imperfection in this crystal. It is clearly seen that many defects are present in this 1-mm-thick copper crystal which exhibits anomalous x-ray transmission. The correlations of defects observed by these and other techniques are being investigated further.
.

19
Fig. 4.2. A 16-hr Exposure to Both Beams from Same
Crystal as in Fig. 4.1. Upper line, anomalous reflected
beam ( R ) ; middle line, anomalous transmitted beam ( T ) ; and lower line, direct beam with crystal removed. llford
L-4 nuclear plate, 100-p emulsion; A = 1.54 A. 3X.
. .
UNCLASSIFIED PHOTO 62005
.
Fig. 4.3. Portion of Anomalous Transmitted Beam ( T ) and Direct Beam Shown i n Fig. 4.2. 30X.

20
. . . . I Fig. 4.4. Long Topogroph of Same 1-mm-thick Crystal. Positive photograph, 168 hr exposure. llford L-4 nuclear
plate, 100-p emulsion. Ag Ku,. 9X.
VERTICALLY ROTATING DOUBLE-CRYSTAL X-RAY SPECTROMETER
M. C. Wittels F. A. Sherrill A. C. Kimbrough
A versatile double-crystal x-ray spectrometer has been developed for the precise measurement of x-ray diffraction line widths to tenths of a second. The device can be employed in either the parallel or the antiparallel arrangement for rocking curve s tudies and can also be used in anomalous x-ray transmission experiments with nearly perfect crystals.
''Summary of a paper to be presented at the 13th Annual Conference on Applications of X-Ray Analysis, Denver, Colo., Aug. 8, 1963.
Although it is not strictly necessary, a Norelco wide-angle diffractometer is used to hold the first crystal and to provide a fixed axis of rota- tion for setting successive orders of reflection. A special worm gear drive is adapted to the unit for this purpose. The second crystal arrange- ment, which is the crux of the instrument, allows vertical rotation of the crystal from -6O to +165' about the fixed rotation axis of the first crystal; and this range covers nearly all possible reflec- tions. A rocking axis for the second crystal is located approximately 3?2 in. from the fixed ax is of rotation of the first crystal. Since ne'arly perfect crystals exhibit x-ray diffraction l ine widths a s small a s tenths of a second, a suffi- ciently slow, but synchronous, drive must be applied to rock the second crystal through the
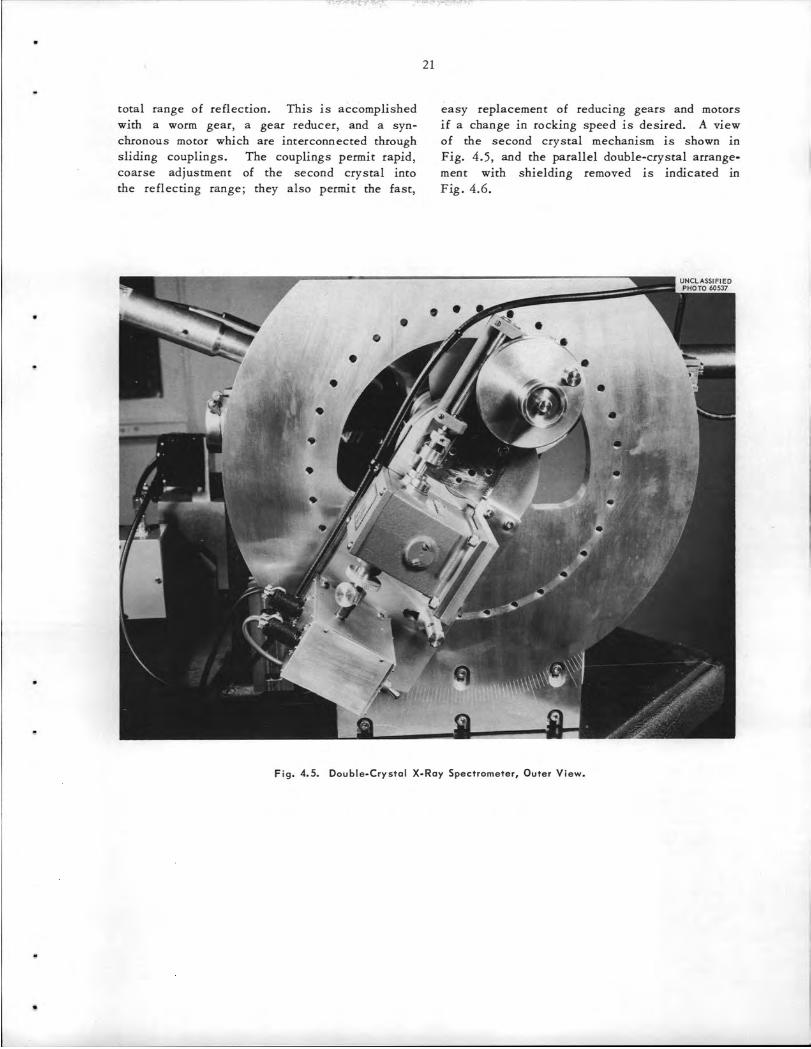
2 1
total range of reflection. This is accomplished easy replacement of reducing gears and motors with a worm gear, a gear reducer, and a syn- i f a change in rocking speed is desired. A view chronous motor which are interconnected through of the second crystal mechanism is shown in sliding couplings. The couplings permit rapid, Fig. 4.5, and the parallel double-crystal arrange- coarse adjustment of the second crystal into ment with shielding removed is indicated in the reflecting range; they also permit the fast, Fig. 4.6.
Fig. 4.5. Double-Crystal X-Roy Spectrometer, Outer View.

22
I I
I
L Fig. 4.6. Double-Crystol X-Roy Spectrometer with Shielding Removed and with Two Copper Crystals in the
Parallel Arrongement.
X-RAY LINE WIDTHS OF NEARLY PERFECT COPPER CRYSTALS13
M. C. Wittels F. A. Sherrill F. W. Young, Jr.
I t has previously been demonstrated'* that large, nearly perfect copper crystals could be grown and that the dislocation densi t ies deter- mined both by etch-pit counting and by Lang topographs were in substantial agreement. More recently, it has also been shown that anomalous
l3To be published in A p p l i e d Physics L e t t e r s (July
14M. C. Wittels, F. A. SherrilI, and F. W. Young, Jr., 1963).
Appl. Phys. L e t t e r s 1, 22 (1962).
x-ray transmission15 could be observed in crys- t a l s up to 1.3 mm thick. In the present investiga- tion, the double-crystal spectrometer was em- ployed to determine the half-widths of reflections from successive orders of (111) in copper so that comparisons could be made with the theoretical predictions of Darwin" for perfect crystals.
Crystals with (111) faces were prepared by acid sawing' and electropolishing, and the double- crystal spectrometer was arranged in the parallel
15M. C. Wittels, F. A'Sherrill, and F. W. Young, Jr.,
I6C. G. Darwin, Phil. Mag. 27, 325, 675 (1914). I7F. W. Young, Jr., and T. R. Wilson, Rev. Sci.
Appl. Phys. L e t t e r s 2, 127 (1963).
Znstr. 32, 559 (1961). .

23
position with crystal pairs adjusted as closely as possible to the parallel condition. For each reflection several runs were made as the crystals were removed and reset to ensure that nonsyn- chronous motion, counter dead t i m e , and noisy electronics were in no instance influencing the measurements. In addition, the second crystal was translated in 2-mm increments across the reflected beam from the first crystal so that the uniformity of perfection over lengths up to 1 cm could be determined.
Two kinds of rocking curve measurements were made. One kind involved pairs of copper crystals with the parallel arrangement; the other involved
the u s e of the (333) reflection from a perfect silicon crystal in the first crystal position to- gether with (222) reflections from copper crystals in the second crystal position. Fortuitously, this la t ter condition resul ts in an arrangement closer to parallel than even crystal cutting errors allow, namely <0.5’. It a l so allowed for a more accurate determination of a true half-width of the (222) for copper by eliminating the contribution of the broadening inherent in a slightly imperfect f irst copper crystal.
The results for the paired copper crystal s tud ies a re given in Table 4.1, together with the values calculated from the Darwin theory16 for perfect
Table 4.1. Half-Widths for Copper Crystals Using Mo K a ,
Measured Calculated a ,&Calculated Crystal Crystal Reflection Half-Widths Half-Widths X fi Half-Widths
(set) ( s e d Position 1 Position 2
Cu(B); dis- location density, -4 x 10³/cm2
Cu(A); dis- location density, - 2 x 10²/cm2
(111) 14.4 (222) 7.9 (333) 5.4 (444) 4.5 (555) 3.9
W A )
13.8 5.0 2.6 1.8 1.6
Si( 333); dis- location-free; measured half- width = 0.9 sec
Cu(A); dis- location density, - 2 x 1O2/cm2
3.6 3.0 Cu( B); dis-
location density, - 4 x 10³/,,~
3.2 3.6 Cu( 0; dis-
location density, -
5.0 3.6 Cu(D); dis-
location density, -3 x 10⁴/cm2
3.6 ~~
‘Darwin’s formula was used in making these calculations. bAccording to Darwin, Y = 3.6 sec for Cu(222).

24
crystals. H i s theoretical predictions give a crystal reflection curve. The true half-width (Y) range of total reflection whose width can be determined using the expression"
where N is the number of unit cells per cm3; h is the x-ray wavelength; F is the structure factor; 8 is the angle of reflection; K is the polarization factor (1 or c o s 28, depending on the polarization of the incident beam); and e, m, and c are the well-known physical constants. W e have utilized the Fermi-Thomas-Dirac statis- tical model" for the atomic scattering factors used in these calculations. The value Y in Darwin's expression is termed half-width in the usage here.
In the paired copper measurements an x-ray beam of cross section approximately 6 mm x 0.5 mm impinged on the second crystal; the radiation was Mo K a l ; and a krypton-filled Geiger tube was employed for counting purposes. The dis- location densi t ies shown were determined by etch-pit counts. Also indicated in the table are the resul ts for the measurements with the perfect silicon (333) in the first crystal position. In this case the x-ray beam cross section w a s ' reduced to 2 mm x 0.5 mm s o that the number of dislocations seen by the x rays was reduced or eliminated, depending on the dislocation density of the specific crystal examined. The perfection of th i s silicon crystal had been pre- viously determined by the double-crystal tech- niqu'e; and its half-width had been found to agree with the value recently reported,19 namely, a measured value of 0.9 sec for (333) with Mo K u l .
In the calculations using the Darwin l6 theory, we have assumed the polarization vector to be in the plane of incidence of the primary beam and have neglected temperature and absorption corrections. The calculated values for copper pairs in the table a l so include a multiplying factor ;/z which resul ts from the assumption that the reflection curve for each crystal is Gaussian with full width a t half maximum Y , giving a measured convoluted2' width f l y for the single-
Y = ( & @ ) 2 1 / 2 ,
where
Y = true half-width of the second crystal,
p = measured half-width of the second crystal,
@ = true half-width of the first crystal.
Since the half-width for 'perfect silicon (333) is considerably smaller than those half-widths measured for copper (222) , the measured values shown a re very near the true values.
Some typical rocking curves are shown in Figs. 4.7 and 4 . 8 . Several independent sets of meas- urements revealed that a region of uniform per- fection extended at least 1 cm across the (111) surfaces of Cu(A) and Cu(B). The data shown
2oR. W. James, The Opt i ca l Pr inc ip l e s of the Dif- fraction of X-Rays , p 318, Bell and Sons, London, 1950.
21A. D. Kurtz, S. A. Kulin, and B. L. Averbach, P h y s . Rev . 101, 1285 (1956).
UNCLASSIFIED ORNL- DWG 63-284
-40 -32 -24 -16 -8 0 8 16 24 32 40 ROCKING ANGLE ( s e d
Fig. 4.7. Reflection Curves for Cu(A) , Which Show
vol 111. the Effects in Increasing Orders of Reflection. The
was used os f irst
10, 759 (1962). crystal.
lSIntemational T a b l e s for X-Ray Crystallography,
191. R. patel, R. S. wagner, and s. M ~ ~ ~ , M ~ ~ . radiation was Mo K a , , and

.-.. .
25
UNCLASSIFIED ORNL- DWG 63- 283
- 20 - 10 0 10 20 ROCKING ANGLE ( s e d
Fig. 4.8. (222) Reflection Curves for Cu(A) and
The radiation was Mo K a , , and silicon (333) Cu(C).
from a perfect crystal was used as first crystal.
for copper crystal pairs are in reasonably good agreement with the data predicted by Darwin for perfect crystals. A s expected, the measured values are somewhat larger than the Darwin values, roughly to the same extent a s those recently reported for silicon19 crystals with similar imperfection concentrations. The fact that Cu(B), used a s the first crystal in these
measurements, had 4 x lo3 dislocations/cm2 present was probably an overriding feature in the failure to achieve even closer agreement with the Darwin predictions. By employing the silicon (333) reflection from perfect silicon for the first crystal and copper (222) reflections in the parallel second crystal arrangement, we found a marked narrowing in the (222) rocking curves a s indicated in Table 4.1 and Fig. 4.8. In fact, for Cu(A) and Cu(B) the half-widths are somewhat smaller than those predicted by Darwin for perfect copper crystals. I t should be empha- sized that the copper-pair and silicon-copper measurements are not strictly comparable, how- ever, because x-ray beams of different cross sections were employed and more imperfections were seen in the former case. In addition, the measurements would be somewhat altered with polarization conditions different from those we have assumed. If IF1 in Eq. (1) were replaced by some thermal narrowing might occur even a t room temperature because a,, the Debye characteristic temperature for copper, is only 315OK. Simple estimates show that this effect would not be large enough to produce the narrow- ing noted, however; and additional thermal studies are certainly indicated.
Although there is some evidence indicating a finite half-width increase corresponding to a dis- location density increase in copper, the data are only qualitative, The validity of the Darwin theory on crystal perfection s e e m s to be applicable to metals, semiconductors, and insulators. The cor- relation of imperfections and thermal effects with x-ray line widths in copper crystals is being in- vestigated further.
GRAPHITE-STORED ENERGY IN THE OGR
M. C. Wittels
The ORNL Graphite Reactor was annealed in October 1962 by the usual reversed-air-flow proc- ess. The addition of channel orifice devices in the outer perimeter of the reactor core allowed annealing temperatures to be reached in the outer- most fuel channels. Stored-energy measurements ,
in graphite samples removed before and after the annealing program revealed a substantial degree of success in the removal of spontaneously releasable stored energy. This was strikingly evident in the
.

26
c
corner fuel channels, where significant amounts of ca te the effect of peripheral channel orificing, stored energy existed prior to the annealing opera- the extent of all three cycles is shown in Fig. tion. 4.10. Except for very minor unannealed fringes
The stored energy in four of these channels is in the northern corners and a pocket on the north shown in Fig. 4.9. Table 4.2 lists the post- lateral side, it is evident that this l a s t annealing ~
annealing resul ts of stored energy; and to indi- program was highly successful.
PRE-1962 ANNEAL POST- 1962 ANNEAL POST-STORED ENERGY RELEASE
I
0 4 8 12 16 2 0 2 4 2 8 32 3 6 0 4 8 12 16 20 2 4 2 8 32 36 TIME ( m i n ) TIME (min)
.
Fig. 4.9. Stored-Energy Release Data.

27
,
Table 4.2. Stored-Energy Data - December 1962
Distance Maximum from Energy
East Edge (cal/g) Temperature ( ft) (OC)
2980 2980 2980 2980 2957 2357 29 57 0757 0757 0757 0 780 0780 0780
3167 3167 3167 2055 2055 2055 0569
Corner Fuel Channels
2.5 4.6 5.5 2.8 9.5 2.2
13.5 5.8 4.5 7.7 8.5 3.2
11 16.8 3.5 9.7 6.5 3.4
11 6.7 3.5 4.2 6.5 2.2 8.5 21
Lateral Fuel Channels
3.5 29.3 8.5 45.1
11 37.4 3.5 15.2 6.5 3.6 9.5 10.8 3.5 6.6
2 37 238 237 2 39 2 39 237 24 1 240 238 239 2 38 2 38 2 37
258 262 2 59 24 1 237 240 240
Distance Maximum from Energy Temperature
( ft)
East Edge (cal/g) (OC)
0569 0569 1982 1982 198 2
3467 3467 3467 3567 3567 3567 3055 3055 3055 3255 3255 3255 3453 345 3 3453
Lateral Fuel Channels (continued)
6.5 4.3 238 9.5 2.7 237 3.5 6.4 238 6.5 1.2 237 9.5 2.6 237
Reflector Channels
4.5 6.5
3.5 6.5
4.5 7.5
4.5 7.5
3.5 6.5
11
11
1 1
11
11
1.8 6.8 2.1 0 0 0 8.3
13.8 15.8 0 0 0 0 0 0
237 238 237 237 237 237 2 38 2 38 238 2 37 237 23 7 2 37 237 237
.
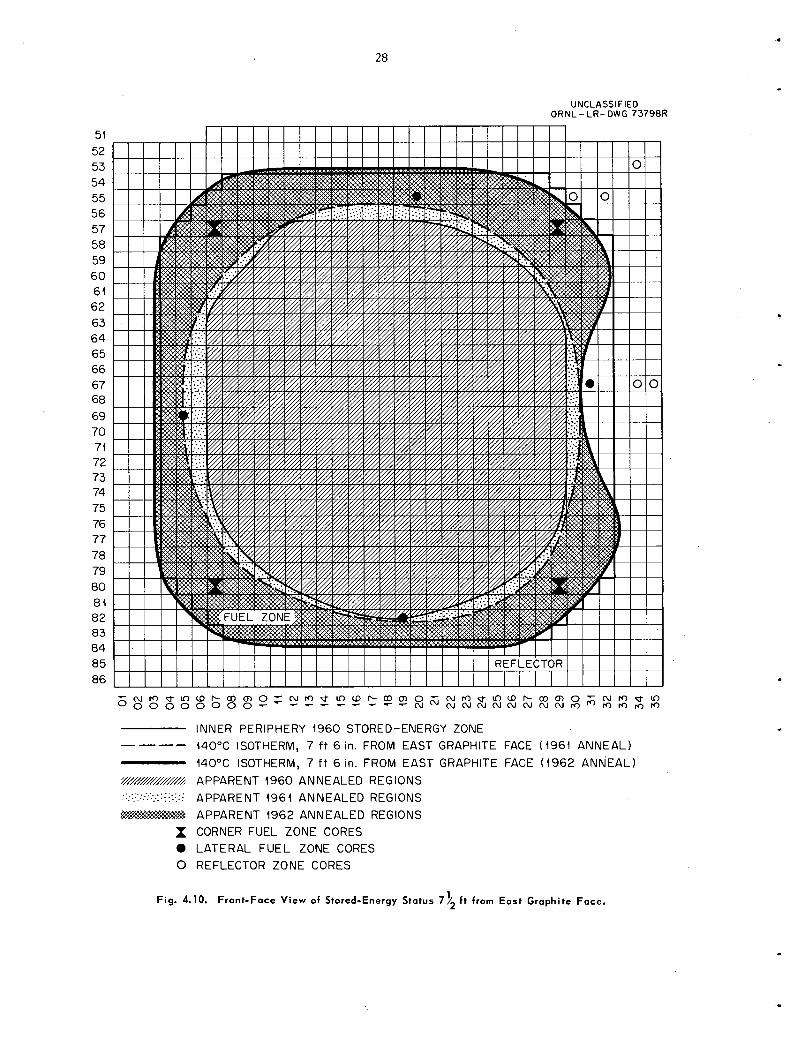
28
.
51 52 53 54 55 56 57 58 59 60 61 62 63 64 65 66 67 68 69 70 71 72 73 74 75 76 77 78 79 80 81 82 83 84 85 86
UNCLASSIFIED ORNL- LR- DWG 73790R
INNER PERIPHERY 1960 STORED-ENERGY ZONE 14OOC ISOTHERM, 7 f t 6 in. FROM EAST GRAPHITE FACE (1961 ANNEAL) 140OC ISOTHERM, 7 f t 6 in. FROM EAST GRAPHITE FACE (1962 ANNEAL) APPARENT 1960 ANNEALED REGIONS APPARENT (961 ANNEALED REGIONS APPARENT 1962 ANNEALED REGIONS CORNER FUEL ZONE CORES LATERAL FUEL ZONE CORES REFLECTOR ZONE CORES
Fig. 4.10. Front-Face View of Stored-Energy Status 7 4 1 ft from East Graphite Face.

5. Electron Microscopy
FISSION TRACKS IN SINGLE CRYSTALS OF UO,'
T. S. Noggle
Fission-fragment tracks are observed in pre- thinned and irradiated UO, single crystals a s a result of the diffraction contrast arising from strain fields associated with material disturbed by the passage of the fission fragment. Figures 5.la and 5.lb show typical track structures in this material and illustrate the effect on track contrast of vary- ing the diffraction conditions by tilting the speci- men. For comparison, typical track structures ob- served in evaporated polycrystalline f i lms of UO are shown in Fig. 5.2 .2e3 In this latter ca se the appearance of the tracks is not affected by tilting, because it ar ises a s a result of the displacement of material out of the track volume, which leaves a locally thinner region that is more transparent than the original film.
Replica studies of the free surfaces of the sin gle crystals show that surface disturbances ar also generated by the fission fragments. Figur 5.3 shows the surface disturbance observed wit replicas on the single crystals, while Fig. 5. shows typical results for the evaporated fi lms. 1 may be noted that surface disturbance in the single crystals is much less than that in the evaporated fi lms. The surface disturbance on the single crystals by passage of fission fragments through the surface is so slight that little informa- tion can be deduced concerning the detailed nature of the disturbance.
'Summary of a paper to be presented at the 2lst Annual Meeting of the Electron Microscope Socie ty of America. Denver, Colo., Aug. 28-31, 1963.
2T. S. Noggle and J. 0. Stiegler, J. Appl. Phys . 31, 2 199 ( 1960). 3T. K. Bierlein and B. Mastel, J. Appl. Phys. 31,
23 14 (1960).
Track s ta t is t ics from both transmission and replica studies give lower densit ies and lengths than expected, and these can be reconciled to the theoretically expected results by assuming that
t
L 0 3 P 1
Fig. 5.1. UO, Single Crystal Irradiated to a Dose of
5 x 10¹⁴ fissions/cm3. Sections a and 6 i l lustrate
effectof ti lt ingon track contrast. 80,OOOX. Reduced 38%.
29
m

30
.
Fig. 5.2. 100-A-thick F i l m of UO,. 50,OOOX.
Fig. 5.3. Platinum-Preshadowed Carbon Replica of UO, Crystal Irradiated to a Dose of 5 x 10¹⁴ fissions/cm 3 . 1 10,000 x.

31
Fig. 5.4. Platinum-Preshadowed Carbon Replica of Evaporated Thin F i lm of UOq. 110,OOOX.
tracks are registered only for that part of the path near the surface of the crystal. Interpretation of the s ta t is t ics with this assumption leads to the result that for replica studies detectable surface disturbances are associated with depths no greater than 20 to 40 A, while transmission studies indi- cate an effective thickness of 100 to 300 A for crystals 500 to 1000 A thick.
To date, no tracks have been observed in crys- tals thinned subsequent to irradiation, and this
.) fact is in line with the result deduced from the
track s ta t is t ics that the registration of the tracks occurs only near the free surface of the crystals. In addition, no unusual etching behavior has been noted in the irradiated crystals a s might be ex- pected from the observation of etching of fission- fragment tracks in mica.
All the results obtained to date suggest that the registration of continuous fission tracks in UO single crystals is associated with the surface
.
4
%. B. Price and R. M. Walker, I . Appl. Phys. 33, 3407 (1962).
regions and presumabIy ar ises from the reduced restraint to the displacement of material by the fission spike a t and near the free surface.
THIN FILMS AND FOILS
T. S. Noggle
EIecti irradiac phasis control believe1 structur effect I
has bee has bet not o c a than a!
5T. S. 1726 (19

32
range of thicknesses, over which the different thermal mechanisms contribute to track registra- tion, is l e s s than that found previously for palla- d i u m 5 It is now thought that the grain s ize of these polycrystalline f i l m s plays an important role in the energy transport mechanism believed to de- termine the details of track registration. Experi- ments are in progress to vary the grain s ize in
1 films of constant thickness in order to establish the contribution of this parameter to track registra- tion.
Thin-foil studies on radiation effects in alloys are being made in cooperation with the Radiation Metallurgy Section. Preliminary studies of Cu-15
G at. % A!, irradiated to give minimum resistance, revealed no detectable structures which could be attributed to radiation effects in this material. These observations are being extended to higher irradiation doses for which the mechanical proper- ties are changed by the irradiation. 7
Fi Show Red1
Similar studies are being made on low-disloca- tion-density copper specimens with the purpose of establishing whether structures not detectable by etch-pit or x-ray techniques8 are present in this material. Difficulties have arisen in specimen preparation, due to the introduction of dislocations in this extremely soft material; and refinement of techniques has reduced, but not eliminated, these difficulties.
The recent acquisition and installation of a Hitachi HU-11A electron microscope with acces- sory stages providing tilting, heating, and cooling is expected to facilitate the study of thin foils and permit manipulation of specimens in ways heretofore not possible. This instfument will also permit electron microscope studies under high resolution conditions. Examples of results obtained during preliminary studies are shown in Figs. 5.5-5.8.
J. M. Williams e t al . , Solid State Diu. Ann. Progr. G
Rept . Aug. 31, 1962, ORNL-3364, pp 127-34.
7T. S. Koppenaal, Bull. Am. Phys . SOC., Ser. I1 8(3), 197 (1763). Fii
8M. C. Wittels e t al., Solid State Diu. Ann. Progr. ing Redu Rept . Aug. 31. 1962, ORNL-3364, pp 35-37.
. I
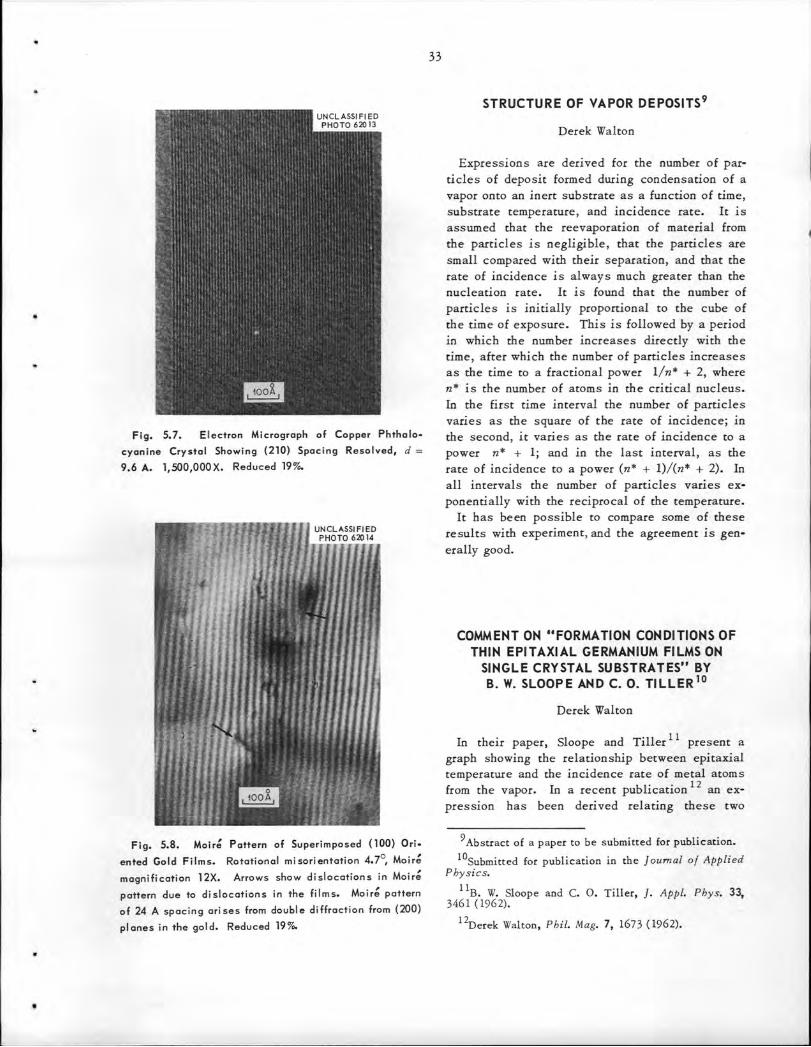
33
STRUCTURE OF VAPOR DEPOSITS9
Derek Walton
Fig. 5.7. Electron Micrograph of Copper Phthalo-
cyanine Crystal Showing (210) Spacing Resolved, d = 9.6 A. 1,500,000X. Reduced 19%.
Fig. 5.8. Moir; Pattern of Superimposed (100) Ori-
ented Gold Films. Rotational misorientation 4.74 Moir;
magnification 12X. Arrows show dislocations in Moir:
pattern due to dislocations in the films. Moir; pattern
of 24 A spacing arises from double diffraction from (200) planes in the gold. Reduced 19%
Expressions are derived for the number of p a r t icles of deposit formed during condensation of a vapor onto an inert substrate a s a function of time, substrate temperature, and incidence rate. I t is assumed that the reevaporation of material from the particles is negligible, that the particles are small compared with their separation, and that the rate of incidence i s always much greater than the nucleation rate. I t is found that the number of particles is initially proportional to the cube of the t ime of exposure. This is followed by a period in which the number increases directly with the time, after which the number of particles increases a s the time to a fractional power l /n* + 2, where n* i s the number of atoms in the critical nucleus. In the first t ime interval the number of particles varies a s the square of the rate of incidence; in the second, it varies a s the rate of incidence to a power n* + 1; and in the l a s t interval, a s the rate of incidence to a power (n* + l)/(n* + 2). In all intervals the number of particles varies ex- ponentially with the reciprocal of the temperature.
It has been possible to compare some of these results with experiment, and the agreement is gen- erally good.
COMMENT ON "FORMATION CONDITIONS OF THIN EPITAXIAL GERMANIUM FILMS ON
SINGLE CRYSTAL SUBSTRATES" BY B. w. SLOOPE AND c. 0. T I L L E R ' O
Derek Walton
In their paper, Sloope and Tiller ' ' present a graph showing the relationship between epitaxial temperature and the incidence rate of metal atoms from the vapor. In a recent publication l 2 an ex- pression has been derived relating these two
'Abstract of a paper to be submitted for publication.
"Submitted for publication in the ]ournu1 of Appl i ed P h y s i c s .
I'B. W. Sloope and C. 0. Tiller, 1. Appl. Phys . 33, 3461 (1962).
"Derek Walton, Phil . Mag. 7 , 1673 (1962).

variables. Thus, it is the purpose of this com- munication to briefly investigate the applicability of the expression to the results obtained by Sloope and Tiller.
If it is assumed that for the deposit to be ori- ented, i t is necessary for an atom joining a grow- ing cluster to be bonded to it with more than a single bond, the epitaxial temperature should be the temperature at which a single bond becomes unstable. Thus the epitaxial temperature should be given by '
where U is".the energy of a single bond, g a d is the binding energy of a single atom to the surface, R is the incidence rate from the vapor, u is the separation between adsorption sites, and 1/ is a frequency of vibration of the order of 10 12 .
Sloope and Tiller find that the onset of poly- crystallinity in the f i lm occurs a t a fixed incidence rate for a given substrate temperature. Consider that this temperature is the epitaxial temperature corresponding to the incidence rate at which the monocrystalline to polycrystalline transition oc- curs. If the reciprocal of the epitaxial temperature is plotted against the logarithm of the incidence rate, a straight line is obtained a s expected from Eq. (1). The slope of this l ine corresponds to an energy of 1.36 ev, and thus the experimental value for the term ( R U ' / V ) would be 5 x at 823OK. Since R is of the order of 10 atoms c m - sec- ', a2 ,10-15cm2, and ~ ~ I O ~ ~ s e c - ' , the calcu- lated value for this quantity would be of the order of IO-''. Considering the assumptions made in the theory and the uncertainty imposed by the ex- perimental conditions, the agreement is reasonable. Thus it can be concluded that the simple theory, which leads to Eq. (I), appears to be applicable in this case.

.
.
ELECTRON SPIN-LATTICE RELAXATION AT DEFECT SITES: E’CENTERS IN SYNTHETIC
QUARTZ AT 3 KILO-OERSTEDS’r2
J. G. Castle, Jr. R. A. Weeks
D. W. F.eldrnan P. G. Klemens3
Measurements of the spin-lattice relaxation t i m e T I by the inversion-recovery technique are re- ported for two paramagnetic centers in quartz over a wide temperature range: from 1.3 to 250°K for the E center, and from 2 to 80°K for the E ; center. The data, extending over several orders of magni- tude in T I , are interpreted in terms of cross relax- ation, direct processes , and Raman processes. The dominant feature of the Raman relaxation is a temperature variation of about T 3 , which is much slower than expected by standard theory.
The theory of spin-lattice relaxation is extended to account for the modification at a defect site of the strain due to a latt ice wave. Each defect has at leas t one characteristic frequency, and the local strain due to a wave of higher frequency is enhanced, being essentially given by the displace-
6. Spin Resonance
35
ment due to the wave, rather than its spatial de- rivative. If the characteristic frequency is suf- ficiently low compared to the Debye frequency, the Raman relaxation rate should vary as T 3 (or T 5 ) over a wide range of temperatures, instead of the usual T7 (or T 9 ) variation.
A detailed comparison of the relaxation rates observed for the two E’ centers with the above theory suggests that each center h a s two charac- terist ic frequencies or temperatures Oi. For the
‘Abstract of published paper: Phys. Rev. 130, 577 (1963).
’Supported i n part by the U.S. Air Force through the Air Force Cambridge Research Laboratories.
3Westinghouse Research Laboratories, Pittsburgh, P a .
E ; center one of these (ei = 45’K) is ascribed to the vibration of a neighboring impurity ion, prob- ably a proton. The other temperature ( 2 5 % ) may arise from the motion of oxygen ions at the defect. The E ; center h a s the two characteristic temperatures of 140°K and 14OK.
A model for the E ; center is proposed: An elec- tron is trapped at a silicon ion located in an oxy- gen divacancy. This model leads to the likelihood of low characteristic frequencies through a non- rigid SiO, group and a l so through a net negative charge, which should attract one o r more inter- stitial impurity ions.
DIRECT FIELD EFFECTS IN THE HYPERFINE SPECTRA OF A PARAMAGNETIC DEFECT IN
QUARTZ: THE E ; CENTER
R. A. Weeks
One of the principal features of the spectra of the E ; center in synthetic quartz4 is determined by an interaction with a nearby proton. The pres- ence of the nearby proton is confirmed by com- paring the spectra in a crystal grown in D,O with crystals grown by the usual hydrothermal technique. For the interaction with the proton, ( y ( H ) P,HI is greater than both \A I and IBI, where y ( H ) is the nuclear g factor of the proton, P, is the nuclear magneton, H is the applied field, and A and B are the principal values of the hyperfine interaction tensor. It has been shown5 that for this case the energy of the transition for an S = 1/2 s ta te is
4R. A. Weeks, Phys. Rev. 130, 570 (1963). 5J . A. Weil and J . H. Anderson, I . G e m . Phys. 35,
1410 (1961); H. H. Woodbury and G. W. Ludwig, Phys. Rev. 124, 1083 (1961).

36
\
where the symbols have their usual meaning and 8 is the angle between the axis of symmetry and the applied field.
In Fig. 6.1 the orientation dependence of the spectra of the E ; center is shown. There are five significant features of t h i s orientation dependence. (1) The observed anisotropy is small, that is, gL= g,, = 2.00. (2) The number of l ines observed for the rotation about a twofold axis with H , the laboratory field, perpendicular to the twofold axis, may be interpreted as arising from a hyperfine interaction with a nucleus whose spin, I, is 1/2, and whose isotopic abundance is “100%. (3) If the l ines are assumed to be doublets, arising from a hyperfine interaction with a nucleus of I = 1/2, then the hyperfine interaction goes to zero twice within a rotation angle of 77. (4) The hyperfine interaction is very small compared to the inter- action of the paramagnetic electron with the lab- oratory field. (5) Measurements a t a field of 8700 gauss showed that the doublet splitting was inde- pendent of field and thus due to a hyperfine inter- action i n which AMI = 0, where AM, is the change in the nuclear quantum state.
, - U T ,
3643
3644
.... VI
3
3645 - 0 J
L L w 0
3646 z W
2 a
x- 3647
[1 3648
2x10⁹ r Go60 rWOFOLD ROTATION AXIS
AMEDIAN VALUES OF THE -r - * L I N E POSITION
DOUBLET PAIRS
% 20
If t h i s hyperfine interaction is due to an inter- action of the paramagnetic center with a nearby proton, then the substitution of a deuteron for the proton should produce the following results: (1) Since the moment of the deuteron is less than the moment of the proton, the observed splitting should b e proportionately less. (2) The spin of the deu- teron is I = 1, which would form a triplet instead of the doublet formed by the proton with I = 1/2. (3) Because of field inhomogeneity, the triplet due to the deuteron should not be resolved and only a broad l ine should be observed. (4) There should b e no change in the spin-orbit interaction of the paramagnetic center.
The spin resonance of a deuterated specimen of synthetic quartz is shown in Fig. 6.2c, and that of a crystal grown from a normal solution is shown in Fig. 6 . 2 ~ . In Fig. 6.2b both crystals were placed in the cavity at the same time. The resul ts a re i n agreement with the predictions made above and confirm the hypothesis that the observed spectrum is due to an interaction of t h e paramagnetic center with a nearby proton.
~
160 140 120
a , ANGLE (deg 1
ASSlFlED ?-DWG 76320
L
I .
100
Fig. 6.1. Spectra of the E ; Center for a Rotation About a Twofold Axis. Each solid circle i s a l ine position,
T h e triangles are the median and the relative l ine intensities are shown by the number of c ircles around each point.
values of each pair of doublets. The curves were colculated from the g tensor.

37
UNCLASSIFIED ORNL-LR-DWG 76319
4
3 2
4 - $ 0 5 - 4 2 -2 D f: -3
b -4 3 4
0 - g -5 2
,i? L -2
z U z
W K
0 W > I-
K
4
0 -1
-3 -4 -
I -5
x 4 g 3 3 2
a " '
-6
0 - 4
-2 I I I I I I I I
2.0 4.6 4.2 0.8 0.4 0 -0.4 -0.8 -4.2 -1.6
H-Ho. INCREMENT OF FIELD (gauss)
Fig. 6.2. The Spectra i n the V ic in i t y o f the E ; Center
in the Synthetic Crystals and i n the Deuterated Crys-
tals. The values for the magnetic f ie ld were determined
by a proton resonance probe, and the re la t i ve error i n
the three measurements was kO.1 gouss. The modula-
t ion f i e ld was "0.07 gauss, peak to peak.
Along an axis of symmetry for one set of the doublets, the splitting of the doublets was found to be "1.5 gauss, while in a direction perpendic- ular to this symmetry axis the separation was "0.2 gauss. These two quantities comprise the A and B terms of Eq. ( l ) , in which A 2' f1 .3 gauss and B = kO.2 gauss. Since the magnitude of the di- rect field interaction term with the proton is IyP,HI 2 5 gauss for the field of "3600 gauss used in these measurements, it is evident that the transition energies are given by this equation. Curve I in Fig. 6.3 was calculated with the values of A and B , and the data points were taken from Fig. 6.1 for one set of doublets. Applying the symmetry operations appropriate for a quartz crys- tal to the equation, that is, a rotation by 120° and 240°, curves I1 and 111, respectively, were cal- culated. The data points were taken from the re- maining two sets of doublets, and i t is seen that the agreement of the data with the calculated curves is quite good.
"
For this paramagnetic center the source of the principal hyperfine interaction is a nearby proton, that i s , a hydrogen ion. It is presumed to be in- corporated in the quartz structure by a bond to an oxygen ion. The laboratory field at the proton is larger than the field due to the paramagnetic cen- ter; hence, the quantizing field is the laboratory field. In this ca se the usual orientation depend- ence of the hyperfine interaction should not b e
UNCLASSIFIED ORNL-LR-DWG 76321
80 60 40 20 0 160 140 120 100
a , ANGLE (deg)
Fig. 6.3. The Separation o f the Three Sets of Doublets I s Shown for a Twofold Rotat ion Ax is Perpendicular to
The data po in ts were taken from Fig. 6.1, and the curves were colculated by a method described the Appl ied Field.
i n the text.

38
observed. The agreement of the observed orienta- tion dependence of the interaction with that which was calculated from a solution of the secular equation appropriate to this approximation is con- firmation that the field of the paramagnetic elec- tron at the proton is less than the laboratory field.
I
EFFECTS OF IRRADIATION ON POLARIZATION CURRENTS IN GLASS
R. A. Weeks
In the las t report on th i s subject' it was shown that the polarization current in the lead sil icate g l a s s could be resolved into four distinct com- ponents each characterized by a t i m e constant r. It was also shown that the strengths of these polarization processes were enhanced by gamma- ray irradiation up to a dose of "lO'r. For higher doses an apparent decrease in the strengths of some of these processes took place, but the data showing this decrease had a considerable scatter.
It has now been found that such a decrease does take place, although the particular polarization processes associated with the decrease have not been resolved. In addition to the enhancement, which is stable a t room temperature for long peri- ods of t i m e ("4 weeks), there is a large increase in the polarization current observed immediately after irradiation, which disappears in -24 hr. Ad- ditional measurements have also been made on the polarization currents a s a function of voltage. These have supported the hypothesis that the con- ductivity is ohmic.
The polarization P is defined a s the electric dipole moment per unit volume and is given by the relation
P = D - EoE , (1)
where D is the displacement field, E is the lab- oratory field, and eo is the dielectric constant. The current for a constant laboratory field is 1 =
do/&, and from Eq. (l), -1 = JP/dt . The polarization P ' a t a microscopic point in the
material being polarized can also be written
P ' = N a E ' , (2)
'R. A. Weeks and E. Lel l , Solid State Div. Ann. Progr. R+t, Aug. 31, 1962, ORNL-3364, p 47.
where N is the number of polarizable units, a is the polarizability, and E ' i s the local field acting on the polarizable units. Thus, the current due to these units is
J
at ( 3 ) j ' = - ( N ~ E ' ) .
The polarizing enti t ies have been represented by only one term in Eq. (3 ) , but in a real material, it is certainly probable that several such terms may be required. Therefore, a better approximation would be to write the polarizability term a s a sum-
n mation, for example, a= 2 N i a i .
i= 1
One of the terms in this summation originates from space-charge effects. The space-charge term is due to an accumulation of charges a t the electrodes and also a t internal surfaces. With re- spect to the g l a s ses the experimental results shown in Fig. 6.4 and other results' indicate that there is no electrode space-charge term. Consider- ing the known properties of g lass , it also appears reasonable to eliminate a space-charge term on internal surfaces. With the elimination of the space-charge terms, only the dipole and orienta- tion terms are left , and Eq. ( 3 ) can be written
c z w a a 3
UNCLASSIFIED ORNL-LR-DWG 78779
0.10 0.5
0.08 0.4
0 06 0.3
0 04 0.2
0.02 0.1
'0 2 4 6 8 l x1031
WLTAGE APPLIED TO SPECIMEN ( v / m )
Fig. 6.4. The Polarization Current in a Lead Silicate
Glass I s Given as o Function of Voltage for Various
Times After Application of the Polarizing Voltage.
Before each increase in the voltage the specimen was
depolarized by shorting the electrodes.

. 39
The relation between the observed current and the current at a microscopic point must now b e considered, and there are several experimental facts which have a bearing on th i s problem. These experimental results are: (1) The observed cur- rents are proportional to applied voltage for vol- tages >3900 v/cm or to duration of applied vol- tages for times =120 min. (2) The observed polarization currents and final conductivity (a t t i m e s >30 hr) are inversely proportional to the thickness of specimen. (3) T h e principle of super- position is obeyed. On the bas i s of these facts, it is assumed that the observed current and the sum of microscopic currents are identical, that i s ,
The experimental observations, which have been reported, have been fitted to a sum of exponential terms.6 The number of such terms required to fit the data is 4 plus a constant term, and the charac- terist ic t i m e s of these four terms are not altered by irradiation. These four terms may be related to the dipole and orientation polarizability terms. Although it is not possible from these data to dis- tinguish the terms, the summation terms in Eq. (4) may be reduced to four terms. Since these data showed that only the strengths of the terms were altered by irradiation, and that the polarizability, terms, as defined by the characteristic times, were constant, Eq. (4) becomes
>
J =J‘.
+ a ~ + a , < ) dN dN
at
aE ‘0) + ( u l N l + u 2 N 2 + a N +a4N4)-. ( 5 )
3 3 at
This equation h a s the implied assumption in it that d E ’ ( t ) / a t is small relative to the a N i / a t terms. However, since information on this term is lacking, it h a s not been omitted.
Experimental Resul ts
It has been noted that the polarization currents observed in the lead s i l ica te g l a s s were ohmic. Additional experimental verification of the ohmic character of the polarization current is shown in Fig. 6.4. In these measurements the polarization currents were obtained as a function of voltage.
A given voltage was applied for a period of ”125 min, and the specimen was then depolarized com- pletely before the next voltage was applied. The data points were obtained for varying periods of t i m e after the application of the voltage. For the shorter periods of time (10 min and 20 min) the current is not a linear function of voltage below “4000 v/cm. A t 120 rnin after application of the voltage the current is approximately proportional to voltage for both of the g l a s s e s shown in Fig. 6.4. Although not shown, observations on a pure silica g lass have indicated a linear relation be- tween current and voltage from 10 to 120 min. It is evident from Fig. 6.4 that above 4000 v/cm the polarization current is proportional to the applied voltage in the three g lasses which have been in- ve stig at ed.
The strengths of the four polarization processes were reported to vary with gamma-ray dose.6 Some data were given that seem to indicate a peak in the strengths of some of those processes a s a function of dose. T h i s peak has been verified although the particular processes (identified by their characteristic times), which are involved, have not been identified. This effect is shown in Figs. 6.5 and 6.6. In Fig. 6.5 the polarization currents at two t i m e s after application of a vol- tage (3900 v/cm) are shown a s a function of CoG0 gamma-ray dose. The peak in the enhancement of the strength of the polarization current by irradia- tion is clearly evident in both curves. There are differences between the two curves, which indicate that those processes with large characteristic t i m e s are primarily affected by the irradiation. T h i s is evident in the ratio between the peak value and initial value for the 10-min curve (-3) and that for the 120-min curve (“5.6) and also in the ratios of peak value to the value at maximum dose ( 1 . 3 for the 10-min curve and 1.7 for the 120-min curve). There are also some differences in the shapes of the curves.
In Fig. 6.6 the polarization currents a s a func- tion of duration of applied voltage are shownfor various CoG0 gamma-ray doses. The odd-numbered curves were obtained 24 hr after irradiation and the even-numbered curves were measured immedi- ately after irradiation. A comparison of curves XI11 and XV with curve VI1 shows that the largest changes in the polarization occur in those proces- ses with the longest characteristic t imes .
.

40
The even-numbered curves in Fig. 6.6, taken immediately after irradiation, show that there is an enhancement of the polarization, which disap- pears in "24 hr. This enhancement is apparently independent of gamma-ray dose for doses greater
UNCLASSIFIED ORNL-DWG 63-150
IO 20 50 I O 0 200 500 (000 2000 5000 t , INTEGRATED IRRADIATION TIME (min)
than 10 min. It may also be independent of dose for those of shorter duration, but experimental evidence is lacking. An investigation of the decay of this short-lifetime enhancement h a s indicated that a t least two processes may be involved.
Fig. 6.5. The Polar izat ion Current i n a Lead S i l i ca te
Glass a t Various Times After Appl icat ion of the Polar-
i z ing Voltage I s Shown as a Funct ion of Co60 Gamma-
Ray Dose. The specimen was depolarized between
each i rradi at ion.
UNCLASSIFIED ORNL-DWG 63-15t
I - I I 0 10 20 30 40 50 60 70 00 90 100 110 420
t , DURATION OF APPLIED VOLTAGE (m id
Fig. 6.6. The Polor izat ion Current i n a Lead Si l icate Glass I s Given for a Period of 120 min as a Funct ion of
The even-numbered curves were recorded immediately after irradiat ion, and the odd- Co60 Gamma-Ray Dose.
inumbered curves were recorded 24 hr later. The specimen was depolarized after each measurement.

.
.
LONGITUDINAL CRITICAL CURRENTS IN COLD-DRAWN SUPERCONDUCTING ALLOYS'
S. T. Sekula R. W. Boom C. J . Bergeron'
The critical-current behavior of cold-worked hard superconductors in a transverse magnetic field h a s been extensively r e p ~ r t e d , ~ - ~ and a marked ani- sotropy of cri t ical current h a s been observed in these materials. 6-8 However, the dependence of cri t ical current on magnetic field in orientations other than transverse has been studied in only a few cases ; lo the high-current regions have been generally neglected. The following is a report on the behavior of several cold-drawn hard supercon- ductor wires in magnetic fields which are parallel to the superconducting transport current.
Commercially available superconducting alloys, cold drawn to 0.010-in. diameter, were tested in the Oak Ridge 100-kilogauss 2-in.-ID magnet. Joints with resistances less than lo-' ohm were of the
7. Superconductivity
41
'Published in Appl. Phys. Le t t e r s 2 ( 5 ) , 102 (1963). *Consultant to Electronuclear Division from Louisiana
S ta te University, New Orleans. 3J. E. Kunzler, Bull. Am. Phys. SOC. 6, 298 (1961). *T. G. Berlincourt, R. R. Hake, and D. H. Les l i e ,
Phys. Rev. Let ters 6, 671 (1961).
5J. E. Kunzler, 1. Appl. Phys. 33, 1042s (1962).
6M. A. R. Leblanc and W. A. Little, Proceedings of the Seventh International Conference on Low Tempera- ture Phys i c s , p 362, University of Toronto P r e s s , Toronto, 1960.
'R. R. Hake and D. H. Les l i e , Proceeding o/ the Eighth International Conference on Low Temperature Phys i c s (to be published).
*D. Freeman, Linde Corp. (private communication).
9J. G. Daunt et al., Cryogenics 1, 212 (1962).
"P. R Aron and H. C. Hitchcock, 1. Appl. Phys. 33, 2242 (1962).
pressed-copper type described previously. ' ' All ~-
samples were cast in Emerson and Cummings Stycast type-2850FT epoxy to prevent sample motion. The current supply was controlled by carbon compression rheostats in ser ies with a battery bank; the voltage sensitivity a t initiation of a transition was about 0.1 pv. A variable shunt of approximately ohm was used in the circuit to ensure that the temperature of the samples did not exceed 300°K after the resist ive transition. All measurements were taken at 4.2OK.
The critical-current behavior of four cold-drawn Nb-Zr alloys from one commercial source is shown in Fig. 7.1; similar results were obtained for
"L. D. Roberts and R. W. Boom, Bull. Am. Phys. SOC. 7, 574 (1962).
400
350
- 300 E
C 250 z w LT 0:
a - I
2 200 _I
U
Lz V
a E 150
'- 100
50
0
UNCLASSIFIED ORNL-LR-DWG 70461R
eX1o5
4 x IO5
0 IO 20 30 40 50 60 70 80 90 H, E X T E R N A L F I E L D (kgouss)
Fig. 7.1. Longitudinal Crit ical Current vs Applied
Field for Several Cold-Drawn Nb-Zr Alloys.

42
samples from other suppliers. In the longitudinal configuration, maxima in critical currents for all atomic percentages of zirconium occur a t 20 to 30 kilogauss. With one sample of Nb-25 at. % Zr we have measured a critical current of 480 amp at 25 kilogauss, which corresponds to a current den- sity of 10' amp/cm2. The longitudinal critical- current characteristics of a 0.012-in.-diam cold- drawn Mo-33 at. % Re sample and of two different s i z e s of cold-drawn Ta-25 at. % Ti are shown in Fig. 7.2. In these two al loys maximum critical cur- rents are obtained at fields of 5 kilogauss and 20 kilogauss respectively. The maximum critical cur- rents for these alloys in a longitudinal field repre- sent increases over zero-field values ranging from 50% to 150%. Grassman and Rinderer l 2 have previ- ously observed a 10% peaking of the critical current in longitudinal fields for Pb-10 at. % Bi wires.
"P. Grassman and L. Rinderer, Helv. Phys. A c t a 27, 309 ( 1954).
UNCLASSIFIED ORNL-LR-DWG 76746
300
250
'i
100
50
0 0 20 40 60 80
H. EXTERNAL FIELD (kgauss)
Fig. 7.2. Longitudinal Cri t ical Current vs Applied
F ie ld for Cold-Drawn To-25 at. % Ti and Mo-33 at. %
Re Samples.
Since the critical current is markedly enhanced in a longitudinal field, the concept of force-free magnet design13 is made all the more tempting. Consequently, a one-layer toroid, 4 in. in mean diameter and 0.5 in. in cross-section diameter, was constructed with 0.010-in. Nb-25 at. % Zr wire in a force-free configuration, that is, current flow a t 45Oto the radial vector. This toroid carried 120 amp and produced a longitudinal field of ap- proximately 4000 gauss a t the winding; the critical current was only one-half of that observed for the s a m e material in a short-wire test. Mechanical deviations from strigent force-free conditions could have caused the current loss. Since 120 amp is not unusually large for an ordinary one-layer super- conducting solenoid, the above t e s t is inconclusive and further confirming study is required.
The type of critical-current behavior as shown in the figures appears to be a common characteristic of cold-drawn superconducting alloys. An explana- tion of these data in the framework of extant models does not seem possible. One attractive speculation, as yet unsubstantiated, is to assume that the currents tend to flow in a force-free (helical) manner.
SMALL SUP E RCON DUCT1 N G MAGNET WI TH HOMOGENEOUS FIELD
R. H. Kernohan S. T. Sekula
P. G. Huray14 J. B. Sanders"
In order to conduct s tud ies on the magnetic properties of superconductors, a fairly strong homogeneous magnetic field is required. The mathematics and construction of uniform-field electromagnets has been described by Garrett. l 5 The method consis ts essentially in writing a power ser ies involving Legendre polynomials expanded about the origin of the field. If this origin is on the ax i s in the center of a solenoid, there will be no odd terms in the expansion. Further, i f the dimensions of the solenoid are chosen properly, the second and fourth terns in the expansion can
13H. P. Furth and M. A. Levine, J'. Appl . Phys. 33, 747 (1962).
14C0-0p student from the University of T e n n e s s e e ,
15M. W. Garrett, J . Appl . Phys. 22, 9 (1951).
Knoxville.

43
be made to cancel and a so-called sixth-order solenoid can be constructed with a fairly uniform field both axially and radially.
A' sixth-order solenoid was constructed on a copper core with dimensions which are shown at the top of Fig. 7.3. The solenoid was designed for use in a 3-in.-ID liquid-helium Dewar with the intention of having a fairly homogeneous field about 1 in. in diameter and about 2 in. long. The windings consisted of nylon-insulated supercon- ducting Nb-33 at. % Zr wire, which was 10 m i l s in diameter. There were 5635 turns of wire in 19
UNCLASSIFIED ORNL-DWG 63-936
SUPERCONDUCTING SOLENOID CROSS SECTION
7- COPPER FORM
J
3660 3
3620
- 3580 -
u) L 0) - 0 J
3540
3500
3460
Fig. 7.3. Cross Section of Superconducting Solenoid
and Typical Axial Field Profile.
layers on the main body of the solenoid and 494 turns in 19 extra layers on each of the two ends. The extra windings on the ends were connected in ser ies with the windings on the main body of the solenoid, and two heavy copper leads were attached in order to lower the magnet into the helium Dewar.
For the purpose of calibrating and testing, the magnetoresistance of a $*-in. length of 6-mil cp bismuth wire was employed. The bismuth wire was calibrated in liquid helium between the poles of a 10-kilogauss electromagnet, which was itself calibrated by spin resonance techniques. The bismuth-wire probe then served as a secondary calibration standard for measuring the current-field profile along the ax is of the solenoid.
The current-field relationship was almost linear. in liquid helium at 4.2OK the magnet windings re- vert to their normal resistive condition a t a maxi- mum critical current of about 15 amp, which corre- sponds to a field of about 11 kilo-oersteds.
A typical profile of the field along the magnet ax is for a current of 5.000 amp is shown in the lower half of Fig. 7.3. According to the calcula- tions on sixth-order solenoids, the field should be homogeneous to within 0.1% for a dis tance of 1.68 in. along the axis , and the field profile of the finished magnet agrees excellently with this value.
It was found that some remanent or frozen-in flux remains in the solenoid after the current is returned to zero and the magnetic circuit is open, even though no ferromagnetic materials are nearby. The amount of frozen-in flux is dependent on the highest current used and can be somewhat minimized by increasing or decreasing the magnet current very slowly. Otherwise, this remanent field is as much as 10 to 20 oersteds in the center of the solenoid.
MAGNETIZATION STUDIES OF SUPERCONDUCTORS
S. T. Sekula R. H. Kernohan P. G. Hurayl6
The negative surface energy model of alloy (or type 11) superconductors, which predicts the per- s i s tence of the superconducting s ta te out to rela- tively large values of the magnetic field, has met
lGCo-op student from the University of Tennessee , Knoxville.

44
with considerable success.l7V1* On the bas i s of this model, one would expect the upper cri t ical field, approximately defined as that field which destroys the superconducting state of a sample carrying a s m a l l current, to be independent to first order of the degree of cold work or heat treatment. While earlier results corroborate this viewpoint, l9
the dependedce of critical current on cold work a t low and intermediate values of applied field is not yet understood.
W e have recently constructed a low-temperature apparatus utilizing a superconducting magnet to measure the magnetization of superconductors with the magnetic field and temperature as variables. The primary objective is to correlate critical- current measurements with the magnetic behavior in annealed type I1 materials in analogy to the relatively well-undeistood critical-current behavior of soft superconductors. The apparatus permits ball ist ic measurements of susceptibility and has been calibrated using samples of annealed lead and tin.
Figure 7.4 shows the magnetization curves of annealed polycrystalline lead and a cold-drawn Pb-30 wt % TI alloy. Since the samples were in
”T. G. Berlincourt and R. R. Hake, Phys. Rev.
‘*J. D. Livingston, Phys. Rev. 129, 1943 (1963).
I9S. T. Sekula, R. W. Boom, and C. J. Bergeron, Solid State Diu. Ann. Progr. Repf. Aug. 31, 1962, ORNL-3364,
L e f f e r s 9, 293 (1962).
p 52.
600
500
400
$ 300
200
100
I O
-100
-200
-300
- aJ t
0 - c *
the form of bundles of fine wires, the demagnetiza- tion factor is small, so that in the c a s e of lead, the superconducting to normal transition is quite sharp and reversible. With identical geometry, the Pb-TI sample initially exhibits ideal flux exclusion. At larger values of field, a slow penetration of field takes place; and the last vestiges of the super- conducting s t a t e disappear a t a field of 3200 oersteds. The curve is not reversible and shows considerable hysteresis. Investigations are now in progress to study this effect a s a function of the cold work.
Commercially available cold-drawn Nb-Zr alloys have a l so been examined and found to exhibit similar hysteretic effects.
CRITICAL CURRENTS IN Nb-Zr ALLOYS2’
R. W. Boom’’ S. T. Sekula C. J. Bergeron”
Critical-current data obtained from short-wire tests in the ORNL 100-kilo-oersted magnet are given
20Abstract of paper to be submitted for publication.
21Now at Atomics International, Canoga Park, Calif.
”Consultant to Electronuclear Division from Louis iana State University, New Orleans.
UNCLASSIFIED ORNL-DWG 63-937
_.. 0 200 400 600 800 1000 1200 1400 1600 1800
FIELD (oersteds )
Fig. 7.4. Magnetization of Superconducting Lead and Pb-30 w t % TI at 4.20°K.

I 45
for a ser ies of Nb-Zr alloys, and the effect of heat any s ize , buried in 10 to 20 kilo-oersted fields, treatment on the superconducting characterist ics should carry current densit ies comparable to those is indicated. Critical-current behavior of s m a l l observed in short-sample tes ts . Current degrada- test solenoids in externally applied fields is also tion effects in solenoids are discussed in terms of presented. I t is concluded that Nb-Zr magnets of flux-migration heating of the wire.
.


Part 111. Metals F. W. Young, Jr.

\
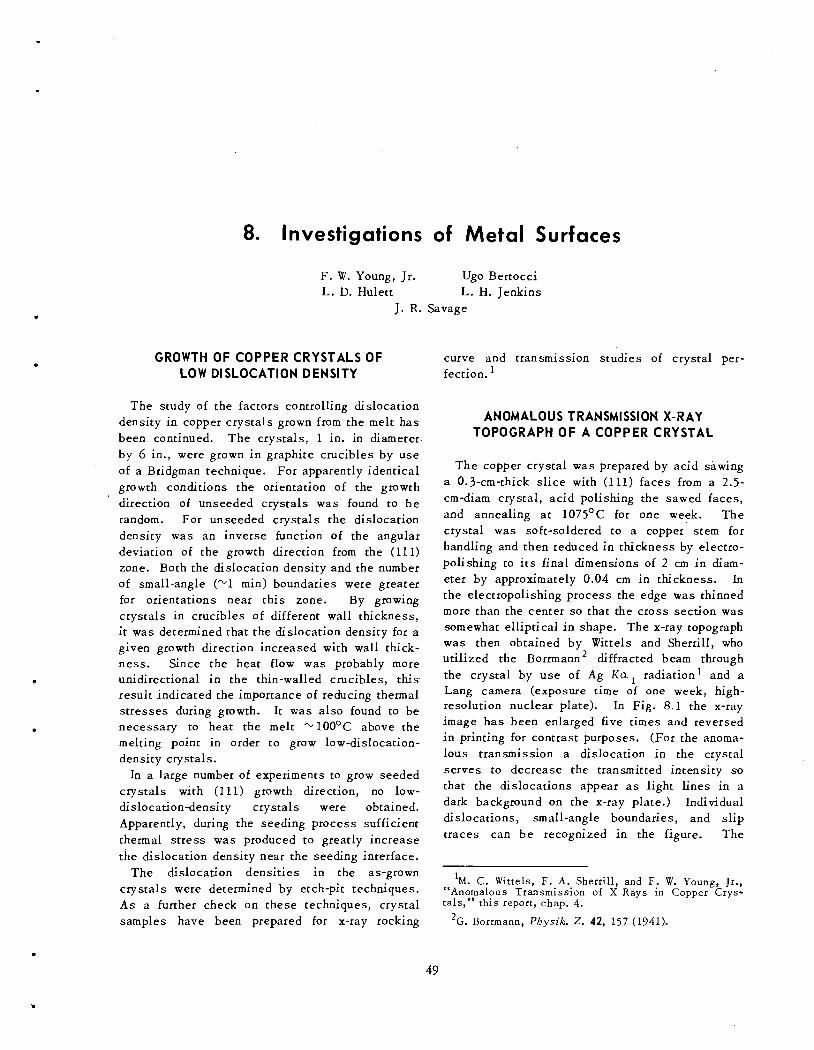
8. Investigations of Metal Surfaces
.
.
F. W. Young, Jr. L. D. Hulett
Ugo Bertocci L. H. Jenkins
J. R. Savage
GROWTH OF COPPER CRYSTALS OF curve and transmission studies of crystal per- LOW DISLOCATION DENSITY fection.
The study of the factors controlling dislocation
been continued. The crystals, 1 in. in diameter. density in copper crystals grown from the m e l t has ANOMALOUS TRANSMlSSl ON X-RAY
TOPOGRAPH OF A COPPER CRYSTAL
by 6 in., were grown in graphite crucibles by use of a Bridgman technique. For apparently identical growth conditions the orientation of the growth direction of unseeded crystals was found to b e random. For unseeded crystals the dislocation density was an inverse function of the angular deviation of the growth direction from the (111) zone. Both the dislocation density and the number of small-angle (“1 min) boundaries were greater for orientations near this zone. By growing crystals in crucibles of different wall thickness, it was determined that the dislocation density for a given growth direction increased with wall thick- ness . Since the heat flow was probably more unidirectional in the thin-walled crucibles, this result indicated the importance of reducing thermal s t resses during growth. It w a s a lso found to be necessary to heat the me l t ‘“lOO°C above the melting point in order to grow low-dislocation- density crystals.
In a large number of experiments to grow seeded crystals with (111) growth direction, no low- dislocation-density crystals were obtained. Apparently, during the seeding process sufficient thermal s t ress was produced to greatly increase the dislocation density near the seeding interface.
The dislocation densit ies in the as-grown crystals were determined by etch-pit techniques. A s a further check on these techniques, crystal samples have been prepared for x-ray rocking
The copper crystal was prepared by acid sawing a 0.3-cm-thick s l ice with (111) faces from a 2.5- cm-diam crystal, acid polishing the sawed faces, and annealing at 1075OC for one week. The crystal w a s soft-soldered to a copper s t e m for handling and then reduced in thickness by electro- polishing to its final dimensions of 2 cm in diam- eter by approximately 0.04 cm in thickness. In the electropolishing process the edge w a s thinned more than the center so that the cross section was som ewhat elliptical in shape. The x-ray topograph was then obtained by Wittels and Sherrill, who utilized the Borrmann’ diffracted beam through the crystal by u s e of Ag K a , radiation1 and a Lang camera (exposure t i m e of one week, high- resolution nuclear plate). In Fig. 8.1 the x-ray image h a s been enlarged five t i m e s and reversed in printing for contrast purposes. (For the anoma- lous transmission a dislocation in the crystal serves to decrease the transmitted intensity so that the dislocations appear a s light lines in a dark background on the x-ray plate.) Individual dislocations, small-angle boundaries, and s l ip traces can b e recognized in the figure. The
’M. C. Wittels, F. A. Sherrill, and F. W. Young, Jr., Anomalous Transmission of X Rays in Copper Crys-
*G. Borrmann, P h y s i k . Z . 42, 157 (1941).
I,
ta ls ,” th i s report, chap. 4.
49
. -. ..
I- .-
I rnb
I % '
... f.
-. ..
'I
I
i ' r-
ap-=

. 51
.
slip traces have their sources in the vicinity of that part of the crystal soldered to the stem; it has been determined that the process of soldering a low-dislocation-density copper crystal to a handle always deforms the crystal somewhat. In the black region near the s t e m there was very little transmission because of the high dislocation density due to this deformation. It can be seen that the small-angle boundaries served a s a barrier to the gliding dislocations. The light regions around the edge indicate that the crystal w a s much thinner in these regions.
The fact that anomalous transmission was ob- tained through a l l the subgrains more or l e s s in the same amount indicates that the angle between grains was ”20 sec, or less, s ince that w a s the half-width of the transmission peak. For some of the boundaries the individual dislocation can be resolved. Also, in some of the boundaries it appears that the dislocations are grouped into the boundary on one s ide of the crystal, while on the other side they are more widely spaced. This observation would suggest that some of the boundaries do not extend through the crystal, and such a structure can easi ly be understood, s ince the crystal as x rayed was the central part of an initially thicker section. The in- dividual dislocations are long and do not appear to be part of a regular network. It should be remembered that only half of the dislocations are seen by this one x-ray topograph, since it is necessary that the Burgers vector have a com- ponent normal to the plane used for reflection if the dislocation is to be visible.
The (111) surfaces were etched so a s to form pi t s a t dislocation-surface intersections, and the dislocation density and arrangement were compared between the two techniques. Unfortunately, the electrothinning served to “round off” the (111) faces so that etch pits were formed on only a part of each one. However, the small-angle boundaries, the sl ip traces, and the average dislocation
’ density compared very favorably between the two techniques. The subgrain near the top with the higher dislocation density had a density “i104/cm2; other subgrains had appreciably lower densities.
Since the copper crystals are so soft, it has been difficult to prepare thin specimens of high perfection. It is hoped to make point-to-point comparisons of x-ray topographs with etch-pit photographs in order to make an exact correlation between these two techniques.
THE ROLE OF CRYSTAL IMPERFECTIONS IN THE CHEMICAL REACTIVITY OF COPPER
SURFACES3
The transfer of an atom from a metal surface to its surrounding medium, be it film, solution, or vapor, probably occurs a t s teps , so that an under- standing of the nucleation and motion of steps is central to an understanding of the mechanisms of the chemical reactions of metal surfaces. The possible role of crystal imperfections in the nucleation of s teps is discussed with particular reference to dislocations, and a review is presented of previous experiments which were concerned with the role of dislocations in oxidation, thermal etching, and dissolution in solutions. The electro- chemical dissolution of the (111) face of copper crystals of low dislocation density is being investigated with respect to the kinetics of etch- pit formation at dislocations and s tep motion on the unpitted surface. The relations between s tep motion and the rate of growth of the pits are pre- sented with respect to the variables: current density, orientation of the surface, dislocation density, and composition of the etching solution. The results are interpreted in terms of the kine- matic theory of dissolution.
KINETICS OF LEDGE FORMATION AND MOTION
The above work is being continued with more emphasis on ledge studies. The experimental techniques and dissolution conditions are similar to those described.
Figure 8.2 i l lustrates the general configuration of ledges that are produced about a dislocation etch pit a t the (111) pole of a copper single crystal. The angle a is an orientation parameter that i s dependent on dissolution conditions. When electrolysis is carried out in solutions low in bromide concentration (0.1 to 0.25 M ) and/or with high current densit ies (20 ma/cm2 or higher), a approaches zero. When higher bromide concen- trations and/or lower current densit ies are used, a increases. The angIe a may be a s high a s 20’) but never quite reaches 30’ - the point at which (111) pole symmetry would become sixfold.
3Abstract of paper presented by F. W. Young, Jr., and L. D. Hulett at the ASM-AZME Symposium, New York, Oct. 27-28, 1962 (to be published).

52
[ai]
UNCLASSIF IED ORNL-DWG 63-2208
/ /
[ot i ]
Fig. 8.2. Ledge Configuration About a Dislocation
Etch P i t at the (111) Pole.
One always observes at least two types of ledges: “straight,” or one-component ledges, and “pointed,” or two-component ledges. The straight ledges occur on surfaces misoriented toward the [211] direction, and the pointed ledges occur on surfaces misoriented toward the [Zii] direction. It appears that for a given dissolution condition the fronts of all ledges formed about the (111) pole tend toward the same orientation. The fronts of each of the two components of the
pointed” ledges are of about the s a m e orientation as the fronts of the one-component ledges. A s the orientation of the “straight” ledges changes, the angle between the two components of the “pointed” ledges changes accordingly. If the surface of the crystal is misoriented in the [2111 direction and lies exactly on the [ O l i ] zone, and if a is appre- ciably greater than zero, the ledges- are composed of two components.
For almost all dissolution conditions the dis- location pits have their s ides broken into ledges. T o a first approximation the ledges in the pits are
e c
I
similar to the ledges on the unpitted surface. That is, as shown in Fig. 8.2, the orientations in the (111) plane are nearly the same for ledges in both regions. This approximation must b e made with reservations, however, for there are significant differences in behavior in the two types of ledges. For example, depending on the dissolution condi- t ions and orientation of the initial surface, the pit ledges and surface ledges may or may not move with the same frontal velocities.
Ledge densit ies on misoriented surfaces which lie near the [ O l i ] zone in both the [211] and [zii] directions ( see Fig. 8.1) have been measured as a function of dissolution conditions. The range of misorientation investigated was 0 to 2’. Figure 8.3 is a typical plot of ledge density a s a function of misorientation in the [2111 direction. For s m a l l misorientations (0 to 1’ for the dissolution condi- t ions indicated in Fig. 8.2), the ledge density was independent of dissolution t ime. For higher mis - orientations the density slowly decreased with t ime. For surfaces misoriented i n the [:Ti] direc- tion, the density of two-component ledges contin- ually decreased with t i m e for all misorientations.
In Fig. 8.3 a threshold misorientation below which the ledge density is essentially zero is indicated. This threshold misorientation varies with dissolution conditions but is always well defined. A possible explanation for its existence is: In order for ledges to form, monatomic steps must aggregate - a process which requires interaction. If init ial misorientation is s m a l l enough, monatomic s t e p s will be too widely separated to interact, and no ledges will form. For this case the limiting s tep spacing for the formation of ledges was of the order of 500 A.
Ledge densi t ies a s a function of orientation for different bromide concentrations have been m e a s - ured. For a given orientation the ledge density goes through a minimum as bromide concentration increases. I t h a s been observed previously that the rate of pit growth goes through a maximum as bromide increases. Further investigations may show these two effects to be related.
The effect of current density on ledge density a t various misorientations is being investigated. Preliminary results indicate that ledge density is determined by the current density initially imposed on the surface. The data in Fig. 8.3 are for a 20-ma/cm2 dissolution rate. If one etches at 10 ma/cm2 with the same solution composition, the ledge densit ies a t various orientations are

53
/
.
I I
UNCL ASS1 F I ED ORNL-DWG 63-2209
1.00 2.0"
I I I
t o n 8
. Fig. 8.3. Ledge Densities on Surfaces Misoriented
in the [211] Direction Along the [OOi] Zone. Dissolution 2
conditions: 6 M HCI, 0.25 M KBr; 20 ma/cm .
140
120
100 - i ..-
80 W 0 z a $, 60 - 0
40
20
Fig. 8.4. Velocit ies of Ledges and P i t Edges a t
Different Current Densities. Direction of motion is
shown schematically, and motion i s measured relative
to the apex o f the etch pit. Dissolution conditions: 2 6 M HCI, 0.25 M KBr; 10 and 20 ma/cm .
2 only about two-thirds as large a s for 20 ma/cm . If one etches at 10 ma/cm2 initially and then switches the current to 20 ma/&*, the ledge densit ies remain at the values established a t 10-ma/cm2 values for a very long time. A I S O ,
the value of a ( see Fig. 8.2) of the IO-ma/cm2 pit peripheries and ledge fronts appears to change very slowly to that normally seen at 20 ma/cm2.
One sees a more pronounced effect of sudden changes in current density on ledge velocit ies and the rate of pit growth. Figure 8.4 i l lustrates the frontal velocit ies of ledges and pit peripheries before and after a current-density transition. Before the transition the velocities are about the same. There i s an immediate increase in both velocit ies when the current density is increased, but not in the s a m e proportion. This result and previous results indicate that a t the lower current densit ies ledges on the pit peripheries and ledges on the surface tend to move with the same frontal velocities. Also, the values of u for the two types of ledges tend to b e more nearly the same. This suggests that a t lower current densit ies the pit ledges and surface ledges are maintained in more equal dissolution environments.
FORMATION OF ELECTROCHEMICAL ETCH PITS ON THE (111) FACE OF COPPER4
In an effort to elucidate the role of defects on the anodic behavior of copper single crystals, information has been gathered about the etch pits formed at dislocations on the (111) face. The results of studies designed to determine the influence of such parameters a s current density, solution composition, and orientation of the copper surface on the formation and characterist ics of such pits are discussed.
SURFACES OF COPPER CRYSTALS AT CHEMICAL EQUILIBRIUM IN SOLUTIONS
CONT AI N ING COPPER
.
1
Solutions of 0.2 M Cuso,
When exposed to oxygen-free solutions of CuSO, (pH adjusted to 1 with H2S0,) which have been equilibrated previously with copper metal, a
4Abstract of paper by Ugo Bertocci, L. D. Hulett, and L. H. Jenkins submitted for publication in the journal of the Electrochemical Society.

54
spherical single crystal of copper develops facets around crystallographic poles a s is illustrated in Fig. 8.5. Since there is no net transfer of material to or from the crystal, the faceting represents the rearrangement of the surface which results from exchange between atoms a t the metal surface and cupric ions in solution. The lack of facet develop- ment over large areas of the sphere suggests that certain orientations are more stable than others and/or the rate of the exchange reaction varies with orientation.
To test these ideas, flat crystals 1 x 3 x 0 . 2 cm oriented either ( I l l ) , (110), (IOO), or (321) on the large 3 x 1 cm area were exposed to CuSO, solu- t ions a t constant temperature for periods up to s ix months. While facets did develop on (321) sur- faces after about two weeks, none were observed on the other orientations even after s ix months in solution. Since all the crystals studied neither gained nor los t weight during the course of various equilibrations, faceting had to result from the exchange reaction. However, there a re some indi- cations that the rate of development of facets on
Fig. 8.5. Single-Crystal Sphere of Copper After Four
Weeks in 0.2 M CuS04. Light areas in the photograph
represent faceted crystal areas. Note the large un-
faceted area around (100) poles.
any one orientation may be affected by the method of surface preparation. Therefore, final con- clusions cannot be reached until more data a re available.
Differences in the rest potentials of these crystals were also measured. The results, which are shown in Fig. 8.6, are not the absolute values of the differences between the orientations l isted, since the s ides of the samples constituted 10 to 20% of the total surface exposed to solution. The change of potential differences with t ime also indicated a contribution from edges, s ince no physical changes were detected on the large areas of desired orientation. It is reasonable to expect that changes i n potentials a s great a s those ob- served would require a marked degree of surface reorientation. A t present, measurements are being conducted on surfaces containing only the one orientation of interest.
UNCLASSIFIED ORNL-DWG 63-2244
0, I -I a - F O 5 s I-- o m Q > - iz
I I I I I 0 25 5 0 75 100 125
TIME (hr )
-4' [L
Fig. 8.6. Differences in Rest Potential of Copper
Surface of Different Orientations in 0.2 M CuS04.
Solutions of 0.03 M CuCl in 2.7 M HCI
Equilibration of single-crystal copper spheres in HCl-CuC1 solutions produced only very slight sur- face changes after one week. Facets were devel- oped on a triangular-shaped area surrounding the (111) pole, while a large area around the (100) pole and a smaller area surrounding the (110) remained smooth. It appears that, a s in CuSO, solutions, some orientations are more stable than others and/or the exchange reaction rate varies with orientation.

55
.
Preliminary measurements of differences in rest potentials of variously oriented crystals exposed to this solution indicate the (100) is more posit ive than both the (111) and (110), and a polycrystal is even more negative than the (110). The dif- ferences in potential again were t ime dependent, but were approximately 15 to 25 mv between (100) and (110) or (111) and 10 to 15 mv between the (110) and polycrystal. Emf differences were measured vs a standard calomel electrode (S.C.E.), a s well as with respect to each other.
ANODIC DISSOLUTION OF COPPER SINGLE CRYSTALS IN SOLUTIONS CONTAINING
COPPER
Acidic Halide Solutions
Overvoltage measurements have been made on (111) surfaces undergoing anodic dissolution in 6 M KC1 solutions containing 0.1 M HCI and either 0.1 or 0.01 M CuCl with and without addition of KBr or KI. Typical values, which are reasonably reproducible, are shown in Fig. 8.7. The data
UNCLASSIFIED -80, , , I , I , I I , ORNJiDW,C 73-/4"1
-1001- [Cu](,,,) /6M KCI+O. lM HCI+O.OlM Cu' +cH
- - 1 4 0 1 11 0.4M K B r ADDED W 0 5 -160 III W U
0 u -180 -
-200 - + z - 2 2 0
2 -240
5 -260
0 1 0.2 0.5 1.0 2 CURRENT DENSITY ( p a / c m 2 )
Fig. 8.7. Effect of 'Addition of KBr and K I on the
Open-circuit Potential and Overvoltages on (111) Copper Surfaces in 6 M KCI Solutions Containing 0.1 M HCI.
are not yet reliable enough to determine conclu- sively the effect of addition of 0.4 M KBr on measured overpotentials. The open-circuit poten- tials measured v s the S.C.E. show that the activity of the copper ion is less in the presence of bromide, and the higher values of overvoltages measured can be attributed to decreased copper ion activity rather than to any specific effect of the bromide ion on the (111) surface.
Conversely, addition of a s little as M KI h a s a remarkable effect on the overvoltages (see Fig. 8.7), even though such s m a l l iodide concen- trations cannot appreciably affect the copper ion activity. I t , seems only reasonable that some specific interaction occurs between the (111) surface and iodide ions.
T h e addition of either bromide or iodide to these solutions in the amounts indicated causes etch pi ts to be formed a t points where dislocations intersect the (111) surface. In view of the dif- ferent effects each ion produces on measured overpotentials, it seems that enhanced reactivity results from different causes in the two cases .
Similar measurements of overpotentials have been made on polycrystals, and preliminary ob- servations have been made on (100) and (110) surfaces. Any differences from the (111) - other than the ready development of pits a t dislocations - seem to b e of degree only, rather than kind. I t is hoped that further measurements wi l l help explain why well-defined p i t s do not develop at disloca- t ions on the (100) and (1 10).
Solutions of 0.2 M cuso,
To further explore the possibility that the rate of exchange between atoms of the metal and ions in solution varies with crystal orientation, the current v s overpotential characteristics were determined for the three major low-index orienta- tions. Experimental conditions were such that only the orientation of interest was exposed to the solution. From the data shown in Fig. 8.8 and from the relation

56
where
i o = exchange current density,
i = anodic current density,
'1 = anodic overpotential,
the exchange current densit ies for the reaction
UNCLASSIFIED ORNL-DWG 63-2213
c u 2 + (aqueous) e c u 0 (metal) + 2e
were calculated to be - n,
= i = 140 pa/cm2 ,
i = 60 pa/cm2 . * O ( l l l ) O ( 1 1 0 ) -
O ( l O 0 )
If the rather questionable assumption that the ratio of apparent to true surface area is constant for a l l orientations is made, then the previous values reflect a real variation in exchange current density with orientation. However, more data are needed before these results can be considered Fig. 8.8., Relation of Overpotentiols and Current conclusive. Density of Different Orientotions in 0.2 M CuSOq.
CURRENT DENSITY ( p a / c r n Z )
9. low-Temperature Irradiation Studies
,
R. R. Coltman C. E. Klabunde
D. L. McDonald' J. K. Redman
G. F. Fielder
N E W LOW-T EMP ERATUR E IRRADIATION FACILITY
Construction of the new low-temperature irradia- tion facility located at the Bulk Shielding Reactor (BSR) is near completion. The purpose of the new facility is to provide irradiation conditions which cannot be obtained a t the old facil i ty located in the ORNL Graphite Reactor. The design of the new facility is directed toward:
1. obtaining a thermal-neutron flux of greater purity and absolute value than is possible in the Graphite Reactor,
2. obtaining a high-purity fission-neutron flux,
3. the alternate bombardment of the same speci- mens by thermal and fission neutrons for com- parison studies,
4. the capability of greater refrigeration capacity a t liquid-helium temperatures for the perfor- mance of more complex experiments.
Upon completion, this facility wil l be used for basic research studies of irradiation damage in pure me ta l s .
Cryostat Housing
Figure 9.1 shows a schematic diagram of the overall arrangement of the facility. An aluminum tank 28 x 28 x 12 in. filled with D,O (286 lb) res ts on the grid plate of the reactor and against the
'Present address: Australian Atomic Energy Corn- mission Research Establishment, Lucas Heights, N.S.W., Australia.
1 reactor core. An aluminum cryostat housing 9 / , x 12 x 24 in. is located with its 12 x 24 in. face against the D,O tank. The sample tube of the cryostat is located at the center of the housing. A 6-in.-diam aluminum tube provides access from just above the water level to the housing box. The tank of D,O serves a s a nonabsorbing neutron thermalizer, which delivers a substantial thermal- neutron flux into the cryostat housing. The pur- pose of the housing, which is filled with helium at
1 atm, is to displace the light water from around the cryostat. This is done for two reasons. First , since H,O is such a strong absorber of thermal neutrons, the void space imposed by the housing box greatly increases the solid angle over which a specimen (at the center of the box) can receive the thermal-neutron flux. Second, when a cylindri- cal converter is used around the cryostat to pro- duce a fission-neutron flux, the void space serves to reduce the return of moderated flux (between fission and thermal energy) to the sample chamber.
D. K. Holmes of the Solid State Division h a s calculated that for the geometry used in this facility the moderated fraction of the total flux inside the proposed converter (lined inside with cadmium to eliminate thermal neutrons) will be about 0.2. Since this calculation of the moderated feedback flux includes all neutrons from thermal to fission energy, and since only neutrons above about 1 kev can cause damage, it is roughly esti- mated (assuming a 1/E spectrum for the feedback flux) that the purity of the damage obtained inside the converter will be better than 90% fission- neutron damage.
57

58
UNCLASSIFIED ORNL-DWG 63-2214
LIQUID HELIUM TRANSFER LINES,
- BIOLOGICAL SHIELD
-~ - -
~-~ SAMPLE TUBE
HOUSING TUBE I (6-in. OD) ~ I
18ft
SAMPLE CHAMBER-
Q--- -~ REACTOR
CORE
fl
- GRID PLATE
28 in.
y 2 6 0 - l b STAINLESS BALLAST SLAB
POOL FLOOR I I
t--l
.Fig. 9.1. Schematic Diagram of BSR Low-Temperature Irradiation Faci l i ty .
Proposed Converter
It i s proposed that a U * 5-in-aluminum cylindrical converter tube 2 % in. in diameter and 12 in. long and lined with cadmium will be attached to a drawstring so that i t may be raised or lowered around the sample chamber a s desired. This permits alternate bombardment by thermal and fission neutrons without sample change or inter- ruption of temperature conditions. Cooling of the converter is accomplished only by natural convec- tion of the helium gas i n the housing. To improve the convective cooling, longitudinal aluminum fins are attached to the converter, and a heavy-walled
aluminum extension tube (also finned) 12 in. long i s welded to the converter to further increase the cooling surface area. A mockup of th i s assembly with electrical power to simulate fission heating has been made. By use of eight thermocouples a t various positions, the mockup was tes ted in the cryostat housing which was immersed i n the pool water. A dummy brass tube located inside the con- verter mockup was used to simulate the cryostat. The highest temperatures were found at the center of the converter and were 171 and 278OC for 500- and 1000-w power dissipation respectively. Cor- responding temperatures in an atmosphere of air were each about 40°C higher. It is believed that a
L

500-w converter of this design is a very safe device, since no external cooling system is re- quired. It can be shown that the fission-neutron flux inside a 500-w converter of this s i z e is 6 x 10" neutrons sec", which produces suffi- cient damage for detailed study in most metals in a reasonable t ime (approximately 20 to 40 hr in this facility).
F I ux Mea su remen t s
.
The thermal-neutron flux was measured under various conditions inside the cryostat housing by use of a boron thermopile. This s a m e thermopile has been used to measure the thermal flux in the Graphite Reactor low-temperature irradiation facil- ity, where independent measurements by experi- menters withother methodsgave a value of 6 x10" neutrons cm-, sec-l. FIUX measurements were carried out at a reactor power of 0.4 Mw. However, full operating power of the BSR is 1.0 Mw, and all measurements reported here refer to the full power 1.0-Mw level. The measured thermal-neutron flux is 2.5 x lo1, neutrons cm-, sec-' a t the center of the housing. Upon rotating the thermopile ( )2 in.
circle, a total variation of 5% is observed, indicating very little horizonal flux gradient. (The cryostat sample chamber to be used in this facility is 1 in. in diam- eter.) Avertical traverse of the housing box showed a drop in flux of only 2% at 4 in. and 10% a t 8 in. from the center line. The length of the cryostat sample chamber is 8 in. and will be centered in the vertical direction.
Following these measurements a black cadmium cylinder 25, in. in diameter and 1 2 in. long (used to simulate the presence of the cadmium-lined converter tube) is lowered down adjacent to the thermopile. The cadmium cylinder is formed with a longitudinal, semicircular groove into which the thermopile can slide, thus covering about half the solid angle over which it can receive thermal neutrons. With the exposed half of the thermopile facing the D,O tank, a 44% drop in its output signal is observed. This indicates that the isot- ropy of the flux inside the housing is quite good and that the surrounding light water serves as a good reflector for the thermal neutrons. The cad- mium cylinder and the thermopile are then rotated on the axis of the cylinder and readings taken at 45O intervals. Upon rotation of 180' away from the
OD and 6 in. long) on a Z/,-in.-diam 1
59
D,O tank the reading dropped to 50% of the value obtained when facing the tank. It is believed that this drop is due to the presence of the large ab- sorber in the housing void space which captures neutrons that would otherwise be reflected back by the light water at the three outward walls. In this connection it is important to note that when the cadmium cylinder is lowered into the housing box no effect on the reactor operation is observed. This s e e m s to indicate that the total number of neutrons entering the housing box through the face adjacent to the D,O tank is independent of the conditions inside the box. This absence of a feedback effect has the very practical advantage that the experimenter may change h is irradiation conditions without affecting the operation of the reactor. The thermopile data taken during rotation of the cylinder will be used to determine design details of the actual converter such as U 2 3 5 enrichment. I t is of some interest to note that when a second, slightly smaller tank of D,O (15 x 15 x 12 in. thick) is hung behind the housing box, thethermal flux inside drops about 3l/,%. This result suggests that additional D,O surrounding the housing does not improve the thermal flux.
Gamma-Ray Heating
' A s m a l l copper specimen suspended by a single copper-constantan thermocouple is mounted in an evacuated tube. With the reactor on, the tube is pushed to the center of the housing and temperature vs t ime data are recorded. By use of this data and the known specific heat of copper, the gamma- ray heating effect in the isolated copper specimen can be determined. The measured value is 45 mw/g. It is believed that the majority of these gamma rays originate from light-water captures near the surface of the housing. Visual evidence for this can be seen by the bright band of Cerenkovradia- tion which appears at the boundaries of the hous- ing. It is presently planned to hang l\-in.-thick bismuth sheets on the four s ides of the box. It is hoped that this shielding will reduce the gamma heating by about a factor of 4 but will not appreci- ably affect the thermal-neutron flux. The effect of gamma heating upon the cryostat is discussed below.

60
Ref r i g era t i on System
A schematic diagram of the closed-circuit helium liquefier used for this facility is shown in Fig. 9.2. Except for the cryostat, construction and testing of the system are complete. T o briefly describe the operating principle of the system, i t is convenient to divide the circuit into two portions, the engine circuit and the liquefier circuit. In the engine circuit, high-pressure helium g a s enters the main heat exchanger at room temperature, where it is cooled by the returning low-pressure flows. It is then adiabatically expanded to a low pressure in the expansion engines, where the final cooling in this circuit takes place. It then enters the heat- sink exchanger, where it is warmed by the high- pressure liquefier flow enroute to the Joule- Thomson (J.T.) valve. This constitutes the heat load on the engine circuit. The returning flow is
further warmed t o room temperature in the main heat exchanger enroute to the first-stage compres- sor. In the liquefier circuit a portion of the total high-pressure flow bypasses the engines and is further cooled to the engine exhaust temperature in the heat-sink exchanger. This flow is still fur- ther cooled by returning liquefier flow in the J.T. heat exchanger. It is then isenthalpically expanded at the J.T. valve, and the gas-liquid mixture pro- ceeds through the cryostat, where most of the liquid is evaporated, but little, i f any, temperature r ise occurs. The returning flow is progressively warmed to room temperature in the three heat exchanger sect ions enroute to the liquefier com- pressor, where it is compressed and brought into the suction of the second-stage main compressor. It may be noted in this system that s ince the liquefier flow is returned to the discharge rather than the suction of the first-stage compressor, the
UNCLASSIFIED O R N L - D W G 63-2215
EXPANSION ENGINES
+2 atrn 4.4 atm 4 6°K ANNULAR
PASSAGE REFRIGERATED SHIELD
I I
I
I (184)
COMPRESSOR STAGES
(DISPL.-cfm)
2 (100)
3 (40)
4 (20)
I JOULE - THOMSON
I v2 in. OD x 8 f t
I HEAT SINK
5 in. OD x 2 f t
FLOW 1 I REGULATOR MAIN
5 in. OD x 29 f i CONCENTRIC TUBE-RIBBON PACKED
COPPER HEAT EXCHANGER
CRYOSTAT 3.5-5°K
CIRCUIT LEGEND
ENGINE 160-200 s c f m LIQUEFIER 3 - 3 0 scfm REFRIGERATED SHIELD 1-2 scfm
Fig. 9 .2 Schematic Circuit Diagrom of the Closed-Circuit Helium Liquefier. The values of pressure, tempera-
ture, and flow shown here ore typical but may be changed to suit the needs of o particular experiment.

61
mass flow and to a great extent the refrigeration capacity of the engine circuit is fixed by the dis- placement of the first-stage compressor (for a fixed value of the first-stage suction pressure). It follows then that the total mass flow through the system is variable, depending upon the demand of the liquefier circuit. It is believed that th i s circuitry leads to a somewhat more s table be- havior of the liquefier circuitry and simplifies the adjustment of the system to varied heat loads.
The complete system was tes ted with an electri- cal heat load to simulate the effect of the cryostat. With a 20-w heat load on the liquefier circuit a stable temperature of 3.6OK is maintained using a flow of 20 scfm. (Engine-circuit flow under these conditions is about 180 scfm.) From the general behavior of the entire system under these condi- tions it is clear that the liquefier flow can be increased from 50 to 100%. Such a high-flow test could not be made because of the limited range of the flowmeter, which has s ince been increased. Results of these tests indicate a heat capacity of about a factor of 10 greater than that of the Graph- ite Reactor facility . Minimum-temperature-lo w- flow tests are of l i t t le significance under this simulated condition, since pressure drop through the cryostat is difficult to estimate and strongly affects the results. It is believed, however, that bombardments a t 3.5OK are possible.
Refrigerated Shield
In a low-temperature irradiation system such a s described here, it can be shown that if the radiant heat load on the cryostat is about equal to or greater than the gamma-ray heat load, the use of a refrigerated shield surrounding all liquefier cir- cuitry offers great economy. This condition pre- vai ls for the facility described here. A small flow (1 to 2 scfm) of high-pressure cold (- 16OK) helium gas taken from the engine inlet line is routed through a small tube down to the sample chamber of the cryostat, where the line is attached to a heat trap and refrigerated shield for the sample chamber (see Fig. 9.3). It is then returned along a shield which surrounds the liquid-helium transfer l ines and the shield supply line, absorbing radiant heat en route. The flow rate is adjusted according to its temperature after having covered all liquefier circuitry. In test runs with an electrical heat load of 25 w to simulate the radiant heat load of the
cryostat, a flow of 1.2 scfm was required to main- tain a shield return temperature of 125’K. It is estimated that the shield reduces the liquifier radiant heat load by a factor of about 100. When operating with the cryostat it is possible to adjust the shield return temperature for optimum perform- ance of the liquefier. The remaining heat capacity of the shield g a s is used for additional shielding which surrounds the colder parts of the heat ex- changer and which brings the flow up to room tem- perature. It then returns to the suction of the second-stage compressor via a flow regulator. High-pressure gas is used for the refrigerated shield circuit, s ince it can be transmitted through small-diameter low-mass tubes wherein the assoc- iated pressure drop has l i t t le effect on the re- mainder of the system.
Insulation
All cold portions of the system except the ex- pansion engines are vacuum jacketed. Under operating conditions the vacuum is better than
The engines are insulated by Santocel in a vacuum of about 20 p . In addition to the vacuum, “super insulation” in the form of alter- nate layers of aluminum foil and 15-mil-thick fiber g l a s s sheets have been wrapped on al l sections. Seven foil and s ix g l a s s layers are used on the heat exchangers and most transfer lines. Five foil and four g lass layers are used on the refrigerated shield.
torr.
Precooling Circuit
The main heat exchanger in this system weighs about 600 lb, and considerable refrigerator run- ning time is required to cool the system to terminal temperature in preparation for an experiment. To reduce running t ime and hence maintenance, a liquid-nitrogen precooling system has been in- stalled. By use of a small compressor a s a pump, liquid nitrogen is drawn through a +*-in. tube located in the center of the main heat exchanger. After precooling overnight (- 16 hr), one-half of the heat exchanger is a t about 80°K, and a good gradient is established in the remainder. Four hours after startup of the engine circuit the heat- sink exchanger reaches about 13’K, and the liquefier is ready for operation.

62
UNCLASSIFIED ORNL-DWG 63-2216
TOTAL SYSTEI bl
I- \
REFRIGERATED SHIELD
VACUUM JACKET,
Q
STAINLESS STEEL HEAT TRAP, 8 in. LONG
THIN COPPER REFRIGERATED HEAT TRAP, I2 in. LONG
18°K
STAINLESS STEEL HEAT TRAP, 2 in. LONG
THIN-COPPER REFRIGERATED SHIELD
LIQUID HELIUM 3 5 TO 5" K
THIN-WALLED COPPER SAMPLE CHAMBER, I-in ID X 8'12 in LONG
' /~- ln-oD COPPER TUBING
4 2
INCHES
-REFRIGERATED SHIELD SUPPLY
1 .IQUEFIER SUPPLY
'LIQUEFIER RETURN
Fig. 9.3. Liquid-Helium Irradiation Cryostat.

63
Irradiation Cryostat
Figure 9.3 shows a sketch of the cryostat, which is nearly completed. The U-shaped arrangement is used to reduce the diameter of the vacuum jacket around the sample chamber a s much a s possible, s o that the smallest possible converter can be employed for fission-neutron bombardment. Thin- walled s ta inless steel tubes are used for all the transfer l ines and most of the vacuum jacketing. The incoming refrigerated shield gas (- 16OK) is first applied to a 12-in.-long copper heat trap, which is separated from the sample chamber by 2 in. of thin-walled stainless tubing. After leaving the heat trap it cools a copper shield around the cryostat proper. The upper end of the heat trap
travels 8 in. before breaking out of the vacuum jacketing and then continues to the top of the facility serving a s a sample tube. In operation, helium is condensed in the thin-walled copper sample chamber, s o that an experiment is immersed in nonboiling liquid helium. The mass of that portion of the cryostat located in the gamma-ray field is about 250 g. If the present gamma heating value can be reduced to l o h 2 w/g with the pro- posed bismuth shielding, then the gamma heatload on the liquefier will be about 2.5 w. It is roughly estimated that the radiant heat load on the liquefier is l e s s than 0.5 w. The mass of that portion of the refrigerated shield circuit located in the gamma- ray field is a l so about 250 g. The associated
:
.) connects to a thin-walled s ta inless tube, which
gamma-ray heat load, however, is small compared with rhe radiant heat load on the total shield cir- cuit.
The authors wish to acknowledge the very help- ful ass is tance given them by J. T. Howe and W. E. Busby of the Solid State Division throughout the design and development of this facility.
,
LOW-TEMPERATURE IRRADIATION OF BERYLLIUM OXIDE'
Beryllium oxide is presently of interest in reactor technology, and a considerable amount of work on the property changes of B e 0 caused by neutron irradiation has been carried out.3 In order
2D. L. McDonald, Appl . Phys. L e f f e r s 2, 175 (1963).
3B. S. Hickman, Australian Atomic Energy Commission Report AAEC/E99 (1962).
to fully understand the damage mechanism and properly interpret pile-temperature experiments, it was considered necessary to know whether the point defects produced by fast-neutron bombardment were mobile a t room temperature. Since low-temper- ature thermal conductivity is perhaps the physical property most sensit ive to defect structures in the B e 0 latt ice, a specimen of the oxide was irradiated below 100°K, and thermal conductivity measure- ments were made in-pile during the irradiation and during a subsequent isochronal annealing study between 100°K and room temperature.
The cylindrical sample,* 0.30 in. in diameter and 1.; in. long, was produced from Brush UOX powder by cold pressing and sintering. The re- sulting density was 2.96 g/cm3, with a grain s ize of about 25 p . The irradiation was performed in the ORNL Graphite Re,actor nitrogen cryostat, in a fast-neutron flux of 1 x 1 0 ' ~ neutrons sec-l ( E > 0.6 Mev). The techniques employed for measurement and temperature control were similar to those of Berman,' except that copper- constantan thermocouples were used for measuring both absolute and differential temperatures. The cryostat operated a t about 85'K with the reactor running, resulting in a sample bombardment temper- ature of around 91°K. For approximately 20 min during the latter part of the three-week irradiation, the sample temperature rose to 105OK.
The increase in thermal resistivity with fast- neutron dose is shown i n Fig. 9.4. The damage rate curve is essentially linear up to the maximum dose of 1.8 x 10'' nut, indicating that there are no saturation effects to this dose. The depression of the final points on the curve is probably caused by annealing during the temperature excursion described above. Following the irradiation a ser ies of isochronal anneals up to 310°K in 20°K s teps was carried out, wherein the sample was heated rapidly to the desired temperature, held there for 15 min, and cooled to the reference temperature of 93OK, at which all measurements were made.
*Kindly supplied by Dr. A. W. Pryor of the AAEC Re-
5J. T.,Howe, W. E. Busby, and R. R. Coltman, Solid State Dzv . Ann . Progr. Rept . Aug. 31. 1959. ORNL- 2829, p 187.
search Establishment.
GR. Berman, Proc. Roy. SOC. A208; 90 (1951).
\

64
The result of this annealing is depicted in Fig. 9.5. It can be seen that the damage s ta r t s to re- cover between 100 and llO°K and continues to anneal a t a more or l e s s constant rate up to the highest temperature. There is a hint of a recovery peak in the annealing between 160 and 19OoK, but it is believed that the annealing schedule followed here is not sufficiently sensit ive for positive iden- tification. After the final anneal at 310°K, approx- imately 25% of the radiation-induced thermal resistance had recovered. The remaining damage could be expected to recover in the range from 400 to 13OO0C, a s observed in similar samples irradi- ated a t pile tempedture.
X-ray diffraction and long-wavelength neutron scattering studies indicate that the defects ob- served after a pile-temperature irradiation are
" 0 too 200 300 400 500
IRRADIATION TIME (hr)
Fig. 9.4. Increase in Thermal Resistivity, hp, vs
Irradiation Time.
present in the form of planar clusters of 15 or more defects located on basal planes, and a simi- lar number of point defects distributed randomly throughout the lattice. It may be that the recovery observed following the present low-temperature bombardment is the result of interstitial-vacancy recombination, and the precipitation of single defects into blusters. It is not clear from the present experiment that irradiation at 90°K is sufficiently low in temperature to ensure that all the defects produced during the irradiation are immobile, but the significant amount of annealing observed following this bombardment does show that future work on BeO, and probably on other similar materials, should take into account this defect mobility far below room temperature.
UNCLASSIFIED ORNL-LR-DWG 78874
80 120 460 200 240 280 320 TEMPERATURE ( O K )
Fig. 9.5. Isochronal Annealing of Beryllium Oxide
Irradiated at 91°K.
.
.
10. Elasticity and Anelasticity Studies
DOSE DEPENDENCE OF THE DISLOCATION BREAKAWAY STRESS IN NEUTRON-IRRADIATED
COPPER AS MEASURED BY AMPLITUDE- DEPENDENT INTERNAL FRICTION
D. 0. Thompson V. K. Pare'
A ser ies of experiments on the amplitude de- pendence of internal friction in irradiated copper has been carried out in order to obtain additional information relating to the phenomenon of harden- ing by fast-neutron irradiation. This hardening has previously been studied quantitatively by meas- uring, a s a function of dose, the upper or lower yield point of single crystals. 1 - 5 The hardening presumably occurs because radiation defects act a s obstacles to dislocation motion, but there is a s yet no general agreement a s to the nature of the defects involved or a s to whether the dominant hardening occurs by restriction of dislocation sources or by introduction of obstacles to motion of dislocations through the lattice. An additional complication is that the yield s t ress is observed to vary as the cube root of the dose, whereas the existing theories predict a square-root dependence. In pure copper the internal friction due to dis-
location motion increases rapidly with strain amplitude, and it is generally believed that this increase results from the breakaway of disloca- tions from fixed pinning points. I t is therefore likely that in irradiated copper the amplitude de- pendence of internal friction wilI be cIosely reIated
G
IT. H. Blewirt et al., I . Nucl. Mater. 2, 277 (1960). 'F. W . Young, Jr., I . Appl. Phys. 33, 3553 (1962). 3J. Diehl, p 129 in Proceedings of the Symposium on
Radiation Damage in Solids and Reactor Materials. IAEA, Venice, 1962.
to whatever source hardening h a s occurred by crea- tion of radiation defect pinning points. Thus a c lose experimental relationship between amplitude- dependent internal friction and yield-point meas- urements would be an indication that source harden- ing is the dominant effect in the latter. In the present work, the amplitude dependence of internal friction is used to obtain a measure of the dis- location breakaway s t ress , and the dependence of this s t ress on radiation dose is compared with the dose dependence of the yield point. As will be seen, a remarkably close correspondence is ob- tained.
All internal friction and modulus measurements herein reported were performed upon a single crystal of high-purity ASR copper grown by the Bridgman technique. They were made in si tu a t 375OK in a shutter-equipped beam hole of the ORR in an apparatus described e l ~ e w h e r e . ~ A consistent s e t of procedures was used throughout the present experiment. Following a given neutron dose, the neutron shutter was closed, and the crystal was allowed to remain at temperature for approximately 24 hr before any large amplitude measurements were made. Previous experience h a s taught that this is about twice the minimum t ime required for the establishment of equilibrium between neutron- produced defects and the existent dislocation structure at this temperature.' After the measure- ments were made the shutter was opened and the desired additional neutron dose administered. The temperature of the sample never varied more than + l0C during the whole set of data, nor was it handled in any way. The strain amplitude of the sample was determined from measurements of the parameters of the capacitance/frequency modula- tion detection system.
*J. Fischer, 2. Naturforsch. 170, 603 (1962). 5T. J. Kopenaal, Bull. Am. Phys. SOC. 8, 197 (1963).
7D. 0. Thompson and F. M. Glass, Rev. Sei. Ins f r . 29, 1034 (1958).
GA. Seeger, Proc. Intern. Energy, Geneva, 1958 6, 250.
Conf. Peaceful U s e s At. 'V. K. Par; and D. 0. Thompson, Acta Met. 10, 382 (1962).
65

66
The basic data of the experiment consisted of curves of logarithmic decrement (a measure of internal friction) vs strain amplitude (taken at the center of the sample, where the strain is highest) for various values of the total fast-neutron dose, expressed in terms of neutrons per square centimeter above the Np 2 3 7 fission threshold, about 0.6 M e V . These results are shown in Fig. 10.1. The dose levels for the various runs are given in Table 10.1.
UNCLASSIFIED ORNL-LR-DWG 78843
Fig. 10.1. Strain Amplitude Dependence of the
Internal Friction for Several Neutron Doses.
It has been hoped that it would be possible to analyze the data of Fig. 10.1 in terms of the Granato-Lucke theory9 of amplitude-dependent internal friction, but attempts to do so were un- successful. The formulas of the theory did not fit the data, and for the poor fits which were ob- tained the dislocation parameters in the theory did not vary in a reasonable way with radiation dose. It was therefore necessary to resort to another method of analysis.
The scheme used is suggested by inspection of Fig. 10.1; it proves to be possible to superimpose the first eight curves on one another very closely
'
9A. Granato and K. Liicke, I . Appl. Phys. 27, 583 (1956).
Table 10.1. Total Integrated Dose for Each
Run (Above 0.6 MeV)
Run Dose (neutrons/cm ) 2
s- 1
s-2
s-3
S-4
s-5
S 6
s.7
S-8
$7
$10
s-1 1
Preirradiation
1.5 x 10"
3.1 x 10 l1
6.1 x 10 l1
7.2 x 10 l1
1 . 8 ~ 1 O I 2
3.7x 10¹²
2.6 x 1 0 ~ 3
7.0 1013
2.0x 10l4
7.2 x 10 l2 .
by simultaneous translations along the (logarithmic) strain and internal friction axes. The resulting conversion factors on the strain ax is are taken to represent the dose dependence of the dislocation breakaway s t ress , while those on the decrement axis give the dose dependence of the low-ampli- tude internal friction, which is assumed to be described by the Granato-Lucke theory of ampli- tude-independent internal friction due to viscous damping of dislocation^.^
There is of course no unambiguous choice for the absolute level of the breakaway s t ress . In general, it would be expected that the highest attainable values i n internal friction experiments would have the closest correspondence with observed yield points. The procedure which was adopted was that the highest strain attained (at maximum apparatus driving power) in run S-3 was converted to resolved shear s t ress and the re- sulting value taken a s the breakaway s t ress for that dose; the strain-axis conversion factors men- tioned above were then applied to obtain break- away s t resses for the other dose levels.
Two further pieces of information can be intro- duced into the analysis. The first is a tempera- ture correction of the breakaway s t ress from 375OK to the temperature, 300°K, at which most yield- point measurements have been made. This correc- tion was made using Blewitt 's data and amounts to

a
67
a 12% increase. The second type of information is the dose dependence of the low-amplitude internal friction; this dependence h a s been found to b e described by the Granato-Liicke amplitude-inde- pendent theory when one allows for diffusion of radiation defects to the dislocations and their subsequent clustering. The theory has therefore been used to derive the dose dependence of the average free dislocation length between pinning points in the present experiment. It was found that although the length decreases with increasing dose, it has at the highest dose (7 x 10¹³neu- trons/cm2) very nearly saturated at 31% of the preirradiation length. Presumably the saturation occurs when point defects, arriving a t the dis- locations by diffusion, cease to nucleate new pinning points and are all absorbed by existing pinning points, which then continue to grow in s ize and pinning strength.
Measurements of the dose dependence of the yield point have all been made at doses higher than the above value. Thus the above observa- t ions lead to a novel hypothesis concerning the hardening: if it is in fact source hardening, its dose dependence reflects not the increase in number of hardening points but the increase in their s ize and, therefore, in the strength of the interaction between them and the dislocations.
To be consistent with this idea, a further ad- justment in the breakaway s t ress data w a s made: the value at each dose level was multiplied by the ratio of. the loop length at that dose to the satura- tion loop length. The resulting corrected s t resses should then be a measure of the pinning-point-dis- location interaction. The effect of this correction is shown in Fig. 10.2, where breakaway s t resses , before and after correction, are plotted a s a function of dose on logarithmic scales. It can be seen that the corrected s t resses follow the cube-root law associated with the dose dependence of the yield point.
Figure 10.3 presents a summary of the experi- mental results of several investigations of the radiation hardening of copper. The filled points (0) in the figure are the present results (adjusted to 300°K) measured by internal friction techniques in the ORR; the filled triangular points (A) are those of Young2 measured in bending utilizing an etch-pit technique after bombardment in the Oak Ridge Research and Graphite Reactors; the unfilled circle points (0) are those of Diehl measured by 3
UNCLASSIFIED ORNL-DWG 63-73R
1.9 , I I I I / I I
1.8
1 .7
1.6
* J.5
& 1.4
In W (L
G
a 5 4.3 Y
w 1.2
1 .O
0.9 I +
0.8
0.7 I ' 4 4 12 43 14
log INTEGRATED FLUX
Fig. 10.2 Dose Dependence of the Dislocation
Breokoway Stress in Neutron-Irradiated Copper.
tensile testing with an Instron machine after bombardment in the Munich FRM reactor; and the unfilled triangles ( d ) a r e the data of Fischer4 using the same technique and bombardment facil- i ty a s Diehl. The long dashed line represents the original work of Blewitt et al. who used an Instron machine and bombardment in the Graphite and Low-Intensity Test Reactors. Not included as individual data because they fall essentially on Blewitt's line are the recent results of K ~ p e n a a l . ~ Blewitt's line has been extrapolated in this case from 10l6 nvt to 10" nut, and replotted on a dose sca le to show the total dose of neutrons above 0.6 M e V . The solid l ine is drawn through the present data and extrapolated to a dose of 4 x 10¹⁹ nut. Both Diehl and Fischer originally plotted their results in terms of the neutron dose above 0.1 MeV; their points have been replotted to the present sca le (dose with energies greater than 0.6 MeV) in accordance with the reactor spectrum data given by Kohler. l o The remarkable
'OW. Kohler, 2. Natur/orsch. 160, 936 (1961).

68
,
.
UNCLASSIFIED ORNL-DWG 63-74
PRESENT DATA ,WITH CORRECTIONS (INTERNAL FRICTION
A DATA OF F.W. YOUNG ,YIELD STRESS (ETCH PIT OBSERVATI 0 DATA OF J. DlEHL (TENSILE TESTS) A DATA OF J. FISCHER (TENSILE TESTS)
Fig. 10.3. Summory of Experimental Results for the Dose Dependence of the Breokowoy Stress, Motion Stress,
ond Y ie ld Stress in Neutron-lrrodioted Copper.
feature of the results taken in their entirety is that a cube-root relation is obeyed with respect to the neutron dose from 10" nut to a t least 4 x 10¹⁹ nut, and that this relation, as well as the magnitude of the s t resses measured, is con- sistent for three extremely different types of measurements and a variety of reactors.
pondence between measured yield points and the s t resses necessary to break dislocations away from radiation defect pinning points formed during irradiation on dislocations at rest in their equi- librium positions. This correspondence carries the implication that radiation hardening may in fact be source hardening and that its dose depen- dence may reflect the growth of the hardening points during irradiation by diffusion of point defects to the dislocations. It should'be noted that data exist which are apparently a t variance with this hypothesis. In c a s e s (electron and gamma irradiation) where the same sort of point defect diffusion would be expected, and where reduction of low-amplitude internal friction has been shown to occur, little or no hardening is found; and in a case (neutron irradiation at 25'K)
It then appears that there is in fact a corres- '
where l i t t le or no point defect diffusion is ex- pected, the hardening was found to be very nearly the same (at the dose level used, about lo" nut) as for room-temperature neutron irradiation. It is hoped that additional studies will help clarify the situation.
FINITE-AMPLITUDE ULTRASONIC WAVES IN SOLIDS
D. 0. Thompson M. A. Breazeale '
One of the fundamental parameters of a solid which is basic to an understanding of its physical characterist ics is the interatomic potential. Re- cent interest in theoretical radiation damage studies has emphasized again the importance of the proper description of the potential function in that area; in addition, a knowledge of the potential function is of considerable importance
"Summer employee, 1962, and consultant from the University of Tennessee , Knoxville.
.

.
in many other areas of solid-state physics. Of several properties available for the study of potentials, one is the study of the elast ic con- stants of the material. For infinitesimally small atomic displacements Hooke’s law is valid, and the materials’ e las t ic response can be described by the ordinary elast ic constants. These con- stants are characteristic of the atomic potential evaluated a t the minimum energy position. A s atomic displacements become finite, however, Hooke’s law is no longer valid and the anharmonic aspects of the potential become important. In this ca se it is necessary to include higher-order e las t ic constants to describe the behavior of the material under s t ress . It is, therefore, clear that i f the third-order e las t ic constants of a material can be determined in addition to the customary second-order constants, a more complete descrip- tion of the potential function can be given. The additional information essentially constitutes knowledge of one additional derivative of the po- tential a s described by a Taylor’s expansion about’ the position of minimum energy.
In an effort to develop a technique for the measurement of third-order elasticity in metals, it was decided to make use of the distortion of a finite-amplitude ultrasonic wave. It is known that distortion of such waves is introduced a s they propagate through a liquid. l 2 By analogy it would be suspected that if an ultrasonic wave of sufficiently large s t ress amplitude is introduced into a solid so that finite atomic displacements result, then distortion of the fundamental wave should occur such that the second- and higher- order harmonics of the fundamental frequency are generated a s the wave propagates in the solid. Measurement of these harmonics, then, yields information about the anharmonic behavior of the solid.
To this end, a pulsed 30-Mcps transmitter was designed which would be capable of providing drive signals up to approximately 1000 v across a 50-ohm load with pulse lengths of 1 psec. These values represent a peak power of 5 kw, and with a repetition rate of 1000 cps, an average power of 5 w. This voltage is applied to a 30-Mcps quartz transducer crystal bonded to the sample. Detection of the second harmonic generated in the sample
12M. A . Breazeale and E. A. Hiedemann, Natumissen- schaften 45, 157 (1958); I . Acoust. SOC. A m . 30, 751-56 (1958) .
is accomplished by a 20-Mcps quarts crystal bonded to the opposite face of the sample. In this way the 60-Mcps second harmonic component is accentuated in the detection system since it is the third harmonic of the receiver quartz’s resonant frequency. A t the large intensit ies used, there is no difficulty in detecting the 30-Mcps signal even though it is quite far from a resonance frequency of the receiver quartz. The attenuation of the second-harmonic echo pattern can be ob- served a t these amplitudes in many cases , and that of the fundamental in a l l ca ses considered. In addition, frequency selection of the components is greatly enhanced by the bandwidth of the i.f. amplifier, which is about 3 Mcps.
Polycrystalline aluminum was chosen a s a material for the first experiments. Several reasons are involved in making such a choice. In the first place, it was desired to use an isotropic metal with relatively small values of acoustic attenuation due to dislocation damping and other sources. Second, it was thought desirable to use a material whose attenuation a s a function of s t ress amplitude was nearly constant. If these criteria could be satisfied, then the voltage applied to the quartz transducer could be used a s a pro- portional measure of the stress. A s it turns out, aluminum sat isf ies this expectation very well. In addition, previous measurements have been made on this material a t lower stress amplitudes in this frequency range so that relative information is available.
In Fig. 10.4 are shown results for the depend- ence of the second-harmonic distortion signal upon the impressed quartz driver voltage for two aluminum samples. Also shown in this plot are results for the amplitude of the 30-Mc fundamental as a function of the s a m e parameter. The ordinate values represent the ratio of the amplitude of the second harmonic a t any impressed voltage to the amplitude of the harmonic a t some reference value (in this case, about 140 v). A similar statement applies to the fundamental. It will be seen that the growth in amplitude of the fundamental is approximately linear with drive voltage, whereas the second harmonic grows much faster. Figure 10.5 shows the results of plotting the second- harmonic data on a log-log plot. The straight
13M. A . Breazeale and W. W. Les te r , I . Acoust. SOC.
‘*A. H. Hikata et al., I . Appl. P h y s . 27, 396 (1956). Am. 33 , 1803 (1961).
.

70
UNCLASSIFIED ORNL-DWG 63-2247
20
15
Y% 10
5
n 0 200 400 600 000
SOURCE VOLTAGE .
Fig. 10.4. Variation of Fundamental and Second-
Harmonic Amplitude with Increasing Source Voltage
(Stress Amplitude).
line represents a slope of 2.00. Therefore it is concluded that whereas the amplitude of the fundamental signal is linear in applied voltage, the second harmonic which is generated in the sample in this aluminum is very nearly quadratic in applied voltage (stress).
That the applied voltage is approximately pro- portional to the pressure of the acoustic wave is shown in Fig. 10.6, in which the acoustic attenua- tion for the fundamental 30 Mc is plotted a s a function of the drive voltage for two samples. It will be seen that the attenuation is approximately constant over the voltage range considered with a slight drop-off a t the small amplitude. Th i s result means that for any fixed position along a sample the s t ress amplitude of the acoustic wave is pro- portional to the applied drive voltage. It is interesting to note that the presently measured attenuation values for this aluminum are about a factor of 10 larger than those given by True11 et al. a s measured a t much smaller s t ress ampli- tudes. Measurement of the present samples a t small amplitudes yields values which a re in accord with others, so that it is concluded that
the acoustic attenuation in this aluminum a t 30 Mc is s t ress dependent and levels off to approxi- mately a constant in the present range. This suggestion implies that rather complete dislocation breakaway is achieved in the present work.
A simplified analysis of the problem of the propagation of a finite-amplitude wave in a solid has been made to determine an approximate value for the discontinuity distance in aluminum. The relation of the present results to actual measure- ments of the third-order e las t ic constants is not immediately obvious, although it seems reasonable to expect a t this t i m e that the relations may be solved for different metal crystal symmetries. A
40
20
10
8
% 6
4
2
4
0 SAMPLE 4
0 S A M P L E 2 I
100 200 400 600 0004000 SOURCE VOLTAGE
Fig. 10.5. Second-Harmonic Amplitude as a Function
of Source Voltage (Stress Amplitude). Straight l ine
has a slope o f 2.00.

71
solution of the wave equation for solids to second order in isotropic media shows that the amplitude of the second harmonic is expected to be propor- tional to the square of the s t ress ; Fig. 10.5 demon- strates that this condition is apparently fulfilled
U N C L A S S I F I E D
SOURCE VOLTAGE
Fig. 10.6. T h e Variation of Fundamental Attenuation
with Source Voltage (Stress Amplitude).
in the present case. In this s a m e solution the third-order elastic constants enter into the co- efficient of the quadratic s t ress term, so that it is presently thought that it may be possible to separate the different constants by appropriate selection of the mode of wave propagation once a complete theoretical treatment of the problem is available.
It has been found for 1iquids,l5 and suggested theoretically for solids, l 6 that for small distances the amplitude of the harmonic wave is proportional to the distance over which the wave passes . Attempts to verify this result in aluminum in the present work are not complete, but preliminary results on a variety of samples of different lengths indicate that there is a difference in signal ampli- tudes for constant impressed voltage (s t ress) in the direction expected.
I5L. K. Zarembo, V. K. Krasilnikov, and V. V . Shklovskaia-Kordi, Sovie t Phys . Doklady f English Transl . ) 1, 434 (1956); J. Acoust . SOC. Am. 29, 642 (1957).
16J. Bull . Am. Phys . SOC. 8 , 194 (1963).
Melngailis, A. A . Maradudin, and A. Seeger,

11. Art Ion Bombardment of Metal Surfaces
A. L. Southern D. R. Burrowbridge'
Emphasis in this program is on sputtering yield and atom-ejection studies. Measurements of the sputtering yield from copper crystals were extended to additional orientations, and ejection patterns were obtained from cadmium and magnesium and from ordered and disordered crystals of Cu,Au. In order to analyze the sputtered particles from
j copper crystals, a dual-beam mass spectrometer has been installed and is in operation. The re- sul ts obtained with this technique in conjunction with the previous work2 on sputtering yields and atom ejection patterns of copper will be used in order to broaden our knowledge and understanding of the nature and properties of the sputtered particles.
The sputtering yields of s ix additional orienta- t ions of copper monocrystals were determined by u s e of the equipment and techniques previously described, t 4 The results compared favorably with detailed predictions of the theoretical model previ ou sly reported.
Ejection patterns for the three low-index planes of the ordered and disordered alloy Cu3Au were studied for the sputtered ratio of copper to gold. This ratio varied from 0.8 to 6. No clear evidence for focusing chains could be determined either for the ordered or disordered samples. X-ray examina- tion of the crystals before and after bombardment showed that the ordered ctystals were slightly disordered by Art bombardment.
2
'Co-op student from Virginia Polytechnic Insti tute, Black sburg .
The studies previously reported5 on the hexag- onal close-packed metal zinc were extended to cadmium and magnesium. While the ejection patterns of zinc showed some structure, no evi- dence of focusing chains or other structure was found in the ejection patterns of cadmium or magnesium.
The dual-beam m a s s spectrometer is described by the manufacturer.' Therefore, only a diagram of the bombarding ion source and the location of the solid angle for the sputtered particles is shown here (Fig. 11.1). The bombarding ion beam is variable in energy from 100 to 5000 ev, and the sputtered particles can b e accelerated up to 5000 v. The target can b e rotated from 0 to 90° with re- spect to the bombarding ion beam, and the sputtered particles a re analyzed at 90' from the bombarding beam. This arrangement allows only the sputtered particles to be analyzed over the complete range, with the exception of an angle of incidence of 4 5 O , for which both the sputtered and reflected particles are analyzed. The mass range of this instrurhent is 1 to 400 amu, and it h a s a mass scanning speed ratio of 1 to 250; the fastest speed is 5 min for 200 amu. The bes t background pressure obtained was 1 x torr; according to the history of the system, pressures were generally in the range 3 x to 1 x l o -* torr. Typical pressures in the system during operation were 2 x IO-' torr in the source, 3 x lo'' torr in the target region, and 2 x torr in the m a s s analyzer. The maximum bombarding argon ion beam current was 1 pa; and
*A. L. Southern, W. R. Willis, and M. T. Robinson, 5A. L. Southern e t al . . Solid State Diu. Ann. Progr.
Rept . Aug. 31, 1962. ORNL-3364, p 79. 3A. L. Southern e t al . . Sol id State Diu. Ann. Progr.
'A. J . Smith er al. . A Mass Spectrometer for the Study of Sputtering, paper presented at the Mass
4A. L. Southern et al., Solid State Diu. Ann. Progr. Spectroscopy, Eleventh Conference, San Francisco, Calif., May 22, 1963.
J . Appl . Phys . 34, 153 (1963).
Rept . Aug. 31, 1961, ORNL-3213, p 47.
Rept . Aug. 31. 1960. ORNL-3017, p 5 2 .
72
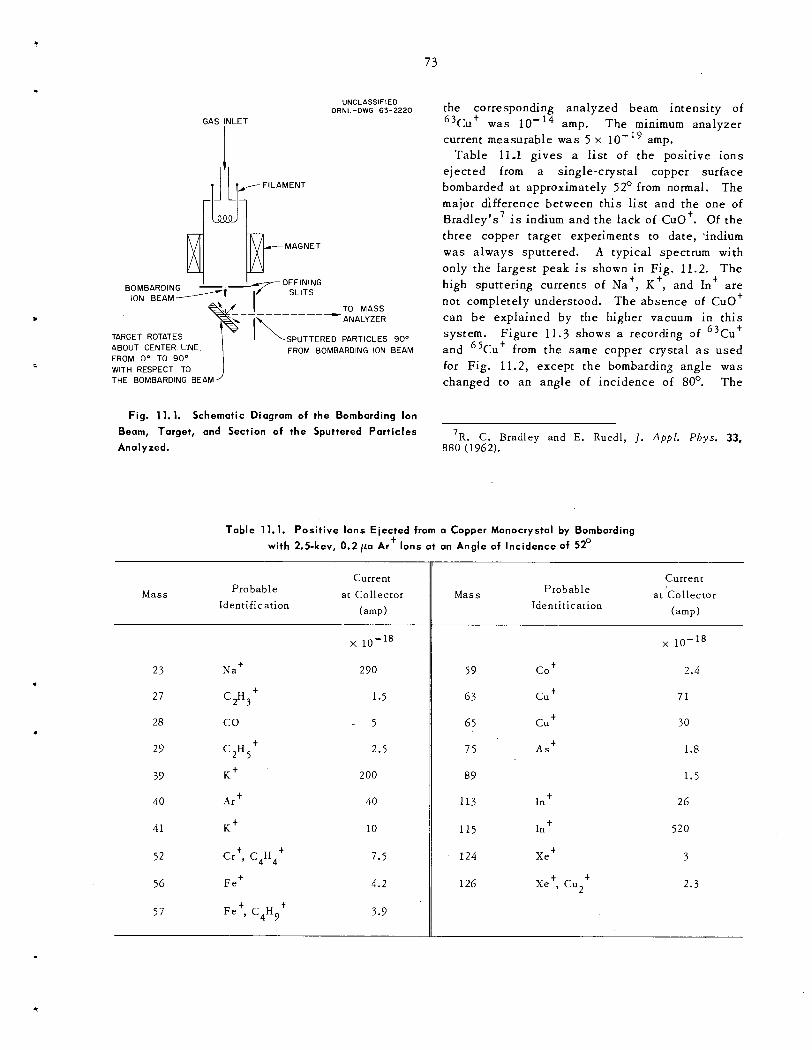
73
.
UNCLASSIFIED ORNL-DWG 63-2220
GAS INLET
I DEFINING BOMBARDING ION BEAM/ -iLF SLITS
TO MASS ANALYZER
TARGET ROTATES SPUTTERED PARTICLES 90° ABOUT CENTER LINE FROM 0" TO 90° WITH RESPECT TO THE BOMBARDING BEAM
FROM BOMBARDING ION BEAM
the corresponding analyzed beam intensity of 63Cut was amp. The minimum analyzer current measurable w a s 5 x
Table 11.1 g ives a l i s t of the positive ions ejected from a single-crystal copper surface bombarded a t approximately 52O from normal. The major difference between this list and the one of Bradley's' is indium and the lack of CuO'. Of the three copper target experiments to date, 'indium w a s always sputtered. A typical spectrum with only the largest peak is shown in Fig. 11.2. The high sputtering currents of Na', K t , and In are not completely understood. The absence of CuO' can b e explained by the higher vacuum in this system. Figure 11.3 shows a recording of 63Cut and 65Cu from the same copper crystal as used for Fig. 11.2, except the bombarding angle was changed to an angle of incidence of 80°. The
amp.
t
+
Fig. 11.1. Schematic Diagrorn of the Bombarding Ion
Beam, Target, and Section of the Sputtered Particles
Analyzed. 880 (1962). 7R. C. Bradley and E. Ruedl, J. Appl. Phys. 33,
Table 11.1. Positive Ions Ejected from a Copper Monocrystal by Bombarding t
with 2.5-kev, 0.2 p a Ar Ions at an Angle of Incidence of 52O
Current a t Collector Probable
Identification Mass
(amp )
Current a t 'Collector Prob ab1 e
Identification Mass
(amp)
23
27
28
29
39
40
41
52
56
57
N a +
C P 3 +
C P 5 +
co
K t
Art
Kt
t Cr', C4H4
F e t
Fe', C4H9 t
x 1 O - - l 8
290
1.5
- 5
2.5
200
40
10
7.5
4.2
3.9
59
63
65
75
89
113
115
124
126
c o
c u
c u t
A S t
t In
In
Xet
Xe , Cu2
t
t t
x 10-18
2.4
71
30
1.8
1.5
26
520
3
2.3

UNCLASSIFIED ORNL-DWG 63-2224
74
UNCLASSIFIED ORNL-DWG 63-2222
Fig. 11.2. Spectrum of Posit ive Ions Sputtered from
Copper Monocrystol s Under 2.5-kev Ar Ion Bombard-
ment at an Angle of Incidence of 52'.
+
+ 65 + isotopic ratio of 03Cu / Cu at this angle of 8 incidence is 2.29, which compares with White's
value of 2.25 f 0.02. Figure 11.4 is an energy analysis of 63Cu+ and 65Cu+ ejected from a (001) copper monocrystal bombarded with 2.5-kev Ar ions a t an angle of incidence of 70'. A t 50% level this energy spread is 7.5 ev for 63Cu+ and 6.7 ev for 65Cut. A more detailed analysis of these peaks will be made with different angles of incidence and with different bombarding energies. Figure 11.5 is a plot of ejected 63Cut and 65Cu+ peak heights as a function of the angle of inci- dence from 45 to 88O. The maximum peak height a t 76' compares to 78' that Molchanov9 reported using 27-kev argon ions. The isotopic ratio and the relative peak heights compare favorably only in the range 71 to 78'.
t
'F. A. White and F. M. Rourke, I . Appl. Phys . 33,
9V. A. Molchanov and V. G. Telkovskii , Soviet Phys .
2915 (1962).
"Doklady" (Eng l i sh Tmns l . ) 6 , 137 (1961).
I
'cut
Fig. 11.3. 63Cu+ and 65Cut Sputtered from Copper
Monocrystal with 2.5-kev Ar Ion Bombardment at an
Angle of Incidence of 80'.
+
.

400
+ X
$ 8 0 I Y a k 6 0
+2
D u 4 0
u
0
k z W
W 2 20
a
0
75
400
y 80 - 5 % 60 i I
40 Y
9 a 20
0 45 50 55 6 0 65 70 75 80 85 90
ANGLE OF INCIDENCE (deg) 0 50 400 150 200 2 5 0 300
ENERGY SPREAD (ev)
Fig. 11.4. Energy Analyses for 63Cut and 65Cut
Sputtered from (001) Copper Monocrystal with 2.5-kev
Ar Ion Bombardment at an Angle of Incidence of 70°. t
Fig. 11.5. Peak Height as o Function of Angle of
Incidence of 45 to 88O for 63Cut and 65Cut Sputtered
from (001) Copper Monocrystal with 2.5-kev Ar Ion
Bombardment.
t
.

.

.
Part IV. Nonmetals J. H. Crawford, Jr.
.
,
\
I
.

12. Semiconductor Studies
.
EFFECT OF DISORDERED REGIONS ON Co60 PHOTON-INDUCED DEFECTS IN GERMANIUM
J. W. Cleland R. F. B a s s J. H. Crawford, Jr.
1 It h a s been observed previously that the hole concentration and apparent acceptor level position of CoGo photon-induced defect states is markedly affected by the initial dislocation density of the germanium crystal specimens.
Crawford and Cleland2 have discussed the intro- duction of a shallow acceptor state at -0.2 ev be- low the conduction band and a deep acceptor state of approximately equal concentration as a conse- quence of CoGo photon irradiation of n-type germa- nium. Continued irradiation converts n-type germa- nium to p type, and an apparent defect-acceptor ionization energy of -0.24 to 0.26 ev above the valence band is observed. A very large additional irradiation does not further alter the apparent ionization energy or apparent hole concentration; hence, no evidence of any low-lying acceptor states of the type that have been observed as a consequence of fast-neutron irradiation is indi- cated by these experiments.
Vitovskii and co-workers have also observed the 0.2-ev defect state and (in a later p ~ b l i c a t i o n ) ~ additional s ta tes a t 0.26, 0.11, and 0.02 ev above
'J. W. Cleland and R. F. Bass , Solid State Diu. Ann. Progr. Rept . Aug. 31, 1962, ORNL-3364, p 103; J . W. Cleland, R. F. Bass , and J . H. Crawford, Jr., A p p l . Phys . Le t t e r s 2, 113 (1963).
2J . H. Crawford, Jr., and J . W. Cleland, 1. A p p l . Phys . 30, 1204 (1959).
3J. W. Cleland, J . H. Crawford, Jr., and J. C. Pigg, P h y s . Rev. 98, 1742 (1955); 99, 1170 (1955).
4N. A.Vitovskii, T. V. Mashovets, and S. M. Ryvkin, Soviet Phys.-Sol id Stale (Eng l i sh Trans l . ) 1, 1266 (1957).
5N. A. Vitovskii e t al . . Soviet Phys.-Sol id State (Eng l i sh Trans l . ) 3 , 727 (1961).
the valence band as a consequence of continued irradiation. These data are not in agreement with those obtained above. It is difficult to make any direct comparison, s ince the source strength, photon flux, irradiation time, and irradiation tem- perature were not specified; however, it is believed that any low-lying defect-acceptor states in germa- nium can be attributed to defects that were already present in the sample and that such defect s ta tes are not introduced in germanium by irradiation with CoGo photons.
Figure 12.1, which is a plot of log Hall coeffi- cient vs inverse temperature, shows the effect of extended CoGo photon irradiation on two samples of n-type germanium that were cut from adjacent portions of the same ingot and that were essentially identical in carrier concentration and dislocation content at the outset. Curve 11-A indicates that no evidence of any low-lying acceptor s ta tes was ob- tained for sample A after irradiation with CoGo photons/cm2. Curve 11-B shows the effect
1 3 of an initial irradiation of sample B with 10 (fission-spectrum) neutrons/cm that removed 5.3 x 10 l 3 conduction electrons/cm 3, and curve 111-B shows the effect of a subsequent irradiation of sample B with lo1.' photons/cm2.
It is evident that fast-neutron-induced disordered regions2s697 alter the apparent energy level posi- tion of CoGo photon-induced defect states. Sample A was reirradiated with 10 (fission-spectrum) neutrons/cm , and the resultant data fell essen- tially on curve 111-B, whereas the data of sample B were not further altered by a second irradiation with 10'' CoGo photons/crn2. These results
2
'J. W. Cleland and J . H. Crawford, Jr., "Radiation- Induced Disorder in Semiconductors," p 299 in Pro- c e e d i n g s of the lntemational Conference on Semicon- ductor P h y s i c s . Prague, 1960, Academic P r e s s , New York, 1961. 713. R. Gossick, 1. Appl. Phys . 30, 1214 (1959).
79

80
J 1
I a
Qz- 2
405
4x404
UNCLASSIFIED ORNL-LR-DWG 76860
407
5
I I I
0 2 4 6 e 40 42 44
'ooo/T (OK)
Fig. 12.1. Ha l l Coefficient vs Inverse Temperature of
n-Type Germanium Samples A and B Before Irradiation;
Sample B After Neutron Irradiation (Stil l n Type); and
Samples A and B After Subsequent Co60 Photon Irradia-
tion (Now p Type).
would indicate that the order of introduction has little, i f any, effect on the interaction between fast-neutron-induced disordered regions and CoGo photon-induced latt ice defects. Essentially identi- cal behavior was observed for both arsenic- and antimony-doped material; hence, the above cannot be attributed to chemical impurity effects.
These results strongly suggest that no low-lying acceptor s ta tes are introduced in material of low dislocation density by CoGo photons. The low- lying acceptor s ta tes reported by Vitovskii and co- workers most probably resulted from the presence of a relatively high dislocation density. The fact that disordered regions in neutron-bombarded specimens are a lso responsible for shallow accep- tors' should not be taken to mean that their effect iss the same a s that produced by dislocations. How either of these complex imperfections affects the acceptor level structure has not yet been estab- lished.
PHOTON-INDUCED LATTICE-DEFECT INTRODUCTION RATES IN
SEMICONDUCTING MATERIALS
J. W. Cleland R. F. Bass
The apparent rate of introduction of latt ice de- fects in semiconducting materials has been deter- mined by Hall coefficient and resistivity measure- ments subsequent to ambient-temperature and se- lected liquid-nitrogen-temperature irradiations with 0.667-Mev Cs13', 1.25-Mev Co60, 1.74-Mev Sb124, and 2.76-Mev N a 2 4 photons and with energetic cadmium capture gamma rays.
Monoenergetic-electron irradiation experiments have indicated that the minimum threshold energy for displacement of a latt ice atom to a stable inter- st i t ial position is about 15 ev for germanium, 13 e v for silicon, and 6 to 10 ev for certain 111-V type semiconducting intermetallic compounds. O m 'and Holmes9 have calculated the atomic displacement cross section for la t t ice atoms by gamma rays through the Compton process for various atomic displacement threshold energies, and Bartholomew and Higgs lo have measured the gamma-ray spectra from thermal-neutron capture in cadmium. One can, therefore, use the data of Oen and Holmes to calcu- late an atomic displacement cross section for a particular material and displacement threshold energy for a known flux of monoenergetic photons directly; or one can combine their calculations with the data of Bartholomew and Higgs for a similar calculation for a flux of cadmium capture gamma rays.
Table 12.1 shows the ratio of the calculated to the observed defect introduction rates for several semiconducting materials for five different incident- photon energies. The observed values were ob- tained from the experimental ra tes of carrier re- moval under the assumption that two carriers are removed per Frenkel pair in germanium and one in silicon and GaAs. It is evident that the agree- ment between theory and experiment improves rela- tive to the energy of the incident photon and that
8
'1. W. Cleland and R. F. Bass , Solid State Diu.. Ann. Progr. Rept . Aug. 3 1 , 1962, ORNL-3364, pp 95-102.
90. S. Oen and D. K. Holmes, 1. Appl . Phys. 30, 1289 (1959).
'OG. A. Bartholomew and L. A. Higgs, Compilation of Thermal Neutron Capture Gamma R a y s , CRGP-784 (July 1958); quoted by E. Troubetzkoy and H. Goldstein, Nucleonics 18(11). 171 (1960).

81
Table 12.1. Lattice-Defect Production in Semiconductors
Material N P N d / 4 Ratio (observed)
Type of Irradiation (n-type) (theory)
0.667-Mev Cs Ge 0.002 2000
GaAs 0.010 0.0004 2 5
G O 1.25-Mev Co.
1.74-Mev Sb124
2.76-Mev Na2*
Cadmium gamma rays
Ge
Si
GaAs
0.023
0.026
0.070
0.0006
0.0007
0.014
38
37
5
Ge 0.054 0.0027 20
Ge 0.074 0.010 7.4
Ge
Si
GaAs
0.076
0.046
0.450
0.018
0.008
0.320
4.2
5.8
1.4
n-type GaAs is particularly sensit ive to photon- induced lattice defects.
NEUTRON-INDUCED LATTICE-DEFECT INTRODUCTION RATES IN GERMANIUM AND SILICON
J. W. Cleland R. F. Bass
The apparent rate of introduction of latt ice de- fects in germanium and silicon has been deter- mined " by Hall coefficient and resistivity m e a s - urements subsequent to ambient-temperature and selected liquid-nitrogen-temperature irradiations with thermal, fission-spectrum, and monoenergetic neutrons.
H. C. Schweinler ' first indicated that the average lattice atom recoil energy as a consequence of thermal-neutron absorption and capture gamma-ray emission might be a s high a s 180 ev for germanium and 780 ev for silicon and that multiple defect crea- tion might be expected; however, extensive experi-
"J. W. Cleland and R. F. Bass , Solid State Diu. Ann.
I2H. C. Schweinler, J . Appl. Phys. 30, 1125 (1959).
Progr. Rept. Aug. 31, 1962, ORNL-3364, pp 95-101.
ments have indicated' that approximately only one electron in germanium and two electrons in silicon are removed per actual thermal-neutron capture by the lattice defects created in the (n, y ) process.
Crawford and Lark-Horovitz ' * utilized the initial slope of conductivity vs total integrated fast flux data to estimate the average net number of defect acceptors introduced as approximately -3.2 per incident fast neutron in a reactor locale. Gossick, Crawford, and Cleland ' later introduced the con- cept of the disordered region and indicated that one could u s e the theoretical considerations of Holmes and Leibfried" and the experimental values of
13]. H. ,Crawford, Jr., and J. W. Cleland, Intern.. J . App Radzatron Isotopes 9, 189 (1960); **Transmutation Doping and Recoil Effects in Semiconductors Exposed to Thermal Neutrons," p 270 in Radioisotopes in the Phys ica l Sc iences and Industry, International Atomic Energy Agency, Vienna, 1962 (to be published in Nuouo Cimento).
14J. H. Crawford, Jr., and K. Lark-Horovitz, Phys. Rev. 78, 815 (1950).
I5J . H. Crawford, Jr., and J . W. Cleland, J . Appl. Phys. 30, 1204 (1959); B. R. Gossick, J . Appl. Phys. 30, 1214 (1959); J . W. Cleland and J. H. Crawford, Jr.,
* < Radiation-Induced Disorder in Semiconductors," p 299 in Proceedings of the International Conference on Semi- conductor Phys i c s , Prague, 1960, Academic P r e s s , New York, 1961.
I'D. K. Holmes and G. Leibfried, 1. Appl. Phys. 31, 1046 (1960).
.
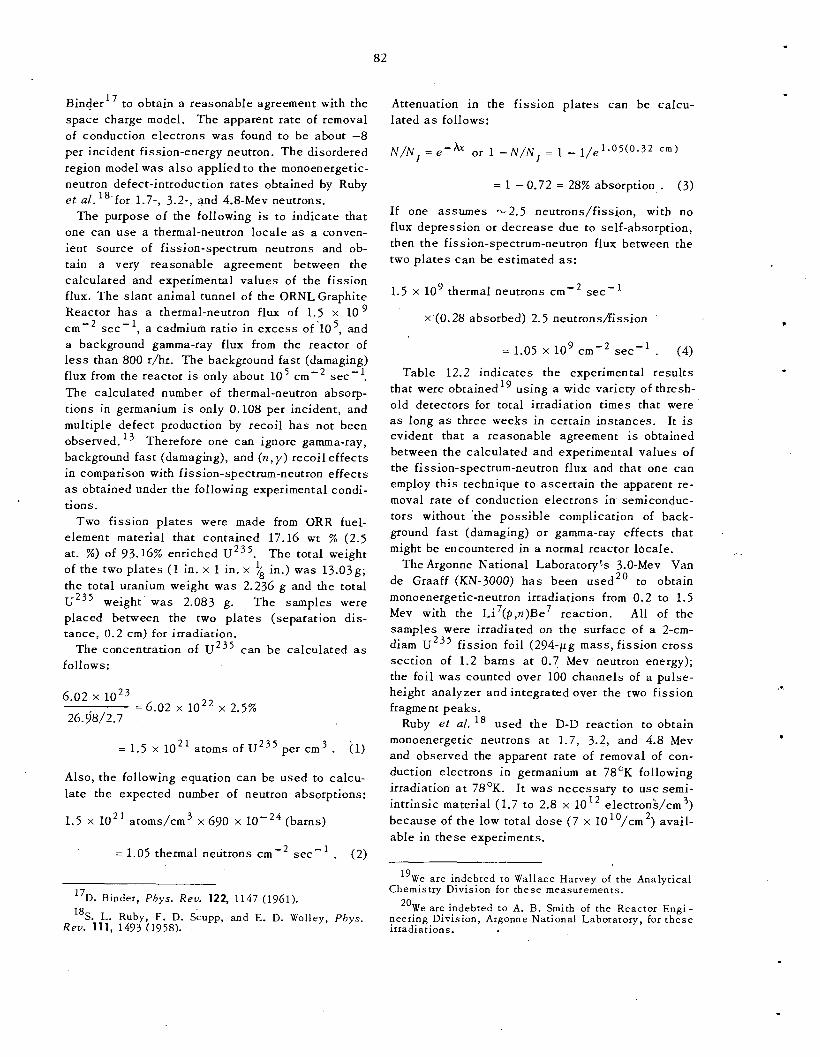
82
Binder'' to obtain a reasonable agreement with the space charge model. The apparent rate of removal of conduction electrons was found to be about -8 per incident fission-energy neutron. The disordered region model was a l so applied to the monoenergetic- neutron defect-introduction rates obtained by Ruby e t al. 18-for 1.7-, 3.2-, and 4.8-Mev neutrons.
The purpose of the following is to indicate that one can use a thermal-neutron locale as a conven- ient source of fission-spectrum neutrons and ob- tain a very reasonable agreement between the calculated and experimental values of the fission flux. The s lant animal tunnel of the ORNL Graphite Reactor has a thermal-neutron flux of 1.5 x l o 9 cm-2 sec-l, a cadmium ratio in excess of'105, and a background gamma-ray flux from the reactor of less than 800 r/hr. The background fast (damaging) flux from the reactor is only about lo5 cm'2 sec-l. The calculated number of thermal-neutron absorp- tions in germanium is only 0.108 per incident, and multiple defect production by recoil has not been observed. Therefore one can ignore gamma-ray, background fast (damaging), and ( n , y ) recoil effects in comparison with fission-spectrum-neutron effects as obtained under the following experimental condi- tions.
Two fission p la tes were made from ORR fuel- element material that contained 17.16 wt % (2.5 at. %) of 93.76% enriched U235. The total weight of the two plates (1 in. x 1 in. x in.) was 13.03g; the total uranium weight was 2.236 g and the total U 2 3 5 weight was 2.083 g. The samples were placed between the two plates (separation dis- tance, 0.2 cm) for irradiation.
The concentration of U 2 3 5 can be calculated as follows:
6.02 x =6.02 x x 2.5%
26.98/2.7
= 1.5 x atoms of u~~~ per cm3 . (1)
Also, the following equation can be used to calcu- late the expected number of neutron absorptions:
1.5 x l o 2 ' atoms/cm3 x 690 x (barns)
= 1.05 thermal neutrons cm-2 s e c - l . (2)
17D. Binder, Phys. Rev. 122, 1147 (1961). 18S. L. Ruby, F. D. Scupp, and E. D. Wolley, P h y s .
R e v . 111, 1493 (1958).
Attenuation in the fission p la tes can be calcu- lated as follows:
= 1 -0.72 = 28% absorption . (3)
If one assumes -2.5 neutrons/fission, with no flux depression or decrease due to self-absorption, then the fission-spectrum-neutron flux between the two plates can be estimated as:
1.5 x lo9 thermal neutrons cm'2 sec-l
x'(0.28 absorbed) 2.5 neutrons/fission
= 1.05 x l o9 c m - 2 sec-' . (4)
Table 12.2 indicates the experimental resul ts that were obtained19 using a wide variety of thresh- old detectors for total irradiation t i m e s that were as long as three weeks in certain instances. It is evident that a reasonable agreement is obtained between the calculated and experimental values of the fission-spectrum-neutron flux and that one can employ this technique to ascertain the apparent re- moval rate of conduction electrons in semiconduc- tors without 'the possible complication of back- ground fast (damaging) or gamma-ray effects that
The Argonne National Laboratory'k 3.0-Mev Van de Graaff (KN-3000) h a s been used2' to obtain monoenergetic-neutron irradiations from 0.2 to 1.5 Mev with the Li7(p,n)Be7 reaction. All of the samples were irradiated on the surface of a 2-cm- diam U 2 3 5 fission foil (294-pg mass, fission c ross section of 1.2 barns at 0.7 Mev neutron energy); the foil was counted over 100 channels of a pulse- height analyzer and integrated over the two fission fragment peaks.
Ruby et al. l8 used the D-D reaction to obtain monoenergetic neutrons at 1.7, 3.2, and 4.8 Mev and observed the apparent ra te of removal of con- duction electrons in germanium at 78'K following irradiation a t 78OK. It was necessary to use semi- intrinsic material (1.7 to 2.8 x 10l2 electron'S/cm3) because of the low total dose (7 x 10"/cm2) avail- able in these experiments.
might be encountered in a normal reactor locale. -
19We are indebted to Wallace Harvey of the Analytical Chemistry Division for these measurements.
20We are indebted to A. B. Smith of the Reactor Engi - neering Division, Argonne National Laboratory, for t hese irradiations.
c

83
Table 12.2. Threshold-Detector Flux Values
Detector Reaction Cross Section (barns)
Threshold Flux (MeV) (neutrons cmm2 sec-')
f ission Np237 Np237 __3 Bal*' 1.90 0.60 1.10 x l o 9
0.578 1.00 1.00 x l o 9 u238 u23' - > Bal*' f ission
N i '(n, p)Co 0.390 3.00 2.11 x 10' Ni5' ' s32 ~ ~ ~ ( n , p ) ~ ~ ~ 0.320 2.90 1.71 x 10'
0.060 8.20 6.13 x 10' 24 A1 27(n, a)Na
Curtis and Cleland2' have observed an apparent electron removal rate in germanium of about -8 per incident 14.1-Mev neutron, using the ORNL Biology Division's Cockcroft- Walton generator.
The ORNL Analytical Chemistry Division's 150- kv Cockcroft-Walton generator ( see ORNL TM-362), Texas Nuclear model 9501, h a s also been used for 14.1-Mev monoenergetic-neutron-irradiation experi- ments on various semiconducting materials. It is believed that certain details of this apparatus and the experimental setup might be of general interest.
The 1-curie water-cooled tritium target absorbs a 600-pa beam of deuterons over an area of about 1 in.2. A grid of four thin copper foils (each about $2 in. 2, indicated a neutron flux of about lo9 sec-' over - 1 in.2 of sample area, and all four foils agreed within a few percent as to total nvt received.
An estimated total dose of 8.5 x 1 0 l 1 (14.1-Mev) neutrons/cm2 was obtained in about 20 min -of machine time. I t has been estimated that each target might be expected to last for 3 hr of opera- tion; hence, one can predict a total dose of about 1OI3 (14.1-Mev) neutrons per c m 2 per $45 target. Recent trade literature indicates that >-curie tar- gets are now available.
210. L. Curtis, Jr., and J . W. Cleland, I . Appl . Phys .
22We are indebted to J. E. Strain of the Analytical 31, 423 (1960).
Chemistry Division for, these irradiati'ons.
Table 12.3 shows the average lattice-defect introduction ra tes that have been obtained for a ser ies of monoenergetic-neutron and fission-spec- trum-neutron irradiations of n-type samples of ger- manium and silicon. Note that the apparent removal rate of conduction electrons in n-type germanium is a fairly sensit ive function of the incident neutron energy up to about 0.7 MeV, which corresponds to a lattice atom recoil energy of about 20,000 ev; however, the apparent rate is not a sensit ive func- tion of the incident neutron energy above 0.7 M e V .
It has previously been indicated'' that one might use the apparent formation of low-lying defect- acceptor states in p-type germanium (converted from n type by irradiation) to signal the minimum energy required to produce disordered regions. Such states have been observed after a total irradi- ation of less than 10 l 3 (14.1-Mev) fission-spectrum or 0.7-Mev neutrons/cm 2; however, they have not been observed after a total irradiation of about
The large difference in apparent removal ra tes in n-type germanium for fission-spectrum neutrons, as compared with monoenergetic neutrons in the 0.7- to 1.5-Mev range, is not understood at present. The fission-neutron experiments were conducted in a thermal-neutron locale (see above); and the apparent rate of removal of conduction electrons was found to be relatively insensit ive to the total neutron dose, the initial electron concentration of 1 0 l 3 to 10'5/cm3, and the reactor ambient (4OoC) or liquid- nitrogen temperature irradiations.
1013 (0.2-MeV) or 1013 (0.5-Mev) neutrons/cm 2 .

84
.. Table 12.3. Monoenergetic-Neutron Lattice-Defect Introduction Rates
Neutron Energy Material Total Dose Removal Rate
(av) 2 (MeV) (n-type) (neutrons/cm )
0.20
0.50
0.70
1.00
1.25
1.50
Fiss ion
F iss ion
1.70n
3.20n
4.80a
14.10
14.10
Ge
Ge
Ge
Ge
Ge
Ge
Ge
Si
Ge
Ge
Ge
Ge
Si
1.08 x 1 0 l 2
9.20 x 1 0 l 1
8.30 x 1 0 l 2
1.13 x 1 0 l 2
3.04 x 1 0 l 1
2.81 x 1 0 l 1
0.3-1.6 x 10¹³
0.3-1.6 x 10¹³
6.00 x lo1'
6.00 x lo1'
6.00 x lo1' 8.50 x 1 0 l 1
8.50 x 1 0 l 1
-6
-17
-25
-30
-25
-25
-5 -7
-5
-2 1
-12
-12
-1 2
-12
L. Ruby et a/., Phys. Rev. 111, 1493 (1958).
DEVELOPMENT OF A COMPOSITE DEFECT IN
BY ANNEALING GAMMA-I R RAD I AT E D G E RMANl UM
Jay Cee Pigg
23 ,24 in The 0.09-ev level previously reported gamma-irradiated germanium has been studied in an attempt to identify the center responsible.
The level is not present after irradiation at 77'K but appears after a 70-min anneal at temperatures a s low a s 377OK. The level, once established, is stable to further anneal in the temperature range of 377 to 455'K.
A sample cut from the same ingot a s those re- ported in refs 23 and 24 was heated in air for 18 hr a t 600°C. The sample was then irradiated for 36 hr in liquid nitrogen, as was the case in previous ex- periments. The sample was then annealed for 70
2 3 J . C. Pigg, Solid Sfnte Diu. Ann. Progr. Rept. A u g .
J . C. Pigg, Annealing o/ Gamma Ray Induced 2 4
Changes in Antimony-Doped Gemanium,ORNL-3443 (May 14, 1963).
31. 1962, ORNL-3364, p 87.
min at 377'K. The change in carrier concentration when the Fermi level crossed the 0.09-ev level was 1.25 x The change in the sample which had not been heated in air was 0.75 x 10
This experiment suggests that the 0.09-ev level may be due to a n oxygen-vacancy complex. Such a center has been conclusively identified in electron-irradiated sil icon by electron spin reso- nance techniques. 2 5 In si l icon this composite de- fect ac ts a s an acceptor located 0.17 ev below the conduction band and is thermally quite stable. These similar characterist ics lend further support to the model proposed here.
13 .
DEFECT PRODUCTION AND ANNEALING IN n-TY PE GERMANIUM
Jay Cee Pigg
The annealing behavior of irradiated antimony- doped germanium is strongly affected by the donor
25G. D. Watkins and J. W. Corbett , Phys. Rev. 121, 1001 (1961).

85
concentration. For concentrations in excess of 5 x 101*/cm3, the thermal recovery of radiation- induced changes in both minority carrier l i f e t ime 26
and carrier concentration2’ is dominated by re- covery in the temperature range 35 to 100OC; whereas for lower donor concentrations the domi- nant recovery stage lies above 100°C.28 The influence of antimony is so striking that one might
centration demonstrates that antimony either par- t icipates directly in the primary radiation damage process or increases the concentration of electri- cally active defects which are retained by the latt ice a t the temperature of irradiation. Since the relative concentration of donors is only 2 in 10 , even in the heavily doped specimen, it is difficult to see how any primary effect could exist. There-
8
suspect qualitatively different defect structures in fore some process subsequent to defect creation is the two concentration ranges. One possible ex- the more probable interpretation. planation involves direct participation of the donor The ratio of the carrier removal rates for these in the defect production process during, or immedi- two specimens is the same a s the ratio of the cube ately subsequent to, irradiation. roots of the respective antimony concentrations.
To further elucidate this problem, an experiment On the bas i s of these scanty data, the implica- has been performed to determine whether or not the removal of carriers from n-type germanium due to CoG0 gamma irradiation is a function of impurity concentration. Two antimony-doped samples were irradiated at liquid-nitrogen temperature. The samples were periodically removed from the irradia- tion source, and the carrier concentration was measured by means of Hall effect. The data are shown in Fig. 12.2.
The factor of 2 increase in electron removal rate for an order of magnitude increase in antimony con-
260. L. Curtis, Jr., and J. H. Crawford, Jr., Phys. Rev. 126, 1342 (19 2).
27W. L. Brown, W. M. Augustyniak, and T. R. Waite, 1. Appl. Phys. 30, 1258 (1959). 28J. C. Pigg, Annealing of Gamma Ray Induced
Changes in Antimony-Doped Germanium, ORNL-3343 (May 14, 1963).
UNCLASSIFIED ORNL-DWG 63-2225
( x ~ ~ ’ 5 )
I I I I 0.9
0.8
0.7 - 0.6
- 0.5
a 0.4
6 C
03
g f (photons crn-‘)
Fig. 12.2. Concentration.
Carrier Removal a s a Function of Antimony
tion is that the carrier removal rate is a function of 1 / ~ , where r is the distance between impurity atoms. The data f i t the expression
I K + t A n = Y ,
T
where An is the change in carrier concentration, +,, is the photon flux, t is the t ime , T is the dis- tance between antimony atoms, and K is a dimen- s ionless constant. The value of K for these samples was found to be 7.8 x 10”O.
A more extensive examination of the dependence of removal rate on antimony concentration is neces- sary before the significance of this simple analysis can be evaluated. These data suggest that some species of radiation-produced defects must diffuse to the neighborhood of the impurity atom before it is effective in removing carriers. The work of MacKay and K l o n t ~ ~ ~ shows that diffusion of some sort does take place a t temperatures below 77OK. Presumably, the resulting defect structure, which is dominant in crystals containing a high antimony concentration, has a low thermal stability.
The influence of high antimony content on re- covery kinetics was examined by annealing experi- ments. Isochronal annealing curves (a 20-min anneal at the indicated temperature and property measurement at 77OK) for specimens containing 1.3 x lo’* and 1.1 x 10¹⁵ antimony atoms/cm3 subsequent to CoGo gamma irradiation are com- pared in Fig. 12.3. The low-temperature annealing
29J. W. MacKay and E. E. Klontz, 1. Appl. Phys. 30, 1269 (1959); “The Role of Carriers in the Displacement P rocess in Germanium,” paper presented a t the Sympo- sium on Radiation Damage in Solids and Reactor Mate- rials, Venice, Italy, May 1962 (to be published).

86
0 z z Z 0.7 z w E Z 0.6 0 b 9 0.5 LL
c - - 0.4
0.3
0.2
0.4
0
.
0 n \
A 0.
A \ A \ EP8-F
A EP4-A NL/ = 4.075 X 40'5 A
Nu = 1.346 x 40'4
A *\I. Y
Fig. 12.3. Isochronal Anneal as a Function of Antimony Concentration.
stage (270 ro 350°K) is much enhanced in the heavily doped crystal , in agreement with previous observations. 2 6 s 2 7 Further studies are required before a definitive model for the defect structure responsible for these observations can be formu- lated.
KINETICS OF ANNEALING AND COMPLEX FORMATION IN GAMMA-IRRADIATED
1.2-TYPE GERMANIUM
Jay Cee Pigg ' J . H. Crawford, Jr. I
The annealing of defects introduced into antimony- doped n-type germanium irradiated with Co gamma rays at 77OK was previously shown3' to be explic- able in terms of the following solid-state reactions
6 0
30J. C., Pigg, Annealing of Gamma Ray Induced Changes in Antimony-Doped Germanium, ORNL-3443 (May 14, 1963).
involving antimony atoms and vacancies:
k 1
k 2 Sb + V f l S b V ,
(6) k 3
SbV + V + SbV, ,
k 4 V + dislocation s i n k 4 SbV, , (c)
.
where the k's are the rate constants for the indi- cated reactions.
The previous simplified kinetic analysis sug- gested that the binding energy of the complex was -0.4 ev. Subsequent calculations have shown that this binding energy is too s m a l l to furnish a suf- ficiently large concentration of SbV complexes in the appropriate temperature range for reaction ( b ) to occur a t a reasonable rate. Therefore, to further investigate this point a more careful formulation of

87
kinetics has been' performed under the assumption that the energy levels of the vacancy are not appreciably different in number and position from those of the SbV complex. This assumption is justified by experimental observation and has the where is the 'Onstant,
E B / k T advantage that the observable number of acceptor s ta tes of the type initially introduced can be de- scribed as
and
0 N v = N T / ( l + K N s b > ,
K = - = A e N S b V
N V N S b ,
(7)
N, = N v + N S b V . (1) and E , is the binding energy of the complex. Sub- stitution of Eqs. (6) and (7) in Eq. (5) leads to the integral form Thus, the rate equations of interest are:
NV = - k , N S b N V + k 2 N S b V
- k 4 N D N v - k 3 N Sb N V ' . ( 2 ) where
aN$ e - ' / r
a + bN$(1 - e - ' / r ) ' N, =
N S b V 2 = k 3 N S b f l V ;
and, from Eq. ( l ) ,
where
2k 3KN!b ( 4) b =
1 + K N ~ ~ '
I-= ( 1 + K N g b ) / k 4 N D ,
that is, the concentrations of the species at the beginning of the anneal. At high temperatures,
N = vacancy concentration, where KNgb << 1, Eq. ( 8 ) reduces to the proper form for first-order diffusion of vacancies to dis- location annihilation s i tes ; and a t low tempera- tures, where vacancy migration over long distances becomes unimportant, it takes the second-order form
V N~~ = antimony concentration ( N ~ ~ = N ! ~
under the conditions of interest since N ;
N Sb = concentration of SbV complexes,
N S b V 2 =concentration of SbV, complexes, and
N = concentration of dislocations expressed D as number per cm2 .
( A s pointed out by Koehler et ul., 31 annihilation effectively occurs as soon as a vacancy reaches a dislocation s ince it should move rapidly along the s t ress field of the dislocation to find a jog.)
Equation ( 5 ) may be readily integrated by assum- ing equilibrium between vacancies and antimony atoms, that is, for N L << N!b as is appropriate here:
expected for formation of SbV, complexes.
integrated directly: By means of Eqs. (7) and (8), Eq. (4) can be
where
a = k N N ~ ~ ~ = K N O Sb N V (6) 4 D '
31J. S. Koehler, F. Seitz, and J . E. Bauerle, Phys. Rev. 107, 1499 (1957).

88
.
and r takes its previous value. As expected, N S b V 2
approaches zero for a l l t i m e s a t high temperatures,
N S b V 2 where KNEb << 1.
increases monotonically from 0 a t t = 0 to a satu- ration value determined by the relative magnitudes of k , , KNOSb, and k 4 N , in the relationship defined by Eq. (9). At sufficiently low temperatures, N S b V 2
At lower temperatures,
at saturation approaches N 0 T / 2 ,
Consider now the form of- 7:
1 + K N E ~ r =
k 4 N D
The important consideration is its temperature de- pendence. Now
- E M / k T k 4 = R D V u = R , B e 7 ( 1 1 )
50% recovery and thus proportional to 7; should yield a curve whose slope changes from a value near ( E , + E ) / k a t the lower temperature to a slope near E M b a t the higher temperature.
Examination of the experimental data indicates that the values E M = 0.75 ev and E , = 0.55 ev are consistent with both the ra tes of isothermal anneal- ing as a function of temperature and the saturation plateaus of the different isothermal annealing curves, provided the proper choice of preexpo- nential constants is made.
The required values of A , B , and R , are reason- able in magnitude. The actual parameter measured, however, is carrier concentration. Consequently, more extensive experimental data should be ex- amined in order to establish the validity of the original assumption and to verify the assumed values of A , B , and R, .
where R , is the capture radius of a dislocation cm), u v is the mean velocity of a moving
vacancy, B is a constant containing the effective vibrational frequency of the vacancy ( v 2 10 13/sec) and geometrical factors for vacancy jumping, and
RADIATION EFFECTS IN CADMIUM SULFIDE (PART I)
E Using the expression
is the activation energy for vacancy motion. J. W. Cleland R. F. B a s s M
E B / k T K = A e ,
one finds that
At sufficiently low temperatures ( K N g b >> I), Eq. ( 1 2 ) is approximated by
while for high temperatures ( K N g b << 1)
Calculations using approximate values for the con- s tants in Eq. ( 1 2 ) indicate that the intermediate range over which Eq. ( 1 2 ) must be employed covers a temperature interval comparable to that used ex- perimentally3'(377 to 455OK). Hence, a plot of log
v s 1 / T , where 71,2 is the t ime required for r 1 / 2
High-purity n-type single-crystal wafers of CdS were obtained from the Harshaw Chemical Company and fabricated into bridge-type Hall plates with an ultrasonic cutter; and the Hall coefficient and resistivity values were obtained in the temperature range 78 to 300°K. Typical values were an elec- tron concentration of 3 x 10¹⁵/cm3 and a Hall mobility of 440 to 5000 c m 2 v - l sec-' a s deter- mined a t 78OK. Representative samples were ex- posed at ambient t em erature (35OC) to a total dose of 1.5 x l O I 7 Co" photons/cm2. The elec- tron concentration was reduced by about I%, which would suggest an apparent removal rate of con- duction electrons of about 2 x per incident Co" photon. 3 2
The kinetic energy of recoil of cadmium atoms a s a ' consequence of thermal-neutron absorption and capture gamma-ray emission [ (n,y) process] has been estimated at about 75 ev. Subsequent trans- mutation of Cd' ', (27,000-barn cross section) is to the stable isotope Cd'14; thus the effect of the addition of chemical impurities by transmutation
32See, however, the r e sc l t s of R. 0. Chester, "Radia- tion Effects in Cadmium Sulfide (Par t II)," th i s chapter.
.

89
?
.
would be expected to be totally negligible a s com- pared with the introduction of cadmium intersti t ials and vacancies by (n ,y) recoil.
Selected samples were exposed in several thermal-neutron locales. The apparent electron con- centration was reduced by 10 to 25% for different irradiations; however, the apparent rate of intro- duction of defect s ta tes (assuming one electron removed per Frenkel-type pair) was only 0.1 or less per thermal neutron absorbed. Approximately 60% of the apparent reduction in electron concen- tration was thermally annealed after 23 hr a t 100°C.
One must therefore conclude that thermal-neutron- induced recoil effects [ (n, y) process 1 are not very effective in producing Frenkel-type latt ice defects in CdS or that such defects readily anneal.
RADIATION EFFECTS IN CADMIUM SULFIDE (PART II)
R. 0. Chester
Investigations of radiation effects in 11-VI com- pounds have been continued, but emphasis has been shifted from Z n S to CdS. Two considerations which led to this change are: (1) higher-purity crystals are available for CdS than for ZnS; and (2) the smaller band gap in CdS makes the investi- gation possible with less elaborate and, often, already existing equipment.
Higher-purity single crystals of CdS have been obtained from the Eagle-Picher Company. Spectro- scopic analysis shows silicon (10 ppm) and man- ganese (0.5 ppm) as the major impurities present.
Ohmic contacts to the samples are made by apply- ing indium with an ultrasonic soldering iron. The crystals are n type with a bulk resistivity of 4.0 to 0.6 ohm-cm, a s indicated in Fig. 12.4. Hall mobility is -8000 c m 2 v-' sec-l a t 52OK and de- creases to 300 c m 2 v - l sec" a t 300°K. A t temperatures greater than 77'K, Hall mobility apparently decreases a s T - 2 .
A s shown in Fig. 12.4, after irradiation with 2.3 x 1 0 l 8 CoGo gamma rays/cm2, the room-temper- ature resistivity decreases by 35% and the Hall mobility decreases by -10%. The resultant carrier introduction rate is 0.006 carrier produced
5000
4000
UNCLASSIFIED ORNL-DWG 63-2227
4
0.6
0.4
1000
800
2 4 6 8 10 12 44 16
'OO0/~(OK)
Fig. 12.4. Hall Coefficient and Resistivity Before and After 232-hr Gamma lrradiotion vs 1/T for CdS.
per absorbed gamma photon33 (3 x per inci- dent photon). The rate of introduction of carriers a s indicated in Fig. 12.5 is not constant with dose.
From these Hall data there is no clear-cut evi- dence of a single level introduced by the CoGo gamma irradiation at room temperature. The large observed change in Hall coefficient is probably caused by the introduction of a number of shallow levels.
Photo Hall-effect measurements on a gamma- irradiated specimen show a decrease in mobility a s well as i n resistivity while light is shining on the sample. This mobility decrease precludes a pre- dominance of the double acceptor state observed by Lorenz and Woodbury3* upon heating CdS in a cadmium atmosphere. Such an acceptor s ta te pro- duced a marked increase in mobility with photo- excitation.
33Compare these results with those of J . W. Cleland and R. F. Bass , "Radiation Effects in Cadmium Sulfide (Par t I)," th i s chapter.
34M. R. Lorenz and H. M. Woodbury, Phys. Rev. Letters 10, 215 (1963).
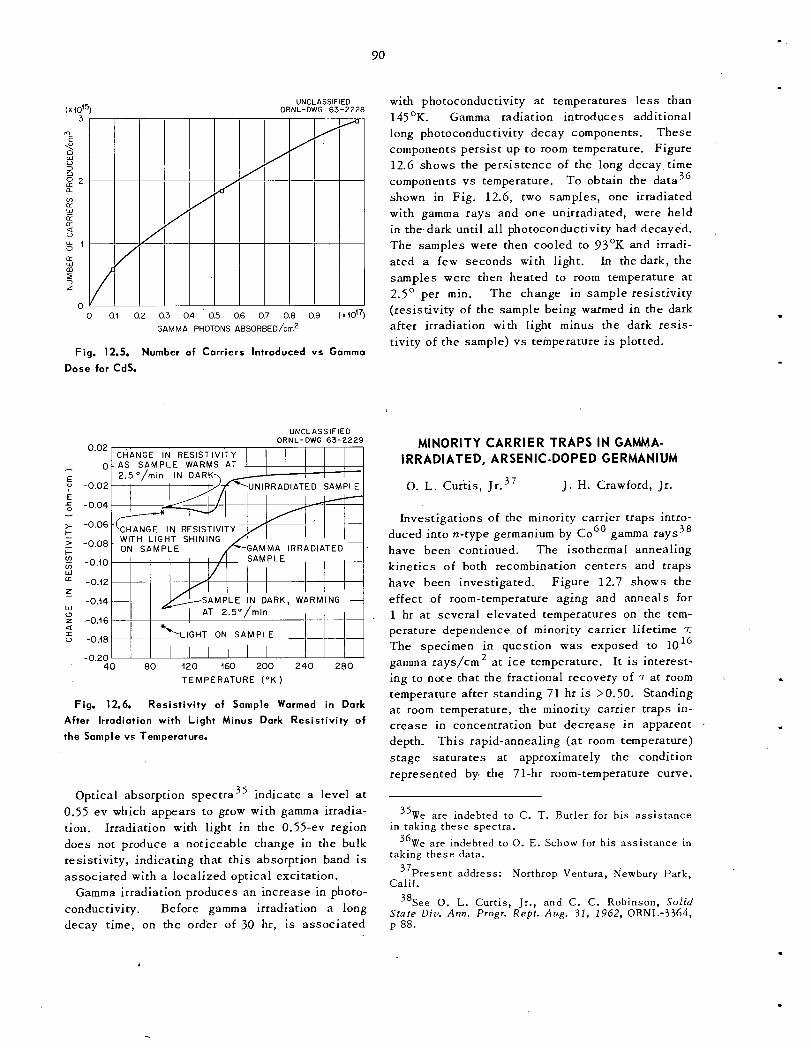
90
/
UNCLASSIFIED ORNL-DWG 63-2228
0 0.1 0.2 0.3 0.4 . 0.5 0.6 0.7 0.8 0.9 ( X 1 0 ' 7 ) GAMMA PHOTONS ABSORBED/^
Fig. 12.5. Number of Corriers Introduced vs Gamma
Dose for CdS.
0.02
- 0
y -0.02 E
E 5 -0.04
> -0.06 k 1 -0.00 I-
-
$ -0.10 W
-0.12 5
-0.f4
z -0.16 a v -0.40
-0.20
w a
I
UNCLASSIFIED ORNL-DWG 63-2229
CHANGE IN RESISTIVITY AS S A M P L E WARMS AT 2.5O/rnin IN DARK\
A M M A IRRADIATED
40 80 120 160 200 240 280 T E M P E R A T U R E ( O K )
Fig. 12.6. Resist iv i ty of Sample Warmed in Dark
After Irradiation with Light Minus Dark Resistivity of
the Sample vs Temperature.
Optical absorption spectra35 indicate a level at 0.55 ev which appears to grow with gamma irradia- tion. Irradiation with light in the 0.55-ev region does not produce a noticeable change in the bulk resistivity, indicating that this absorption band is associated with a localized optical excitation.
Gamma irradiation produces an increase in photo- conductivity. Before gamma irradiation a long decay time, on the order of 30 hr, is associated
with photoconductivity a t temperatures less than 145'K. Gamma radiation introduces additional long photoconductivity decay components. These components pers is t up to room temperature. Figure 12.6 shows the persistence of the long decay time components v s temperature. To obtain the data3' shown in Fig. 12.6, two samples, one irradiated with gamma rays and one unirradiated, were held in the.dark until a l l photoconductivity had decayed. The samples were then cooled to 93OK and irradi- ated a few seconds with light. In thedark, the samples were then heated to room temperature at 2.5O per min. The change in sample resistivity (resistivity of the sample being warmed in the dark after irradiation with light minus the dark resis- tivity of the sample) v s temperature is plotted.
,
MINORITY CARRIER TRAPS IN GAMMA- IRRADIATED, ARSENIC-DOPED GERMANIUM
0. L. Curtis, Jr .37 J . H. Crawford, Jr.
Investigations of the minority carrier traps intro- duced into n-type germanium by CoGo gamma rays3' have been continued. The isothermal annealing kinetics of both recombination centers and traps have been investigated. Figure 12.7 shows the effect of room-temperature aging and anneals for 1 hr a t several elevated temperatures on the tem- perature dependence of minority carrier l i f e t ime 7;
The specimen in question was exposed to 10'' gamma rays/cm2 at i c e temperature. It is interest- ing to note that the fractional recovery of at room temperature after standing 7 1 hr is >0.50. Standing a t room temperature, the minority carrier traps in- crease in concentration but decrease in apparent I
depth. This rapid-annealing (at room temperature) stage saturates at approximately the condition represented by the 71-hr room-temperature curve.
,
35We are indebted to C. T. Butler for h i s a s s i s t ance
3'We a re indebted to 0. E. Schow for h i s a s s i s t ance in in taking these spectra.
taking these data.
37Present address: Northrop Ventura, Newbury Park,
38See 0. L. Curtis, Jr., and C. C. Robinson, Solid State Diu. Ann . Progr. R e p t . Aug. 31, 1962, ORNL-3364, p 88.
Calif.
.
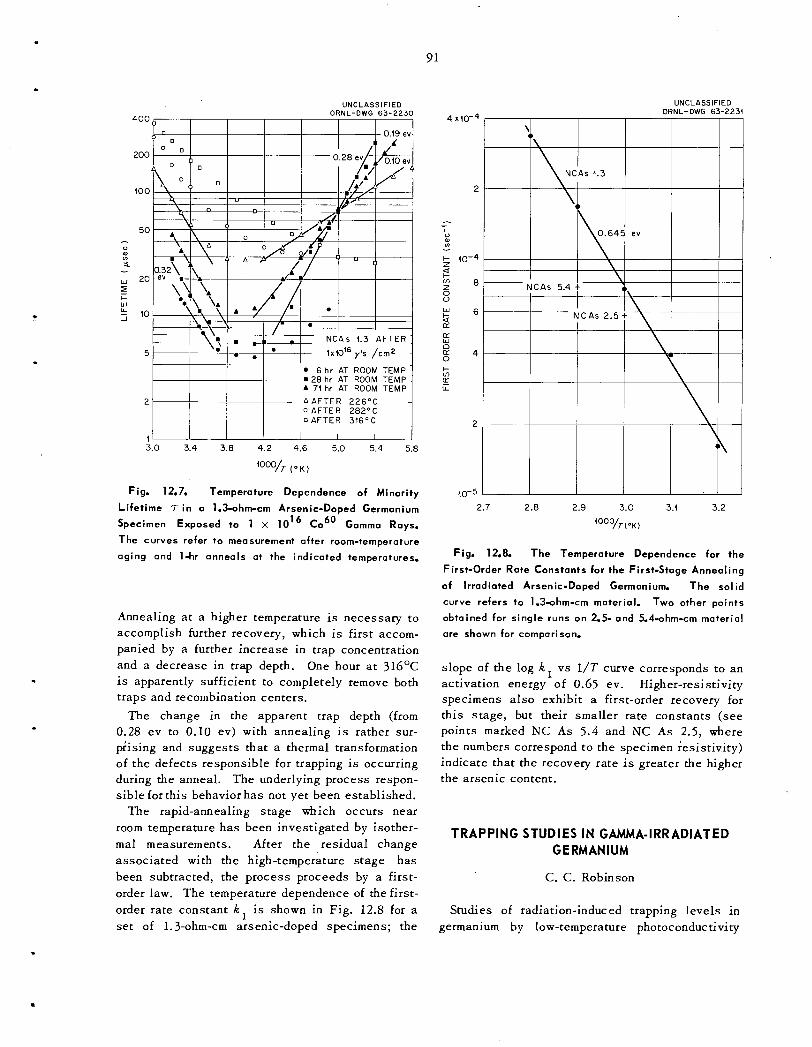
91
UNCLASSIFIED ORNL-DWG 63-2234
UNCLASSIFIED ORNL-DWG 63-2230
400 4 I I I I I I I
200
100
50 - 0 al v)
3. 1
w 2 0 z + W 5 10
5
6 hr AT ROOM TEMP m 2 8 h r AT ROOM TEMP A 71 hr AT ROOM TEMP , A A F T E R 226°C OAFTER 282OC OAFTER 316OC
Annealing a t a higher temperature is necessary to accomplish further recovery, which is first accom- panied by a further increase in trap concentration and a decrease in trap depth. One hour a t 316OC is apparently sufficient to completely remove both traps and recombination centers.
The change in the apparent trap depth (from 0.28 ev to 0.10 ev) with annealing is rather sur- piising and suggests that a thermal transformation of the defects responsible for trapping is occurring during the anneal. The underlying process respon- sible for t h i s behavior has not yet been established.
The rapid-annealing stage which occurs near room temperature has been investigated by isother- mal measurements. After the residual change associated with the high-temperature stage has been subtracted, the process proceeds by a first- order law. The temperature dependence of the first- order rate constant k, is shown in Fig. 12.8 for a set of 1.3-ohm-cm arsenic-doped specimens; the
4 x ~ O - ~
2
w 6 t E E 4
E
n
2
40-5
2.7 2.8 2.9 3.0 3.4 3.2
'ooo/T(oK)
Fig. 12.8. The Temperature Dependence for the
First-Order Rate Constants for the First-Stage Annealing
of Irradiated Arsenic-Doped Germanium. The sol id curve refers to 1.3-ohm-cm moteriol. Two other points
obtained for single runs on 2.5- ond 5.4-ohm-cm moteriol
are shown for comparison.
slope of the log k vs 1/T curve corresponds to an activation energy of 0.65 ev. Higher-resistivity specimens also exhibit a first-order recovery for this stage, but their smaller rate constants (see points marked NC A s 5.4 and NC A s 2.5, where the numbers correspond to the specimen iesist ivity) indicate that the recovery rate is greater the higher the arsenic content.
1
TRAPPING STUDIES IN GAMMA-IRRADIATED G E RM AN I UM
C. C . Robinson
Studies of radiation-induced trapping levels in germanium by low-temperature photoconductivity
.

92
measurements indicate that the phenomenon is a two-step process: the traps first “grow in” a t low temperatures ( <130°C); then they are annealed out a t higher temperatures. This process is shown by Fig. 12.9, which is a composite of several samples.
These efforts are now being carried out in two parts: (1) a study of trap growth as a function of annealing, and (2) annealing out of traps a t higher temperatures.
Exploratory experiments indicate that few, i f any, traps are put into the crystal as a result of irradiation. Since there is not yet a sharp demarca- tion between the temperatures at which traps grow in and those at which they anneal out, a ser ies of measurements at increasing temperatures is being made in which trap growth is allowed to go to saturation before the annealing temperature is raised. When a temperature at which the number of traps begins to decrease has been reached, the temperature range for trap growth will have been determined. Experiments w i l l then be performed to determine the activation energy, for trap growth in
0 50 ‘400 450 200 250 300 ANNEALING TEMPERATURE (“C)
Fig. 12.9. Trapping i n Low-Resistivity Arsenic-
Doped Germanium as o Function of Successive 1-hr
Isochronal Anneals.
samples of this carrier concentration and others of different purity and dopant.
Measurements on a 1-ohm-cm arsenic-doped sam- ple indicate that this range is between 25 and 13OoC. The sample was irradiated at O°C. In order to eliminate any unobserved postirradiation annealing resulting from etching and/or other treat- ment a t room temperature, the sample was coated with a thin f i lm of polystyrene dissolved in toluene. This was allowed to dry thoroughly and served as surface protection during the irradiation. In addi- tion, the sample was not allowed to come to tem- peratures above O°C except for more than a few minutes during transfer to the experimental appara- tus before the first measurements were made. After a l l changes that were going to occur at 25OC had ,
been observed, the plast ic coating was removed; and before and after measurements were compared. These indicated that the coating had no adverse effect on the experiment.
Consideration is a lso being given to analysis of that portion of the photoconductivity curve follow- ing the part associated with trapping for recombina- tion lifetime studies. T o do this requires assurance that there is no saturation of the photoconductivity as a function of the light intensi t ies used in this experiment. This will be determined.
These studies will be extended to higher temper- atures to determine the mechanism for the anneal- ing-out traps.
An experimental apparatus using compressor- circulated helium in vacuum-jacketed tubes and sample chamber has been constructed. Sample temperature is se t by a n electrical controller which valves hot and cold g a s that h a s previously passed through appropriate heat exchangers. The cold heat exchanger is a container filled with copper turnings submerged in a vacuum Dewar of liquid nitrogen or alcohol and dry ice. The hot exchanger is a copper-turnings-filled tube wrapped with an, electrical tape heater. The current temperature range is -90°C (limited by an 0-ring-sealed window soon to be replaced) to - 17OoC. Temperature con- trol is to approximately * 0.5OC.
Light is admitted through quartz windows in the inner and outer walls of the sample chamber. To suppress surface recombination effects, a thin germanium window filters out light having energy greater than the fundamental absorption edge. To avoid shifts in optical transmission when the ger- manium filter is heated by the light source, i t i s ,

93
and must be, on the inside of the inner chamber (that i s , at the s a m e temperature a s the sample).
Of particular experimental interest is the tech- nique used to p a s s electrical leads into the cham- ber. Experimenters have always faced the problem of running lead wires into an inner vacuum-jacketed chamber because of leaky Kovar seals, excessive heat transfer, and disassembly of soldered parts. These problems have been avoided by extending a thin-wall s ta inless s tee l tube from the inner cham- ber through a hole in the outer chamber (shown in Fig. 12.10). This tube is vacuum jacketed by a tubular extension of the outer chamber for a dis- tance of 3 in. Wires from the sample p a s s down the length of the inner tube and through Kovar seals . The Kovar s e a l s are always at or near room temperature; and because the air in the tube is not moving and the thermal conductivity of s ta inless s tee l is low, no difficulty has been experienced with heat losses or gains or leaky s e a l s due to different coefficients of expansion.
These samples have no leads soldered to them; rather, pressure contacts are used. These are held in place by spring-loaded copper clamps. This arrangement has greatly reduced t ime lost because of contacts broken by different coefficients of ex- pansion of the sample and rigidly held lead wires.
UNCLASSIFIED ORNL-DWG 63-2233
INNER CHAMBER -
LEAD WIRES -KOVAR
SEALS
Fig. 12.1 0. Sample Chamber Wiring Technique.
GAMMA IRRADIATION OF SILICON
Edward Sonder L. C. Templeton
attention to effects of concentration and species of donor atoms and oxygen content, has been com- pleted. Results have been submitted for publica- tion in the Journal of Applied Phys ic s ; an ab- stract” follows:
Measurements of the electr ical properties of gamma- irradiated float-zone s i l icon have been used to loca te a number of net acceptor leve ls in the upper half of the forbidden gap. In material doped with less than l0lG donors, a leve l due to a vacancy-oxygen atom pair located 0.17 ev below the conduction band is introduced at a rate comparable to its introduction in oxygen- containing material. However, in addition, there is introduced a leve l located 0.47 ev below the conduction band in phosphorus-doped float-zone silicon. The la t ter leve l is presumably due to vacancy-donor complexes. Annealing above 15OoC removes the deep level; further irradiation and annealing c a u s e s the reappearance of a deep net acceptor leve l a t 0.47 ev. In irradiated and annealed s i l icon, an additional net acceptor level a t 0.21 ev below the conduction band was observed.
p-Type Material
In previous work4’ it was noted that radiation- induced changes of electrical properties appeared at different ra tes in oxygen-containing silicon than they did in float-zone material. These differences have been investigated further. In oxygen-contain- ing material, a net donor level appears, located -0.35 ev above the valence band and introduced at a rate of 9 x level/cm’ per photon/cm*. The center responsible for this level is stable a t room temperature and shows no sign of annealing at 10o°C.
In material grown by the floating-zone technique, a net donor level closer to the valence band be- comes apparent. Data for one of the samples is reproduced in Fig. 12.11. The steep portion near 1/T = 6 of the uppermost curve yields E - E v =
0.21 ev for the position of the level. The center responsible for this level is not stable above room temperature. Moreover, its rate of introduction a t room temperature decreases with increasing total radiation dose, suggesting that some of the centers giving r ise to the 0.21-ev level disappear again during irradiation at room temperature.
n-Type Material 39Edward Sonder and L. C. Templeton, abstract of a paper to be published in Journal of Applied Physics.
40Edward Sander and L. c. Templeton, Solid Sta te Diu. Ann. Progr. Rep!. Aug. 31. 1961, ORNL-3213, p 61.
A careful study of radiation-introduced levels in the upper half of the energy gap, with particular

94
UNCLASSIFIED
408
5
2
407
5
2
405
5
2
404 1 I I I I I I 0 3 6 9 12 45 48
‘ooo/r(~K)
- Fig. 12.11. Ha l l Coefficient vs Temperature for
Gomma-Irradiated p-Type Float-Zone Silicon. The
three curves are for the same sample, measured after
irradiation to the total dose (photons/cm ) shown on
the curves.
2
In addition to the level at E - E v = 0.21 ev, the data show the introduction of a deeper level, apparent from the room-temperature (1/T = 3) Hall caefficient, which increases with irradiation. The position of this level h a s not yet been determined, but it would not be surprising i f it were the s a m e as the level observed in oxygen-containing silicon. The introduction rate found for the deeper level in specimen 216-SA is 6 x level/cm3 per pho- ton/cm2, which, is slightly less than the rate of introduction of the 0.35-ev level in oxygen-contain- ing material.
In contrast to n-type sil icon, where our results were, for the most part, consistent with other work4 1 ,42 (specifically, the identification of defect centers by Watkins and C ~ r b e t t ~ ~ ) , the present re-
4 1 su l t s are not consistent with other work. Wertheim located a level a t E - Ev = 0.27 ev in gallium- doped, crucible-grown silicon. Klein44 gives E - E = 0.31 ev in neutron-irradiated material. W e obtain 0.35 ev in boron-dopedmaterial. More- over, the fact that the center giving r i se to the 0.35-ev level s e e m s to be connected with oxygen is inconsistent with Watkins’ scheme, 4 3 in which a level near E - E v = 0.3 ev is attributed to the divacancy. Also, Watkins h a s not reported observ- ing any center that would give r ise to the level we have observed in oxygen-free material at 0.21 ev above the valence band, although a level near 0.16 ev above the valence band h a s been observed in neutron-irradiated silicon. 4 4
It is clear that more data are necessary before some of these discrepancies can be cleared up.
41G. K . Wertheim, Phys. Rev. 110, 1272 (1958).
42H. Saito, M. Hirata, and T. Horiuchi, J . Phys. SOC.
43G. D. Watkins and J . W. Corbett, Discuss ions Fata-
44C. A. Klein, J . Appl. Phys. 30, 1222 (1959):
l a p a n 18, suppl 3, 246 (1963).
day SOC. 31, 86 (1961).

13. Insulating Crystals
. ROOM-T EM PERATUR E RAD1 ATlON
CH EM1 ST RY 0 F EL ECT RON- EXCESS CENTERS IN KCI
Edward Sonder W. A. Sibley
A study of radiation-induced changes in the negative-ion imperfection structure of alkali ha- l ides h a s been under way, using chiefly optical absorption measurements. The study of the ra- diation equilibrium between F - and M-centers described previously' has been completed and published in the Phys ica l Review.' An abstract follows: \
A study of F- and M-center coloration by electron- irradiating single c rys ta l s of KCl i s made a s a function of radiation intensity, electron energy, and crys ta l prep- aration. The quadratic relation between M-center and F-center concentration in any particular sample, pre- viously observed for both x-ray and gamma irradiation, is verified for electrons if a constant current i s used throughout the irradiation. However, the ratio of M- center concentration to the square of the F-center con- centration i s dependent upon electron current and sample preparation. Moreover, if a specimen i s irradiated a t one radiation intensity for a long period and then the intensity i s changed for a short time, the relative M- and F-center concentrations are characterist ic of the l a s t irradiation intensity. It i s concluded from th is result that a dynamic equilibrium ex i s t s between F- centers and M-centers during irradiation. Interpretation of the results i s proposed in terms of four simultaneous processes producing and destroying F-centers and M- centers respectively. The p rocesses for destruction of F-centers and creation of M-centers are thought t o in-
volve a mobile imperfection created by the irradiation. Means by which small concentrations of impurities can affect some of these processes to change the F-M- equilibrium and F-center coloring curves are d iscussed .
In the above and previous work, the coloration efficiency in heavily colored KC1 was observed to decrease continually as more F-centers were produced. It was suggested that a radiation destruction of F-centers occurred, together with the production of F-centers. The relation be- tween this destruction process and agglomeration reactions (e.g., two F-centers forming an M-center) was unclear.
In order to obtain more information on this ques- tion, a specimen of Harshaw KC1 (the apparent saturation of late-stage coloration is quite pro- nounced in all Harshaw KCl samples so far stud- ied) was thinned to 127 p by polishing, to make optical measurements possible after very heavy coloration. The sample was colored at room temp- erature with electrons at a relatively low current density of 0.02 pa/cm2 until it approached an F- center saturation level near 2 x 10" a ~ - ~ . The measured absorption coefficients at the peak of the F- and M-bands plotted v s the total energy absorbed are shown in Fig. 13.1. At a total ab- sorbed energy of 4.8 x 10'' Mev/cm3 (see Fig. 13.1), the dose rate was increased a factor of 15, and thereafter irradiation was continued alter- nately at the high and low intensities.
Considering first the last section of the curves of Fig. 13.1, it seems that both the F- and M - center concentrations are decreasing with dose at the low radiation intensity. Unfortunately, the magnitude of the observed effect is barely outside experimental error. However, i f th is decrease is
proRr. ~ ~ ~ t . 31, 1962, 0 ~ ~ ~ ~ 3 3 6 4 , 105. confirmed in other measurements, it would verify 'Edward Sonder and W. A. Sibley, Solid S f a t e Diu.
- that in this material there is an asymptote to which the F-center concentration tends after long
'Edward Sonder and W. A. Sibley, Phys. Rev . 129, 1578 (1963).
95

96
900
750 1 - I E
+ z w 2 600 U L L W
0 u z
LT
0 a W 450 m a
z a 5 n 300 z
3 X
2 IC I;
150
0
F - BANI - I /
M- BAND
UNCLASSIFIED ORNL-DWG 63-223:
-T- i+
200 I
E
- - I
+ z w
450 ll. w 0 V
z
t- a LT
0
100 g
f m a
2 a 5
50 n z
X
2 s s
0 0 4 2 3 4 5 . 6 7 8 9 ‘0 ~ ( 4 (x10’6)
.ENERGY ABSORBED (Mev/crn3)
Fig. 13.1. Optical Absorption Coefficient at the Peak of the F- and M-Bands vs Absorbed Energy. The circles
ore for determinotions immediotely ofter 1.5-Mev electron irradiation at o current density of 0.02 po/cm2; the squares
ore for determinotions after irradiation at 0.3 p / c m . 2
irradiation. This asymptote is, of course, a func- tion of radiation intensity and probably varies in different samples. However, i t clearly would indicate that destruction of F-centers is proceed- ing at the s a m e rate as their creation. Moreover, the long t i m e necessary to approach saturation would indicate that these creation and destruction processes are very slow.
Considering next the F - and M-center concen- tration changes at the moments the radiation in- tensity is changed, it is evident that these changes, as h a s been stated before, are very rapid relative to the rate of actual production or destruction of color centers. In fact, on the scale of Fig. 13.1 they are instantaneous. This shows that the two sets of processes , one determining the F-center- M-center radiation equilibrium and the other being
responsible for the actual creation of F-centers irrespective of their state of agglomeration, can b e studied independently.
It is of interest that on changing the dose rate, the decrease (or increase) of F-band height con- sistently equaled the increase (or decrease) of the M-band height. (It was only after the las t change of irradiation intensity that the decrease of F-band height was appreciably greater than the increase of M-band height. However, a signifi- cant concentration of R-centers, which are pre- sumably tri-F-denters, was observed in this case. These would account for the difference.) The
3H. Pick, Z. Phys ik 159, 69 (1960).

97
relative number of F- and M-centers involved in these changes (An) can be estimated since
hn = 7.2 x lOI5 A a d f ,
where ha is the change in absorption coefficient of the band in question, E is the bandwidth at half maximum in electron volts, and f is the os- cillator strength of the F - or M-bands. However, a s shown by O k a m ~ t o , ~ higher energy bands of the M-center occur under the F-band so that
A a F (obs) = A a F - ahaM ,
where a is near unity. With the use of this infor- mation, the fact that haF (obs) was approximately equal to A%, and the ratios5 eF/eM = 2 and f /f = 0.43, it is found that AnF/AnM = 1.7. M . F With uncertainty s t i l l remaining concerning the
oscillator strength ratio as well a s the amount of M-center absorption under the F-band, this figure may be considered as being consistent with the idea that a l l the F-centers disappearing rapidly on a decrease of dose rate appear in pairs as M-centers and, conversely, that, on increasing the radiation intensity, the rapidly disappearing M-centers simply break up to form two F-centers each.
VARIATION OF SOME OF THE PHYSICAL PROPERTIES OF COMMERCIALLY AVAILABLE
KCI SINGLE CRYSTALS
C. T. Butler W. A. Sibley Edward Sonder
Studies at the Laboratory on F- and M-band introduction in KC1 by ionizing radiationG ,’ have shown that late-stage coloring properties vary greatly among crystals obtained from various sources. A s a result of this finding, the authors felt i t necessary to point out in the literature just how great the variations i n F-coloration rates are among crystals even from one supplier. To further
emphasize the variability of physical properties of commercial KC1 crystals, data on ultraviolet- excited luminescence a n d . light scattering were added to that on F-coloration rates. The informa- tion for materials from the Harshaw Chemical Com- pany will appear in the Journal of Chemical Phys - ics,’ and additional information will appear in a Bulletin of the Research Materials Information Center.9 A summary of the work is presented be- low.
It h a s been known for some t ime that first-stage coloration ra tes vary considerably among samples from different sources. However, the present data show that late-stage coloration curves for material from different sources vary in slope over a range of about 15:l; those for samples purchased from the Harshaw Chemical Company over a period of a few years vary by a factor of about 3 to 4. Col- oration curves for crystals taken from various places in a 1 x 2 x 3 in. Harshaw crystal even vary over about a 20% range. No single impurity which would account for the observed variation was found in the crystals. Ultraviolet-excited luminescence spectra of KC1 from several com- mercial sources show great variation in both character and intensit ies of luminescence bands. In general, the spectra of KC1 from different sources hardly resemble one another. Samples purchased at different t i m e s from any one supplier show both qualitative differences and order-of- magnitude quantitative differences, whereas samples purchased at the same t ime show (with a few exceptions) only quantitative differences of typically less than about 50%. The light-scatter- ing power both of crystals obtained from various manufacturers and of those from any single manu- facturer vary by a factor of about 10. Again, a s in coloration, no obvious correlation exis ts between the scattering power and known impurities.
These results demonstrate that variations of some physical properties in presently available alkali halides may be very much larger than has been realized. One is forced to view with s o m e trepidation the tendency to consider results ob- tained on samples from one ingot a s representa- tive of a particular alkali halide. I t is fairly
4F. Okamoto, Phys. Rev. 124, 1090 (1961).
5C. J . Delbecq, Z. Phys ik 171, 560 (1963).
‘W. A. Sibley and Edward Sonder, Phys . Rev. 128, 8To be published in the Journal o / Chemical P h y s i c s 540 (1962). for July 1, 1963.
’Edward Sonder and W. A. Sibley, Phys . Rev. 129, 9Research Materials Information Center Publication, 1578 (1963). ORNL RMIC-1, June 1963.

98
obvious that, in any research involving measure- ments of the properties mentioned above and prob- ably others as well, great care must be taken to ensure uniformity of samples. Intercomparison of such resul ts with different measurements made at different laboratories should be viewed with suspicion unless a procedure h a s been adopted in which, for instance, p ieces from the same por- u o n of a single ingot have been shared by the laboratories making the various measurements.
HARDENING OF POTASSIUM CHLORIDE SINGLE CRYSTALS BY QUENCHING
AND IRRADIATION"
Kazou Akimoto' W. A. Sibley
The effect of heat treatment and irradiation on the mechanical properties of potassium chloride single crystals of varying impurity concentrations was investigated. Some specimens were quenched in cold acetone (OOC) from temperatures over the range 100 to 65OoC, and other samples were ir- radiated with CoGo photons or with 1.5-Mev elec- trons to doses of lo1' photons or about 3.8 x 10¹⁵ electrons respectively. The quenching resul ts are most easi ly explained in terms of the dissoci- ation of vacancy-impurity complexes for temper- atures to 375OC. I t was not possible a t the quenching rate utilized to quench thermal vacan- cies in the lattice. Also, even for quench temper- atures below 375OC, there is evidence that some annealing of the defects occurred. Another inter- esting observation is that relatively impure sam- p l e s have quite different hardening properties for a given dose of irradiation, electron or gamma, than do the purer specimens.
HARDENING OF KCI BY ELECTRON AND GAMMA I RRADl ATlON '
W. A. Sibley Edward Sonder
Measurements of. the flow s t ress and F-band coloration have been made at room temperature on a number of different samples of KC1 as a
"Abstract of a paper which wi l l be published in the June 1963 i s sue of the Journal of A p p l i e d P h y s i c s .
"Present address: Chou University, Tokyo, Japan. '*Abstract of a paper t o b e published in the August
1963 i s sue of the Journal of Appl ied P h y s i c s .
function of gamma and electron irradiation. The rate of increase of flow s t ress with irradiation is found to be greater in samples and for irradiation conditions for which the coloring rate is greater, and smaller when the coloring rate is smaller. Moreover, the flow s t ress increase in any set of samples is proportional to the square root of the F-band absorption. The implication is that hard- ening is caused by either F-centers or other de- fec ts whose production is related to the production of F-centers. Since bleaching of F-centers does not produce any softening and s ince the magnitude of the hardening is of the order of magnitude to b e expected for interstitial-type defects, it is con- cluded that the increase of flow s t ress due to irradiation of KCl is caused by intersti t ial chlo- rine atoms or interstitial clusters.
LIGHT SCATTERING IN ALKALI HALIDE SING LE CRYSTALS
W. A. Sibley
Introduction
Light scattering can be used in transparent sol ids to obtain estimates of the s ize , shape, and concentration of the scattering units within the material. Unfortunately, in some transparent solids, particularly the alkali halides, there can be several different types of scattering units present; this makes the interpretation of the scat- tering data more difficult. For example, the pos- sible scatterers in KC1 single crystals are precipi- ta tes , vacancy-impurity clouds around dislocation l ines , grain boundaries, cavit ies, etc. Therefore, the scattering data may be somewhat more difficult to evaluate for these crystals than for solids containing only one type of scattering unit. However, it is hoped that carefulexperiments and a comparison of all the available experimental
1 3 - 1 7
13S. P. F. Humphreys-Owen, Proc. P h y s . SOC.. (Lon-
1 4 K . G. Bansigir and E. E. Schneider, 1. Appl . Phys .
150. Theimer, C. A . Pl in t , and W. A. Sibley, Ann.
l60. Theirner and C. A. P l in t , Ann. P h y s . 3 , 408
"C. A. P l in t and W. A. Sibley, 1. Appl . P h y s . 33 ,
don) 868, 325 (1955).
3 3 , 383 (1962).
Phys . 9, 475 (1960).
(1958).
3167 (1962).
.
99
observations with theory will allow a determina- tion of the types of scattering units which are dominant and also their characteristic s izes , shapes, and concentrations.
The present work has a multiple purpose. First , to determine (by measurements of the wavelength dependence, angular dependence, cry st al-ori en ta- tion dependence, and depolarization ratios of the light scattering) the character of the dominant scattering units within the crystals. Second, to find out what type or types of defects compose the scattering centers within each scattering unit (e.g., vacancies around an edge dislocation would form a cylindrically shaped scattering unit with vacancies as the scattering centers). Third, to investigate the extent to which the “bad regions” (which are the scattering units) contribute to the formation of defects under ionizing radiation.
Experimental Procedure
The crystal ingots used in this research were purchased from the Harshaw Chemical Company, the Isomet Corporation, and the Optovac Corpora- tion. In the case of the angular-dependence inves- tigations, i t w a s found best to u s e cylindrically shaped single crystals 2.5 cm high and about 5 c m in diameter with the cylinder ax is a [I001 crystal- lographic direction. The [OlO] and [lo01 directions in the cylindrical samples were determined by x- ray photography. Crystals of a lmos t any shape could be used for determining the wavelength dependence of the scattering, and the minimum usable s i z e w a s about 5 cm3. Table 13.1 shows the crystal designation, purchase date, and Ray- leigh ratio,
R = R2i / loV ,
where
R = the distance of the observer from the scat-
i = the intensity of the scattered light, V = the scattering volume,
l o = the intensity of the incident light,
tering units,
for incident light of wavelength h = 546 mp and for a scattering angle 28 = 90’) for each of the sampl e s inve sti gated.
The intensity of the scattering light was measured using an EM1 6256s multiplier phototube which could be rotated around a cylindrical quartz holder containing the sample and the index liquid, ben-
zene. The incident light beam originated from a 300-w concentrated arc lamp and passed through a Bausch and Lomb half-meter monochromator be- fore entering the crystal as a parallel beam of rectangular cross section. The intensity of the incident beam as a function of wavelength was found by using the same multiplier phototube used for the scattered light and by attenuating the incident beam with Cary optical filter assemblies. The intensity of the light scattering for 28 = 90° was about lo-’ of the incident beam intensity. The volume of the sample “observed” by the detector was about 6 mm3. The normal precautions
1 5 were taken to avoid stray light in the systems, and a s an additional check the wavelength depend- ence, dissymmetry, and depolarization ratio of the scattered light was measured for benzene and for lead sil icate glass.18 It was found that inserting a 2.5-cm-diam glass bottle containing distilled water into the incident beam did not give the Rayleigh law wavelength dependence. The scat- tered intensity for the water w a s comparable with that for the KC1 sample which gave the lowest scattering power; therefore, there is some doubt a s to the accuracy of the wavelength dependence for this sample, 0:103C. In th i s connection it should be mentioned that the mismatch in the indices of refraction between water and benzene (or glass) was much greater than that between the crystals and benzene; thus, a much higher surface scattering can be expected for the water.
The polarization measurements were made at h = 546 mp with Polaroid Corporation HN32 plast ic laminated polarizers. A consideration of the re- producibility of the depolarization results and all the possible errors and corrections inherent in
19 these measurements, as enumerated by Goldstein and reviewed by Stacey,20 indicated that the ob- servations are accurate to only about 20%.
All the angular-dependence data for the scatter- ing power P = i28/IoV which are presented were corrected with the factor sin 28, which accounts for the fact that the scattering volume “seen” by the detector depends on the scattering angle as l / s in 28. Also, the Thompson factor (1 + cos2 28)
‘*This sample was kindly furnished by E. Le11 of
19M. Goldstein, J. AppZ. Phys. 30, 493 (1959).
*‘IC. A. Stacey, Light Scattering in Phys ica l Chem-
Bausch and Lomb.
istTy, Academic P r e s s , New York, 1956.

100
Table 13.1. Rayleigh's Ratios, Dissymmetries, and Depolarization
Ratios of Several KCI Single Crystols
Sample z
Benzene
EDF-1-2
H:40
H: 100
H:105C
H:107C
I: 100
I:101
I: 102c
I:103C
I: 104C
0: 100
0:103C
0:104C
Oct. 1961
Feb . 1961
June 1961
Jan. 1962
June 1962
Nov. 1961
Apr. 1962
Oct. 1961
June 1962
June 1962
Aug. 1962
June 1962
Oct. 1962
0
45
0
0
0 45
0
45
0
0
0 45
0 45
0 45
0
0 45
0 45
16.5
28.1 28.0
7.1
6.1
13.1
15.0
1.8
1.6
5.0
8.6
18.0
4.4
1.3
3.1
0.98
0.99 0.99
2.4 2.0
2.6 2.8
2.1 2.8
2.9 3.5
2.0 2.4
2.9 2.9
2.8 3.3
0.420
0.066 0.067
0.524
0.483
0.337 0.283
0.217 0.187
0.444 0.537
0.578 0.461
0.625 0.630
0.320
0.083 0.136
0.265
0.029 0.030
0.147 0.544 0.031 0.112
0.070 0.036
0.063
0.068
0.214 0.388 0.114 0.178
'All these measurements were made for bThese numbers are normalized to that for pure benzene, which i s taken a s the average of those given in ref 24.
= 546 mp; 2 8 = 90.
h a s been removed. The scattering power of ben- zene when depicted in this manner should be con- stant a s a function of scattering angle; therefore, the dissymmetry i 4 5 ~ / ' , , 5 ~ should be unity.
The optical absorption measurements were made on crystalline plates of thickness 0.1 cm or l e s s which were cleaved from the samples used for the light-scattering observations. The irradiations were performed.in a 4.1 x 10G-r/hr CoGo gamma source with the crystalline p la tes placed in light- tight holders; which were equipped with s l ides to permit measurement of the absorption spectra of the specimens. Further details of the color-center aspects of this work have already been pub- lished. '
R e s u l t s
Light Scotter ing . - A large variation of the wavelength dependence and magnitude of the scattering power is observed for the different alkali halides and even among the different KC1 crystals. Figure 13.2 pictures the wavelength dependence when the incident light beam is along a < 100 > direction and 28 =- 90' for two crystals of KC1 and one sample each of KBr and L iF , a l l purchased from Harshaw. Although the KBr sample
21W. A. Sibley and Edward Sonder, P h y s . Rev. 128, 540 (1962).
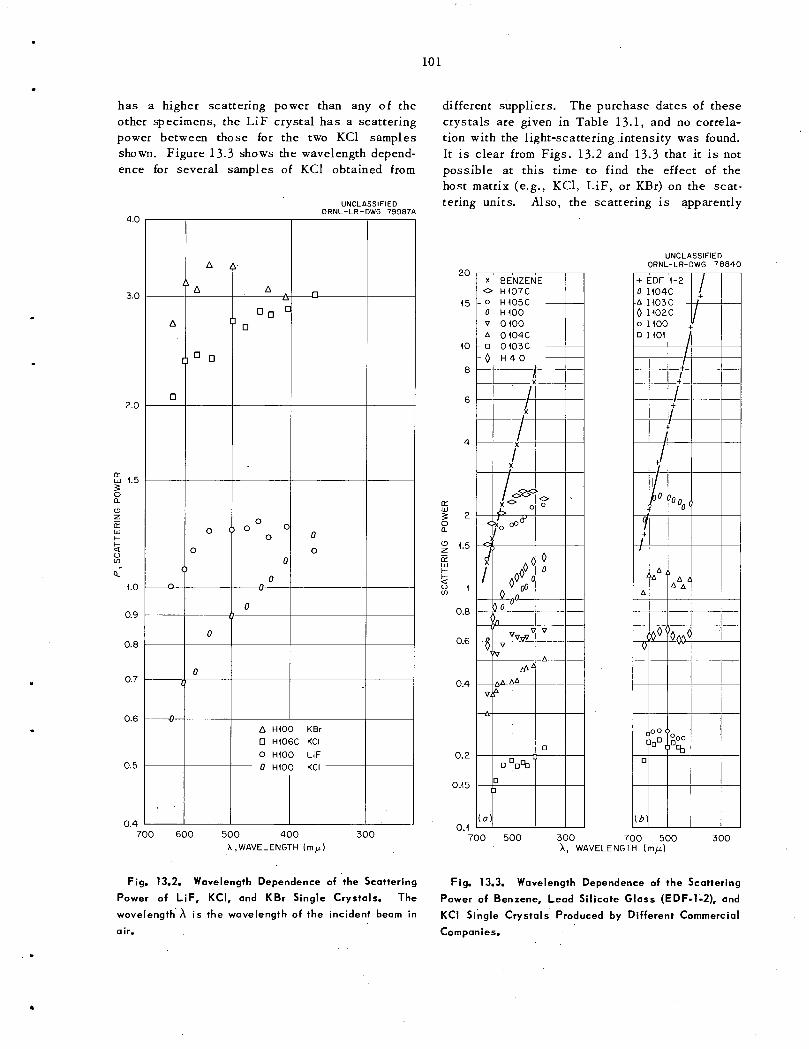
.
1
n
10 1
0
A H4OO KBr 0 H406C KCI 0 HtQO LiF 0 HtOO KCI ~
has a higher scattering power than any of the other specimens, the L i F crystal h a s a scattering power between those for the two KC1 samples shown. Figure 13 .3 shows the wavelength depend- ence for several samples of KC1 obtained from
UNCLASSIFIED ORNL-LR-DWG 79987A
4.0
3.0
2.0
E 1.5 3 a
z
0
(3
a W b-
V v)
t k-
4.0
0.9
0.8
0.7
0.6
0.5
1 0.4 700 600 500 400 300
X,WAVELENGTH ( m p )
Fig. 13.2. Wavelength Dependence of the Scattering
Power of LiF, KCI, and KBr Single Crystals. The
wavelength i s the wavelength of the incident beam in
air.
different suppliers. The purchase dates of these crystals are given in Table 13 .1 , and no correla- tion with the light-scattering intensity was found. It is clear from Figs. 13.2 and 13.3 that it is not possible at this t ime to find the effect of the host matrix (e.g., KC1, L iF , or KBr) on the scat- tering units. Also, the scattering is apparently
UNCLASSIFIED ORNL-LR-DWG 78840
20
15
10
8
6
4
IT W
2 5 $ 1.5
5i % '
a
- (z W +
0.8
0.6
0.4
0.2
0.45
0.4
V 0400 A 0 1 0 4 C
700 500 300
m I403C
) I 4 0 2 C 3 I400
700 500 300 A, WAVELENGTH (mp)
Fig. 13.3. Wavelength Dependence of the Scattering
Power of Benzene, Lead Silicate Glass (EDF-1-2), and
KCI Single Crystals Produced by Different Commercial
Companies.

102
done by centers which are not intrinsic defects, such as vacancies, but extrinsic imperfections, such as impurities of various types. If this were not so , it would s e e m that the variations in scat- tering power among crystals from the same sup- plier and having the s a m e approximate dislocation density should be less . An estimate of the abso- lute scattering power of these samples can be obtained by a comparison with the scattering from benzene (Fig. 13.3). The slope of the logarithm of the scattering power of benzene as a function of the logarithm of the wavelength is 4, as would be expected for Rayleigh scattering.
Previously, i t has been observed that KCl crys- ta l s grown by Harshaw possessed an orientation dependence of the light scattering.15 It is now possible, using an improved experimental appara- t u s and observing a smaller volume element within the crystals, to make a more complete study of this orientational dependence in crystals of dif- ferent types and obtained from different sources. The angular dependence of the light scattering for two different orientations of the crystals is shown in Fig. 13.4 for two KC1 crystals and for benzene. The open data points were taken with the crystals oriented so that the incident light beam was along a < l o o > crystalline direction. The full data points represent the angular de- pendence with the incident light beam along a < 110> crystalline direction. This same procedure has been used throughout so that full data points always represent an orientation @ = 45" with the incident beam along <110>, and the open points are for the incident light along < l o o > , (D = 0°C. The interesting aspects of Fig. 13.4 are the height of the peak for sample H:105C and the fact that there is no evident orientational dependence for the sample 0:104C. It should be mentioned that a l l the Harshaw and Isomet crystals, which could be used for investigating the angular depen- dence, had the orientation dependence; however, none of the Optovac specimens had a marked orientation dependence. The shape and height of this orientation peak were observed to vary from sample to sample, and Fig. 13.5 i l lustrates that even within one sample (1:104C) there can be a large variation, depending on which volume element of the 'crystal the detector observes. Sample I:104C was not a typical sample since the variations in the peak were not usually so pro- nounced, and i t was found, when this sample was cleaved into two equal halves, that a rather large
\
\
polycrystalline grain had grown into the middle of the specimen. The well-formed peak in Fig. 13.5 was'found for the good part of the crystal , and the peak shape became progressively worse as more of the polycrystalline section came into the observed volume element. The orientational dependence was also observed, as shown by Fig. 13.6, for Harshaw L i F and Harshaw KBr , although a complete investigation of these samples was not attempted.
UNCLASSIFIED ORNL-LR-DWG 78839
40
35
30
- YI - .- 5 25 F L
0 I 0
c .-
I
LT W
0
0
LT W +
s 20 a
z
k 2 45 x-
40
5
0
-
-
-
- 5c
40 60 ao (20 29, SCATTERING ANGLE (deg)
Fig. 13.4. Angular Dependence of the Scattering
Power of Benzene and of KCI Crystals H:lOSC and
0104C. The orientation @ = 0" is shown by the open
symbols, and @ = 4 9 i s represented by the ful l symbols.
.

103
6C
55
5c
45
- Y)
.: 40 3
x L 0
.& 35 n L 0 - 30
3 a 0
2 25
t 8 20
E W I-
q-
15
f 0
5
0
UNCLASSIFIED ORNL- LR-DWG 78838
60 80 400 120 440 28, SCATTERING ANGLE ( d e g )
Fig. 13.5. Angular Dependence of the Scattering
Power of One KCI Crystal 1104C as a Function of
Position Within the Sample.
The depolarization and dissymmetry measure- ments are summarized in Table 13.1. A s has been mentioned for the orientation @ = 45", the pattern has the large scattering peak a t 28 = 90". If @ varies by a few degrees, then the peak shifts by twice this amount;15 and, s ince the crystals could only be oriented to within f 2 O of @ = 4 5 O , the meas- urements taken from a specific angle depend on the position and shape of the scattering peak. There- fore, the accuracy of the dissymmetry and depolar- ization measurements for the orientation = 45O is not very good except where special care was taken to orient the crystal precisely, a s in sample H:105C. The depolarization ratios are defined in the following manner:
where the intensit ies of the horizontal and verti- cal components' of the light scattered at 219 = 90" are denoted by H and V , respectively, and the subscripts u, h , and v denote unpolarized, hori- zontally polarized, and vertically polarized inci- dent light respectively. In every crystal i t was observed that, within experimental error, the re- lation Hv = V h was obeyed. A system of optically isotropic spherical scattering units irrespective of s i z e should give p, = 0; it is clear from the table that, in all the crystals investigated, this ca se does not obtain.
Other Measurements. - In an effort to determine i f a correlation could be found between the "bad regions" associated with the light scattering and other properties of the crystals, several other measurements were made. Since the scattering power of the various samples is observed to vary
UNCLASSIFIED O R N L - L R - D W G 79988
22
20
18
46
f4
t2
[r 40 3 W
g 8
5 ;4
W
n b
P 6
2 40
8
6
4
2
0 40 50 60 70 80 90 400 140 420 130 440
28 , SCATTERING ANGLE (deg)
Fig. 13.6. Angular Dependence of the Scattering
Power for Two Samples of Harshow LiF and KBr.
e

104
over an order of magnitude, it should be possible to determine i f the number of bad regions or their composition, which is proportional to the scatter- ing power, influences the radiation coloration rate for such enti t ies as the F - and M-centers.
The radiation growth curves for F - and M-centers produced by gamma rays in some of the crystals investigated are shown in Figs. 13.7 and 13.8 respectively. A comparison of these curves with the scattering power of the s a m e specimens (see Fig. 13.3) makes it clear that the light-scattering bad regions within the crystals do not contribute to the production of F - and M-centers after first- s tage coloration is completed. The first-stage coloration was not investigated in detail, and there is no evidence as to whether a correlation can b e found in this case or not. I t was also pos- sible, by making optical measurements of the so- called OH- band in KCI (204 mp), to show that this impurity was not responsible for the light scattering in the Harshaw crystals investigated.
UNCLASSIFIED ORNL-LR-DWG 79990
300 I I I I I
250
- L
1 ‘E + 200 z w u LL LL W
150
Q n I-
[L 0 (n 2 100
C ’
50
0 0 5 10 15 20 ( X I 0 9
GAMMA DOSE ( r )
Fig. 13.7. F-Center Coloring Curves for Some of the
KCI Crystals Used in Th is Investigation.
H-IC
UNCLASSIFIED ORNL-LR-DWG 79991
!-- e /0-i03c
0 5 10 15 GAMMA DOSE ( r )
Fig. 13.8. M-Center Coloring Curves for Some of the
KCI Crystals Used i n Th is Investigation.
Theory of L i g h t Scattering by Dislocat ions
The light scattering by a cylindrical bad region of length Z* and radial distribution function P ( T )
has been calculated by Lester.” It was found that, for
*
22D. M. Lester, thes i s , University of Oklahoma, 1960.
.

.
.
105
where V is the scattering volume and r* is the an oscillating electric moment in a molecule effective radius of the cylinder, the scattered which is optically unsymmetrical. W e will con- intensity i can be written as sider only the case where the centers p o s s e s s an
2.rr2 n4 i = I
O R2h4
where
axis of rotational symmetry, so that their polariza-
If the principal axes of the polarizability ellip- soids are x’ , y’, and z‘, and t h e position of the scattering center relative to the x , y , z system is fixed by the two angles 4 and r ] (where r ] is the angle between z and z’ and 4 is the angle between
bility ellipsoids are spheroids (aix = a’ f a;,). .Y Y (1 + cos2 28) a 2
1 , (1) 1 1 + r * 2 ( A ~ + x v2 [
4 1 ~ n
h lpl =- sin 8, n is the index of refraction,
A = cos (8 - Q) , B = -1pI sin (8 - @) COS 4, C = -1pI sin (8 - @) sin 4,
a2 = average effective square of the polariza- bility per unit volume for the scattering system.
The angles 8, c, @ are m o s t easily defined as follows: 28 is the scattering angle (i.e., the angle between the direction of the incident light beam and the direction of observation); 4 is the incli- nation of the cylindrical bad-region axis ( Z ’ ) to the vertical; and @ is the orientation angle of the projection of this bad-region axis into the X-Y plane.
If the polarizability for the scattering system is isotropic, Eq. (1) indicates that, for a triad of mutually perpendicular cylinders oriented along X , Y , and Z , respectively, when @ = 45O, Z* = 3 x cm, and r = 2.5 x cm, the scatter- ing pattern of i v s 2 8 should have a peak a t 28 = 90’ with half-width of about 15O and a relative height of twice the scattering power for 28 = 45O. The dissymmetry, z , should be 1. The case @ = Oo has no scattering peak and a l so has a dissymmetry of 1. Moreover, the scattering for 28 = 45’ is the s a m e for the cases @ = 0 and = 4 5 9 The theory for this special isotropic case has also been dis- cussed at length in refs 15 and 16, and it can be shown that Eq. (1) agrees very well with the ex- pression found by van de H ~ l s t ~ ~ for scattering by cylinders.
When the scattering centers do not posses s spherical symmetry and the polarizability is not isotropic, then the scattering must be pictured a s a consequence of the incident light wave inducing
-
* <
23H. C . van de Huls t , Light Scattering b y Small Par t i c l e s , Wiley, New York, 1957.
the x axis and the projection of the z’ axis into the x-y plane), then the relation between the polar- izabil i t ies a:. and a. . can be written
fI ‘ I
2 2 azz = ai, cos r] + aix sin r ] ,
a = (alz - aix) sin r ] cos r ] cos 4 , axz = (aiz - aix) sin r] cos r ] sin 4 ,
Y ,
axx = aiz sin2 r ] sin2 4 + aix (2) x (cos2 4 + cos 2 r] sin2 +),
x (sin’ 4 + cos2 r] cos2 4 ) . a = aiz sin2 r ] cos2 4 + ai,
YY
In the evaluation of i v s 28 (i.e., the effect that anistropic polarizability has on the scattering pattern), it must be remembered that any analysis of the light-scattering pattern can only determine a pair distribution function or average projection of the scattering units. Therefore, when a s c a t t e r ing unit has several different orientations in the latt ice, the light-scattering pattern is character- istic of a superimposition of the orientations. For the special ca se of dislocation-defect-cloud scattering, this observation is important s ince for any (100) face of a crystal the line formed by the edge of the. extra half planes of the edge disloca- tions may be - in any of four directions, [loo], [ i O O ] , [OlO] , and [OlO]. It is therefore necessary to use an effective polarizability ellipsoid representative of the average projection of the scattering units to evaluate the scattering pattern. This can be done by averaging with the proper weighting func- tion over 4. It would be expected that the scat- tering centers in the cloud around the edge of the extra half plane of the dislocation would be at least partially oriented because of the elast ic and electric fields associated with this line. There- fore, it is necessary that the weighting function over 4 show this effect. When a weighting func- tion of cos4 2 4 representing an effective defect

106
I I I I I I I I I I I I I I
I I I' I I
I
I
\
I
0 (1
distribution for the case CP = 0' is used, then Eq. (2) may be written:
a
\,-r
---.. 0
If a weighting function of s in4 2@ is employed, characteristic of the effective defect distribution for the c a s e = 45O, then it is found that
aiz = (aiz cos 2 q + aix sin2 q>2 ,
1
2
- a:y =- - ai,)2 s in2 77 cos2 , (4)
When the scattered intensity, i, is evaluated a s a function of scattering angle, it is found that the intensity peak occurring at 28 = 90' depends markedly on the orientation of the scattering center polarizability ell ipsoids and on the ratio of aiz/
The dissymmetry is not necessarily unity for this case, and the scattered intensity for 28 = 45' when CP = 0' is not equal to that for 28 = 45' when CP = 459 Also, the scattering pattern is dependent on the expression chosen for the weight- ing function. Therefore, the parameters that most affect the shape of the calculated scattering pat- tern are the weighting function, the ratio of aiz/aix, the orientation T ] of the defect scattering center polarizability ellipsoid with respect to the dislocation l ine or bad-region cylinder ax is Z ', and the length of the bad region Z*.
Discussion
If it is assumed that the dominant light-scatter- ing units in the crystals are dislocations sur- rounded by impurity clouds, then it is possible through the u s e of Eqs. (l) , (3), and (4) to calcu- la te the scattering pattern for given values of T ] a n d ' a i z / a i x and for the two different orienta- t ions @ = 0' and @ = 45'. Also, values for T ] and
aiz/aix can be found independently from the depolarization data given .in Table 13.1. Consider only crystal H:105C as a typical example; it i s found that the depolarization data give q = 70° and aiz = 6.3 aix for the orientation @ = Oo, and T ] = 8.2' and a;, = 8.2 aix for = 45'. Figure 13.9 shows the fit of theory to experiment which
40
35
30
LL 25 5 2 a
LL W + z
5 20 In 91
15
40
5
0
. - -/-\
t i .
EXPERIMENT H405C
40 60 80 400 420 4 40 28, SCATTERING ANGLE (deg)
Fig. 13.9. Comparison of Light-Scattering Theory and In the theory the Experimental Data far Sample H105C.
the effective dislocation length Z was taken a s 3 x 10- 4
crn.

. 107
can be obtained using Eqs. (l), (3), and (4) and the values shown in the figure for q and the ratio aiz/aix with Z* = 3 x cm. The theory has been adjusted to fit one experimental data point: that for the orientation 0 = 0 and scattering angle 29 = 45'. No other fitting was necessary. Of course, the experimental data points cannot give the resolution and fine structure which the theory predicts because there is a spread in the observa- tion angle and because the dislocation networks are probably not perfectly aligned. However, the fit of theory to experiment is apparently quite good and gives credibility to the idea that the dominant scattering units within the crystals are disloca- t ions surrounded by defect clouds.
The large variation in scattering intensity shown in Figs. 13.2 and 13.3 suggests that the individual scattering centers and their concentrations within the scattering units vary from sample to sample and are most likely impurities. Rayleigh's ratio24 for benzene scattering at 546 mp is 16.5 x cm-', and a comparison of the scattering power of benzene with that of the individual samples investigated allows one to calculate a value for
N V 2 u2 from the formula -
1
1 + I * ~ ( A ~ + B 2 ) x (1 + cos2 28)
where N is the number of scattering units per unit volume, and all other symbols are the same a s those in Eq. (1). For Harshaw KC1 samples the
quantity N V 2 a2 varies from 0.72 to 1.8 x cm3, and for Isomet KC1 the variation is from 0.21 to 2.0 x cm3. The Optovac KC1 crys- ta l s do not show the characteristic orientation peaks in the scattering pattern observed for the Harshaw and Isomet samples; therefore, it is perhaps not feasible to use this same analysis. However, it should be mentioned that, i f the dis- location networks in these crystals are somewhat irregular and the polarizability ellipsoid is not markedly anisotropic, then the distinctive peak in the scattering pattern will not be apparent. Thus
-
24D. K. Carpenter and W. R. Krigbaum, J . Chem. Phys . 24, 1041 (1350).
it is not possible to eliminate dislocations a s the dominant scatterers in the Optovac specimens. This point is further strengthened by Fig. 13.5, which i l lustrates what happens to a scattering pattern a s the dislocation networks become more and more irregular.
Previously,17 it was suggested that the rela- tively high forward scattering at 29 = 45O and hence the large dissymmetry could be due to a contribution to the scattering by rather large pre- cipitates. This approach allowed the use of an isotropic polarizability in Eq. (l), and the addition of the contributions to the scattering from the two different types of scattering units did fit the data that were then available. However, the present experimental observations eliminate this possibil. ity since the scattering at 29 = 90° for 0 = 4 5 O is about a factor of 20 greater for some crystals than the scattering at 28 = 90" for = 0". In the iso- tropic polarizability case this factor should be 2. Moreover, several samples were taken to high temperatures (525 to 725OC) and then air cooled. A s had been noted before,17 the scattering power of the heat-treated samples was quite different from that for the same specimens before heat treatment, but the high forward scattering and the large dissymmetry were s t i l l observed. This indicates that, unless the precipitates grew and dispersed in exactly the same manner a s the de- fect cloud around the dislocations, only one type of scattering unit i s responsible for all the scatter- ing observed.
A comparison of the Rayleigh ratio values given in Table 13.1 with the rates of F - and M-center coloration shown in Figs. 13.7 and 13.8 indicates that the scattering centers within the bad regions do not affect the growth rates for either F - or M- centers. The differences in the Rayleigh ratios given in Table 13.1 can be due to changes (from sample to sample) of either the dislocation density
N , the type of impurity (and hence a'), or the ef- fective scattering volume V . The las t is rela- tively well known from the analysis of the scatter-
* < ing pattern, which gives Z * = 3 x cm and I =
2.5 x lo-' cm. Thus it is only possible to s ta te at th i s t ime that the coloration rates in the speci- mens investigated are not due to the type of impu- ri t ies surrounding the dislocations and may not be affected by the number of light-scattering bad regions within the crystals.
-

.
PURE MATERIALS PROGRAM
J. W. Cleland
It is the primary purpose of this program to develop the necessary techniques required for the production of research-quality specimens (usually single crystals) of a composition, purity, and perfection not commercially available. It has been recognized that actual progress in many areas of fundamental research has been limited by the unavailability of samples with a high degree of purity and perfection. The ultimate range of certain properties in many materials can be established only by means of experiments that are conducted on pure specimens or on samples that contain a known amount of impurity. The use of single crystals is mandatory in any determina- tion or utilization of those characterist ics that depend on crystallographic orientation.
The entire program involves a number of research divisions a t O W L and the special ski l ls of a number of other AEC installations and AEC con- tractors. Subcontracts have been negotiated to secure the particular ski l ls and techniques of other research groups outside the AEC for several materials of special interest.
Many of the actual crystal growth techniques have been performed by groups in the Reactor Chemistry and Metals and Ceramics’ Divisions and have been separately reported in their annual
reports. Special analytical techniques such as neutron activation analysis, mass spectral anal- ysis , and microspectroanalysis have been devel- oped in the Analytical Chemistry Division and have also been reported separately. It should be emphasized that close cooperation is required among those who analyze, grow, characterize, or use these materials and that this cooperation must transcend any group, division, or individual laboratory.
Included in this report are only those materials being grown or evaluated by the Solid State Divi- sion - KCI, HgS, Bi2Sej , Bi2Te3, Cu20.
14. Pure Materials Program
108
‘Isotopic L iF , U 0 2 , MgO, and CaF2 ; s e e Reactor Chem. Diu. Ann. Progr. Rept . J a n . 31, 1963. ORNL- 3417.
2Be0, Tho2, Hf02-SO2, 3Be0.AI2O3-6SiO2 (beryl), Sn02 , UAl3, UA14, ErMn03 , KCl (calcium doped), iron- substi tuted sodium-based micaceous materials, synthe- s ized Cs20-Ee203 .4S i02 , T i 0 2 , A120,,; s e e Metals and Ceramics Diu. Ann . Progr. Rept . May 31, 1963, 0 RN L-3 47 0.
RESEARCH MATER IALS IN FORMATION CENTER
T. F. Connolly
I
Information concerning the availability of and need for high-purity research materials has always been difficult to obtain; hence, it is the purpose of the Research Materials Information Center (RMIC) to collect and provide information on the purification, production, characterization, and availability of research materials to both producers and users. It is felt that an accurate, up-to-date listing of the properties of available research materials will eliminate a large portion of the duplication of effort that has occurred when individual research groups have attempted to produce such materials. Equipment for auto- matically searching coded entries on microfilm has been purchased and installed. An experiment in coding (to establish a thesaurus and the routine of storage and retrieval) has been successfully concluded. Background information on research materials, including techniques of production and characterization, has been and is being reviewed,

109
.
analyzed, coded, and filmed. Active participation has been expanded to include about 60 groups (outside ORNL). A bulletin containing reviews of current techniques and experimental results on alkali halides and a current listing of available and desired materials has been assembled and will be published shortly.
GROWTH OF SINGLE-CRYSTAL HgS
0. E. Schow I11
Investigation of methods for the production of HgS research specimens is being continued. In the pas t3 the main line of attack was vapor dep- osition a t a temperature below the cinnabar- meta-cinnabar transformation point ( " 3 3 5 O C a t 1 atm) both with and without iodine a s a carrier gas. During the current period the possibility of crystal growth from the me l t under pressure has been explored.
Although HgS sublimes a t 58OoC under atmos- pheric pressure, it can be melted under pressure. The melting point is =85O0C a t a pressure of "4 atm of helium. In exploratory experiments HgS starting material is sealed off in 6-mm-ID quartz ampoules under 1 atm of helium. The ampoules are enclosed in an Inconel vessel for protection against rupture of the ampoule, and the assembly is heated in a furnace. Polycrystalline masses of HgS have been obtained by this technique. A t 600°C, HgS is in the black meta-cinnabar form; but a s it cools, it converts (at an unknown temperature) to the red, hexagonal-cinnabar structure well before room temperature is reached. The helium pressure seems to elevate the transformation temperature to the extent that the difficulties with specimen fracture and crack production from the cubic to hexagonal form are reduced.
A determination of the pressure dependence of the transformation temperature is under way.
30. L. Curtis, Jr., Solid State Diu. Ann. Progr. Rept.
40. L. Curtis, Jr., J . Appl. Phys. 33, 2461 (1962).
Aug. 31, 1962. ORNL-3364, p 91.
Cod' GAMMA-RADIATION-INDUCED POINT DEFECTS IN Bi2TeS5
M. J. Smith
The effects of extended CoG0 gamma radiation upon the electrical resistivity, Hall coefficient, and magnetoresistance of Bi,Te3 have been ex- amined. Cobalt-60 gamma radiation causes an increase in the Hall coefficient in n-type B i2Te3 and a decrease in p-type. For gamma-ray ex- posures in the range of 10" photons/cm2, the apparent carrier removal rate is *IO-' carrier per CoG0 photon. Thermal annealing of radiation- induced damage was also investigated. The re- sul ts may be most consistently analyzed in terms of a model which consis ts of a radiation-induced tellurium vacancy and interlaminar clusters of tellurium interstitials. The effects of the radiation- induced point defects are discussed. Evidence of an effect on impurity-band conduction a t low temperatures in n-type Bi 2Te is observed.
DETERMINATION OF THE NONSTOICHIO- METRIC DOPING MECHANISM IN Bi2SeS6
M . J . Smith
The extrinsic electrical properties of chemically pure Bi,Te3 and Bi2Se3 have been attributed to deviations from stoichiometric proportions. *' Bi T e exis ts a s a single phase over a range of composition through the inclusion of substitutional point defects. That is, excess bismuth atoms occupy tellurium sites and are singly ionized acceptors; excess tellurium atoms occupy bismuth latt ice sites and behave a s singly ionized donors. A similar phenomenon' is considered to be true in Bi2Se3. Excess selenium acts a s an a ~ c e p t o r ; ~
2 3
7
5Abstract of a paper which h a s been submitted to the Journal of Appl ied Phys ics .
'A letter which appeared in Appl. Phys. Let ters 1, 79 (1962).
7C. B. Satterthwaite and R. W. Ure, Jr., Phys. Rev. 108, 1164 (1957).
'K. Hashimoto, Mem. Far. Sci., Kyushu Uniu., Ser. B 2, 141, 187 (1958).
9M. J . Smith, E. S. Kirk, and C. W. Spencer, J . Appl. Phys. 31, 1504 (1960).

110
however, the doping mechanism has not been determined. There are only three possible doping mechanisms :
( a ) Substitutional: Excess selenium atoms re- place bismuth atoms on latt ice sites normally occupied by bismuth atoms.
( b ) Subtractive: Selenium atoms occupy normal selenium si tes , but some bismuth sites are vacant.
( c ) Interstitial: Extra selenium atoms occupy interstitial positions.
The ability of a crystal to exist as one phase over a range of composition implies certain thermodynamic consequences which are useful in studying the material. In Bi2Se3 the crystal- vapor equilibrium system has two components, hence two degrees of freedom. Therefore, in principle, the composition and thus the electrical properties of the crystal can be controlled by con- trolling the temperature and the partial pressure of one component. The addition or removal of atoms, resulting from a disturbance of solid-vapor equi- librium conditions, is generally controlled by atomic diffusion within the crystal." A de- scription of the diffusion process will specify the particular doping mechanism (a, b , or c ) involved when excess selenium is added to Bi2Se3.
For sufficiently long diffusion t i m e s , approach to equilibrium concentrations within a thin slab is described to a good approximation by the follow- ing relation: "
10
( n e q - rime, - n i ) cu = ( 8 / 7 ~ ~ ) exp ( - - t D ~ ~ / h ~ ) , ( 1 )
where n is the equilibrium concentration of the excess constituent in the crystal of thickness h at ambient temperature T,, E is the average concentration in the crystal at some t i m e t , n i is the initial concentration a t t = 0, and D is the diffusion coefficient of the process at the t em- perature of the specimen.
If the concentration of current carriers in Bi2Se3 is, as proposed, regulated by the vapor pressure of selenium over the crystal, one may rewrite
e q
'OH. C. Gatos, Proper t i e s of Elemental and Com- pound Semiconductors, vol 5 , p 187, Interscience, New York, 1960. "W. Jost, Diffusion in Sol ids . L iqu ids , G a s e s . 3rd
ed., p 37, Academic P r e s s , New York, 1960.
Eq. (1) for the extrinsic range in the form:
( l / R o , J - ( 1 / R
= r '2 ( 8 / 7 ~ 2, exp ( - t D 7 ~ 2 / h 2, , (2 )
where R is the Hall coefficient for the condition indicated by the subscript. Equation (2) may be solved numerically for r by obtaining several measur(ements of the Hall coefficient at varying t i m e s of exposure. A check can be made of the results by varying the vapor pressure of selenium and repeating the procedure.
It has been demonstrated that controlled sele- nium vapor pressures prevent loss of selenium from Bi,Se to the vapor a t elevated tempera- tures.' A device similar to that described in ref 9 was used to study the vapor-crystal equi- librium system of Bi2Se3. The device employed the following modification: The excess selenium was not held within the specimen chamber but w a s contained in an additional chamber by a connecting tube. The temperatures of the sele- nium chamber, connecting tube, and specimen chamber were regulated separately, thereby controlling the partial pressure of selenium in the system. Resistivity and, Hall measurements were taken on a number of single crystals of Bi2Se3 which had been cleaved to a thickness of
h '2 cm. Measurements were made at various specimen temperatures and at selenium vapor pressures as a function of t ime.
3
The logarithm of z for specimen CBS-2 is plotted in Fig. 14 .1 as a function of t ime for various ambient temperatures. The slope of the straight- line portion of each curve gives the diffusion coefficient for the process. Diffusion coefficients obtained on al l other specimens of Bi2Se3 were identical at higher temperatures; however, con- siderable scatter was encountered a t lower tem- perature s .
Figure 14 .2 gives a plot of In D v s 1/T. The activation energy of the diffusion process is 3 x lo4 cal/mole. The dependence of the diffu- sion coefficient on temperature may be expressed by:
.

111
UNCLASSIFIED ORNL-LR-OWG 73823
t (sed
Fig. 14.1. ( n e q - r7 ) / ( n e q - n i ) = I v s t for Crystal
CBS-2 at Several Ambient Temperatures.
UNCLASSIFIED ORNL-LR-DWG 73824
TEMPERATURE ("C) 400 375 350 325 300
5 X 1 6 ' '
2
- : d o \ N E 0 5
B 2 2
+ z v)
0 0
6 10-"
k 5
v) 3 L L
2
i O d 2 i.4 4.5 4.6 1.7 I .e
rooo/, [OK)
Fig. 14.2. Selenium-Vapor-Crystal Diffusion Coeffi-
cient of BiZSe3 vs 1000/T.
The self-diffusion coefficient of selenium in Bi 2Se3 is reported to be1
D S e + Be2Se 3
The literature does not contain information on the self-diffusion of bismuth in Bi,Se 3 ; however, values for bulk diffusion in Bi2Se3 of antimony, which is similar to bismuth in s ize and electronic configuration, have been obtained:
3 D S b + B i 2 S e
The activation energies of Eqs. ( 5 ) and (3) are essentially identical. It is reasonable to assume that the activation energies for motion of antimony and bismuth are similar in magnitude; hence, the results suggest that the process is controlled by diffusion of bismuth rather than selenium.
Bismuth atoms diffuse to the surface, leaving bismuth vacancies in the bulk crystal. Bismuth vacancies are acceptor type. This is to be ex- pected for subtractive defects involving an excess
3 of the anion." also behave as acceptors.
Smith and others9 report a 0.09-ev energy level in n-type Bi2Se3 crystals grown from a me l t con- taining excess selenium. It would be interesting to determine whether this level involves the release of electrons which have been trapped by bismuth vacancies.
Bismuth vacancies in Bi2Te 1 4
DETERMINATION OF EXCESS OXYGEN IN Cu,O SINGLE CRYSTALS
M. J . Smith
It is well known that Cu20 owes its extrinsic semiconductivity to an excess of oxygen frozen into the lattice. One of the problems associated with the investigation of semiconducting behavior in this material and the evaluation of the quality of single crystals is the difficulty of analysis of deviation from stoichiometry. Since each ex- cess oxygen ion should be accompanied by two paramagnetic cupric ions, magnetic susceptibility
12A. A. Kuliev and G. B. Abdullaev, Soviet Phys.-
13B. I. Boltaks, Zh. Tekhn. Fiz. 25, 767 (1955). 14S. M. Schultz, J . P. McHugh, and W. A. Tiller,
Scientific Paper No. 929-8901-PI. Westinghouse Re- search Laboratories.
Solid State (Eng l i sh Transl.) 1, 545 (1959).

112
measurements should be an effective means of assaying for excess oxygen content. The sus- ceptibility of the’ host latt ice should be diamag- netic and relatively insensit ive to temperature, whereas the contribution from paramagnetic ions is expected to follow Curie’s law:
where NCu2t is the concentration of cupric ion per cm3, p is the Bohr magneton, p c u 2 t is the moment of the Cu2’ ion in units of Bohr magne- tons, and p is the density.
The experiments were performed on C u 2 0 single- crystal material procured in connection with the Pure Materials Program under contract from the Virginia Institute for Scientific Research (VISR). These crystals were prepared by the carefully con- trolled oxidation of high-purity copper single crystals. The susceptibility w a s measured on one as-received crystal from room temperature to “>OK, using , t h e equipment designed by D. K. Stevens. 1 5
Since only one crystal has been examined, the results are considered preliminary. The magnetic susceptibility, x, of C u 2 0 at room temperature was found to be -1.27 x lo-‘ cgs unit in good agreement with recorded values. The diamag- netism decreases somewhat with temperature. Below 20°K the paramagnetic ion contribution becomes dominant, and the diamagnetism de- creases rapidly. A rough analysis for the para- magnetic range according to Eq. ( l ) , assuming pcu2+ = 2.0 P (ref 16) and neglecting the slight temperature dependence of the host latt ice, yields an excess oxygen concentration of -4 x 10” cm-3.
Additional specimens of more suitable shape for these measurements are under preparation a t VISR. Further studies will include measurement of the effect of heat treatment in various oxygen pressures, and an attempt will be made to correlate excess oxygen concentrations with electrical properties.
15D. K . Stevens, Magnetic Suscep t ib i l i t y o/ Annealed and Fast-Neutron Bombarded Germanium, ORNL-1599.
“P. W. Selwood, Magnetochemistry. p 172, Inter- science, New York, 1956.
POTASSIUM CHLORIDE SINGLE CRYSTALS
C. T. Butler J. R. Russell
The ultimate a im of the pure KC1 program is to produce very pure single crystals of KC1 having also a low concentration of physical imperfections. The foremost a i m of the program this past year was to further improve the growing apparatus and to learn by chemical analysis of many different crystals just which impurities are reduced (or increased) in concentration by a particular treat- ment.
The controlled-atmosphere Kyropoulos furnace has been somewhat improved. The vacuum system has been enlarged and redesigned to allow faster pumpdown, lower ultimate vacuum, and easier cleaning. After experimenting with several types of crucibles, one made of platinum has been adopted. It shows no visible etching or deforma- tion after many uses in which the unused melt w a s often allowed to recrystallize in it. Because quartz pull rods are difficult and expensive to fabricate, rods of grade A nickel are now used. Nickel chucks have also replaced the former g rapv te ones. Contamination of the melt by the various materials present in the furnace chamber does not s e e m to be a serious problem. The zone refiner has been used to purify reagent-grade KC1 powder under a dry HC1 atmosphere. The zoner has performed a s expected, but the yield of about 30 to 50 g per month hampers its useful- n e s s a s a means of routine purification of starting material for the Kyropoulos furnace. A glove box has been added to the available apparatus in the semi-clean room where the crystals are grown. All loading operations are performed in this box under a dry argon atmosphere.
Relatively great strides have been made in the procurement of purer starting material. “Spectro- scopically pure” powder from Johnson, Matthey and Company, Ltd., has been used a s an inter- mediate source between the relatively impure reagent-grade powder and the locally purified KCl, which, hopefully, will be purer than either of the others. The Johnson, Matthey material has been used to grow several boules, nearly a l l of which have been superior to commercial crystals. An arrangement h a s been made with members of the Analytical Chemistry Division of the Laboratory to produce very pure KCl ingots of a t least the overall purity of the Johnson, Matthey
,
.
113
material. The program is just beginning, but a l - ready powder has been produced having l e s s than 3, 2, and 1 pg/g of calcium, sodium, and magne- sium respectively. Additionally, KC1 powder has been prepared by the two reactions
KOH + HC1 -+ KC1 + H,O
and
KHC03 + HCl + KC1 + CO,r + H,O .
Some analyses of the various powders produced, a s well a s analyses of some of the finished boules, a re presented in Table 14.1. Analyses of several commercial crystals are presented for comparison. In the table the powder l isted a s BA is reagent-grade KC1 from the Allied Chemical Corporation. That l isted a s JM is Johnson, Matthey “Specpure”-grade KC1 powder. Powder JR-1 was prepared using KOH and untreated HC1; JR-2 was made from KHCO, and untreated HCI. JR-3 used KHCO, with HC1 which had been ether extracted, while JR-4 used KHC03 with
HCl which has been both extracted and distilled. AC-1 was prepared in the Analytical Chemistry Division by simply extracting reagent-grade KC1 in thenoyltrifluoroacetone (TTA). A complete analysis of some of these materials is not yet available. The boule numbers may be recognized a s the dates upon which they were grown, while the commercial single crystals are given numbers preceded by an H, I , or 0 for the Harshaw Chemical Company, the Isomet Corporation, or the Optovac Corporation respectively. Entries preceded by a
less-than” indicate that the element was sought but not found; the number is the limit of detection for the analytical method used. Where no value is listed, the element was not sought in that particular analysis. The letters indicate rough spectroscopic determinations in which F indicates a concentration somewhere in the vicinity of 1 to 10 pg/g and E indicates 10 to 100 pg/g. Boules 021863 and 031463 were grown from JM material; the latter crystal, however, was acci- dentally contaminated with copper from an external source. The other boules were grown from reagent- grade material.
t t
.

114
m
m
?9
N9
8
88
8
m
9
-!N.
e 8
8
Y
0
C
0
._ c
c - a W
B u- c Q
Q
I- v)'
Y
tn
-
3N
.
.
N. U
?
c9
3-
44
V
v
VQ
a
r.
m
6Z
ON
i
??
... z
v" i??
m 9
8 8
8
- U
Y 0
Y
mv
99
e8
m
m
X~
aa
w3
V
. 7
f
mu
3
0
99
"
8
N
rn
N
V
19
"
8
8
Part V. Radiation Metallurgy M. S. Wechsler
.

.

15. Radiation Metallurgy
A major objective of the Radiation Metallurgy Section is the study of the radiation embrittlement of reactor materials. In the past year, continued assis tance has been given the Gas-Cooled Reactor Project in the design and implementation of the pressure-vessel surveillance program for the EGCR. In this program, impact and tensile samples from the heats of EGCR steel (ASTM A212, grade B) are to be placed adjacent to the inside wall of the pressure vessel and removed a t prescribed intervals ‘for test s o that the condition of the pressure vessel may be monitored. About 1500 surveillance and control samples are required. The machining of the samples of base-plate ma- terial has been completed, and the preparation of samples of weld and heat-affected-zone material is under way.
The influence of the temperature of irradiation on the radiation embrittlement of pressure-vessel s teels is of interest because of the o b ~ e r v a t i o n ~ ’ ~ that for some s tee ls the embrittlement a t first increases with increasing irradiation temperature. To further explore this aspect of the radiation- embrittlement phenomenon, instrumentation has been installed in the ORR during the past year to permit elevated-temperature irradiations. An ex- periment containing impact samples of simulated weld heat-affected-zone material of ASTM A212B s tee l is scheduled for insertion in July 1963.
ID. R. Harries, R. W. Nichols, and C. Judge, “The Effect of Neutron Irradiation on the Ductile-Brittle Transit ion Temperature of S tee ls and I t s Relevance to Reactor Pressure Vesse ls ,” p 297 in S t e e l s for Reactor Pressure Circui t s , Special Report No. 69, Iron and Steel Insti tute, London, 1961.
’H. M. Finniston, “Metallurgical Aspects,” p 545 in Nuclear Reactor Containment Buildings and Pressure V e s s e l s , Butterworths, London, 1960.
3R. G. Berggren, “Neutron Irradiation Effects in Steels: Studies a t Oak Ridge National Laboratory,” p 370 in S t e e l s /or Reactor Pressure Circui ts , Special Report No. 69, Iron and Stee l Insti tute, London, 1961.
These samples will be irradiated a t 550°F (288T) in order to supplement previous resul ts4 on samples irradiated a t 120°F (49%).
An objectionable feature of surveillance tests a s a means of monitoring the condition of reactor pressure vessels is the fact that the surveillance samples do not duplicate the s t ress conditions under which the pressure vessel is exposed. In order to investigate the effect on pressure-vessel s tee ls of simultaneous exposure to radiation and s t ress , a stress-rupture experiment containing tube-burst samples of ASTM A212B s tee l was inserted in the ORR in May 1963. In-pile stress- rupture tests, in which the t ime to rupture of pres- surized tubes is observed a s a function of s t ress and temperature, have been described previously, but most of the previous work has been done on high-temperature cladding materials.
A t the request of the High Flux Isotope Reactor Project, a study was made of the effect of irradia- tion on the tensile properties of commercial type 330 and type 270 nickel alloys. Sheet tensile samples were irradiated for about 14 weeks in a partial fuel element in the ORR a t a temperature below 100%. The postirradiation tensile tests on the type 330 mater ia l have been completed. A s is described below, the irradiation w a s found to induce a yield point, to increase the yield strength, and to decrease the uniform elongation prior to necking.
In order to better understand flow and fracture in irradiated ferritic s tee ls , an investigation is under way of the effect of irradiation on plastic deformation in iron and iron-base alloys. In col- laboration with the Battelle Memorial Institute, Geneva, an experiment containing 45 tensile
4R. G. Berggren et al.. Solid State Diu. Ann. Progr.
5W. E. Brundage e t al.. Solid State Diu. Ann. Progr.
Rept. Aug. 31, 1961, ORNL-3213, pp 39-42.
Rept. Aug. 31, 1962. ORNL-3364, pp 138-47.
.a
117

118
samples of Armco iron of various grain s izes was inserted in the ORR. The experiment capsule a l so contains electron-microscope samples and neutron- dosimetry samples. Another experiment containing tensile samples of Ferrovac E iron, vacuum-melted 1020 steel, and ASTM A212B s tee l is planned.
The effects of radiation on the mechanical properties of alloys may be separated into two parts: those related to the introduction of defects per se and those associated with the enhancement of atomic rearrangements produced by the motion of the radiation-produced defects. In the latter c lass of effects, the possibility of radiation- enhanced precipitation is particularly important in the case of s tee ls and other structural alloys. Low-cycle internal friction is a property widely used for the detection of precipitation of carbides and nitrides in alpha iron. The techniqhes for the in-pile measurement of this type of internal friction are being developed, and preliminary measurements of an iron-nitrogen alloy during irradiation are de- scribed below. Postirradiation measurements have already indicatedG that the precipitation reaction in alpha iron is accelerated by irradiation. The ability to follow the course of the precipitation reaction during irradiation should be of great value in future work in this area.
Radiation-enhancement is observed for other types of diffusion-controlled reactions a s well a s for precipitation. Previous has indicated that the irradiation of Cu-Ni alloys stimulates the formation of solute-rich clusters. The presumption is that the clustering consti tutes the elimination of a metastable a tomic arrangement imposed, in the absence of irradiation, by low atomic mo- bilities. The clustering phenomenon in Cu-Ni alloys has a lso been studied in connection with quenching treatments.’ This work indicated that interstitial migration may play a part in the dif- fusion process. This possibility is being further
6H. Wagenblast and A. C. Damask, 1. Phys. Chem. Sol ids 23, 221 (1962).
’F. M. Ryan E. W. Pugh, and R. Smoluchowski, Phys. Rev. 1 16, 1 l O d (1959).
8A. Ascoli, “Neutron-Bombardment-Enhanced Segre- gation in Cu-Ni Alloys,” p 105 in Radiation Damage in Solids, vol 11, International Atomic Energy Agency, Vienna, 1962.
9M. S. Wechsler et al., Solid State Diu. Ann. Progr. Rept. Aug. 31, 1959. ORNL-2829, p 120.
‘OW. SchGle and H.-P. Kehrer, 2. Metallk. 52, 168 (1961).
explored in the experiments described below on irradiated and cold-worked Cu-Ni alloys.
Still another type of atomic rearrangement in alloys that is accelerated by irradiation is the ordering reaction. The enhancement of short-range order on irradiation has been studied rather ex- tensively in the in Cu-A1 alloys, and one phase of this work has continued during the preceding year. This relates to the flux and temperature dependence of the ‘second-run phe- nomenon,” in which a sample exhibits a con- siderably reduced reaction rate after having been irradiated and given a thermal cycling treatment to recover original properties. A s the discussion given below points out, these results are being interpreted in terms of a theory of radiation- enhanced diffusion, which involves the solution of rate equations governing the concentrations of vacancies and interstitials. In order to en- compass the case presented by the second-run phenomenon, numerical solutions to the rate equations are required. Therefore, a computer program is being set up.
A knowledge of the dependence of radiation- enhanced reactions on neutron flux (or dose rate) has a bearing on the mechanism of the phenomenon. In addition, the dependence on instantaneous flux may be important in connection with the use of structural materials in reactor environments. This comes about because the accelerated-irradiation tes t s , on which the design of reactor components is based, are performed a t high fluxes for relatively short periods whereas the pressure vessel of a re- actor is exposed a t low fluxes for long periods of t ime. However, owing to the disparity in the ma- terials and properties studied, it is recognized that the previous results on radiation-enhanced diffusion in Cu-A1 alloys offer only a suggestion a s to what might be expected to be important factors in the embrittlement of pressure-vessel s teels .
In the coming year, increased emphasis will be placed on experiments dealing with irradiation effects in iron and iron-base alloys. A suitable
I’M. S. Wechsler and R. H. Kernohan, 1. Phys. Chem. Solids 7, 307 (1958).
R. H. Kernohan and M. S. Wechsler, J . Phys. Chem. 1 L
Solids 18, 175 (1961).
I3M. S. Wechsler and R. H. Kernohan, “The Effect of Radiation on Diffusion-Controlled Reactions in Copper- Base Alloys,” p 81 in Radiation Damage in Solids, vol 11, International Atomic Energy Agency, Vienna, 1962.

117
system for study s e e m s to be the iron-silicon alloys. Iron-silicon is known to undergo an order- disorder transformation l 4 at compositions where brittleness develops. Also, iron-silicon exhibits a decrease in magnetic permeability after demag- netization, which has been used previously to study the diffusion of vacancies upon neutron irradiation. Finally, dislocation mobility" and crack propagation17 may be determined in iron- silicon by means of etch-pitting techniques.
It is a l so anticipated that work a t the Bulk Shielding Reactor will be started in the coming year. A neutron converter facility for alloy irra- diations is being designed for the BSR. This will permit irradiations to be carried out in a fission neutron spectrum. It will a l s o be possible to irradiate in highly thermalized flux so that the separate effects of neutron collision damage and (n , y ) damage may be determined.
RADIATION EMBRITTLEMENT OF REACTOR PR ESSU R E VESSELS
M. S. Wechsler R. G. Berggren
The essent ia l features of the phenomenon of low- temperature brittleness are described, including a discussion of several impact tests on the basis of which a steel's capability for low-temperature service may be evaluated. Furthermore, a review is given of the effect of neutron irradiation on the yielding and fracture properties of pressure-vessel s teels . Finally, the fundamentals of radiation damage are outlined, by means of which the dis- placement production rate may be calculated on the bas i s of the neutron spectrum at a particular point in the reactor. Also, the possible irnpor- tance of dose-rate effects and (n , y ) damage to pressure-vessel embrittlement is discussed.
I4F. W. Glaser and W. Ivanick, Trans. AIME 206, 1290 (1956).
"H.-D. Dietze and E. Balthesen, Nukleonik 3, 8 (1961).
I6D. F. Stein and J. R. Low, Jr., J. Appl. Phys . 31, 362 (1960).
I7A. S. Tetelman and W. D. Robertson, Acta Met. 11, 415 (1963).
18Abstract of published paper: Nucl. Safety 41). 42 (1962).
TENSILE PROPERTIES OF IRRADIATED TYPE 330 NICKEL ALLOY
R. G. Berggren W. J . Stelzman T. N. Jones
This study was initiated at the request of the High Flux Isotope Reactor Project in connection with the possible use of nickel as a control-rod material. Due to the paucity of information on the effect of radiation on the mechanical properties of nickel, it was decided to conduct an experiment in the Oak Ridge Research Reactor to obtain the necessary engineering information.
In this study, commercial type 330 and type 270 nickel sheet were used. The measurements to date refer only to the type 330 alloy. The as- received stock was from'two heats (N6906A1 and N9185A1) and was in the cold-rolled condition, 9 to v2 hard temper. This condition approximated 4 the anticipated condition of the HFIR control-rod material. The chemical compositions of the two heats are given in Table 15.1. The principal composition difference is in the carbon content, 0.03% for one heat and 0.15% for the other heat. Sheet tensile samples (Vl6 in. thick, 0.180 in. wide at the test section) of the following types were prepared from the t-in.-thick sheet:
1. Base-plate samples, smooth and notched. (n) As received. ( b ) Cold worked to an additional 75% reduction; only heat N9185A1.
2. Weldment samples, smooth and notched. Plates of one heat were butt-welded to plates of the other heat using nickel filler metal ; the samples were machined from weldments with the weld metal at the center of the gage length.
3. Heat-affected-zone samples, notched.
Metallurgical examination has been carried out on base-plate samples in the as-received and cold-worked conditions [l(n) and l (b) above]. The as-received material from both heats exhibited an ASTM grain s ize of 4 with equiaxed grains. Also, it was found by sectioning that the machining of the samples apparently produced a cold-worked layer to a depth of about 0.002 in. The base-plate samples that were given an additional 75% cold reduction revealed a cold-worked structure con- taining bands of recrystallized material. The weldment and heat-affected-zone samples have not yet been metallographically examined.
The specimens were mounted in subassemblies a s shown in Fig. 15.1. Parts A and €3 held the

120
Table 15.1. Percentage Chemical Composition of Type 330 Nickela
Heat No. c Mn Fe S Si c u Ti M% c o B
N6906A1 0.03 0.20 0.03 0.002 0.01 0.01 0.003 0.078 0.064 0.001
N9185A1 0.15 0.20 0.05 0.002 0.02 0.01 0.003 0.074 0.045 0.001
uSulfur, cobalt, and boron are check analyses; al l others are ladle analyses.
. - 1
Fig. 15.1. Nickel Specimen Mounting for Irradiation in ORR, C-7 Facility.
subassemblies together, and the spacer wires C, ensured a water gap of 0.30 in. between the samples D. A partially assembled subassembly is shown in E and a completed subassembly in F. Nickel wires, spot-welded across the ends of the samples, served as neutron-flux monitors and en- sured a water gap between subassemblies as shown in G. Six subassemblies were loaded in an alu- minum holder that was inserted (see Fig. 15.2) in a partial fuel element in the C-7 position of the Oak Ridge Research Reactor for about 14 weeks.
*
The specimens were in contact with the reactor coolant water. The temperature of the samples was not measured directly, but heat-transfer cal- culations indicated a maximum temperature of 100%.
The fastneutron exposure was estimated from the activity of induced C058 in the nickel wires removed from each subassembly. The calculation of fast-neutron fluxes from the C058 activities re- quires a correction for burnup of Co58 due to thermal-neutron capture. The vertical distribution
.r
.

121
.
SPECIMEN HOLDER,
UNCLASSIFIED ORNL-DWG 63-703
,14 FUEL PL
,SPECIMEN BUNDLE
ATES
Fig. 15.2. Schematic of Arrangement for Exposure of
Nickel Specimens in O R R , C-7 Faci l i ty .
of thermal-neutron flux in this facility was ob- tained from m e a ~ u r e m e n t s ~ ~ in the “operating core with experiments” and normalized to the thermal- neutron flux determined by a C ~ ’ ~ ( n , y ) C o ~ ’ monitor
in this experiment. The thermal-neutron flux and the exposure t ime were used to obtain a correction factor R for the Ni58(n,p)Co58 monitors in this ex- periment. The published values2’ of R did not extend to the exposure times of this experiment; therefore, the published values were extrapolated, checked with an independent calculation, and found to be in agreement. The fast-neutron fluxes (above 2.9 MeV) were calculated using the equation
A R 1$(>2.9 MeV) = c~~~
- A t ) ’ NNi580eff ( ’ - e
where
A = the C o s 8 activity per g of nickel a t c058 reactor shutdown,
N = t h e number of N i 5 8 atoms per g of N i 5 8 nickel,
oerf = the effective cross section,21 390 mb, of the N i ” ( n , p ) C ~ ’ ~ reaction for an effective threshold energy of 2.9 M e V ,
h = the decay constant of C O ’ ~ ,
t = the exposure t ime,
R = the correction factor for burnup of C O ’ ~ , a function of thermal-neutron flux and exposure time. 2 0
The fluxes of neutrons above 2.9 Mev in this ex- periment were 3.1 to 4.5 x lOI3 neutrons sec-I. The doses of neutrons above 2.9 Mev were 2.5 to 3.6 x lo2’ neutrons/cm2. For a fission spectrum, the corresponding dose of neutrons above 1 Mev is 7.8 to 11.3 x lo2’ neutrons/cm .
The tensile tests were conducted on the remote- control Instron tensile machine in the hot cells. All the tests were done a t room temperature, and strains were measured with a specially designed extensometer, with a sensitivity of 0.01% strain. The complete extensometer system was calibrated a t least once per day to an accuracy of 0.01%
2
19C. D. Cagle and R. A. Costner, Jr., Initial P o s t Neutron Measurements in the ORR, ORNL-2559, pp 35-36 (May 28, 1959).
2oC. H. Hogg, L. D. Weber, and C. E. Yates, Thermal Neutron C r o s s Sect ions of the Isomers and the E / / e c t on F a s t Neutron Flux Measurements Using Nicke l , IDO-16744 (June 18, 1962).
21T. 0. P a s s e l l and R. L. Heath, Nucl. Sei. Eng. 10, 308 (1961).
c

122
strain. Strain rates in the tests on smooth speci- mens were O.O27/min.
The results of the tensile tests are summarized in Table 15.2. With but one exception (lines 11 and 13), the yield strength was a t least doubled a s a result of the irradiation. Table 15.2 also shows that the total elongations were decreased. However, a l l specimens deformed plastically before fracture. Furthermore, the as-irradiated values of yield strength were approximately the same for the samples in the as-received condition (line 8, Table 15.2) a s for those given an additional 75% cold reduction (line 13). Thus it appears that a t the high exposure level for this experiment, the properties of the irradiated samples were not de- pendent on prior cold work.
Figure 15.3 shows typical load-elongation and true-stress-true-strain curves for unirradiated and irradiated smooth samples. A s is typical for face- centered cubic metals, the unirradiated samples did not exhibit a yield point. However, a l l irra- diated samples showed a yield point. The onset of necking (localized plastic instability) was ob- served visually a t the points on the stress-strain curve indicated in Fig. 15.3. It is interesting that, for the irradiated samples, necking did not occur a t the maximum load (in this case , a t the yield
330
400
80
n a 9
point) but after some further plastic deformation had taken place.
The work-hardening characterist ics may be ana- lyzed for the smooth specimens in terms of the equation a = K e n , where a is true s t ress , K is a constant, E is true strain, and n is the work- hardening exponent. Values of n and K may be obtained from a plot of In a v s In E. Typical plots for the two heats are shown in Fig. 15.4. The un- irradiated specimens indicated a low, but positive, value of n (about 0.07) up to E = 0.02 to 0.03. This was followed by a region of higher work- hardening exponent (about 0.3). On the other hand, the irradiated samples exhibited zero or slightly negative slopes on the In a-In E plots up to about E = 0.03. This behavior is somewhat similar to “Luders strain” in mild steel. A t higher strains (up to E = 0.08), two specimens having yield strengths of about 100,000 psi exhibited a small, positive slope.
The notched specimens were included to deter- mine whether a tendency exis ts toward an irradiation-induced notch sensitivity. The sheet specimens (t in. wide) were notched on each s ide to one-third of the width. Also, the radius of curvature a t the root was less than 0.001 in. and the included angle was 45O, thus producing a
UNCLASSIFIED ORNL-LR-DWG 79019R
II I I N-FIRST VISUAL INDICATION OF NECKING 1 I I 20
0 0 0.05 0.10 0.45 0.20 0.25 0.30 0.35
ELONGATION OR STRAIN (in./in,)
Fig. 15.3. Typical Load-Elongation and True-Stress-True-Strain Curves of Unirradiated and
Nickel, Heat N6906A1 (Smooth Base-Plate Samples).
Irradiated Type

123
Table 15.2. Tensile Properties of Irradiated Type 330 Nickel
Ultimate Yield Tensile Total Number
(Psi) (psi) (%I T e s t s
Heat Specimen Irradiation FluxC Line Number Conditiona Typeb [neutrons/cm2 (> 1 Mev)] Strength Strength O f
1
2
3
4
5
6
7
8
9
10
11
12
13
14
15
16
17
18
19
20
21
22
23
N6906A1 As received
N6906A1 As received
N6906A1 As received
N6906A1 As received
N6906A1 A s received
N6906A1 A s received
N9185A1 As received
N9185A1 As received
N9185A1 A s received
N9185A1 A s received
N9185A1 Cold worked
N9185A1 Cold worked
N9185A1 Cold worked
N9185A1 Cold worked
N9185A1 Cold worked
Weld-metal specimens
Weld-metals specimens
Weld-metal specimens
Weld-metal specimens
N6906A1 Heat-affected zone
NG906A1 Heat-affected zone
N9185A1 Heat-affected zone
N9185A1 Heat-affected zone
S
S
S
S
N
N
S
s N
N
S
S
S
N
N
S
s N
N f
Ng
Ng
Ng
Ng
x 1 O 2 O
None
7.8
9.0
11.3
None
7.8
None
11.3
None
11.3
None
None
7.8
None
7.8
None
9.0
None
11.3
None
9.0
None
9.0
, 45,800
95,600
98,600
101,300
52,500
10 8,600
67,200
145,000
80,000
163,000
80,500
45,500
146,000
53,200
149,000
37,300
98,000
49,600
118,000
<40,000
104,000
43,000
118,000
63,400
e
e
e
66,500
e .
87,500
e
97,400
e
82,300
84,100
e
84,100
e
61,800
e
84,700
129,800
63,000
e
' 82,000
e
36 5
10 1
11 4
8 1
2
2
34 2
5 5
2
2
8 1
29 2
3 4
2
2
30 2
7 5
2
2
1
1
1
1
- 1 aAs-received condition is cold rolled 9 to / hard temper; cold worked condition is cold rolled an additional 75%;
heat-affected-zone condition i s the heat-affected zone of a weldment; and weld-metal specimens contain base p la te of both hea ts and weld metal.
' 4 2
bS indicates smooth shee t tensile specimens, and N indicates deep-edgenotched specimens. CBased on the Ni '0.2% offset yield strength for all unirradiated samples and samples corresponding to l ines 19, 21, and 23. Upper
yield point for all others. eMaximum load was the yield-point load. /Notched in weld metal. gNotched in heat-affected zone of indicated heat.
58 ( n , p ) C ~ ~ ~ reaction, assuming Oeff = 390 mb, E e f f = 2.9 MeV, and fission spectrum.

124
Fig. 15.4. Typical Log-True-Stress-Log-True-Plostic-Strain Curves of Unirradioted and Irradiated Type 330 Nickel (Smooth Base-Plate Samples).
large notch effect in this s ize specimen. A s the results in Table 15.2 indicate, the notched samples exhibited slightly higher strength values than the corresponding smooth specimens, presumably due to the restraints introduced by me ta l on each s ide of the notch. Since considerable necking was ob- served a t the notch prior to fracture in irradiated as well as unirradiated samples, it is concluded that the irradiation did not produce an enhancement of notch sensitivity.
A s regards the heat-affected-zone material, only notched samples were used, with the apex of the I
notch in the heat-affected zone to ensure deforma- tion in this region. The yield and ultimate tensile strengths of the unirradiated heat-affected-zone samples were lower than those for the correspond- ing notched samples of the base material. This probably was the resul t of annealing during the welding process. Furthermore, on irradiation the increases in yield strength were approximately the same for the heat-affected-zone and the base- plate materials.
The weldment samples were of smooth and notched types. In addition to the weld metal, the gage length of the smooth weldment samples con- tained base-plate and heat-affected-zone material of both heats. For these samples it was found that fracture did not occur in the weld metal. No
unusual behavior was observed in the notched weld specimens.
The type 270 nickel samples have been irra- diated, but the tensile tests have not yet been carried out.
EFFECTOF NEUTRON BOMBARDMENTONTHE STRESS-RUPTURE PROPERTIES OF SOME
/ STRUCTURAL ALLOYS22
N. E. Hinkle
Stress -rupture experiments are being perf ormed in the Oak Ridge Research Reactor to study the effect \ of neutron bombardment on the rupture strength and deformation characterist ics of s t ressed tubular specimens a t controlled elevated tempera- tures in oxidizing or inert-gas environments. The materials being investigated are Inconel alloy 600, type 304 stainless s tee l , Zircaloy-2, and a Nb-1% Zr alloy. The rupture strength of Inconel alloy 600 at 1 5 0 0 T is decreased a s much as 25% during irradiation. Smaller losses of rupture
22Abstract of paper presented at the ASTM Symposium on Radiat ion E / / e c t s on Metals and Neutron Dosimetry, L0.s Ange les , Oct . 1-5. 1962. ASTM-STP-341, p 344 (1963).

. 125
strength are observed for type 304 stainless steel a t 1300 to 15006F and for the Nb-1% Zr alloy a t 18OOOF. No major change is observed for Zircaloy-2 a t 700 or 900OF. For the Inconel and stainless steel alloys the deformation at rupture is generally lowered; metallographic evidence indicates that these premature ruptures occur because of lowered grain-boundary cohesion.
IN-PILE STRESS-RUPTURE EXPERIMENTS
W. E. Brundage
The design of high-temperature power reactors and their components requires information on the mechanical properties of materials a t elevated temperatures while under the influence of reactor environment. A series of tes t s of several alloys have been performed in the ORR. Tubular speci- mens , internally pressurized to the desired tan- gential stress level, were maintained a t a selected temperature until rupture occurred, a s indicated by a leakage of the pressurizing gas. The t imes to rupture were compared with those for similar con- trol specimens tested out of pile. The results of these tests have been previously r e p ~ r t e d . ~ ~ * ~ *
Z irca toy-2
One additional group of Zircaloy-2 specimens was tested in the P-6 facility of the ORR in an
attempt to extend to longer times the previously reported stress-rupture curves for specimens a t 700 and 900OF. The ruptures occurred sooner than expected. At 700OF the specimens failed in the reactor a t s t resses about 15% lower than those required for rupture of the control specimens in the same times. Also, the specimens irradiated a t 900T failed a t s t r e s ses over 30% lower than those for the control specimens. In contrast, the previous tests indicated little or no effect of re- actor irradiation on the stress-rupture properties.
The departure from the predicted t i m e s could not be explained by variations in either specimen histories or operating procedures. Post tes t ex- amination indicated types of failures similar to those observed for previous irradiated samples. The failures a l l occurred in localized areas; blisters which extended about one-third the gage length and one-half the diameter were formed, a s shown in Fig. 15.5.
The spec imens for the Zircaloy-2 tests con- tained a water-cooled finger, a s shown in Fig. 15.6, to remove the gamma heat from the specimen. Three furnace sections around each specimen
23W. E. Brundage e t al.. Solid Stale Diu. Ann. Progr. Rept . Aug. 31, 1962. ORNL-3364, pp 138-47.
2%J. E. Hinkle, "Effect of Neutron Bombardment on Stress Rupture Properties of Some Structural Alloys," p 324 in Symposium on Radiat ion E f f e c t s on Metals and Neutron Dosimetry, ASTM, Los Angeles . O c f . 1-5, 1962, ASTM-STP-341 (1963).
Fig. 15.5. Appearance of Typical Failures of Irradiated Zircaloy-2 Specimens.
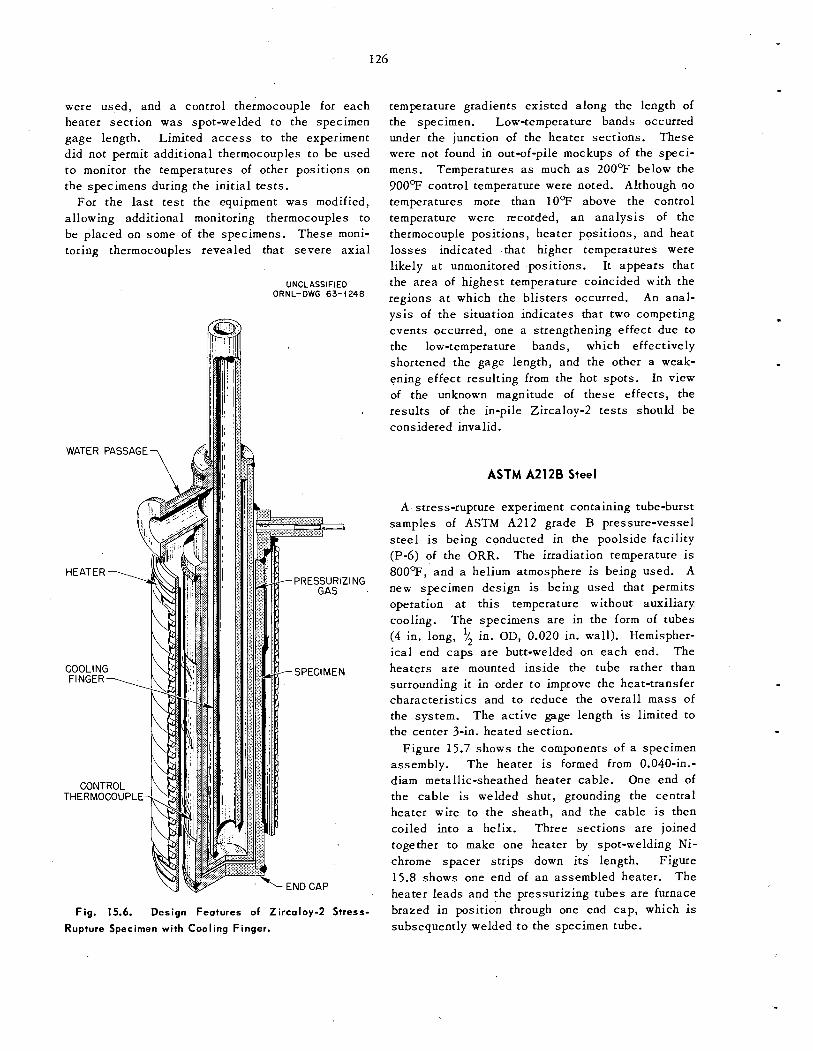
126
were us,ed, and a control thermocouple for each heater section was spot-welded to the specimen gage length. Limited access to the experiment did not permit additional thermocouples to be used to monitor the temperatures of other positions on the specimens during the initial tests.
For the las t test the equipment was modified, allowing additional monitoring thermocouples to be placed on some of the specimens. These moni- toring thermocouples revealed that severe axial
WATER PASSAGE
COOLING
THERMOCOUPLE
UNCLASSIFIED ORNL-DWG 63-1248
GAS
SPECIMEN
:ING
Fig. 15.6. Design Features of Zircaloy-2 Stress-
Rupture Specimen with Cooling Finger.
temperature gradients existed along the length of the specimen. Low-temperature bands occurred under the junction of the heater sections. These were not found in out-of-pile mockups of the speci- mens. Temperatures a s much as 2 0 0 T below the 900°F control temperature were noted. Although no temperatures more than 10°F above the control temperature were recorded, an analysis of the thermocouple positions, heater positions, and heat losses indicated that higher temperatures were likely at unmonitored positions. It appears that the area of highest temperature coincided with the regions at which the blisters occurred. An anal- ysis of the situation indicates that two competing events occurred, one a strengthening effect due to the low-temperature bands, which effectively shortened the gage length, and the other a weak- ening effect resulting from the hot spots. In view of the unknown magnitude of these effects, the results of the in-pile Zircaloy-2 tests should be considered invalid.
ASTM A212B Steel
A stress-rupture experiment containing tube-burst samples of ASTM A212 grade B pressure-vessel steel is being conducted in the poolside facility (P-6) of the ORR. The irradiation temperature is 800"F, and a helium atmosphere is being used. A new specimen design is being used that permits operation at this temperature without auxiliary cooling. The specimens are in the form of tubes (4 in. long, q2 in. OD, 0.020 in. wall). Hemispher- ical end caps are butt-welded on each end. The heaters are mounted inside the tube rather than surrounding it in order to improve the heat-transfer characterist ics and to reduce the overall mass of the system. The active gage length is limited to the center 3-in. heated section.
Figure 15.7 shows the components of a specimen assembly. The heater is formed from 0.040-in.- diam metallic-sheathed heater cable. One end of the cable is welded shut, grounding the central heater wire to the sheath, and the cable is then coiled into a helix. Three sections are joined together to make one heater by spot-welding Ni- chrome spacer strips down its length. Figure 15.8 shows one end of an assembled heater. The heater leads and the pressurizing tubes are furnace brazed in position through one end cap, which is subsequently welded to the specimen tube.
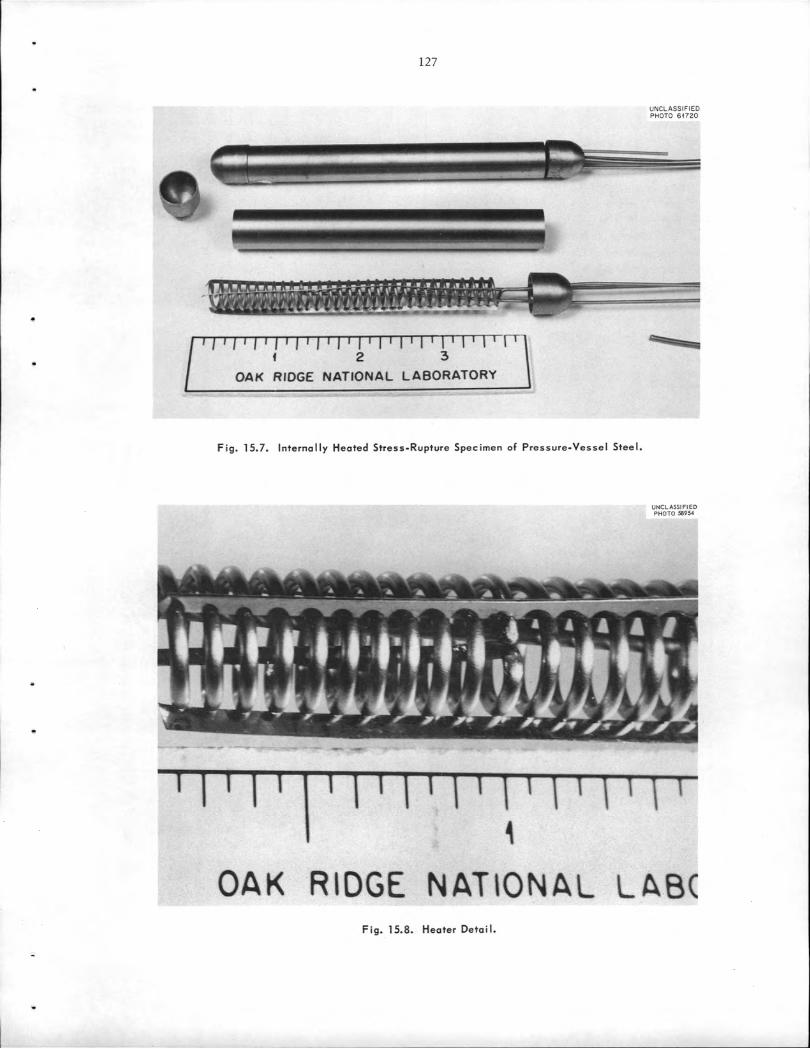
. 127
.-
Fig. 15.7. Internally Heated Stress-Rupture Specimen of Pressure-Vessel Steel.
Fig. 15.8. Heater Detail.
.

- 128
Figure 15.9 shows a partially finished assembly of specimens prepared for insertion into the re- actor. The specimens are positioned in recesses machined in an aluminum block. Control thermo- couples are shown attached to the samples. Moni- toring thermocouples and heater leads remain to be attached. In the final assembly the leads in the upper portion of the figure are enclosed in an aluminum box, and the unit is sealed by welding.
Operating experience to date has indicated sat- isfactory temperature control at 8009. Also, no large temperature gradients appear to exist , a s is shown by the ' f ac t that the maximum temperature differential monitored on the specimen gage length was 169; with a l l control thermocouples maintained a t 8 0 0 9 .
Thermocouple access to the internally heated specimen is much easier than that for specimens previously used. In addition, this type of speci- men has the advantage that it permits a more compact assembly.
IRRADIATION EFFECTS ON THE MECHANICAL PROPERTIES OF IRON AND IRON-BASE ALLOYS
N. E. Hinkle
The effect of neutron irradiation on the deforma- tion characteristics of pressure-vessel steels has been the subject of extensive engineering s tudies s ince early in the nuclear energy program. These
UNCLASSIFIED PHOTO 61248
Fig. 15.9. Stress-Rupture Experiment Assembly for ORR, Pressure-Vessel Steel, Part ia l ly Assembled.

129
studies were necessary to determine whether the material’s ability to deform on sudden loading without catastrophic failure is decreased due to the neutron bombardment. Recent reviews 5-27 have summarized the experimental results. The effect of neutron irradiation on steels is to in- crease the yield s t ress and ultimate tensile s t ress and to decrease the uniform elongation. Furthermore, the notch-impact brittle-ductile transition temperature is increased. Also, it has been found that, when the irradiation temperature is sufficiently high, the effects become less severe. As concerns the dependence on integrated flux or dose, earlier work2’ indicated that the increases in yield s t ress and the impact tran- sition temperature vary a s the cube root of the dose. However, more recently a square-root de- pendence has been suggested.29 In addition, the effect of postirradiation annealing has been in- vestigated. It is found that the original properties may be partially recovered, although in certain c a s e s a reembrittlement is observed. 30 Also, the effectiveness of the postirradiation annealing treatment depends on the original irradiation tem- ~ e r a t u r e . ~ ’
The analysis of irradiation effects on mechanical properties in terms of basic processes has de- pended to a large extent on the use of the Cottrell-
.
25L. F. Porter, *‘Radiation Effects in Steel,” p 147 in Materials in Nuclear Applications. ASTM-STP-276, American Society for Testing and Materials, Phila- delphia, 1960.
26F. R. Shober, The Ef fect of Nuclear Radiation on Structural Metals, REIC-20 (Sept. 15, 1961).
27M. S. Wechsler and R. G. Berggren, Nucl. Sa/ety 411, 42 (1962).
28A. H. Cottrell, “Theoretical Aspec ts of Radiation Damage and Brittle Fracture in S tee l Pressure Vessels,” p 281 in Sieels for Reactor Pressure Circuits, Special Report No. 69, Iron and Steel Insti tute, London, 1961.
29R. W. Nichols and D. R. Harries, “Brittle Fracture and Irradiation Effects in Ferri t ic Pressure Vessel Steels,” in Symposium on Radiation E f f ec t s on Metals and Neutron Dosimetry, ASTM, Los Angeles. Oct. 1-5. 1962. ASTM-STP-341 (1963).
30W. S. Pell ini , L. E. Steele, and J. R. Hawthorne, Analys i s of Engineering and Bas ic Research A s p e c t s of Neutron Embrittlemeni of Steels , NRL-5780 (Apr. 17, 1962).
31J. R. Hawthorne, “Studies of Radiation Effects and Recovery of Notch Ductility of Pressure-Vessel Steels,” p 343 in Steels for Reactor Pressure Circuits, Special Report No. 69, Iron and Steel Insti tute, London, 1961.
Petch equation32 * 3 3
= cro + k y d - ’ ’ 2 , OY s
where oo is the lattice friction s t ress , k , is a factor proportional to the s t ress necessary to unpin a dislocation from its locking atmosphere, and d is one-half the grain diameter. Hull and Mogford,34 using a British En-2 steel, found that Eq. (1) was obeyed for irradiated as well a s for unirradiated samples. For doses up to 9 x lOI9 (>1 MeV) neutrons/cm2, was found to increase, but no change in k , was noted.34 For iron,35
irradiated to 3 x 10“ neutrons/cm2, they observed a small increase in c0 but, again, no change in
k , . Campbell and Harding3‘ and Chow et ~ 1 . ~ ~ a l s o found that u0 for iron increases on irradiation, but they observed a decrease in k , a t doses of 2 to 5 x 10” neutrons/cm2. The reason for the decrease in k , on irradiation is difficult to un- derstand, since the decrease would imply less atmosphere locking. A factor that may be involved in this effect is the tendency toward subcell forma- tion, such that the subcell s ize functions in the same manner a s the grain s ize d in Eq. (1). Another point to be mentioned is the possible effect of the different heat treatments used to produce the dif- ferent grain s izes . However, no firm explanation of the discrepancies among the previous results is available.
Based on the background information briefly sum- marized above, the following areas have been singled out as being of special interest in the present investigations :
1. The effect of irradiation on the parameters oo and k , in Eq. (1).
32N. J . Pe tch , J . lron Steel Inst. (London) 173, 25 (1953).
33A. H. Cottrell, Trans. Met. Soc. AIME 212, 192 (1958).
34D. Hull and I. L. Mogford, Phil. M a g . 3, 1213 (1958). - - ”I. L. Mogford and D. Hull, J . Iron Steel Inst.
(London) 201, 55 (1963).
36D. B. Campbell and J . Harding, “The Effect of Grain Size, Rate of Strain, and Neutron Irradiation on the Tens i le Strength of &Iron,” p 51 in Response of Metals to High-Velocity Deformation, Interscience, New York, 1961.
37J. G. Y. Chow, S. B. McPickard, and D. H. Gurinsky, “The Mechanical Properties of Irradiated Iron and Iron Alloys,” in Symposium on Radiation E f f ec t s on Metals and Neutron Dosimetry, ASTM, L o s Angeles. Oct. 1-5. 1962, ASTM-STP-341, 1963.

130
2. The effect of varying the irradiation tempera- ture. For some s tee ls ,38 it has been observed that the irradiation-produced changes in mechan- ical properties increase a t first with increasing irradiation temperature. This observation sug- ges t s that in some cases the change in proper- ties is due to atomic rearrangements that pro- ceed more quickly a t the higher irradiation temperature.
3. The effect of dose rate. Little is known a t present concerning the specific influence of dose rate. However, the factor may be impor- tant where atomic rearrangements are in- v 0 1 v e d . ~ ~ This factor takes on special sig- nificance i n view of the disparity in the dose rates used in experiments on structural ma- terials and the dose rates experienced bypres- sure vessels in service.
4. The effect of (n,y) recoil events. Coltman et aL4’ have shown that measurable changes in
38D. R. Harries, R. W. Nichols, and C. Judge, “The Effect of Neutron Irradiation on the Ductile-Brittle Transition Temperature of Steels and I t s Relevance t o Reactor Pressure Vessels ,” p 297 in S t e e l s /or React07 Pressure Circui ts , Special Report No. 69, Iron and Steel Institute, London, 1961.
39M. S. Wechsler, **Fundamental Aspects of Radiation Effects on Diffusion-Controlled React ions in Alloys,” D 86 in Svmbosium on Radiation E f l e c t s on Metals and . . heutron Dosimetry, ASTM, Los A n g e l e s . Oct . 1-5. 1962. ASTM-STP-341, 1963.
40R. R. Coltman, Jr., e t al., J. Appl. Phys . 33, 3509 (1962).
electrical resistivity are produced by (n,y) damage, which results from atom recoil fol- lowing thermal-neutron absorption and the emission of a capture gamma ray. The im- portance of this damage mechanism has not yet been investigated in connection with me- chanical properties of iron and s tee ls .
The first reactor experiment in this program was installed in the ORR in May 1963 in a piggyback position (Le., a position attached to the back of a poolside experiment). The experiment assembly, shown in Fig. 15.10, contains 45 Armco iron tensile samples of various grain sizes. X-ray and electron- microscope samples are a l so included. The ex- periment is being conducted in collaboration with the Battelle Memorial Institute, Geneva. 4 1 The samples were supplied by BMI, Geneva, although a portion of them will be tested a t ORNL for pur- poses of comparison. The samples are being irradiated in a helium atmosphere a t temperatures between 40 and 60%. Tensile tes t s will be con- ducted following irradiation in order to evaluate the effect of the irradiation on the parameters go
and k, in Eq. (1). A second ORR piggyback assembly is being
designed and will be installed in September or October 1963. This experiment will contain tensile samples of the following materials:
* l W e wish to acknowledge the cooperation of J. Spreadborough and h i s assoc ia tes a t the Bat te l le Memorial Institute, Geneva.
*
.
Fig. 15.10. Experiment Assembly for Armco Iron Irradiation.
“
-

131
1. Ferrovac E, a vacuum-melted iron. This ma- terial will be heat treated to obtain four grain s izes .
2. Ferrovac 1020 steel (0.2% C and 0.5% Mn), a vacuum-melted ternary alloy. This material will be heat treated to obtain four grain s izes .
3. Ferrovac 1020, a vacuum-melted iron-carbon binary alloy (0.2% C).
4. ASTM A212 grade B pressure-vessel ’ steel , commercial heat. This material will be heat treated to obtain three grain s izes . The as - received material will a l so be included.
5. ASTM A212 grade B pressure-vessel s teel , reference heat. This is a welldocumented standard heat supplied to the ASTM by the United States Steel Corporation and is used to correlate the results of different laboratories doing radiation-damage studies on pressure-
. vessel steels.
The samples of each material and each grain s ize will be arranged so that the change in properties may be studied a s a function of the neutron-dose and dose rate. In this and future experiments, samples will be irradiated a t temperatures up to 300%.
A third experiment is being designed for inser- tion in the ORR a t a poolside position adjacent to the core of the reactor. The same materials and temperatures will be used a s in the previous ex- periment, but higher dose rates will be achieved.
In order to determine the possible effect of (n , y ) damage on iron and s tee ls , two approaches will be used. In the first, certain samples wi l l be cadmium-shielded from thermal neutrons. This will reduce the thermal-neutron exposure by two orders of magnitude. The second approach will involve the u s e of a D,O tank in the Bulk Shielding Reactor to produce a highly thermalized neutron flux.
INTERNAL-FRICTION MEASUREMENTS IN I RON -N I T ROG EN A L LOY S
J. T. Stanley
The flexure pendulum apparatus described in an earlier report4’ was used to measure the internal friction of an iron-nitrogen alloy during reactor
J. T. Stanley, Solid Stale Diu. Ann. Progr. Rept. 42
Aug. 31, 1962, ORNL-3364, pp 134-37.
irradiation. The results obtained in this experi- ment showed some features not observed in the absence of irradiation.
The specimen (1% in. long and 3 / 1 6 in. wide) was cut from “Ferrovac E” (0.005-in.-thick) iron foil. The specimen was loaded with 0.02 wt % nitrogen by heating to 590% in an atmosphere of hydrogen and ammonia. One end of this specimen was clamped in the apparatus, and a small vane was attached to the other end. The vane was positioned so that it moved between two capaci- tance plates a s the specimen vibrated. The specimen was made to vibrate by applying a voltage of the proper frequency (33 cps) between the specimen and a driving electrode. The change in capacitance was detected by a bridge circuit, and the resulting signal was displayed on an oscilloscope. Photographs of the oscilloscope screen were made and measured to determine the logarithmic decrement. The irradiation was carried out in Hole 17 of the Oak Ridge Graphite Reactor.
The data obtained in this experiment are pre- sented in Fig. 15.11. The numbered points on the
0.003
z > 0 F 0.002 u n LL
-I
z n w F
a
z - 0.001 0
n
UNCLASSIFIED ORNL-LR-DWG 7751 R
0 20 40 60 00 100 TEST TEMPERATURE (“C)
Fig. 15.11. Internal Friction vs Test Temperature for
Iron-Nitrogen Alloy. In-pile flexure pendulum measure-
ments a t 33 cps. Solid symbols represent measurements
with reactor on; open symbols measurements with reactor
off.

132
curves refer to the sequence of measurements. Curve A in this figure was obtained after about three days of reactor operation. After making the measurements for curve A , Fig. 15.11, the specimen was cooled back to 65% and held a t this tempera- ture for 17 hr. After this t ime, point 4 (curve €3) was measured. The specimen temperature was then raised, and measurements were made along the path indicated by the arrows. After the meas- urement was made a t 95% (point 5), the tempera- ture was reduced a s quickly a s possible to 68%, and the measurement a t point 6 was made. The measurements for points 6 and 7 were taken 38 and 71 min, respectively, after point 5 . After the remaining measurements were taken, for curve B , the specimen was allowed to remain a t 30% for one day and was then heated to 63%. The internal friction a t 63% (point 10) then remained constant a t 0.00167 for 40 hr, a t which t i m e the reactor
/ was shut down. After the reactor was shut down, the internal friction decreased rapidly, a s shown by points 10 and 11 on curve C. The furnace was then allowed to cool, and the measurements in the temperature range 22 to 6% were made.
The temperature of the internal-friction peak observed in these measurements agrees with the temperature of the nitrogen Snoek peak in iron reported by Fast and V e r r i j ~ . ~ ~ The shape of this peak should be given by the equations
r = ro exp ( A H / R T ) ,
where A, is the relaxation strength of the nitrogen Snoek peak (proportional to the amount of nitrogen in solid solution), o is the angular frequency of vibration ( 2 ~ f , f = 33 cps), r is the relaxation time, QiL is the background damping, and AH is the activation energy for a nitrogen-atom jump (18.6 kcal/mole). 4 3
The background damping term Q i ; in the above equation includes al l sources of damping other than the nitrogen Snoek peak damping. Usually the background damping is quite small and con- stant in the temperature region of the nitrogen peak. In out-of-reactor measurements with this specimen, a background damping of 3 x was
4 3 J . D. Fas t and M. B. Verrijp, I,. Iron Steel lns t . 176, 24 (1954).
measured. It is evident that Eq. (1) will not fit the data obtained in the reactor if one assumes that the background damping is not different from the value found in the out-of-reactor measurement. One possible solution to this problem is to assume that the background damping changes during re- actor irradiation. The solid curves shown in Fig. 15.11 were derived on this assumption, but a l so it was assumed that the change in background was s low enough that the background damping re- mained constant for a given s e t of measurements. The results obtained by this analysis are given in Table 15.3.
Table 15.3. Internal Friction Due to Nitrogen
Snoek Peak and Backgrounda
Dose (>0.6 M e V ) ’ 2
(neutrons/cm ) Q2 -1 1
Q, (peak)= /2AM
x l 0 lG x x
Curve A 1.8 13.8 14.5
Curve B 2.4 10.6 10.8
Point 10 10.6 6.1
Curve C 3.9 10.6 3.3
‘Data taken from Fig. 15.11. ‘For curves A and B, the dose values pertain to the
time of measurement a t the peak; for curve C, the dose value signifies the previous irradiation exposure.
An alternative approach is to postulate the ex- istence of other relaxation peaks a t temperatures above and below the temperature of the nitrogen peak. These peaks then overlap with the nitrogen peak to give the observed behavior. Curves show- ing how the in-reactor measuremenrs are analyzed using this assumption are shown in Fig. 15.12. The circles in Fig. 15.12 represent the data points of curve A , Fig. 15.11. The solid curve was ob- tained from Eq. (1) by assuming the same back-
a s that for out-of-reactor measurements and by choosing the relaxation strength A, so that the curve fits the data a t the peak temperature (65%) within experimental error. This curve was then subtracted from the data points (circles) to give the points shown a s tri- angles. The dotted curves then show how the
‘ground damping (3 x
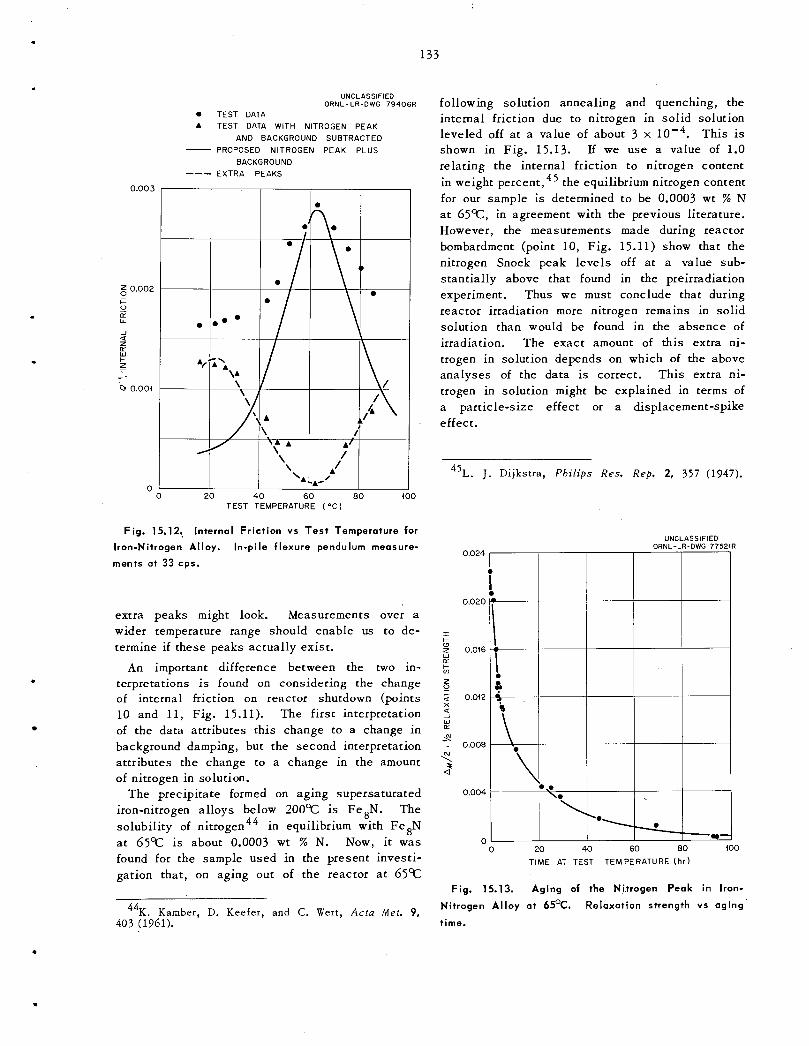
133
.
0.003
= 0002 2 ' 0 k-
Lz LL
a z Lz W k z
0 0.001 -
0 0
UNCLASSIFIED ORNL-LR-DWG 79406R
0 TEST OATA A TEST OATA WITH NITROGEN PEAK
AND BACKGROUND SUBTRACTED - PROPOSED NITROGEN PEAK PLUS
BACKGROUND EXTRA PEAKS ---
20 40 60 80
**K. Kamber, D. Keefer, and C. Wert, Acta Met. 9, 403 (1961).
TEST TEMPERATURE ( O C )
Fig. 15.12.. Internal Friction vs T e s t Temperature for
Iron-Nitrogen Alloy. In-pile flexure pendulum measure-
ments a t 33 cps.
extra peaks might look. Measurements over a wider temperature range should enable us to de- termine if these peaks actually exist.
An important difference between the two in- terpretations is found on considering the change of internal friction on reactor shutdown (points 10 and 11, Fig. 15.11). The first interpretation of the data attributes this change to a change in background damping, but the second interpretation attributes the change to a change in the amount of nitrogen in solution.
The precipitate formed on aging supersaturated iron-nitrogen alloys below 200% is Fe8N. The solubility of nitrogen 4 4 in equilibrium with Fe 8N a t 65°C is about 0.0003 wt % N. Now, it was found for the sample used in the present investi- gation that, on aging out of the reactor at 65T
following solution annealing and quenching, the internal friction due to nitrogen in solid solution leveled off at a value of about 3 x This is shown in Fig. 15.13. If we use a value of 1.0 relating the internal friction to nitrogen content in weight percent, * the equilibrium nitrogen content for our sample is determined to be 0.0003 wt % N a t 6 5 T , in agreement with the previous literature. However, the measurements made during reactor bombardment (point 10, Fig. 15.11) show that the nitrogen Snoek peak levels off at a value sub- stantially above that found in the preirradiation experiment. Thus we must conclude that during reactor irradiation more nitrogen remains in solid solution than would be found in the absence of irradiation. The exact amount of this extra ni- trogen in solution depends on which of the above analyses of the data is correct. This extra ni- trogen in solution might be explained in terms of a particle-size effect or a displacement-spike effect.
45L. J . Dijkstra, Phi l ip s R e s . Rep. 2, 357 (1947) .
0.024
0.020
I + (I)
W
k- ln
z
z 0.016
0
a 5 0.012 X
2 W LT
2 ~ 0.008
z < a
0.004
C D 20 40 60 BO 100
TIME AT TEST TEMPERATURE ( h r )
Fig. 15.13. Aging of the Nitrogen Peak in Iron-
Relaxotion strength vs aging Nitrogen Al loy a t 65OC. time.
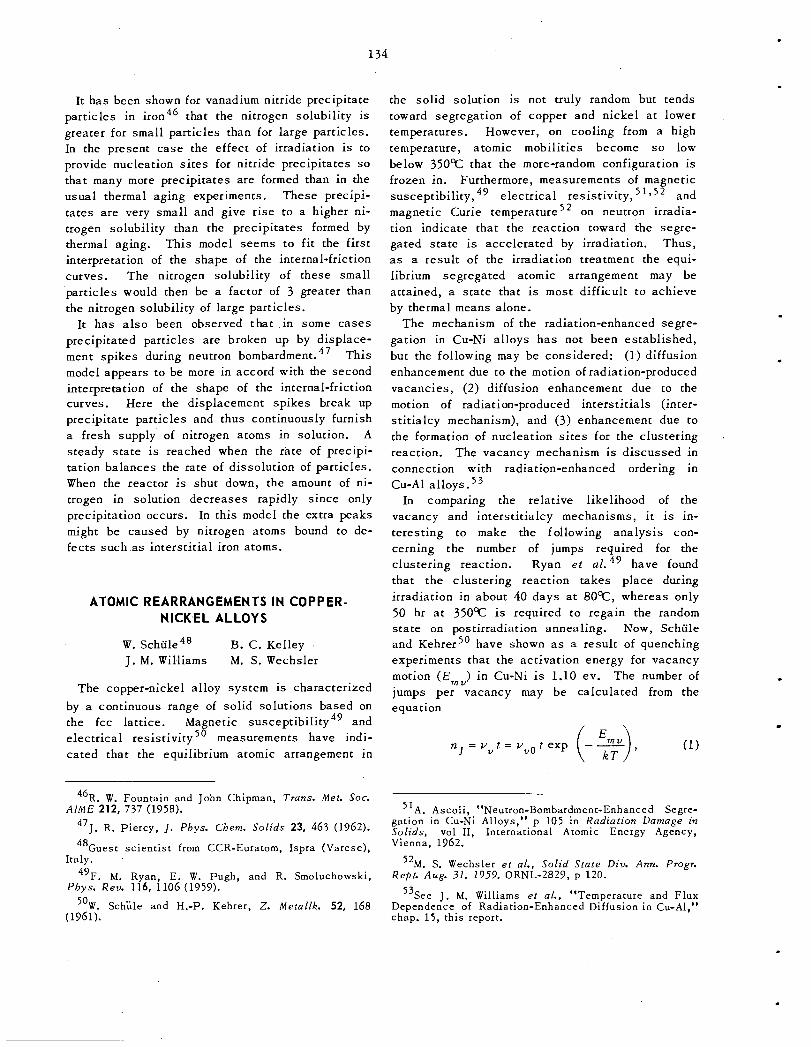
134
It has been shown for vanadium nitride precipitate particles in iron46 that the nitrogen solubility is greater for small particles than for large particles. In the present case the effect of irradiation is to provide nucleation sites for nitride precipitates s o that many more precipitates are formed than in the usual thermal aging experiments. These precipi- tates are very small and give rise to a higher ni- trogen solubility than the precipitates formed by thermal aging. This model s e e m s to f i t the first interpretation of the shape of the internal-friction curves. The nitrogen solubility of these small particles would then be a factor of 3 greater than the nitrogen solubility of large particles.
It has a l so been observed that in some c a s e s precipitated particles are broken up by displace- ment spikes during neutron bombardment. 4 7 This model appears to be more in accord with the second interpretation of the shape of the internal-friction curves. Here the displacement spikes break up precipitate particles and thus continuously furnish a fresh supply’ of nitrogen atoms in solution. A steady s ta te is reached when the rate of precipi- tation balances the rate of dissolution of particles. When the reactor is shut down, the amount of ni- trogen in solution decreases rapidly since only precipitation occurs. In this model the extra peaks might be caused by nitrogen atoms bound to de- fects such as intersti t ial iron atoms.
ATOMIC REARRANGEMENTS IN COPPER- NICKEL ALLOYS
W. S ~ h i i l e ~ ~ B. C. Kelley J. M. Will iams M. S. Wechsler
The copper-nickel alloy system is characterized by a continuous range of solid solutions based on the fcc lattice. Magnetic s ~ s c e p t i b i l i t y ~ ~ and electrical resistivity 50 measurements have indi- cated that the equilibrium atomic arrangement in
46R. W. Fountain and John Chipman, Trans. Met. SOC. AIME 212, 737 (1958).
47J . R. Piercy, J . Phys. Cbem. Solids 23, 463 (1962).
48Guest sc ien t i s t from CCR-Euratom, Ispra (Varese),
49F. M. Ryan, E. W. Pugh, and R. Smoluchowski,
50W. Schule and H.-P. Kehrer, Z . Metallk. 52, 168
Italy.
Phys. Rev. 116, 1106 (1959).
(1961).
the solid solution is not truly random but tends toward segregation of copper and nickel at lower temperatures. However, on cooling from a high temperature, atomic mobilities become so low below 350% that the more-random configuration is frozen in. Furthermore, measurements of magnetic s ~ s c e p t i b i l i t y , ~ ~ electrical resist ivity, 5 1 * 5 2 and magnetic Curie temperature on neutron irradia- tion indicate that the reaction toward the segre- gated s ta te is accelerated by irradiation. Thus, as a result of the irradiation treatment the equi- librium segregated atomic arrangement may be attained, a s ta te that is most difficult to achieve by thermal means alone.
The mechanism of the radiation-enhanced segre- gation in Cu-Ni alloys has not been established, but the following may be considered: (1) diffusion enhancement due to the motion of radiation-produced vacancies, (2) diffusion enhancement due to the motion of radiation-produced intersti t ials (inter- st i t ialcy mechanism), and (3) enhancement due to the formation of nucleation sites for the clustering reaction. The vacancy mechanism is discussed in connection with radiation-enhanced ordering in Cu-A1 alloys.
In comparing the relative likelihood of the vacancy and interstitialcy mechanisms, it is in- teresting to make the following analysis con- cerning the number of jumps required for the clustering reaction. Ryan et a l . 49 have found that the clustering reaction takes place during irradiation in about 40 days a t B O T , whereas only 50 hr at 3 5 0 T is required to regain the random state on postirradiation annealing. Now, Schule and Kehrer” have shown as a result of quenching experiments that the activation energy for vacancy motion ( E m v ) in Cu-Ni is 1.10 ev. The number of jumps per vacancy may be calculated from the equation
n, = v t = v v O t e x p -- ( 9 51A. Ascoli , “Neutron-Bombardment-Enhanced Segre-
gation in Cu-Ni Alloys,” p 105 in Radiation Damage in Solids, vol 11, International Atomic Energy Agency, Vienna, 1962.
52M. S. Wechsler et al.. Solid State Div. Ann. Progr. Rept. Aug. 31, 1959. ORNL-2829, p 120.
53See J . M. Williams et al.. “Temperature and Flux Dependence of Radiation-Enhanced Diffusion in Cu-AI,” chap. 15, th i s report.

. 135
.
.
where vu0 is about 1013/sec and Emu = 1.10 ev. For the formation of the clustered state ( t = 40 days, T = SOT), we find n = 7 x l o 3 jumps per vacancy; whereas for the dissolution of this state ( t = 50 hr, T = 350%), nl = 2 x lo9 jumps per vacancy. Therefore, if the number of atom jumps is the s a m e for the two cases, we conclude that during irradiation the vacancy concentration must be greater than that during postirradiation anneal- ing by a factor between l o 5 and 10‘. This factor
. appears rather high. Now let us assume that the formation of the clusters during irradiation is due to interstitial motion and that annihilation occurs mainly by vacancy-interstitial recombination. Then the concentrations of vacancies and interstitials will be nearly equal. In this case the motion energy necessary to produce 2 x lo9 jumps in 40 days a t 80% [assuming v.o = 1013/sec in an equation similar to Eq. (1)j turns out t o be be- tween 0.7 and 0.8 ev. This appears reasonable, s ince i f one attributes the stage 111 annealing after cold working to the migration of intersti t ials, one obtains the values 0.64 and 1.09 ev for cop- per54 and nickel” respectively. The s a m e en- ergies within experimental error were determined after electron irradiation of copper 5‘ and nickel. 5 7
I
, e
.
Another point to be made concerning intersti- tialcy enhancement of diffusion relates to the s i z e s of the copper and nickel atoms. No inter- st i t ialcy enhancement of diffusion is expected when the atom sizes of the consti tuents of the
.a l loy are greatly different. This is so because then only the smaller atom is likely to be pushed into an interstitial position, and no relative re- arrangement of the two types of atoms will result. This has been pointed out to be the case for copper-gold alloys. 58 However, in copper-nickel alloys, the atomic sizes of copper and nickel are nearly equal; therefore, this factor should not
54W. Schiile, J . Phys. SOC. Japan 18, 292 (1963). 55D. Schumacher, W. Schule, and A. Seeger, 2.
Naturforsch. 17a, 228 (1962). 56C. J . Meechan and J. A. Brinkman, Phys. Rev. 103,
”A. Sosin and J. A. Brinkman, Acta Met. 7, 478 1193 (1956).
(1959). ”J. A. Brinkman, C;
Acta Met. 2, 38 (1954). E. Dixon, and C. J. Meechan,
prevent a n interstitialcy diffusion mechanism from operating .
No information is available concerning radiation- induced nucleation in this system. However, such an effect has been observed for the precipitation of carbon in alpha iron.59
In order to investigate further the phenomenon of radiation-enhanced clustering in Cu-Ni, a ser ies of foil samples (“0.008 in. thick) have been pre- pared in the composition range 35 to 75 at. % Ni at 5 at. % Ni intervals. A portion of the samples,( .
have been inserted in Hole 50 of the ORNL Graphite *$
Reactor, where they will be irradiated for three \
weeks a t -185%. At the completion of the irra- diation period, the samples will be removed from the reactor and maintained at liquid-nitrogen tem- perature until the electrical resist ivity can be measured on isochronal and isothermal annealing. Similar measurements will be made on samples cold worked at low temperature. Also, a further experiment is planned in which resist ivity measure- ments will be made during reactor irradiation at room temperature and above.
’’ ir
1 ,‘
‘\ \ \. \
TEMPERATUREANDFLUXDEPENDENCEOF RADIATION-ENHANCED DIFFUSION IN CU-AI
J . M. W i l l i a m s . J. H. Barrett W. Schule“
M. S. Wechsler
B. C. Kelley
Introduction
When alpha Cu-A1 alloys are bombarded with neutrons at temperatures between 0 and 210%, a decrease in electrical resist ivity is observed, which results from an increase in short-range
The increase in order proceeds at
59H. Wagenblast and A. C. Damask, J . Phys. Chem. Solids 23, 221 (1962).
“Guest s c i en t i s t from CCR-Euratom, Ispra (Varese), Italy. ‘lM. S. Wechsler and R. H. Kernohan, “The Effect of
Radiation on Diffusion-Controlled React ions in Copper- B a s e Alloys,” p 81 in Radiation Damage in Solids, vol 11, International Atomic Energy Agency, Vienna, 1962.
‘2C. R. Houska and B. L. Averbach, J . Appl. Phys. 30, 1 5 2 5 (1959). 6313. S. Borie and C. J. Sparks, Metals and Ceramics
Diu. Ann. Progr. Rept. May 31, 1962. ORNL-3313, pp 204-206.

136
an accelerated rate owing to the radiation en- hancement of diffusion in this temperature re- gion. Furthermore, it has been shownG5 that samples which have undergone the ordering reaction can be returned to their original s ta te of order, characterized by the higher resistivity value, by warming them to 210%. Also, i f such a sample is irradiated a second time below 2 1 0 T , the ordering reaction occurs again, but this t ime the rate of the reaction is smaller than it was the first t ime.G4 This decrease in the rate of the reaction after thermal cycling in the reactor has been called the "second-run phenomenon."G6
The samples used in these experiments are single crystals of the Cu-15 at . % AI alloy. The initial preparation consists of a 2-hr anneal a t 7 5 0 T , followed by a slow cool a t 15%/hr to room tem- perature. The behavior of the resistivity is illus- trated schematically in Fig. 15.14. Curve AC represents the equilibrium resistivity-vs-tempera- ture curve, unobservable in feasible aging t i m e s below T , (210T). Curve AB represents the ob- served resistivity-vs-temperature curve below T,. Thus , the nonequilibrium order, indicated by the resistivity difference between curves A B and AC, is frozen in on cooling below T,. On iso- thermal irradiation a t T o , the decrease BC is ob- served.
The procedure for observing the second-run phenomenon is a s follows. After the initial de- crease in resistivity [ B C (Fig. 15.14)] takes place, the sample is warmed to T , (210T) with the reactor on and allowed to recover its initial value a t A. Then, with the reactor off, the sample is cooled back down along AB to B a t To . When the reactor is turned on again, the decrease B C is observed a second time. The magnitude of the decrease is the same a s for the first run, but the rate of decrease is considerably reduced.
A ser ies of runs following such cycling treat- ments is shown in Fig. 15.15 for an irradiation temperature ( T o ) of 100%. The normalized change in resistivity is plotted vs the logarithm of the irradiation time. The t ime for half completion (T~,,) for the second run is greater than that for
64M. S. Wechsler et al., So l id 'S ta te Diu. Ann. Progr. Rep t . Aug. 31, 1962, ORNL-3364, pp 127-34.
65R. H. Kernohan and M. S. Wechsler, J . Phys. Chem. Solids 10, 175 (1961).
6GJ. M . Williams, M. S. Wechsler, and J . H. Barrett, Bull . Am. Phys. SOC. 8(II), 197 (1963).
the first run by a factor of 2.5. The third and fourth runs coincide with the second run, indi- cating that the effect saturates.
A point to be noted in, Fig. 15.15 is that the shapes of the curves in the log-time plot are roughly the same (i.e., the curve for the first run may be superimposed on the curves for the re- peated runs by a translation along the abscissa). This suggests that the factor responsible for the reduced reaction rate for the second run is not
UNCLASSIFIED ORNL-LR-DWG 272784
OBSERVED - EQUILIBRIUM
> t 2 5 v) W
Q F
I To T2
T, TEMPERATURE
Fig. 15.14. Schematic Plot of Resist iv i ty vs Tempera-
ture.
c A '
I 0 0
H 0 n U
L
UNCLASSIFIED ORNL-LR-DWG 72409R
0
1.0
0.8
0.6
0.4
0.2
0 1 4
IRRADIATION TIME AT 100°C (rnin)
Fig. 15.15. Fractional Departure from Completion of
the Decrease in Resistivity of CU-AI (15 at. % A I ) vs
T ime of Irradiation for Repeated Runs a t Position 4, Hole C, ORNL Graphite Reactor.

.
produced gradually during the first run. Instead, it would appear that it s e t s in during the cycling treatment. To test this idea, a sample was irra- diated for 88 hr a t 210% (at a position in Hole C of higher flux than for the curves in Fig. 15.15) before the first run was made at 100%. Figure 15.16 shows that this sample (curve €3, Fig. 15.16) exhibited a smaller reaction rate than a fresh sample (curve A , Fig. 15.16). Now, previous experiments have indicated' that an irradiation at 210% produces negligible ordering. Nevertheless, this experiment shows that the irradiation a t 210% is partly effective in bringing about the reduced re- action rate. This lends support to the idea men- tioned above that the factor responsible for the longer second run is introduced during the cycling treatment in which the temperature is raised from 100% to 210% with the reactor on. Furthermore, the curves C and D in Fig. 15.16 show that the second runs for these samples displayed approxi- mately the same reaction rate, which again sug- ges t s a saturation in the effect.
One further experiment should be mentioned at this point. It was stated earlier that the standard prior heat treatment for a l l samples consisted in an anneal a t 750%, followed by cooling to room temperature at 15%/hr. The question ar ises a s to whether this heat treatment is sufficient to erase the s ta te giving rise to the second-run phenomenon. Therefore, a sample which had been
- I
cycled several t imes in the reactor was removed, and the standard heat treatment was reapplied. On reirradiation at loo%, this sample exhibited a rate of decrease in resist ivity characteristic of a fresh sample.
The theory of radiation-enhanced diffusion pre- sented by Dienes and Damask" and Lomer68 and extended in a previous report64 shows that a study of the temperature and flux dependence of the radiation-accelerated reaction yields information concerning the mechanism of annihilation of the diffusion-enhancing defect. The temperature and flux dependence of the first runs has been re- ported p r e v i ~ u s l y . ~ ~ * ' ~ During the past year, further insight into the mechanism of defect an- nihilation was gained a s a result of experiments performed to determine the temperature and flux dependence of the second runs.
Temperature Dependence
For the work on the temperature dependence of the radiation-enhanced ordering, the samples were located at the center of Hole C . of the ORNL
67G. J . Dienes and A. C. Damask, I. Appl. Phys. 29, 1 7 1 3 (1958).
68W. M . Lomer, Diffusion Coef f i c i en t s in Copper Under Fast Neutron Irradiation, AERE-T/R-1540 (December 1954).
1' to' 102
IRRADIATION TIME AT 100°C (min)
UNCLASSIFIED ORNL-LR-DWG 75674
1 o3
Fig. 15.16. Fractional Departure from Completion of Resistivity Decrease in Cu-AI (15 at. % A I ) vs Irradiation
Time for Two Samples with Different Treatments.
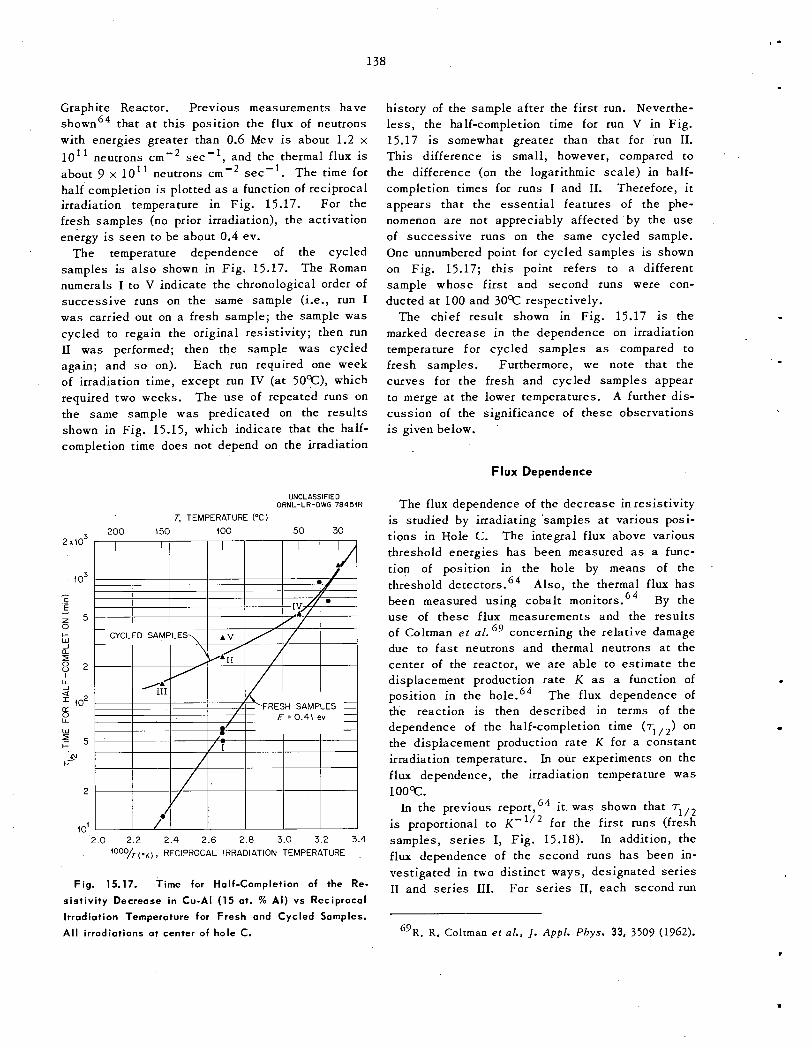
138
, -
Graphite Reactor. Previous measurements have shown64 that a t this position the flux of neutrons with energies greater than 0.6 Mev is about 1.2 x 10" neutrons sec'l, and the thermal flux is about 9 x 10" neutrons sec-l. The t i m e for half completion is plotted a s a function of reciprocal irradiation temperature in Fig. 15.17. For the fresh samples (no prior irradiation), the activation energy is seen to be about 0.4 ev.
The temperature dependence of the cycled samples is a l so shown in Fig. 15.17. The Roman numerals I to V indicate the chronological order of successive runs on the same sample (i.e., run I was carried out on a fresh sample; the sample was cycled to regain the original resistivity; then run I1 was performed; then the sample was cycled again; and so on). Each run required one week of irradiation time, except run IV (at S O T ) , which required two weeks. The use of repeated runs on the same sample was predicated on the results shown in Fig. 15.15, which indicate that the half- completion time does not depend on the irradiation
2
IO'
1 a = IO2 e LL
2XlO<
UNCLASSIFIED ORNL-LR-DWG 78454R
T, TEMPERATURE ("C) 200 I50 IO0 50 30
FRESH SAMPLES
2.0 2.2 2.4 2.6 2.8 3.0 3.2 3.4 ' 0 0 0 / ~ ( ~ ~ ) , RECIPROCAL IRRADIATION TEMPERATURE
Fig. 15.17. Time for Half-Completion of the Re-
sist iv i ty Decrease in CU-AI (15 at. % A I ) vs Reciprocal
Irradiation Temperature for Fresh and Cycled Samples.
A l l irradiations at center of hole C.
history of the sample after the first run. Neverthe- less , the half-completion time for run V in Fig. 15.17 is somewhat greater than that for run 11. This difference is small, however, compared to the difference (on the logarithmic scale) in half- completion t imes for runs I and 11. Therefore, it appears that the essent ia l features of the phe- nomenon are not appreciably affected by the use of successive runs on the same cycled sample. One unnumbered point for cycled samples is shown on Fig. 15.17; this point refers to a different sample whose first and second runs were con- ducted a t 100 and 3 0 T respectively.
The chief result shown in Fig. 15.17 is the marked decrease in the dependence on irradiation temperature for cycled samples a s compared to fresh samples. Furthermore, we note that the curves for the fresh and cycled samples appear to merge a t the lower temperatures. A further dis- cussion of the significance of these observations is given below. .
Flux Dependence
The flux dependence of the decrease in resistivity is studied by irradiating 'samples a t various posi- tions in Hole C. The integral flux above various threshold energies has been measured a s a func- tion of position in the hole by means of the threshold detector^.'^ Also, the thermal flux has been measured using cobalt monitor^.'^ By the use of these flux measurements and the results of Coltman et al.69 concerning the relative damage due to fas t neutrons and thermal neutrons a t the center of the reactor, we are able to estimate the displacement production rate K a s a function of position in the hole.'* The flux dependence of the reaction is then described in terms of the dependence of the half-completion t ime ( T . . / ~ ) on the displacement production rate K for a constant irradiation temperature. In our experiments on the flux dependence, the irradiation temperature was 100T . In the previous r e p ~ r t , ' ~ it was shown that r 1 / 2
is proportional to K-1'2 for the first runs (fresh samples, ser ies I, Fig. 15.18). In addition, the flux dependence of the second runs has been in- vestigated in two distinct ways, designated ser ies II and ser ies 111. For ser ies 11, each second run
@R. R. Coltman et al., /. Appl. P h y s . 33, 3509 (1962).

. 139
.
UNCLASSIFIED ORNL-OWG 63-2236
I o4
- .
E I
z I- 0 ? lo3 Q H 0 0
U. J Q I
402 U.
W z
1 0’ IO+ 10-11 10-10 10-9
K, DISPLACEMENT PRODUCTION RATE PER ATOMIC S I T E ( s e c - ’ )
Fig. 15.18. Time for Half-Completion of the Re-
sist iv i ty Decrease in CU-AI (15 at. % A I ) as a Function
of the Defect Production Rate for Fresh (Series I) and
Cycled (Series II and Ill) Samples. In series II, the
first runs were conducted a t the same flux levels as
the second runs. In series I l l , the same first run was
used for each of the second runs. Irradiation tempera-
ture was IOOOC.
is done a t the same position in the reactor a s the corresponding first run. Thus, each second run had a different irradiation history a s regards the flux level. The curve labeled “series 11” in Fig. 15.18 shows that for this ca se the flux depend- ence is described approximately by rl12 0: K - ’ 1 2 a s for the first runs (series I), although the rl12 values are greater than those for the first runs. After several of the runs in ser ies 11 the sample was recycled, and a third run was made a t 100% The third runs in each case indicated no further increase in rIl2 after the second run, in agree- ment with the observations shown in Fig. 15.15.
For the second runs performed in ser ies 111, a succession of runs was performed on a single sample. The order of the runs is indicated by the symbols A-.E in Fig. 15.18. W e see that for the ser ies 111 runs, T~~~ is approximately propor- tional to K-’. Also, the point for run 111-E l ies quite c lose to that for run 111-B, which justifies the use of successive “second runs” on the same sample.
,
’
Discuss ion
Previous analyses 6 7 * 6 8 of radiation-enhanced dif- fusion have considered the radiation-produced de- fects to be a t their steady-state concentrations. Estimates of the buildup t ime were made to set limits on the range of conditions under which the steady-state concentration could be used. The present discussion will show that many sets of experimental conditions lie in the transient region of defect concentration. This discussion will consider three simple annihilation mechanisms for the defects: (1) diffusion to fixed sinks, (2) pair recombination, and (3) diffusion to fixed sinks together with pair recombination. The concentra- tions of defects in thermal equilibrium will be neglected since it is believed that such concentra- tions are much less than those produced by the irradiation.
Fixed-Sink Mechanism. - For this mechanism radiation-produced vacancies and interstitials will anneal independently of each other. For either
67 defect the time-dependent concentration will be
e-Put) , ’ (1) K
c =-(1 - P w
where c is the defect concentration per lattice site, K is the defect production rate per lattice s i te , w = w,, exp ( - E , / k T ) is the defect jump frequency, p = ah2, a is the concentration of fixed s inks, and h is the defect jump distance. The number of defect jumps per lattice site which will have taken place by a t ime t is
This equation can be solved numerically to give the t i m e t ( ] ) to produce a certain number ] of defect jumps per latt ice site. The two solid curves in Fig. 15.19 illustrate how rII2 varies with 1/T for this annihilation mechanism. These two curves were selected to correspond approxi- mately to the behavior of first and second runs, and the experimental points from Fig. 15.17 are shown for comparison. In Fig. 15.19, was chosen equal to unity, where is the number of jumps per latt ice site necessary to complete half of the ordering process. If desired, the value of may be used a s a parameter to aid in fitting the experimental results. In the calcula- tions for Fig. 15.19 and in a l l other calculations
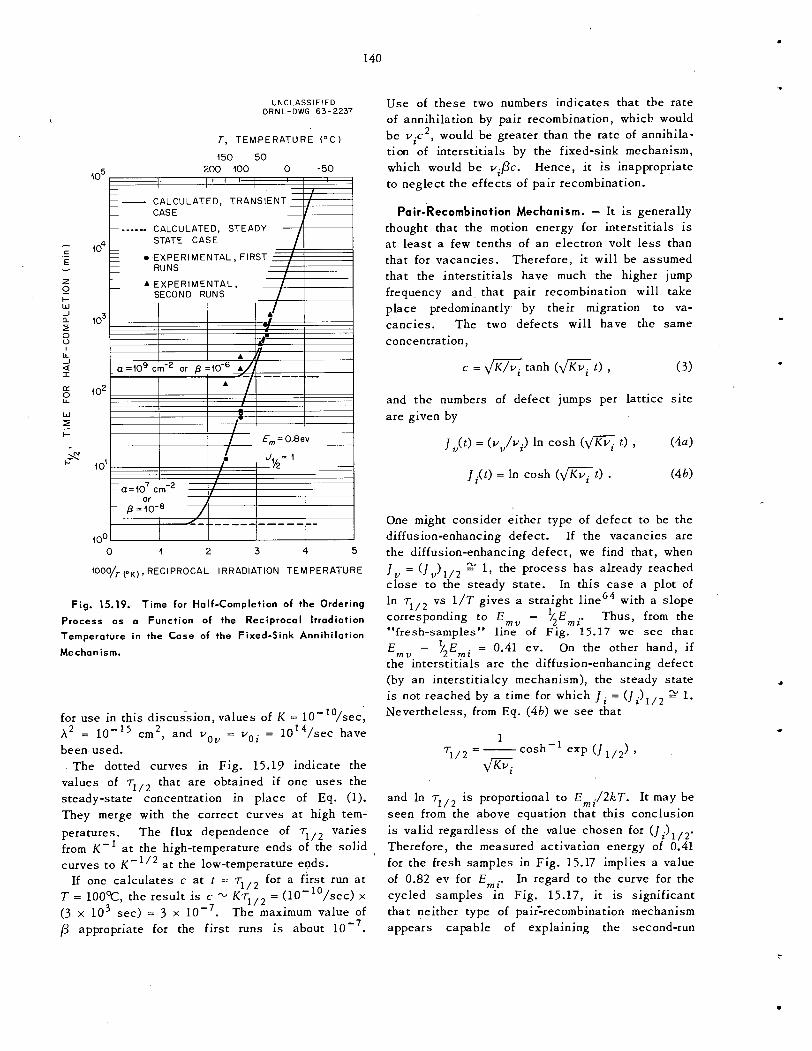
140
I - - - - - C A L C U L A T E D , T R A N S I E N T
CAS E
c
C .- E
z k- W J a z 0 V I
LL J
I
0 LL
W
k-
0
a
a
5
I I
1
UNCLASSIFIED O R N L - D W G 63-2237
I - - - - - C A L C U L A T E D , T R A N S I E N T
CAS E
T , T E M P E R A T U R E ( “ C )
I I
1
- 1 I V I
I’ I I ~
E,=O.Beu __
1 0’
C ALC U L A T E D , ST E ADY STATE C A S E
0 E X P E R I M E N T A L , FIRS
103
J = 1 I f 1 512
p = 10-8
100 0 1 2 3 4 5
1000/T p K ) , R E C I P R O C A L IRRADIATION T E M P E R A T U R E
Fig. 15.19. Time for Half-Completion of the Ordering
Process as a Function of the Reciprocal Irradiation
Temperature in the Case of the Fixed-Sink Annihilation
Me chan is m.
for use in this discussion, values of K = 10-”/sec, X2 = cm’, and vou = voi = IO’*/sec have been used.
The dotted curves in Fig. 15.19 indicate the values of rIl2 that are obtained if one u s e s the steady-state concentration in place of Eq. (1). They merge with the correct curves a t high tem- peratures. The flux dependence of T ~ / ~ varies from K- ’ at the high-temperature ends of the solid curves to K-”’ at the low-temperature ends.
If one calculates c a t t = T ~ / ~ for a first run a t T = l O O T , the result is c % K T ~ , ~ = (lO”o/sec) x ( 3 x l o 3 sec) = 3 x lo”. The maximum value of p appropriate for the first runs is about 10”.
Use of these two numbers indicates that the rate of annihilation by pair recombination, which would be v ic2 , would be greater than the rate of annihila- tion of interstitials by the fixed-sink mechanism, which would be vipc. Hence, it is inappropriate to neglect the effects of pair recombination.
Pair-’Recombination Mechanism. - It is generally thought that the motion energy for intersti t ials is a t least a few tenths of an electron volt less than that for vacancies. Therefore, it will be assumed that the intersti t ials have much the higher jump frequency and. that pair recombination will take place predominantly by their migration to va- cancies. The two defects will have the same concentration,
c = a t a n h ( f i t ) , ( 3 )
and the numbers of defect jumps per lattice site are given by
],(t) = (vv /v i ) In cosh (* t ) ,
J i ( t ) = In cosh ( f i t ) .
( 4 a )
( 4 b )
One might consider either type of defect to be the diffusion-enhancing defect. If the vacancies are the diffusion-enhancing defect, we find that, when 1, = ( J U ) ’ / ’ 2 1, the process h a s already reached close to the steady state. In this c a s e a plot of In T ~ / ~ vs 1 / T gives a straight l ineG4 with a slope corresponding to E m u - ‘ / E m i . Thus, from the 11 fres’h-samples” line of Fig. 15.17 we see that E m u - % E m i = 0.41 ev. On the other hand, i f the interstitials are the diffusion-enhancing defect (by an interstitialcy mechanism), the steady s ta te is not reached by a t ime for which J i = ( J i ) 1 / 2 2 1. Nevertheless, from Eq. ( 4 b ) we see that
and In rIl2 is proportional to E m i / 2 k T . It may be seen from the above equation that this conclusion is valid regardless of the value chosen for ( J i ) l / z . Therefore, the measured activation energy of 0.41 for the fresh samples in Fig. 15.17 implies a value of 0.82 ev for Emi. In regard to the curve for the cycled samples in Fig. 15.17, it is significant that neither type of pair‘-recombination mechanism appears capable of explaining the second-run

.
W H t- -
14 1
0
F I i
I
phenomenon. Instead, it seems necessary to pro- pose that fixed sinks are introduced a s a result of the cycling treatment, which alters the kinetics for the second and succeeding runs compared with the first run.
A s regards the K dependence (Fig. 15.18), both ' pair-recombination mechanisms imply that T ~ / ~ a
K - ' l 2 . This follows from the forms in which K 'and t appear in the argument of the cosh function in Eqs. (4). Hence, these mechanisms will not explain the series I11 curve of Fig. 15.18, and we are again led to the suggestion that fixed sinks are introduced during the cycling treatment.
Fixed-Sink and Pair-Recombination Mechanisms Together. - The discussion in this case will be based on an approximate analysisG4 of the time- dependent behavior. For the approximations to be valid, vz >> vu; for the temperature range of in- terest , this requires E m z < (Emu - 0.3 ev). The equations for the defect concentrations only define these concentrations implicitly. Hence, no analytic form of ] ( t ) is available. However, it is possible tb find two limiting cases for which approximate analytical solutions exist . If it is specified that t ( ] ) have better than 1% accuracy, we find for vacancy enhancement of diffusion that
These two approximations have been used to plot the two full-line portions of each solid curve in Fig. 15.20. The dashed section connecting the two full-line sections of each curve has been interpolated by eye. This interpolation procedure is not exact but does indicate the general behavior of the curves. Unfortunately, the experimental points lie in the interpolated portions of the curves. Computer calculations are being planned in order to get the exact behavior of these curves. Once again the experimental points from Fig. 15.17 are shown, and the dotted curves show the results ob- tained if the steady-state concentration of defects
is assumed. From Eqs. (5), we see that the K de- pendence of -rIl2 varies from K" a t the high- temperature ends of the curves to K - ' I 3 a t the low-temperature ends.
The comparison in Fig. 15.20 of the theoretical curves and the experimental points shows that the mechanism incorporating simultaneous fixed-sink and pair-recombination annihilation is capable of explaining the reduced temperature dependence of the second runs and the fact that the points for the two types of runs tend to merge a t the lower temperatures. The curves in Fig. 15.20 are based on the choice of Emu = 0.8 ev and ( ]u )e l12 = 1. It is possible to fit the experimental points equally well with other choices of Emu and ( ] v ) l 1 2 , but
UNCLASSIFIED ORNL-DWG 6 3 - 2 2 3 8
T , T E M P E R A T U R E ( " C )
150 50 200 100 0 -50
POLATED, TRANSIEN
z 0
J
I Lz 0 LL
a
I- W J
a I 0 0 I LL
CALCULATED STEADY - STATE C A S E
E 0 E X P E R I M E N T A L , F IRS C .- -
A E X P E R I M E N T A L , SECOND RUNS
.- 0 1 2 3 4 5
l ' J O O / T ( o K , , RECIPROCAL IRRADIATION T E M P E R A T U R E
Fig. 15.20. Time for Half-Completion of the Ordering
Process as a Function of the Reciprocal Irradiation
Temperature in the Case of the Fixed-Sink and Pair
Recombination Annihilation Mechanisms Together.

142
the two quantities must be varied in a coordinated way. For example, the sets of values E,,, = 0.7 ev, ... " ( J J I I 2 = 5 and E m v = 0.85 ev, found to satisfy the experimental results.
= 0.2 were Recent
7 0 Monte Carlo calculations on the ordering process indicate that (J , ) I /2 2 5. This result suggests a value of 0.7 e v for Emu.
The curves in Fig. 15.20 suggest that the irra- diation and cycling treatment of the first run must raise the dislocation density to about lo9 dis- locations per c m . Electron-transmission-micro- scope s tudies7 ' have been initiated on unirradiated and irradiated thin foils. A photomicrograph of a sample irradiated a t 100% so a s to produce mini- mum resistivity is shown in Fig. 15.21. The pre- liminary observations on samples given low radia- tion exposures have not identified any changes in dislocation arrangement or density related to the irradiation. The electron-microscope work is being continued. In pr t icu lar , a cycled sample has been prepared; this sample will be examined to test the suggestion that the fixed sinks are intro- duced during the cycling treatment following the first run.
The proportionality of 71/2 to K" for the ser ies 111 second runs in Fig. 15.18 indicates that the
2
annihilation mechanism is primarily diffusion to fixed sinks. Such a result is in accord with the temperature dependence found for the second runs.
W e have seen in Fig. 15.18 that 71/2 a K - ' 1 2 for the ser ies I1 second runs, in which the first runs were conducted a t different K values. The close agreement of runs B and E (series 111) in Fig. 15.18 indicates that neither the two intervening runs nor run B itself alters the number of fixed sinks introduced during the first run (run A , Fig. 15.18). From this it may be concluded that the important part of the irradiation history is the first run. Therefore, it is not unreasonable to suppose that the fixed-sink concentration, p, in- troduced by these first runs is a function of K. Now the second runs tend to fall in range of validity of Eq. ( 5 b ) in which T ~ / ~ is proportional to P / K . A s a result, we find that the observed
a K - ' 1 2 is consistent with the assumption that p a K 1 1 2 , that is, thelfixed-sink concentration introduced by the first run depends on the square root of the K value at which the first run was car- ried out. This assumption can be rationalized in terms of the collapse of vacancy clusters into dis- location loops; however, this explanation is by no means unique and it warrants no further discussion a t this t ime.
3 / 2
70P. A. Finn and G. M. McManus, Phys. Rev. 124, 54 (1961). 71T. S. Noggle, chap. 5 , this report.
Fig. 15.21. Electron Transmission Photomicrograph 16 of a Cu-15 at. % AI Fo i l Irradiated a t 100°C to 10
Neutrons/cm* 0 0.6 Mev). The dislocation structures
to be noted here ore believed to have been introduced
primarily during preparation of the foil.
FUNDAMENTAL ASPECTS OF RADIATION EFFECTS ON DIFFUSIOHCONTROLLED
REACTIONS IN ALLOYS72
M. S. Wechsler
A review is given of the present concept of the vacancy mechanism of diffusion in metals and alloys and of the experimental evidence that sup- ports it. The freezing-in problem and radiation- enhanced diffusion are discussed from the point of view of the vacancy mechanism. The displace- ment production rate and the mechanism of vacancy annihilation are outlined in the light of current theories. Finally, the results of the theory a re compared with experimental observations, panic- ularly in regard to the temperature and the flux dependence of radiation-enhanced diffusion.
72Abstract of paper presented at the ASTM Symposium on Radiat ion Ef fec t s on Metals and Neutron Dosimetry, Los A n g e l e s , Oct . 1-5, 1962. ASTM-STP-341, p 86, 1963.

Publications, Papers, and Seminars


*
. K.
R.
J .
J.
R.
C.
G.
W.
D.
Publications and Papers
JOURNAL ARTICLES
F. Berggren and R. F. Wood “Effect of Correlation on the Hyperfine Interaction in Lithium,” P h y s . R e v . 130, 198 (1963).
“Fission-Product Release From UO,,” Nucl. S a f e t y 4(1), 35 (1962).
“Electron Spin Lattice Relaxation at Defect Sites: E’ Centers i n Synthetic Quartz a t Kilo-Oersteds,’’
M. Carroll
G. Castle, D. W. Feldman, P. G. Kelmens, and R . A. Weeks
Phys. R e v . 130, 577 (1963).
W. Cleland, R. F. Bass , and J . H. Crawford, Jr. “Lattice Defect Production in Thermal Neutron Shielded Materials,” /. A p p l . P h y s . 33, 2906 (1962).
“The Effect of Dislocations and Disordered Regions on CoG0 Photon Induced Defects i n Ge,” A p p l . P h y s . L e t t e r s 2, 113 (1963).
R. Coltman, C. E. Klabunde, D. L. McDonald, and J. K. Redman “Reactor Damage in Pure Metals,” /. A p p l . Phys . 33, 3509 (1962).
Lehmann and G. Leibfried 1 1 Higher Order Momentum Approximations in Classical Collision Theory,” Z. Phys ik 172, 465 (1963).
Leibfried “Higher Order Averages of Primary Recoil Distributions,” Z. P h y s i k 171, 1 (1962).
C. Mallard, A. B. Gardner, R. F. Bass , and L. M. Slifkin “Self-Diffusion in Silver-Gold Solid Solutions,” P h y s . R e v . 129, 617 (1963).
L. McDonald “Low Temperature Irradiation of Beryllium Oxide,” AppI . Phys . L e t t e r s 2 , 175 (1963).
Axel Meyer and R. B. Murray Effect of Energetic Secondary Electrons on the Scintillation Process in Alkali Halide Crystals,” Phys . R e v . 128, 98 (1962).
t t
J. G. Morgan, M. F. Osborne, and Oscar Sisman “Irradiation Effects in the EGCR Fuel ,” Nucl. Sci. Eng. 14, 8 3 (1962).
R. B. Murray “Specific Heat of Single-Crystal MnC1, i n Applied Magnetic Fields,” Phys . R e v . 128, 1570 (1962).
“The Effect of Channeling on Displacement Cascade Theory,” A p p l . Phys. L e t t e r s 2, 8 3 (1963).
“Ranges of Energetic Atoms in Solids,” /. Appl . Phys . 34, 302 (1963).
0. S. Oen and M. T. Robinson
0. S. Oen, D. K. Holmes, and M. T. Robinson
M. L. Picklesimer and S. T. Sekula “Superconducting Transition Temperature of Purified Technetium,” Phys. R e v . L e t t e r s 9 , 254 (1962).
145

146
M. T. Robinson “Deduction of Ion Ranges in Solids from Collection Experiments,” Appl . P h y s . L e t t e r s 1 , 49 (1962).
“The Channeling of Energetic Atoms in Crystal Lat t ices ,” Appl . Phys . L e t t e r s 2, 30 (1963).
“Longitudinal Critical Currents in Cold Drawn Superconducting Alloys,” Appl . Phys . L e t t e r s 2,
M. T. Robinson and 0. S. Oen
S. T. Sekula, R. W. Boom, and C. J . Bergeron
102 (1963).
W. A. Sibley and Edward Sonder “F- and M-Absorption in Heavily Gamma Irradiated KC1,” P h y s . Rev. 128, 540 (1962).
M. J. Smith “Determination of the Nonstoichiometric Doping Mechanism in Bi 2Se3,’’ Appl . P h y s . L e t t e r s 1 , 79
(1962).
Edward Sonder and W. A. Sibley “Radiation Equilibrium of F- and M-Centers in KC1,” P h y s . Rev . 129, 1578 (1963).
A. L. Southern, W. R. Willis, and M. T. Robinson + Sputtering Experiments with 1- to 5-kev Ar Ions,” I . Appl . P h y s . 3 4 , 153 (1963). t t
M. S. Wechsler and R. G. Berggren “Radiation Embrittlement of Reactor Pressure Vessels ,” Nucl . Safety 4( l ) , 42 (1962).
R. A. Weeks “The Paramagnetic Spectra of E; Centers in Crystalline Quartz,” P h y s . Rev . 130, 570 (1963).
“X-Ray Observations of Nearly Perfect Copper Single Crystals,” Appl . P h y s . L e t t e r s 1, 22 (1962).
“Anomalous Transmission of X-Rays in Copper,” Appl . P h y s . L e t t e r s 2, 127 (1963).
M. C. Wittels, F. A. Sherrill, and F. W. Young, Jr.
F . W. Young, Jr. “Etch Pit Studies of Dislocations in Copper Crystals Deformed by Bending: I. Annealed Crystals;
11. Irradiated Crystals,” I . Appl . Phys . 3 3 , 3553 (1962).
BOOKS AND PROCEEDINGS
R. G. Berggren “Critical Factors in the Interpretation of Radiation Effects on the Mechanical Properties of Structural
Metals,” Bulletin No. 87, p 1, Welding Research Council, New York, 1963. D. S. Billington
t t Introduction,” p 1 in Rendiconti d e l l a Scuola Intemazionale d i F i s i c a “E. Fermi,” XVIII C o r s o , Academic Press , London, 1963.
D. S. Billington and D. 0. Thompson “Radiation Damage Research in Low-Power Nuclear Reactors,” p 223 in Programming and Ut i l i za t ion
o/ Research Reactors , vol I, Academic Press , London, 1962.
T. H. Blewitt “Low-Temperature Irradiation Studies,” p 630 in Rendiconti d e l l a Scuola Intemazionale d i F i s i c a .
“E. Fermi,” XVIIl Corso, Academic Press , London, 1963.
.
i

147
C. D. Bopp, W. W. Parkinson, and Oscar Sisman
Carroll), Academic Press , New York, 1963. “Plast ics ,” p 183 in Radiation Ef fec ts on Organic Materials, chap. 5 (ed. by R. 0. Bolt and J . G.
R. 0. Chester, R. W. Peelle, and F. C. Maienschein “Nonlinear Least-Squares Fitting Applied to Gamma-Ray Scintillation Detector Response Functions,”
p 201 in Applications o f Computers to Nuclear and Radiochemistry, NAS-NS 3107 (March 1963).
J . W. Cleland “Transmutation Doping and Recoil Effects in Semiconductors Exposed to Thermal Neutrons,” p 8 4 in
Rendiconti della Scuola lntemazionale di Fis ica “E. Fermi,” X V l I l COTSO, Academic Press , London, 1963.
R. R. Coltman “Reactor Irradiation Studies a t 4OK,” p 205 in Radiation Damage in Solids, vol 11, International
Atomic Energy Agency, Vienna, 1962.
J . H. Crawford, Jr. “Radiation Effects in Semiconductors,” p 333 in Rendiconti della Scuola lntemazionale di Fis ica
“E. Fermi,” XVIII Corso, Academic Press , London, 1963.
D. K. Holmes “The Ranges of Energetic Atoms in Solids,” p 3 in Radiation Damage in Solids, vol I, International
“Terns and Concepts in Radiation Damage Theory,’’ p 182 in Rendiconti della Scuola Intemazionale
Atomic Energy Agency, Vienna, 1962.
di Fisica “E. Fermi,” X V l l l Corso, Academic Press , London, 1963.
“Radiation-Damage Studies Using Dislocation Properties,” p 777 in Rendiconti della Scuola Inter- nazionale di Fis ica “E. Fermi,” XVIII Corso, Academic Press , London, 1963.
M. J. Kelly, W. W. Johnston, andC. D. Baumann “The Effects of Nuclear Radiation on Thermocouples,” p 265 in Temperature: I t s Measurement and
Control in Science and Industry, vol 111, pt 2 (ed. by A. I. Dahl), Reinhold, New York, 1962.
G. Leibfried “Radiation Damage Theory,” p 227 in Rendiconti della Scuola lntemazionale di Fis ica “E . Fermi,”
XVI I l Corso, Academic Press , London, 1963.
R. B. Murray “Scintillation Counters,” p 82 in Nuclear Instruments and Their U s e s , vol I (ed. by A. H. Snell),
Wiley, New York, 1962.
T. S. Noggle “Dislocations in UO,,” p B-5 in P roceedings Fifth International Conference on Electron Microscopy,
“Critical Shear Stress for Slip,” p 508 in Encyclopaedic Dictionary of Phys ics , vol 6 (ed. by J.
vol I , Academic Press , New York, 1962.
Thewlis), Pergamon, London, 1962.
M. T. Robinson, D. K. Holmes, and 0. S. Oen “Monte Carlo Calculations of the Ranges of Energetic Atoms in Solids,” p 105 in L e Bombardement
lonique, Centre National de la Recherche Scientifique, Paris, 1962.
Oscar Sisman, W. W. Parkinson, and C. D. Bopp
Carroll), Academic Press , New York, 1963. f t Polymers,” p 127 in Radiation Ef fec ts on Organic Materials, chap. 5 (ed. by R. 0. Bolt and J . G.
M. S. Wechsler and R. H. Kernohan “The Effect of Radiation on Diffusion-Controlled Reactions in Copper-Base Alloys,” p 81 in Radia-
tion Damage in Solids, vol 11, International Atomic Energy Agency, Vienna, 1962.
148
THESES
J . C. Pigg “Annealing of Gamma Ray Induced Changes in Antimony-Doped Germanium,” thesis , submitted to
the Graduate Council of the University of Tennessee in partial fulfillment of the requirements for the Ph.D. degree, 1963.
PAPERS PRESENTED AT TECHNICAL MEETINGS
C. J . Bergeron, R. W. Boom, and S. T. Sekula “Longitudinal and Transverse Critical I -H Characteristics for Nb-Zr,” presented a t American Physi-
cal Society Annual Meeting, N e w York, Jan. 23-26, 1963.
R. G. Berggren “Radiation Effects on Metal Materials,” presented at ASME Symposium on Advanced Technology,
Albuquerque, N. M . , Nov. 3, 1962.
Ugo Bertocci, L. D. Hulett, L. H. Jenkins, and F. W. Young, Jr. “On the Formation of Electrochemical Etch Pits on the (111) Face of Copper,” presented a t Electro-
chemical Society Phenomena at Interfaces Symposium, Boston, Sept. 16-20, 1962.
R. 0. Chester, R. W. Peel le , and F. C. Maienschein “Nonlinear Least-Squares Fitting Applied to Gamma-Ray Scintillation Detector Response Functions,”
presented a t Applications of Computers to Nuclear and Radiochemistry Symposium, Gatlinburg, Tenn.,,Oct. 17-19, 1962.
J. W. Cleland and R. F. Bass “Lattice Defect Production in Ge by Photons and by Neutrons,” presented at American Physical
Society March Meeting, St. Louis, Mar. 25-28, 1963.
“Lattice Defect Production in GaAs by Photons and by Neutrons,” presented a t American Physical Society Southeastern Meeting, Knoxville, Tenn., Apr. 4-6, 1963.
J . H. Crawford, Jr.
0.
R.
N.
L.
“Investigations of Color Centers i n Alkali Halides at Oak Ridge National Laboratory,” presented at
International Conference on Crystal Lattice Defects, Kyoto, Japan, Sept. 7-12, 1962.
L. Curtis, Jr., and C. C. Robinson “Trapping Centers in As-Doped Ge,” presented at American Physical Society March Meeting, St.
Louis, Mar. 25-28, 1963.
Gwin and R. B. Murray “Emission Spectra of CsI(T1) Crystals and the Possible Role of Self-Trapped Holes,” presented at
American Physical Society Thanksgiving Meeting, Cleveland, Nov. 23-24, 1962.
E. Hinkle “The Effect of Neutron Bombardment of the Stress Rupture Properties of Some Structural Alloys,”
presented a t ASTM Symposium on Radiation Effects on Metals and Neutron Dosimetry, Los Angeles, Oct. 1-5, 1962.
D. Hulett and F. W. Young, Jr. “The Rate of Growth of Electrochemical Etch Pits a t Dislocations on (111) Copper Surfaces,”
presented a t Electrochemical Society Phenomena a t Interfaces Symposium, Boston, Sept. 16-20, 1962.
E. Le11 and R. A. Weeks “Effects of Irradiation on Polarization Currents in a Lead Silicate Glass ,” presented a t American
Physical Society Spring Meeting, Washington, D.C., Apr. 22-25, 1963.

149
A. Meyer and R. F. Wood “Electron Structure and the M Center,’’ presented at American Physical Society Spring Meeting,
Washington, D.C., Apr. 22-25, 1963.
T. S. Noggle “Dislocations in UO, ,” presented at Fifth Annual Congress of Electron Microscopy, Philadelphia,
Aug. 29-Sept. 5, 1962.
0. S. Oen and M. T. Robinson “Ranges of Energetic Atoms in Solids for a Thomas-Fermi Potential,” presented at American Physi-
cal Society March Meeting, St. Louis, Mar. 25-28, 1963.
M. T. Robinson “Slowing Down of Energetic Atoms in Crystals,” presented at American Physical Society South-
eastern Meeting, Knoxville, Tenn., Apr. 4-6, 1963.
M. T. Robinson and 0. S. Oen “Orientation Dependence of the Ranges of Atoms in Crystals,” presented a t American Physical
Society March Meeting, St. Louis, Mar. 25-28, 1963 A. I. Schindler and R. H. Kernohan
“The Interaction Between Irradiation-Induced Defects and Magnetic Structure,” presented at Inter- national Conference on Crystal Latt ice Defects, Kyoto, Japan, Sept. 7-12, 1962.
Edward Sonder and W. A. Sibley “Radiation Hardening in KC1 Single Crystals,” presented at American Physical Society March
Meeting, St. Louis, Mar. 25-28, 1963.
D. 0. Thompson “Evidence for Vacancy Clustering in Dislocations in Copper as Measured by Internal Friction Tech-
niques,” presented at International Conference on Mechanical Aspects of Latt ice Defects on Crystals, Tokyo, Japan, Sept. 3-4, 1962.
M. S. Wechsler “Fundamental Aspects of Radiation Effects on Diffusion-Controlled Reactions in Alloys,” presented
at ASTM Symposium on Radiation Effects on Metals and Neutron Dosimetry, Los Angeles, Oct. 1-5, 1962.
M. S. Wechsler, J . M. Williams, and H. M. Otte “Atomic Rearrangements in Deformed Cu-Si and Cu-Si-Mn Alloys,” presented at International Con-
ference on Crystal Latt ice Defects, Kyoto, Japan, Sept. 7-12, 1962.
R. A. Weeks “Direct Field Effects in the Hyperfine Spectra of a Paramagnetic Defect in Quartz: The E ; Center,”
presented a t American Physical Society Southeastern Meeting, Knoxville, Tenn., Apr. 4-6, 1963.
“Magnetic Structure of Rare-Earth Metals and Intermetallic Compounds,” presented at American M. K. Wilkinson
Physical Society Southwestern Meeting, Houston, Feb. 28-Mar. 2, 1963.
J . M. Williams, M. S. Wechsler, and J . H. Barrett
Meeting, St. Louis, Mar. 25-28, 1963. “2nd-Run Phenomenon in Irradiated Cu-15 at. % Al,” presented at American Physical Society March
R. F. Wood “Calculations of Some Ground-State Properties of F Centers,” presented at American Physical
Society Spring Meeting, Washington, D.C. , Apr. 22-25, 1963. F. W. Young, Jr.
“Etch Pit Studies of Dislocations in Copper Crystals Deformed by Bending: I. Annealed Crystals; Irradiated Crystals,” presented at International Conference on Mechanical Aspects of Latt ice 11.
Defects on Crystals, Tokyo, Japan, Sept. 3-4, 1962. I
150
F. W. Young, Jr., and L. D. Hulett “On the Role of Crystal Imperfections in the Chemical Reactivity of Copper Surfaces,” presented a t
ASM-AIME Surfaces Symposium, New York, Oct. 27-28, 1962.
REPORTS ISSUED
J . C. Pigg A n n e a l i n g of G a m m a R a y l n d u c e d C h a n g e s i n A n t i m o n y - D o p e d Germanium. ORNL-3443 (May 14, 1963).
Seminars
SOLID STATE SEMINARS AT ORNL
The following visitors to the Solid State Division gave seminars during the period covered by this report:
1962
September 14
September 19
October 1
October 4
November 23
1963
February 14
February 2 1
March 29
April 4
J. Spreadborough, Battelle Insti tute, Geneva “Luders Bands in Iron”
H. R. Hahn, Insti tut fur Reaktorwerkstoffe, Jiilich, West Germany Anharmonicity Effects on Neutron Scattering in Solids” t I
J . C. Pf i s te r , Ecole Normale Superieure, P a r i s “Radiation-Enhanced Diffusion in Silicon”
J . B. Birks, University of Manchester, England Organic Fluorescence” 1 ,
J. W. Christ ian, C a s e Insti tute of Technology, Cleveland Flow S t re s s Measurements in Body-Centered Cubic Metals” I t
Martin Goldstein, Ford Motor Company Research Laboratory, Dearborn, Mich. “Some Light Scattering Problems Soluble by a Fourier Transform Method, with
Applications to Radiation Damage”
Cavid Erginsoy, Brookhaven National Laboratory Crystal Symmetries in Atomic Displacement P r o c e s s e s ” ll
H. J . Queisser , Shockley Laboratories, Clevi te Corp., P a l o Alto, Calif. “Dislocations and Diffusion in Silicon”
Nicolaas Bloembergen, Harvard University, Cambridge, Mass. Electr ic Shifts in Magnetic Resonance” l t

15 1
4
April 15a
April 16a
April 17a
April 17
April 18
April 26
May 2
May 7
May 27
May 31
Brebis Bleany, Clarendon Laboratory, Oxford, England “Nuclear Moments of the Lanthanons”
Brebis Bleany, Clarendon Laboratory, Oxford, England “Crystal Field Effects in P r , C e , Nd Metals”
Brebis Bleany, Clarendon Laboratory, Oxford, England “Crystal Field Effects in LnNi2, LnNiS Compounds”
Walter Bollman, Argonne National Laboratory “Analysis of Dislocation Networks”
Robert Nathans, Brookhaven National Laboratory Polarized Neutron Studies on Antiferromagnetic Materials” t t
Ian Firth, University of British Columbia, Vancouver, British Columbia e t Microwave Studies of Phonon Entrapment”
H. A. Gersch, Georgia Insti tute of Technology, Atlanta “Quantum Cel l Model for Bosons”
J . A. Morrison, National Research Council, Ottawa “Thermodynamics of Molecular Crys ta l s”
Richard W. Davies, Carnegie Insti tute of Technology, Pit tsburgh, Pa . t t Some Studies of Electronic Spectral Distributions in Randomly Disordered
La t t i ce s”
J . K . Mackenzie, RIAS, Inc., Baltimore “Atomic Configurations a t F l a t Crystal Surfaces”
EDUCATIONAL LECTURES AND SEMINARS
Four members of the Solid State Division participated in the University Traveling Lecture Program sponsored by ORINS. They presented the following lectures under the auspices of this program:
J . H. Crawford, J r . North Texas State University, Denton, Apr. 24, 1963 “Processes in Alkali Halides”
Austin College, Sherman, Tex., Apr. 25, 1963 “Ionization in Solids”
D. K. Holmes
T. S. Noggle
R. A. Weeks
Auburn University, Auburn, Ala., Jan . 25, 1963 “Radiation Damage Theory”
Georgia Insti tute of Technology, Atlanta, Mar. 6, 1963 t t Electron Microscope Studies of F iss ion Fragment
Tracks in Thin Films”
Emory University, Atlanta, Ga., May 3, 1963 Paramagnetic Defects in Insulators”
Arizona State University, Tempe, May 22, 1963
( t
“Effects of Irradiation on Polarization Currents in Glass”
aJoint Phys ic s and Solid State Divisions seminar.

152
A number of other seminars and lectures were presented during the year by members of the Division, both in this country and abroad:
R. 0. Chester
J . W. Cleland
L. H. Jenkins
C. Lehmann
G. Leibfried
M. T. Robinson
b W. Schule
R. G. Berggren Knoxville Technical Society, Knoxville, Tenn., Jan. 28, 1963
s t Radiation Effects in Structural Steels”
Instrumentation and Controls Division, ORNL, Oct. 8, 15, and 22, 1962
Semiconductor Bas i c s” a t
Instrumentation and Controls Division, ORNL, Nov. 19, 1962 t s Radiation Damage in Semiconductors”
1963 ‘*Radiation Effects in Semiconductors”
Il l inois Insti tute of Technology, Chicago, May 15,
University of Alberta, Edmonton, Canada, Sept. 19, 1962 “Electrochemical Propert ies of Copper Single
Crystals”
Brookhaven National Laboratory, Mar. 19, 1963 Atomic Energy of Canada Limited, Chalk River,
Ontario, Mar. 22, 1963 North American Aviation Science Center, Los
Angeles, May 28, 1963 “Long Range Channeling in Irradiated Crystals”
University of Illinois, Urbana, Mar. 15, 1963 “Channeling Effects in Crystals”
Atomic Energy of Canada Limited, Chalk River, Ontario, May 7, 1963 “Computer Studies of the Slowing Down of Atoms
in Crystals”
Atomics International, L o s Angeles, Apr. 18, 1963 Brookhaven National Laboratory, May 24, 1963
“Enhancement of Diffusion in Alloys” U.S. Naval Research Laboratory, Washington, D.C.,
May 21, 1963
Heights, N.Y., May 23, 1963 “Enhancement of Diffusion by In te rs t i t i a l s in
Thomas J. Watson Research Center, IBM, Yorktown
Alloys” University of Il l inois, Urbana, May 28, 1963
“Point Defects in Noble Metals” Northwestern University, Evanston, Ill., May 31,
1963 “Interstitial and Vacancy Migration in fcc
Metals”
bGuest sc ien t i s t from C.C.R.-EURATOM, Ispra, Italy.
I
153
M. J . Smith
D. 0. Thompson
M. S. Wechsler
R. A. Weeks
0
M. K. Wilkinson
M. C. Wittels
Cornell University, I thaca, N.Y., May 13, 1963 rcCo60 Gamma-Radiation-Induced Point Defects
in Bi2Te ” 3 University of Il l inois, Urbana, Dec. 5 , 1962
“Behavior of Lat t ice Defects in Dislocations”
Stanford Research Insti tute, Menlo Park, Calif., Oct. 4 , 1962 “Radiation-Enhanced Ordering in Copper-
Aluminum Alloys”
Johns Hopkins University, Baltimore, Dec. 12, 1962 “Paramagnetic Character is t ics of the E’ Centers
i n Quartz Single Crystals” Parma Research Center, Cleveland, May 14, 1963
“Electron Spin Resonance Research a t Oak Ridge National Laboratory”
Sandia Corporation, Albuquerque, N.M., May 20, 1963 t r Paramagnetic Spectra of E ; Centers”
1963 I t E f f ec t s of Irradiation on Polarization Currents
Hughes Aircraft Corporation, L o s Angeles, May 23,
in Glass”
Research and Development Unit, U.S. Navy Reserve, Oak Ridge, Tenn., Nov. 28, 1962 “The U s e of Nuclear Reactors in Solid State
Investigations” North Carolina State College, Raleigh, Jan. 2 1, 1963
t t Techniques and Applications of Neutron Diffraction”
Atomic Energy of Canada Limited, Chalk River, Ontario, Feb. 7, 1963 ‘‘Magnetic Ordering in Rare-Earth Metals and
Compounds” IBM Research Center, Yorktown Heights, N.Y., May
9, 1963 1t Magnetic Structures of Rare-Earth Metals and
Intermetallic Compounds”
Lehrstuhl f. Reaktorwerkstoffe, KFA, Js l ich , Germany, Sept. 20, 1962 “X-Ray and Thermal Studies of Radiation Damage”
University of Par is , Orsay, France, Oct. 9, 1962 “ P h a s e Transi t ions Due to F a s t Neutrons, Fis-
sion Fragments and Thermal Neutron Capture” C.E.N.S., Saclay, France, Oct. 10, 1962
“Transmutation Effects in Gold” Institut f. Technische Physik, ETH, Zurich,
Switzerland, Oct. 17, 1962 “The Growth of Small Single Crystal Spheres”
C.E.N., Grenoble, France, Oct. 22, 1962 “X-Ray Diffraction Studies of Irradiated
Single Crystals”

154
F. W. Young, Jr. Harvard University, Cambridge, Mass., Apr. 1 1 , 1963 “The Role of Dislocat ions in the Dissolution of
Copper Crystals”
During March, April, and May 1963,’G. Leibfried gave a ser ies of s ix lectures on “Lattice Dynamics,” These lectures were given in the and H. C. Schweinler gave s ix lectures on “Brillouin Zone Theory.”
Solid State Division and were open to interested Laboratory personnel.
CON F E R E NC ES
A three-day conference was held on Oct. 17-19, 1962, on the general subject of “Ranges of Atoms in Solids.” This was principally organized and guided by the theorists of the Solid State Division who are interested in range problems. The conference was informal in character and brought together about 40 scient is ts from all over the United States and Canada with a great variety of interests: interatomic potentials, range measurements, atomic scattering, sputtering, and radiation damage. The conferees agreed that this type of conference was very productive, and many suggested that other meetings of a similar character would be more fruitful than large, formal meetings.
b
t

15 5
ORNL-3480 UC-34 - Physics TID-4500 (21st ed.)
INTERNAL DISTRIBUTION
1. J. H. Barrett 2. R. F. Bass 3. S. E. Beall 4. P. R. Bel l 5. W. T. Berg 6. R. G. Berggren 7. U. Bertocci 8. J. 0. Betterton, Jr. 9. D. S. Bil l ington
~ lo. E. P. Blizard 11. A. L. Boch 12. E. G. Bohlmann 13. C. J. Borkowski 14. G. E. Boyd 15. M. A. Breazeale (consultant) 16. M. A. Bredig 17. R. B. Briggs 18. H. Brooks (consultant) 19. F. R. Bruce 20. W. E. Brundage 21. C. T. Butler 22. N. Cabrera (consultant) 23. R. 0. Chester 24. J. W. Cleland 25. T. F. Connolly 26. R. R. Coltman 27. J. A. Cox 28. J. H. Crawford, Jr. 29. F. L. Culler 30. J. E. Cunningham 31. P. B. DeNee 32. H. D. Dietze 33. J. L. Fowler 34. J. H Frye, Jr. 35. J. L. Gabbard 36. B. R. Gossick (consultant) 37. R. J. Gray 38. W. R. Grimes 39. D. E. Harrison (consultant) 40. N. E. Hinkle 41. A. Hollaender 42. D. K. Holmes 43. A. S. Householder 44. J. P. Howe (consultant) 45. J. T. Howe 46. L. D. Hulett 47. H. B. Huntington (consultant)
48. L. H. Jenkins 49. R. W. Johnson 50. R. J. Jones 51. W. H. Jordan 52. C. E. Klabunde 53. G. W. Keilholtz 54. M. T. Kelley 55. R. H. Kernohan 56. E. M. King 57. J. S. Koehler (consultant) 58. J. A. Krumhansl (consultant) 59. E. J. Lee 60. C. Lehmann 61. G. Leibfried 62. H. Leidheiser, Jr. (consultant) 63. A. B. Lew is (consultant) 64. T. A. Lincoln 65. S. C. L ind 66. R. S. Livingston 67. H. G. MacPherson 68. C. J. McHargue 69. W. D. Manly 70. A. Meyer 71. A. J. Miller 72. E. C. Miller 73. J. W. Mitchell (consultant) 74, K. Z. Morgan 75. R. B. Murray 76. C. M. Nelson (consultant) 77. M. L. Nelson 78. T. S. Noggle 79. 0. S. Oen 80. V. Park 81. R. B. Parker 82. J. C. Pigg 83. H. Pomerance 84. M. E. Ramsey 85. T. A. Read (consultant) 86. J. K. Redman 87. C. C. Robinson 88. M. T. Robinson 89. A. F. Rupp 90. 0. E. Schow 91. H. C. Schweinler 92. H. E. Seagren 93. F. Seitz (consultant) 94. S. T. Sekula

156
95. F. A. Sherri I I 96. E. D. Shipley 97. W. A. Sibley 98. R. H. Silsbee (consultant) 99. 0. S' isman 100. M. J. Skinner 101. L. Sl i fk in (consultant) 102. G. P. Smith 103. H. G. Smith 104. M. J. Smith 105. A. H. Snell 106. E. Sonder 107. A. L. Southern 108. R. L. Sproull (consultant) 109. J. T. Stanley 110. E. E. Stansbury 111. W. J. Stelzman 112. C. D. Susano 113. J. A. Swartout 114. E. H. Taylor 115. L. C. Templeton 116. D. 0. Thompson 117. G. T. Trammel1 (consultant) 118. David Turnbull (consultant)
119. D. Walton 120. C. C. Webster 121. M. S. Wechsler 122. R. A. Weeks 123. A. M. Weinberg 124. E. P. Wigner (consultant) 125. M. K. Wilkinson 126. G. C. Williams 127. g. M. Williams 128. W. R. Wi l l is (consultant) 129. M. C. Wittels 130. E. 0. Wollan 131. R. F. Wood 132. F. W. Young
' 133. Gale Young 134. Biology Library
135-137. Central Research Library 138-187. Laboratory Records Department
188. Laboratory Records, ORNL R.C. 189. Laboratory Shift Supervisor
190-191. ORNL - Y-12 Technical Library, Document Reference Section
192. Reactor Div is ion Library
E X 7 ERNAL DISTRIBUTION
193. W. W. Shaver, Corning Glass Works, Corning, New York 194. R. W. McNamee, Union Carbide Corporation, New York 195. Boeing Airplane Company 196. Research and Development Division, AEC, OR0 197. J. R. Johnson, Minnesota Mining and Manufacturing Co., St. Paul 198. A. E. Ruark, AEC, Washington 199. G. L. Stiehl, Convair Div is ion of General Dynamics Corp., Son Diego 200. R. 0. Bolt, California Research Corp., Richmond 201. Beniamin Lax, L incoln Laboratory, Lexington, Massachusetts 202. George H. Wagner, L inde Air Products Company, Tonawanda Laboratory, East Park Dr ive
and Woodward Avenue, Tonawanda, New York 203. D. K.. Stevens, Materials and Metallurgy Branch, Div is ion of Research, US. Atomic Energy
Commi s s i on, Washington, D.C. 204. R. I. Leininger, BatteIIe Memorial Institute, 505 King Avenue, Columbus, Ohio 205. Westi nghouse Electr ic Corp., Research Laboratories, Pittsburgh, Pennsylvania 206. J. G. Castle, Jr., Physics Dept., Westinghouse Electr ic Corp., Research Laboratories,
207. C. Kikuchi, University of Michigan, Willow Run Laboratory, Ann Arbor, Michigan 208. N. R. Beaudry, Off ice of Ordnance Research, Duke Station, Durham, North Carolina 209. J. Hitch, Off ice of Isotope Development, AEC, Washington, D.C. 210. P. W. McDanieI, Div is ion of Research, USAEC, Washington, D.C. 211. H. Y. Fan, Solid State Physics Dept., Purdue University, Lafayette, Indiana 212. T. J. Turner, Department of Physics, Wake Forest College, Winston-Salem, North Carolina 213. J. B. Trice, Mi l i tary Space Vehicle Department, General Electr ic Co., Philadelphia, Pennsylvania 214. T. H. Blewitt, Argonne National Laboratory, Chicago, I l l ino is
Pittsburgh, Pennsylvania
I
V

157
i
215. R. A. Charpie, Union Carbide Corporation, New York, New York 216. L. B. Emlet, Union Carbide Corporation, New York, New York 217. C. D. Yost, ARPA, Pentagon, Washington, D.C. 218. D. F. Cope, Reactor Division, Oak Ridge Operations Office 219. J. M. Simmons, Division of Reactor Development, AEC, Washington, D.C. 220. H. Shulman, Diamond Ordnance Fuse Laboratory, Washington, D.C. 221. G. D. Watkins, General Electric Research Laboratories, Schenectady, New York 222. R. Street, Department of Physics, Monash University, P.O. Box 92, Clayton, Victoria, Australia 223. R. A. Young, Georgia Institute of Technology, Atlanta, Ga. 224. H. A. Gersch, Georgia Institute of Technology, Atlanta, Ga. 225. A. Merlini, Solid State Physics Department, C.C.R.-EURATOM, lspra (Varese), Italy 226. S. Amelinckx, Solid State Physics Department, C.E.N., Mol-Donk, Belgium 227. A. Seeger, Max Planck lnstitut fur Metallforschung, Seestrasse 75, Stuttgart N, Germany 228. J. Diehl, Max Planck lnst i tut fiir Metallforschung, Seestrasse 75, Stuttgart N, Germany 229. P. Baruch, Laboratoire de Physique, Ecole Normale Superieure, Paris V, France 230. V. B. Bhanot, Physics Department, Paniab University, Chandigarh-3, India
231-868. Given distribution as shown in TID-4500 (21st ed.) under Physics category (75 copies - OTS)
158
Reports previously issued in this series are:
ORNL- 1025"
ORNL- 1095
ORNL-1128"
ORNL-1214"
0 RN L- 126 1 " ORNL-1301*
ORNL-1359"
0 RN L- 1429 * ORNL-1506"
ORN L-1606
ORN L- 1677
0 RN L- 1762"
ORNL-1851"
0 R N L- 1852
0 RN L- 1944
0 RN L- 1945
ORNL-2051
ORNL-2052"
ORNL-2188
ORNL-2189*
OR N L-24 1 3
0 RN L -26 14 0 RN L -2829 0 R N L -3011 7
ORNL-3213
ORN L-3364
Period Ending January 31, 1951
Period Ending April 30, 1951
Period Ending July 31, 1951
Period Ending October 31, 1951
Period -Ending January 31, 1952
Period Ending May 10, 1952
Period Ending August 10, 1952
Period Ending November 10, 1952
Period Ending February 10, 1953
Period Ending August 31, 1953
Period Ending February 28, 1954
Period Ending August 30, 1954
Period Ending February 28, 1955
Period Ending February 28, 1955
Period Ending August 30, -1955
Period Ending August 30, 1955
Period Ending February 29, 1956
Period Ending February 29, 1956
Period Ending August 30, 1956
Period Ending August 30, 1956
Period Ending August 31, 1957
Period Ending August 31, 1958 Period Ending August 31, 1959
Period Ending August 31, 1960
Period Ending August 31, 1961
Period Ending August ,31, 1962
I
b
*Class i f ied
t