central pollution control board - cpcb enviscpcbenvis.nic.in/cpcb_newsletter/benzene in air and...
TRANSCRIPT

Central Pollution Control Board
http://www.cpcbenvis.nic.in/newsletter/benzenefeb2002/feb2002.htm[9/6/2012 10:47:59 AM]
Physico - chemical properties of benzene, toluene, ethyl benzene & xyleneSource of benzene in the environmentBenzene emission factor for different sourcesKinetics and MetabolismHealth effects
General exposure and daily intakeOccupational expousreToxicological & carcioogenic effects
Methodology of measurement Active sampling
Passive sampling
Concentration of benzene in ambient air in DelhiBenzene levels in major cities of the worldAir quality standards for benzeneGasopline benzene reduction program in indiaReferences

Central Pollution Control Board
http://www.cpcbenvis.nic.in/newsletter/benzenefeb2002/feb02edi.htm[9/6/2012 10:48:01 AM]
Contents
Archives
Home
The human activities whether for industrial activities, transportation use fuels of variouskinds. Burning of fuels leads to a plethora of combustion products ,which contributetowards air pollution including trace organics.
Trace organic are to be monitored to ascertain their characteristics and concentration inthe ambient air. These trace organics include Benzene , Toluene , Xylenes (BTX ),Volitle Organic Compounds (VOCs),Polycyclic Aromatic Hydrocarbons (PAHs) etc.Monitoring Helps us to take necessary preventive and control measures. With this in view, the Central Pollution Control Board has set up infrastructure and facilities for Benzenemonitoring in Delhi, which include active sampling and passive sampling devices, ATD-GC for analysis in its laboratory , online BTX analysers and mobile van for monitoring atselected locations and traffic intersections. Based on monitoring data, it has been possibleto identify the polluted area, polluters and also prepare action plans to abate the Pollution.Action Plan for Benzene reduction in the gasoline and the environment for the capital cityof the Delhi and the whole country. Because of initiatives taken for controlling the airpollution from different sources, particularly automobiles, fuel quality, the increasingtrend of Benzene pollution in the city has been arrested. Benzene content in gasoline hasbeen reduced from 5% to 3% in Metropolitan Cities & 1% in National Capital Territory(NCT) & Mumbai during year 2000. The results of initiatives and emissions from petrolpumps are being felt through findings of CPCB monitoring.
I am grateful to my colleagues Dr. B. Sengupta, Member Secretaray, Dr. S.K. Tyagi,Scientist 'C' and their whole team for collecting and collating relevant informationrelating to Benzene pollution and health effects for this Newsletter.
We hope, it will be useful to all concerned with protection and improvement of airquality.
(Dilip Biswas)
Chairman, CPCB

Central Pollution Control Board
http://www.cpcbenvis.nic.in/newsletter/benzenefeb2002/feb02phy.htm[9/6/2012 10:48:02 AM]
BENZENE IN AIR AND IT'S EFFECT ON HUMAN HEALTH
PHYSICO- CHEMICAL PROPERTIES OF BENZENE, TOLUENE & XYLENE :
Benzene is a naturally occurring colourless liquid at room temperature (25 oC) and pressure (760 mm Hg). It has acharacteristic aromatic odour, a relatively low boiling point (80.1oC) and high vapour pressure, which causes it toevaporate rapidly at room temperature. Benzene is released into the environment from both natural and man-madesources, although the later is the most significant source. Benzene in air exists predominantly in the vapour phase, withresidence time varying between few hours to a few days depending on the environment and climate. Degradation ofbenzene in air occurs mainly by reaction with hydroxyl, alkoxy and peroxy radicals. Toluene and Xylene are also presentin most of the sources along with Benzene. Physico-chemical properties of Benzene, Toluene & Xylene are given inTable : 1.
Benzene Toluene o-Xylene m-Xylene p-Xylene
Physical form (20oC) Clear colourlessliquid
Clear colourlessliquid
Colourless liquid Colourless liquid Colourless liquid
Flash Point (o oC) -11.1 oC 4.4 oC 30 oC 25 oC 25 oCFlammable limits 1.3-7.1% 1.17-7.1%Melting/Freezing point 5.5 oC -95 oC -25.2 oC -47.9 oC 13.3 oCBoiling point (760mmHg)
80.1 oC 110.6 oC 144.4 oC 139.1 oC 138.3 oC
Density (20 oC )g/ml. 0.878 0.8669 0.876 0.860 0.857
Vapour pressure
(26 oC)
13.3 kPa 28.7 mmHg 0.66 0.79 0.86
Solubilities Water: 1800mg/lt at25 oC Non aq.Solvents misciblewith most
Fresh water :535mg/lt at 25oCSea Water 380mg/ltat 25 oC
Water: 142mg/lt 146mg/lt 185mg/lt
Back to Content

Central Pollution Control Board
http://www.cpcbenvis.nic.in/newsletter/benzenefeb2002/feb02phy1.htm[9/6/2012 10:48:03 AM]
BENZENE IN AIR AND IT'S EFFECT ON HUMAN HEALTH
SOURCES OF BENZENE IN THE ENVIRONMENT Sources of BTX Emission Transport : (I). Vehicular Pollutio
a) Vehicular exhaust
b) Fuel filling station
c) Fuel adulteration
(II). Railways
(III). Airways
Industries : (I). Major industrial units (Refinery, Petrochemical etc ) :
(II). Industrial estates :
(III). Medium scale chemical industries
Domestic Emissions : (I). Domestic combustion units
(II). Commercial combustion units
· Developed Country Scenario :
The proportion of benzene currently in both leaded and unleaded petrol is about 1% by volume in the United Kingdom. There has been no increase in the amount of benzene in leaded petrol over the last decade, in spite of a threefoldreduction in its lead content.
While people working with petrol, in its manufacture and distribution, might be expected to derive their mainexposure from this source, a major source of exposure for the general population is from vehicle exhausts, and herebenzene is mostly produced by chemical reactions occurring during combustion of petrol in the engine. The importanceof this source is illustrated in Table 2, which shows that no less than 78% of atmospheric benzene in the United Kingdomis emitted from petrol engine exhausts. From this it is clear that to achieve air quality standards for benzene , controlfrom this source is essential. While petrol exhaust is the major source of benzene in the air we breathe outdoors,especially in urban areas, it is important to realize that there are other sources of human exposure, some of whichcontribute a significant proportion of an individual’s total intake. Cigarette smoke contains benzene, and may be themain source of exposure for a heavy smoker; passive smoking may make a small contribution to benzene intake. Benzene may also be present in low concentrations in some foods and in drinking water, and diet may be the main sourceof benzene for non-smokers living in unpolluted, rural areas.

Central Pollution Control Board
http://www.cpcbenvis.nic.in/newsletter/benzenefeb2002/feb02phy1.htm[9/6/2012 10:48:03 AM]
Table 2 gives some estimated figures for the different amounts of benzene (measured by weight in microgram i.e. µg ) towhich we may be exposed daily from these sources.
Table 2 : Sources of Benzene emissions in the UK in 1991.
Tonnes/Year* %
Petrol engine exhausts 39,250 78
Diesel engine exhausts 4,550 9
Petrol evaporation from vehicles 3,350 7
Petrol refining and distribution 1,350 3
Combustion of oil, wood, etc 950 2
Gas leakage 400 <1
Other Industrial processes 16-350 <1
Figures rounded to the nearest 50 tonnes
Source : Department of Environment, U.K.. Expert Panel on Air Quality Standards : Benzene (1994)
Table 3 : World Production of benzene in thousands of tones for 1981
Capacity ProductionNorth and South America (Total) 9350 6150Asia (total) 3550 2460Western Europe (total) 6950 3800Eastern Europe (total) 5840 2340Japan 2880 2060USA 8030 5190USSR 3250 1700Other Countries 100 50World 25800 14800
Note : Benzene in Petrol is not included.
Source : WHO, Environmental Health Criteria Document-150, Benzene (IPCS, 1993)
· Gasoline (Petrol) and Mobile sources :
Benzene is present in both exhaust and evaporative emissions. Motor vehicles account for approximately 85% of thetotal benzene emissions. The remaining is attributed to stationary sources (15%). Benzene is a component of gasoline.
Another important source of benzene in air is active smoking of tobacco. As per EPA’s estimate active smoking

Central Pollution Control Board
http://www.cpcbenvis.nic.in/newsletter/benzenefeb2002/feb02phy1.htm[9/6/2012 10:48:03 AM]
accounts for roughly half of the total population exposure to benzene, which is over and above that from motor vehicles.
Benzene is quite stable in atmosphere and the only important reaction in the lower atmosphere in the reaction with OHradical. This reaction too is very slow. Benzene is one of the ingredients of petroleum product.
Benzene hydrocarbons can be condensed and washed out to the coke-oven gas. Crude oil contains benzene and itshomologues account for 3.9%-4.8%. In USA Benzene is also produced from olefines. Benzene in the motor fuel is infactburnt in the combustion process, but at the same time there is an additional amount of benzene produced throughdealkylation which is emitted. Benzene is mainly used as raw material for the production of substituted aromatichydrocarbons. The major source is emission from motor vehicles and evaporation losses during the
handling distribution and storage of petrol.
As the CPCB survey during 1988-89 five Metro cities account for 35% of total vehicular population in India. 2 Wheelersin 5 Metros only account for 23% of all 2 Wheelers in India. Two-wheelers have grown in number accounting for 68.8%of all vehicles in 1995 against 8.8% in 1951 in India.
Delhi alone accounts 1/8th of Total Vehicle Population (TVP) in India. The total number of vehicles in Delhi (27.0 lacs)was more than number of vehicles in cities of Mumbai (7.24 lacs), Calcutta (5.61 lacs) and Chennai (8.12 lacs) puttogether during 1995. The total no. of 2 Wheelers in Delhi (14.03 lacs) was about one and half times of other threeMetros i.e. Mumbai (2.46), Calcutta (2.22) & Chennai (4.61) put together during 1993.
The total number of vehicles in Delhi was 30 lacs as on March 31, 1998., which has grown up to more than 34.25 lacsas on July 2001. (Out of which CNG vehicle constitute 2450 Buses, 1178 Mini-Buses, 27,263 Three-Wheeler, 1993Taxis). Diesel vehicles constitutes about 6% of total vehicles. Two wheelers owing to predominate category (i.e. about
2/3rd of total vehicular population in Delhi need utmost attention. In the petrol driven two-wheeler the emission ofbenzene is significant because about 20-30% of fuel is coming out as unburnt hydrocarbon.
Table 4 : Percentage Contribution of Pollution Load From Gasoline And
Diesel Vehicles (Comparative Account).
Category ofVehicle
CO HC NOx SO2 Pb PM
Petrol 67 84 5 4 100 -Diesel 33 16 95 96 - 100
There are two sources of hydrocarbon emissions from the vehicles – evaporative emission and engine exhaust emission. The evaporative emission from vehicles comprises of running losses, diurnal losses, hot soak losses and fuel loadinglosses. The losses arise from the fuel tank and the carburetor. Similarly in gasoline handling systems from the refinerystorage tank to gasoline dispensing stations evaporative losses take place.

Central Pollution Control Board
http://www.cpcbenvis.nic.in/newsletter/benzenefeb2002/feb02phy1.htm[9/6/2012 10:48:03 AM]
Gasoline consumption in Delhi has shown a growth of 247% during 1997-98 against 1980-81 as compare toDiesel consumption growth of 150% only.
Table 5 : Estimate of Demand of Transport Fuels in India (‘000 Tonnes)
Product 1987-88 1992-93 1995-96 2001-02
Gasoline 2800 3938 4779 6641
Diesel 17600 23261 29495 38492
· Benzene Emission from Passenger Car :
Benzene is a major constituent of evaporative emission due to its high volatility. In the gasoline engine exhaust againstbenzene is a significant component of hydrocarbon fraction due to its refractory nature in the combustion process.
Benzene emissions in European cars using modified ECE + EUDC test cycle are correlated by the following equations(ref 52).
For noncatalyst cars
BEE = 1.515 + 0.765.BF + 0.0414. NBAF (eq1)
For catalyst cars
BEE = 1.237 + 0.599.BF + 0.0602. NBAF (eq2)
Where BEE – wt% benzene in total hydrocarbons in engine exhaust,
BF - wt% benzene in feed and
NBAF - wt% nonbenzene aromatics in feed.
It may be noted that BEE is very sensitive to benzene content in gasoline and also depends on aromatic content in thefuel.
Sources of Benzene Emission :
- Emissions from Benzene Production
· Catalytic reforming/ separation process
Toluene dealkylation and toluene disprortionation processEthylene productionCoke oven and coke by product recovery plants
- Emissions from Major Uses of Benzene

Central Pollution Control Board
http://www.cpcbenvis.nic.in/newsletter/benzenefeb2002/feb02phy1.htm[9/6/2012 10:48:03 AM]
Ethylbenzene and Styrene productionCyclohexane productionCumene productionPhenol productionNitrobenzene productionAniline productionChlorobenzene productionLinear alkylbenzene productionOther organic chemical productionBenzene use as a solvent
- Emission from other Sources
Oil and gas wellheadsGlycol dehydration unitsPetroleum refinery processesGasoline marketingPublicly owned treatment worksMunicipal solid waste landfillsPulp, paper and paperboard industrySynthetic graphite manufacturingCarbon black manufactureRayon- based carbon fiber manufactureAluminum castingAsphalt roofing manufacturingConsumer products/building supplies
-Emissions from combustion sources
Medical waste incineratorsSewage sludge incineratorsHazardous waste incineratorsExternal combustion solid, liquid and gaseous fuels in stationary sources heat and power generationStationery internal combustionSecondary lead smeltingIron and Steel foundriesPortland cement productionHot-mix ashalt productionOpen burning of biomass, scrap tires
Back to Content

Central Pollution Control Board
http://www.cpcbenvis.nic.in/newsletter/benzenefeb2002/feb02phy2.htm[9/6/2012 10:48:04 AM]
BENZENE IN AIR AND IT'S EFFECT ON HUMAN HEALTH
BENZENE EMISSION FACTOR FOR DIFFERENT SOURCES:
· Emissions from Refuelling losses
Refuelling losses – These depend on the ambient temperature at the time of refuelling, and are determined by thefollowing equation
Bze = 0.23 BZd + 0.21 BZf
Where,
Bze Is the mass fraction of benzene in total hydrocarbons emitted
BZd Is the fraction of benzene in the petrol distributed
BZf Is the fraction of benzene in the petrol in the tank
· Emissions from Evaporative losses from the carburettor and the fuel tank :
These results from the dissipation of heat when the engine is turned off and from variations in temperature betweenday and night. The following equations have been established.
Engine stopped : % weight of benzene in vapour = 0.45 of the weight of benzene in petrol
Respiration : % weight of benzene in vapour = 0.89 of the weight of benzene in petrol
Emissions from exhaust :
BZexh = 0.50 +0.44 BZgas + 0.04 Ar
Where
BZexh Is the percent weight of benzene in the exhaust
BZgas Is the percent weight of benzene in petrol (gasoline)
Ar Is the percent weight of other aromatics in petrol (gasoline)
For Benzene exhaust from petrol vehicles, separate equations were used for three-way catalysts, three way plus oxidationcatalysts, and other catalyst types. For vehicles with a three- way catalyst, running on baseline gasoline, the followingequation was used :
3-way Bz%THC = 1.077+0.7732* (Volume % benzene)

Central Pollution Control Board
http://www.cpcbenvis.nic.in/newsletter/benzenefeb2002/feb02phy2.htm[9/6/2012 10:48:04 AM]
+ 0.0987* (Volume % aromatics – volume % benzene)
This equation was obtained by the EPA Regulatory Development and Support Division (RDSD) from work done byChevron Oil Company.
For vehicles with a three-way plus oxidation catalyst, running on baseline petrol the equation used was :
3-way + oxBz%THC = 0.6796* (Volume % benzene)
+0.0681* (Volume % aromatics – volume % benzene)
This equation was obtained from the draft Regulatory Impact Analysis for RVP regulations (EPA, 1098 a).
For vehicles with no catalyst or an oxidation catalyst, the equation used was :
Other Bz%THC = 0.8551* (Volume % benzene)
+0.12198 * (Volume % aromatics) –1.1626
· Benzene Emission from Gasoline Loading Racks at Bulk Terminals and Bulk Plants :
Table 5 : Benzene Emission Factors for Gasoline Loading Racks at Bulk Terminals and Bulk Plants
Loading Method Gasoline Vapour Emission Factora
Ib/1000 gal (mg/liter)Benzene Emission
Factorb Ib/1000 gal (mg/liter)Splash loading – normal service 11.9 (1430) 0.11 (12.9)Submerged loadingc normal service 4.9(590) 0.044(5.3)
Balance serviced 0.3(40) 0.004(0.36)
Source : EPA’s Emission Factors (1993)
a. Gasoline factors represent emissions of non-methane VOC. Factors are expressed as mg gasoline per litertransferred.
b. Based on an average benzene/VOC ratio of 0.009.
c. Submerged loading is either top or bottom submerged.
d. Splash and submerged loading. Calculated using a Stage 1 control efficiency
of 95 percent.
· Gasoline Vapour and Benzene Emission from a Typical Service
Station :
Table 6 : Gasoline Vapour and Benzene Emission Factors for a Typical Service Station
Emission Source Gasoline Vapour Emission Factora
Ib/1000 gal (mg/liter)Benzene Emission
Factorb Ib/1000 gal (mg/liter)Underground storage Tanks – Tank 11.5(1,380) 0.104(12.4)

Central Pollution Control Board
http://www.cpcbenvis.nic.in/newsletter/benzenefeb2002/feb02phy2.htm[9/6/2012 10:48:04 AM]
Filling Losses – Splash FillUnderground storage Tanks – TankFilling Losses –Submerged Fill
7.3(880) 0.066(7.9)
Underground storage Tanks – TankFilling Losses – Submerged Fillingc
0.3(40) 0.003(0.4)
Underground storage Tanks –Breathing losses
1.0(120) 0.009(1.1)
Vehicle Refuelingd – DisplacementLosses
- Uncontrolled
- Controlled
11.0(1.320)
1.1(132)
0.099(11.9)
0.0099(1.2)
Vehicle Refuelingd – Spillage 0.7(84) 0.0063(0.76)
Source : EPA’s Emission Factors (1993)
a) Typical service station considering a gasoline throughout of 19,000 liters/day (5,000).
b) Based on gasoline emission factor and an average benzene/VOC ratio of 0.009
c) Calculated using a Stage 1 control efficiency of 95 percent.
d) Vehicle refuelling emission factors can also be derived for specific geographic locations and for different seasonsof the year using the MOBILE 5a. EPA’s mobile source emission factor computer model.
· Gasoline Vapour and Benzene Emission from a Typical Bulk Plant :
Table 7 : Gasoline Vapour and Benzene Emission Factors for a Typical
Bulk Plant
Emission Source Gasoline Vapour Emission Factora
Ib/1000 gal (mg/liter)Benzene Emission
Factorb Ib/1000 gal (mg/liter)Storage Tanks – Fixed Roof –Breathing Loss
5.0(600) 0.5(5.4)
Storage Tanks – Fixed Roof –Working Loss Filling
Emptying
9.6(1150)
3.8(460)
0.086(10.3)
0.34(4.1)
Gasoline Loading Racks
Splash Loading
(normal service)
Submerged Loading
(normal service)
11.9(1430)
4.9(590)
0.3(40)
0.107(12.9)
0.044(5.3)
0.002(0.4)

Central Pollution Control Board
http://www.cpcbenvis.nic.in/newsletter/benzenefeb2002/feb02phy2.htm[9/6/2012 10:48:04 AM]
Splash and Submerged Loading
(balance service)C
Source : EPA’s Emission Factors (1993)
(A) Typical bulk plant with gasoline throughout of 19,000 liters/day (5,000 gallons/day)
(B) Based on gasoline emission factors and an average benzene /VOC ratio of
0.009
(C) Calculated using a Stage 1 control efficiency of 95 percent.
· Benzene Emissions from Locomotives and Aircraft Loading and Take Off :
Table 8 : Benzene Emissions Factors for Locomotives and Benzene
Content In Aircraft Loading and Take Off Emission’s
Source Toxic Emission Fraction Emission Factor (Ib/gal) Weight Percent BenzeneLine Haul Locomotive 0.0106a 0.00022 -Yard Locomotive 0.0106a 0.00054 -Military Aircraft - - 2.02Commercial Aircraft - - 1.94Air Taxi Aircraft - - 3.44General Aviation - - 3.91
Source : EPA’s Emission Factors (1993)
a. These fractions are found in Appendix B6 of EPA, 1993, and represent toxic emission fractions for heavy-duty dieselvehicles. Toxic fractions for locomotive are assumed to be the same, since no fractions specific for locomotive areavailable. It should be noted that these fractions are based on g/mile emissions data, whereas emission factors forlocomotives are estimated in Ib/gal. The toxic emission fractions were multiplied by the HC emission factors to obtainthe toxic emission factors.
Toluene and Xylene are used as solvent in rubber and plastic cement and in manufacturing of some compounds. Duringthe production process. Toluene and Xylene vaporised and find their way into the air.
Back to Content

Central Pollution Control Board
http://www.cpcbenvis.nic.in/newsletter/benzenefeb2002/feb02phy3.htm[9/6/2012 10:48:05 AM]
BENZENE IN AIR AND IT'S EFFECT ON HUMAN HEALTH
KINETICS AND METABOLISM :
About 50% of benzene is absorbed by inhalation & absorption of it via skin is limited. The high lipophilicity and lowwater solubility of benzene favour its distribution to fat-rich tissues. Benzene distributed by blood accumulates in fat-richtissues like adipose tissue bone marrow & liver.
Benzene is readily absorbed by the body during inhalation or ingestion and is rapidly distributed throughout the body,particularly in fatty tissues. Metabolism occurs primarily in liver and to less extent in the bone marrow, producing intermediates, which account for the toxicity of benzene. In human, half-life of benzene is 1 - 2 days. Accumulation isnot expected for benzene or its metabolites. Benzene is primarily exhaled through the lungs unchanged or excreted asmetabolites in the urine.
Benzene is oxidized by cytochrome P-450- dependent mixed-function oxidase system. In humans voluntarily exposed to
100ppm (320 mg/m3) benzene for 5 hours, 61% absorbed benzene was metabolised to phenol, 6.4% to catechol & 2% tohydroquinoue while 26% was exhaled unmetabolized. The major part of the metabolites was excreted as sulfate orglucoronic acid conjugates.
Metabolites of benzene are responsible for haematotoxicity. The bio-transformation path ways are the formation ofphenol via epoxide & catcehol via benzene dihydrodiol. Hydro-quinone, catechol and hydroxy hydroquinone areconverted to p-benzosemiquinone and p- benzoquinone, to o-benzoquinone and to o- hydroy-p-benzosemiquinone andhydroxy – p – benzoquinone respectively. The copy of reactions is enclosed.
These metabolites bind covalently to microsomal proteins or mitochondrial DNA metabolism leads to opening of benzenering & this pathway plays a role of heamotoxicity.
Back to Content

Central Pollution Control Board
http://www.cpcbenvis.nic.in/newsletter/benzenefeb2002/feb02phy4.htm[9/6/2012 10:48:06 AM]
BENZENE IN AIR AND IT'S EFFECT ON HUMAN HEALTH
HEALTH EFFECTS :
· General Exposure and Daily Intake :
Benzene is ubiquitous in the environment, resulting in the exposure of most humans to trace levels (or more) of thischemical. Exposure in the general population is primarily to air borne benzene and derives from active and passivetobacco smoke, industrial activities, and use of the automobile (gasoline fumes from refilling, etc. and exhaustemissions). Estimates of the daily amounts of benzene consumed in drinking – water and food-stuffs vary considerablyand are of the order of µg/day. Depending upon the assumptions made with respect to levels of benzene from tobaccoproducts and foodstuffs, estimates for the exposure of the general smoking population in industrialized countries rangefrom 2000 to 3500 µg benzene/day. Adult (70kg) non-smokers are considered to be exposed to about 200 to 1700 µgbenzene/ day (about 3 to 25 µg/kg body weight per day). It would be helpful to have more information on total humanexposure, particularly in developing countries.
Table 8 : Estimated Daily Intake of Benzene* From Different Sources
Sources Conc. in µg
Ambient air - Rural
- urban
15
400
Cigarette smoke - 10 per day
- 20 per day
300
600
Food 100-250
water 1-5
· Sources : Ambient air – Department of the Environment; ( Based on rural daily mean of 0.5 ppb and urban maximumdaily mean of 12.2 ppb at Exhibition Road, London. Intake calculated using the World Health Organisation method)
About 50% of inhaled Benzene in air is absorbed. Benzene intake based on 24 hour exposure volume of 20 m3 at rest
will be 10 mg/day for each 1 mg/m3 benzene in air. The daily adult intake at a typical benzene level of 16 µg/ m3 will,

Central Pollution Control Board
http://www.cpcbenvis.nic.in/newsletter/benzenefeb2002/feb02phy4.htm[9/6/2012 10:48:06 AM]
therefore, be about 160 µg. Together with other pollutants, benzene also participate in photochemical process whichresult in formation of oxidants and smog. Exposure to high level of benzene causes neurotoxic symptoms. Persistentexposure to high level of toxic level of benzene may cause injury to human bone-marrow. Early manifestation oftoxicity are anaemia, leucocytopania or thromo-cytopania. Benzene is a known human carcinogen (IARC Group).
Typical in vehicle and refueling exposure in US in 1987-1991 are reported to be 40 ug/m3 (12ppb) and 288µg/m3 (89ppb), respectively
· Occupational Exposure :
The major factors controlling industrial exposure to benzene are process technology, worker practices and the efficiencyand sophistication of engineering controls. When appropriate engineering controls are in place, available monitoring dataindicate that exposures of workers involved in the production, handling and use of benzene and benzene- containing
materials which vary from non-detectable levels to approximately 15 mg/m3 (8-h TWA), in addition to the amountsestimated for the general population. In developing countries the exposure can be several times higher. Due to thenature of the processes involved, a small percentage of workers may be exposed to more than 320 mg benzene/shift. Insome developing countries, benzene exposure may be sufficiently high to cause acute toxicity. Dermal exposure tobenzene has generally not been included in these estimates.
As regards to permissible level of benzene concentration for occupational exposure, American Conference of
Government Industrial Hygienists prescribes a threshold limit value (TLV) of 0.5 ppm (1622 µg/m3) (TWA). OSHAregulations also call for human exposure limit of less than 0.5 ppm. National Institute of Occupational Safety and Health
(NIOSH) suggests Recommended Exposure Limit (REL) of 320 µg/m3 (o.1ppm)
The results of a Benzene exposure survey study carried out in USA in different Industries & occupations are given in thefollowing table-9.
Table 9 : Percentage of Employees in the USA Potentially Exposed to
Benzene
Industry Sector Percentage of observations in each exposure category accordingto range of 8-b TWA benzene concentrations (mg/m3)
0.32 0.33-1.6 1.61-3.2 3.3-16.0 16.1-32 32+ Total numberof employees
Petrochemical plants 74.6 23.0 2.4 0.0 4300Petroleum refineries 64.6 26.1 4.6 3.8 0.5 0.4 47,547Coke and coal chemicals 0.0 39.3 27.6 27.5 4.4 1.3 947Tyre manufacturers 53.4 37.5 6.3 2.8 0.0 0.0 65,000Bulk terminals 57.8 32.8 5.3 3.7 0.3 0.1 27,095Bulk plants 57.8 32.8 5.3 3.7 0.3 0.1 45,323Transportation via tanktruck
68.4 23.1 5.3 2.9 0.1 0.2 47,600
Total 2,37,812

Central Pollution Control Board
http://www.cpcbenvis.nic.in/newsletter/benzenefeb2002/feb02phy4.htm[9/6/2012 10:48:06 AM]
Thus, a non- smoker living in an unpolluted rural area may be exposed to as little as 120 µg benzene daily, while a 20cigarettes per day smoker living in a city may be exposed to as much as 1,250 µg daily
· Toxicological & Carcinogenic Effects :
Long term exposure to benzene in air causes leukaemia in human beings. In animal studies, leukaemias, lymphomas andother types of tumours are observed. Exposure to benzene is linked to genetic changes, increased proliferation of bonemarrow cells and occurrence of certain chromosomal aberrations in humans and animals. US EPA has classifiedbenzene as Group A human carcinogen. The International Agency for Research on Cancer (IARC), Lyon (France) haslist ed benzene as carcinogenic to humans. In addition a number of noncancer health effects are associated with benzeneexposure such as disorders of blood, harmful effects on bone marrow, anaemia and reduced abilities of blood to clot,damage to immune system and a reproductive and developmental toxicant . WHO estimates a 4 in 1 million risk of
leukaemia on exposure to benzene to a concentration of 1 ug/m3 (0.31 ppb)
High levels of benzene exposure produce haematotoxic effects like leucopenia, lymphopenia & anaemia in laboratoryanimals. Exposure to high levels of benzene causes neurotoxic symptoms.
Substances that can induce benzene –metabolizing enzymes are likely to modify the haematotoxicity of benzene. It hasbeen found that benzene itself, Phenobarbital, Toluene & ethanol can modify the metabolism & haematotoxicity ofbenzene if animals an pretreated with these substance. Toluene has been found to inhibit the metabolism of benzene &decrease its haemototoxicity. Ethanol inhances the haemototoxicity of benzene in mice.
Acute lethal doses of benzene in experimental animals cause narcosis, ventricular tachycardia and respiratory failure.
At benzene concentration above 32 ug/m3 in air, there is a co-relation between phenol excretion in urine and the level ofexposure.
Table 10 : Estimated Percentage of Worker Populations that might develop Bone Marrow Depression or AplasticAnaemia after Chronic Exposure to Benzene
Duration Exposure Bone marrowdepression
Aplastic anaemia
1 year 320 mg/m3 (100 ppm)
160 mg/m3 (50 ppm)
32 mg/m3 (10 ppm)
3.2 mg/m3 (1ppm)
90
50
1
06
10
5
06
06
10 years 320 mg/m3 (100 ppm)
160 mg/m3 (50 ppm)
32 mg/m3 (10 ppm)
3.2 mg/m3 (1ppm)
99
75
5
<1
50
10
06
06

Central Pollution Control Board
http://www.cpcbenvis.nic.in/newsletter/benzenefeb2002/feb02phy4.htm[9/6/2012 10:48:06 AM]
This estimation is an interpretation of the literature and is based on the experience of the Task Group. The speculativenature of this table precludes its use in occasional cases.
The BTX (Benzene Toluene and Xylene) compounds are harmful toxic pollutants causing exposure related health effectsin human beings. This group of volatile organic compounds (VOCs) are evidently carcinogenic in human beings. Theexposure of Benzene may cause respiratory disorders, narcosis, changes in blood pattern, anemia, leucopoenia andleukemia.
Toluene in comparison to Benzene is less toxic may cause drowsiness, impaired coordination etc.. High dose exposure oftoluene can produce kidney and liver damage and hyperplasia of brne marrow, anaemia, depression in central nervoussystem which may lead to impairment of coordination and slowed reaction time.
Acute Xylene exposure may be marked by dizziness, weakness, headache, nausea, vomiting, breathing difficulty and lossof coordination. In severe exposure, there are visuallurring, tremors, heart beat irregulaties, paralysis and loss ofconsciousness.
Due to exposure associated health aspects of BTX compounds, it is becoming increasingly important to screentheir presence and to determine prevailing concentration in the ambient, environment. Benzene is a highly volatilearomatic compound usually component of mineral oil, petrol, coking plant and other products. Benzene is extensivelyutilized as industrial solvent in manufacturing of lacquers varnishes and paint. Benzene escapes from mineral oil andpetrol during storage, transport, loading, unloading or during filling of petrol in motor vehicles. High concentration ofBenzene are encountered in the vicinity of petrol filling stations, fuel tank storage sites, coking plant in the vicinity ofrefineries. Major Benzene emission originates from the motor vehicles .
Back to Content

Central Pollution Control Board
http://www.cpcbenvis.nic.in/newsletter/benzenefeb2002/feb02phy5.htm[9/6/2012 10:48:06 AM]
BENZENE IN AIR AND IT'S EFFECT ON HUMAN HEALTH
METHODOLOGY OF MEASUREMENT:
· Active Sampling:
(I) The charcoal tubes are available in different sizes and contain varying amount of activated charcoal. The tubescontain two layers : the sampling layer and the control layer. The ambient air is sucked through the tubes in a way thatfirst of all, the air flow save the sampling layer. This results in an enrichment of the relevant substances in the activatedcharcoal. Desorption of the absorbed Benzene is done using Carbon Di-Sulphide (CS2). The substances desorbed in the
CS2 are analysed by capillary gas chromatography. A flame ionisation detector (FID) is used for analysis while
quantification is performed using the internal/ external standard.
(II) Thermal desorption tubes are used for absorption of Benzene in place of charcoal tube, for which the samplingmethodology is same as used for charcoal tube. These tubes are directly connected to the thermal disrobers installedwith the gas chromatograph. The thermal desorption techniques offer the advantage of a greatly improved analyticalsensitivity, as solvent is not used in this process and the collected sample is not diluted. In most, cases, analyticalrecovery is close to 100% and desorption efficiency corrections are not required. To be suitable for thermal desorption,sorbents must meet exacting specifications that include low contaminant background, high thermal stability and sufficientadsorptive strength to retain components of interest and should also release them quickly when heat is applied.
· Passive Sampling:
Controlled diffusion with an activated charcoal tube is used to enrich the substances targeted for analysis. A diffusionsampling system comprises a sampling layer and a diffusion path in front of this layer. The diffusion path is filled withporous cellulose acetate, to prevent convection currents. The sample is taken by exposing the tube to ambient air(protected from rain). During this exposure time, the analytes stream into the activated charcoal due to the concentrationgradient between the air and the desorption layer and are absorbed by the charcoal. Once the sample has been collected,the tubes are taken to the laboratory where desorption is done and the substances dissolved in the CS2 are analyzed using
capillary gas chromatography (GC) equipped with flame ionization detector (FID).
Collection (Trapping) of the Air Borne Benzene and Analysis by Gas Chromatography
Gas Chromatography with mass specific and flame ionisation detector (FID) is used to analyse the highly volatileHydrocarbons present in air samples. As these samples contain very low concentration of the substances to be analysed –at level lower than the detection limit of the analytical techniques in question – samples have to be enriched prior to

Central Pollution Control Board
http://www.cpcbenvis.nic.in/newsletter/benzenefeb2002/feb02phy5.htm[9/6/2012 10:48:06 AM]
determination.
Adsorption tubes containing various solid adsorption materials, are used for this purpose. Activated charcoal has highlyfavourable adsorptive properties, particularly for the acquisition of aromatic hydrocarbons in ambient air. There are twoways of enriching the sample test substances collected for analysis – Pumped sampling which involves sucking ofambient air through adsorption tubes by means of a pump and Passive sampling in which tubes are exposed to thesurrounding air and the substances contained in the air are taken up by diffusion. Gas chromatography analysis isperformed after the enriched components are desorbed thermally or using desorbing solvents.
Samples collected through active or passive sampling technique (sorbent tubes) may be desorbed by conventional solvent(generally Carbon disulphide) or thermally (generally using standard automated thermal desorption apparatus). Desorbedsamples may be analyzed using gas chromatograph (GC) fitted with capillary column and flame ionization detector (FID)or mass spectrometric detector (MSD, generally used for confirmation of analytes – USEPA – TO-17 method).
Back to Content
Central Pollution Control Board
http://www.cpcbenvis.nic.in/newsletter/benzenefeb2002/feb02phy6.htm[9/6/2012 10:48:08 AM]
BENZENE IN AIR AND IT'S EFFECT ON HUMAN HEALTH
Concentration of Benzene in Ambient Air in Delhi (CPCB
Measurement) :
· Active Sampling:
Benzene levels in Delhi’s air environment measured as per standard procedure for active sampling (2 hrly thrice a day )using low flow personal pumps for sampling and analysis by using Automated Thermal Desorption (ATD) -capillaryGC-FID. The results are summarized in following table.
Table 11 : Benzene Levels in Delhi’s Urban Environment, 1998
S.No. Location Concentration ug/m3
August, 1998 November 19981. Residential Area 110*
(21-267)
248+
(187-308)2. Traffic intersection 116**
(70-163)
382**
(271-540)3. Petrol Pump 169**
(83-238)
428+
(294-456)
Note 1) * Average of 4 values measured at three location
2) ** Average of 4 values measured at each of four locations
3) + Average of 4 values measured at each of five locations
7. Concentration of Benzene in Ambient Air in Delhi (CPCB
Measurement) :
· Active Sampling:
Benzene levels in Delhi’s air environment measured as per standard procedure for active sampling (2 hrly thrice a day )using low flow personal pumps for sampling and analysis by using Automated Thermal Desorption (ATD) -capillaryGC-FID. The results are summarized in following table.
Table 11 : Benzene Levels in Delhi’s Urban Environment, 1998

Central Pollution Control Board
http://www.cpcbenvis.nic.in/newsletter/benzenefeb2002/feb02phy6.htm[9/6/2012 10:48:08 AM]
S.No. Location Concentration ug/m3
August, 1998 November 19981. Residential Area 110*
(21-267)
248+
(187-308)2. Traffic intersection 116**
(70-163)
382**
(271-540)3. Petrol Pump 169**
(83-238)
428+
(294-456)
Note 1) * Average of 4 values measured at three location
2) ** Average of 4 values measured at each of four locations
3) + Average of 4 values measured at each of five locations
Results clearly indicate increasing order from residential to Traffic intersection to Petrol pump.
· Passive Sampling:
Benzene levels in Delhi’s urban environment measured also as per M/S Drager’s (Germany) standard procedure forpassive sampling (fortnightly basis) i.e. conventional CS2 desorption capillary GC-FID analytical techniques. The results
are summarized in following table.
3
Central Pollution Control Board
http://www.cpcbenvis.nic.in/newsletter/benzenefeb2002/feb02phy6.htm[9/6/2012 10:48:08 AM]
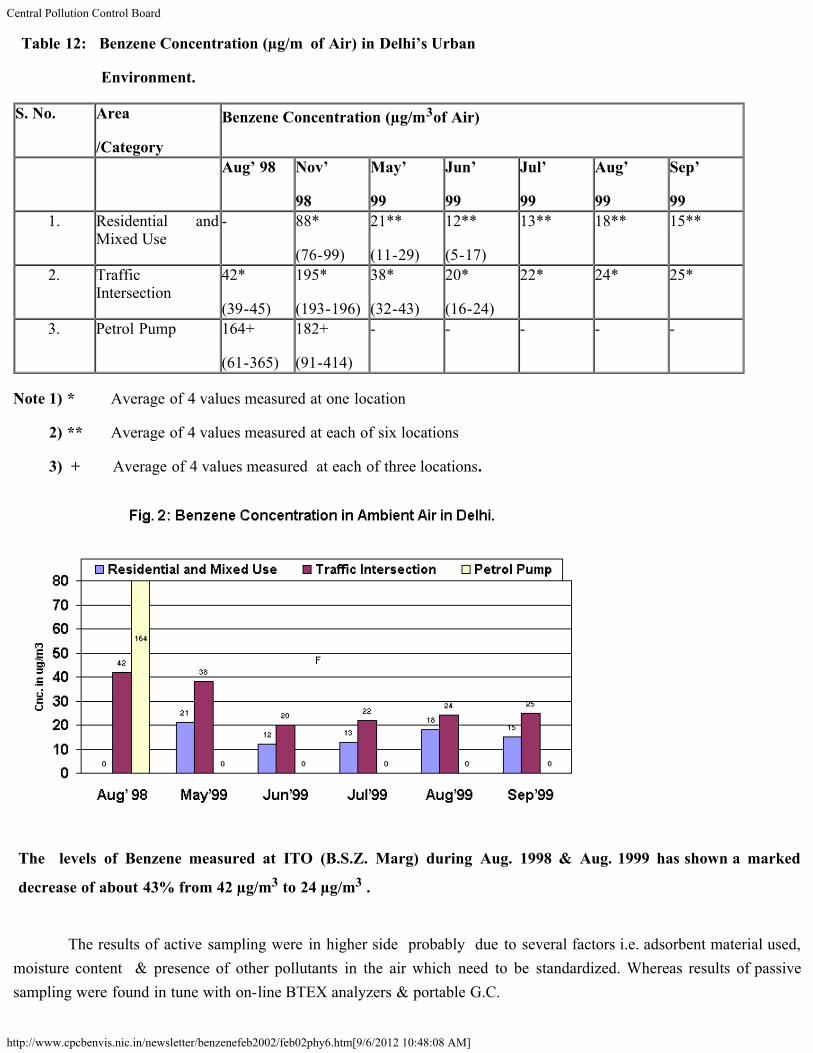
Table 12: Benzene Concentration (µg/m of Air) in Delhi’s Urban
Environment.
S. No. Area
/Category
Benzene Concentration (µg/m3of Air)
Aug’ 98 Nov’
98
May’
99
Jun’
99
Jul’
99
Aug’
99
Sep’
991. Residential and
Mixed Use- 88*
(76-99)
21**
(11-29)
12**
(5-17)
13** 18** 15**
2. TrafficIntersection
42*
(39-45)
195*
(193-196)
38*
(32-43)
20*
(16-24)
22* 24* 25*
3. Petrol Pump 164+
(61-365)
182+
(91-414)
- - - - -
Note 1) * Average of 4 values measured at one location
2) ** Average of 4 values measured at each of six locations
3) + Average of 4 values measured at each of three locations.
The levels of Benzene measured at ITO (B.S.Z. Marg) during Aug. 1998 & Aug. 1999 has shown a marked
decrease of about 43% from 42 µg/m3 to 24 µg/m3 .
The results of active sampling were in higher side probably due to several factors i.e. adsorbent material used,moisture content & presence of other pollutants in the air which need to be standardized. Whereas results of passivesampling were found in tune with on-line BTEX analyzers & portable G.C.

Central Pollution Control Board
http://www.cpcbenvis.nic.in/newsletter/benzenefeb2002/feb02phy6.htm[9/6/2012 10:48:08 AM]
· Routine Benzene Monitoring (Passive sampling) in Delhi :
CPCB has been monitoring Benzene in Delhi at seven locations from May 1999 to April 2000, comprising Residential,Industrial & Commercial areas. Monthly variations in Benzene levels have been shown in Figure-3 .
· The maximum Benzene concentration has been observed at Moti Nagar with 75 µg/m3 during December 2000.
· The minimum Benzene concentration observed at J.N.U. was 6 µg/m3 during June & July 1999.
· Benzene levels during winter season were observed higher & varies between 17 µg/m3 at JNU and 56 µg/m3 at ITO.
Lower values were observed during summer and monsoon ranging between 12 µg/m3 at JNU (both season) and 29 µg/m3
and 24 µg/m3 during monsoon and summer respectively at ITO.
· The monthly average values observed at all locations during monitoring period varies between 15 µg/m3 at JNU and
35µg/m3 at ITO.
· Overall (all seven locations) annual mean Benzene concentration has been calculated 26 µg/m3 during May
1999 to April 2000, which is 1.6 times higher than United Kingdom’s annual running mean standard i.e. 16 µg/m3
( 5 ppb).
Fig.3 : Benzene Level By Passive Sampling in Delhi During May 1999
-2000.

Central Pollution Control Board
http://www.cpcbenvis.nic.in/newsletter/benzenefeb2002/feb02phy6.htm[9/6/2012 10:48:08 AM]
· Routine Benzene Monitoring (Passive sampling) in Kanpur :
CPCB has been monitoring Benzene in Kanpur city at five locations from June 1999 to May 2000, comprisingResidential, Industrial & Commercial areas. Monthly variations in Benzene levels have been shown in Figure: 4.
· The maximum Benzene concentration has been observed at Dada Nagar with 90 µg/m3 during November 1999.
· The minimum Benzene concentration observed at I.I.T. Campus with 3 µg/m3 during September1999.
· Benzene levels during winter season were observed higher & varies between 8 µg/m3 at IIT Campus and 54 µg/m3
at Dada Nagar. Lower values were observed during summer and monsoon ranging between 6 µg/m3 and 5 µg/m3 at IIT
Campus both season and 35 µg/m3 and 33 µg/m3 during summer and monsoon respectively at Parade.
· The monthly average values observed at all locations during monitoring period varies between 7 µg/m3 at IIT
Campus and 41 µg/m3 at Parade.
· Overall (all five locations) annual mean Benzene concentration has been calculated 22 µg/m3 during June 1999 to
May 2000, which is 1.4 times higher than United Kingdom’s annual running mean standard i.e. 16 µg/m3 (5 ppb).
Fig. 4:Benzene Level By Passive Monitoring in Kanpur During 1999-2000

Central Pollution Control Board
http://www.cpcbenvis.nic.in/newsletter/benzenefeb2002/feb02phy6.htm[9/6/2012 10:48:08 AM]
BTX Monitoring in Ambient Air
CPCB initiated Benzene monitoring in ambient air at selected locations with a view to collect background Benzenelevels in ambient air, their seasonal & diurnal variations. Passive monitoring & Benzene is being conducted at 7locations in Delhi (with effect from May1999) and 5 locations in Kanpur (with effect from June 1999) using Orsa5 Drager tubes (German make) containing coconut charcoal on fortnightly basis. Samples thus collected are extractedusing Carbon –di-Sulphide and analysed using Capillary Gas Chromatography with Flame Ionisation Detector.
During one year study period (1999-2000), Benzene concentration range between 6 µg/m3 and 75 µg/m3 in
Delhi with overall average annual average of 26 µg/m3 while Benzene concentration range between 3 µg/m3 and
90 µg/m3 in Kanpur with overall average annual average of 22 µg/m3 .
CPCB also initiated On-line BTX monitoring at selected locations in Delhi. Benzene levels monitored using on-line
BTX analyser (GC-PID based model MLU-950) varies 2.3µg/m3 and 38.1 µg/m3 with overall average of 12.5
µg/m3 average values for Toluene , m,p- Xylene, o- Xylene & Ethyl Benzene were recorded as 40.90, 17.30, 7.0 &
5.6 µg/m3 respectively. BTX analyser has been used to assess half an hourly values round the clock during samplingperiod.
On line Active BTX monitoring in Delhi :
CPCB initiated On-line BTX monitoring at ITO during Nov. 2000 subsequently at CPCB premises at East Arjun Nagar

Central Pollution Control Board
http://www.cpcbenvis.nic.in/newsletter/benzenefeb2002/feb02phy6.htm[9/6/2012 10:48:08 AM]
During Nov. 2000, Feb.2001 & March 2001.
The monitoring of BTX in ambient air was conducted using continuous online instrument (MLU 950 of Synspec) from
28th March to 31st March and from 01st April to 04th April 2001 under foot over bridge at BSZ Marg, I.T.O., from 12th
April to 18th April 2001 in Jhilmil Industrial Area, G.T.Road, Shahdara , from 09th May to 16th May 2001 at National
Physical laboratory, Pusa Road, from 13th to 16th Sept 2001 at Hotal Taj Palace, Dhaula Kuan, from 17th to 21st Sept
2001 at Safdarjung Hospital, from 22nd Sept. to 5th Oct. 2001 at ITO and from 9th to 12th Oct.,2001 at Britannia Chowk,Ring Road.
Results of monitoring of BTEX in µg/m3 are shown in Table-13 and figure 5-8 which shows-
· That average Benzene levels were highest at I.T.O. (BSZ Marg) during winter (Nov. 2000) i.e. 38.1µg/m3 and lowest
at National Physical Laboratory (Pusa Road) during summer (May, 2001) i.e. 2.3 µg/m3 .
· Overall average Benzene conc. for Delhi was calculated 12.5 µg/m3 with 16.5µg/m3 & 7.0 µg/m3 during winterand summer season respectively.
· Toluene level was observed much high than Benzene and other parameter (i.e. Xylene and Ethyl Benzene) which
range between 5.1 µg/m3 at NPL Pusa Road (summer) and 152.0 µg/m3 at ITO, (winter) with overall average of 40.90
µg/m3 . Overall Toluene level was approximately more than 3 times, when compared with Benzene level.
· Overall average levels of m,p Xylene, o-Xylene and Ethyl Benzene were observed 17.3, 7.0 & 5.6 µg/m3
respectively.
· Vehicular pollution seems to be the major contributor of high level at ITO during Nov. 2000 due to higherBenzene content in petrol as compared to Oct. 2001. Benzene content in petrol in National Capital Territory (NCT)and Mumbai has been reduced from 3% to 1% after Nov. 2000.
Table 13: BTX levels observed in Delhi during Nov. 2000 to Oct. 2001. Concentrations in µg/m3 at 25°C Locations Period BenzeneToluene m,p-Xylene o-Xylene Ethyl-BenzeneITO, BSZ Marg Nov. 2000 38.1 152.0 68.4 26.9 21.9East Arjun Nagar Nov. 2000 18.2 73.5 22.1 8.2 7.6East Arjun Nagar Feb. 2001 18.2 41.2 16.7 6.4 5.4East Arjun Nagar Mar. 2001 12.2 30.9 11.5 4.6 4.1ITO, BSZ Marg Mar. 2001 7.4 24.6 14.9 6.4 4.8ITO, BSZ Marg Apr. 2001 7.5 24.0 14.9 6.6 4.8Jhilmil Ind.Area Apr. 2001 5.6 14.5 9.6 4.2 3.1NPL, Pusa Road May. 2001 2.3 5.1 1.4 0.7 0.6Hotel Taj Palace Sept.2001 6.0 16.3 6.3 2.6 1.8SafdarJang Hospita Sept.2001 9.5 27.5 11.2 4.5 3.4

Central Pollution Control Board
http://www.cpcbenvis.nic.in/newsletter/benzenefeb2002/feb02phy6.htm[9/6/2012 10:48:08 AM]
ITO, BSZ Marg Sep-Oct.2001 10.1 31.4 15.1 6.0 4.4Britania Industrychowk Oct.2001 15.5 50.2 15.9 6.8 5.0 Delhi (Nov.2k-Oct.2k1) Minimum 2.3 5.1 1.4 0.7 0.6 Average 12.5 40.9 17.3 7.0 5.6 Maximum 38.1 152.0 68.4 26.9 21.9 Winter 16.5 56.0 22.2 8.8 7.1 Summer 7.0 19.8 10.5 4.5 3.5

Central Pollution Control Board
http://www.cpcbenvis.nic.in/newsletter/benzenefeb2002/feb02phy6.htm[9/6/2012 10:48:08 AM]
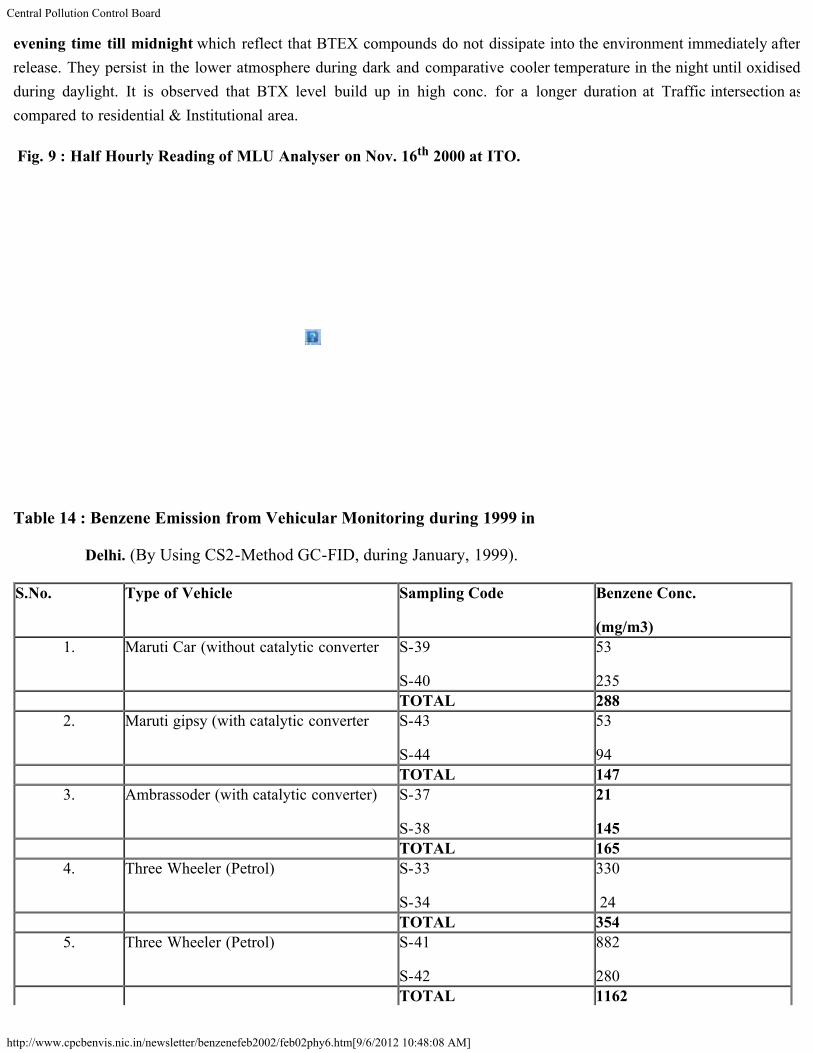
Diurnal Variation :
Half hourly observations show (Figure:9) that concentration of all measured components remain prevalent since

Central Pollution Control Board
http://www.cpcbenvis.nic.in/newsletter/benzenefeb2002/feb02phy6.htm[9/6/2012 10:48:08 AM]
evening time till midnight which reflect that BTEX compounds do not dissipate into the environment immediately afterrelease. They persist in the lower atmosphere during dark and comparative cooler temperature in the night until oxidisedduring daylight. It is observed that BTX level build up in high conc. for a longer duration at Traffic intersection ascompared to residential & Institutional area.
Fig. 9 : Half Hourly Reading of MLU Analyser on Nov. 16th 2000 at ITO.
Table 14 : Benzene Emission from Vehicular Monitoring during 1999 in
Delhi. (By Using CS2-Method GC-FID, during January, 1999).
S.No. Type of Vehicle Sampling Code Benzene Conc.
(mg/m3)1. Maruti Car (without catalytic converter S-39
S-40
53
235 TOTAL 288
2. Maruti gipsy (with catalytic converter S-43
S-44
53
94 TOTAL 147
3. Ambrassoder (with catalytic converter) S-37
S-38
21
145 TOTAL 165
4. Three Wheeler (Petrol) S-33
S-34
330
24 TOTAL 354
5. Three Wheeler (Petrol) S-41
S-42
882
280 TOTAL 1162

Central Pollution Control Board
http://www.cpcbenvis.nic.in/newsletter/benzenefeb2002/feb02phy6.htm[9/6/2012 10:48:08 AM]
6. Two Wheeler Two stroke S-35
S-36
1574
666 TOTAL 2240
7. Two Wheeler Two stroke S-31
S-32
1528
222 TOTAL 1750
Table 15 : Benzene Emission from Vehicular Monitoring during August
1998 in Delhi. (By Using CS2-Method GC-FID During August 1998).
S.No. Type of Vehicle Sampling Code Benzene Conc.
(mg/m3)1. Two Wheeler with Lead Petrol LP1
LP2
1133
176 TOTAL 1309
2. Two wheeler with unlead petrol ULP1
ULP2
226
138 TOTAL 364
esults clearly indicate increasing order from residential to Traffic intersection to Petrol pump.
· Passive Sampling:
Benzene levels in Delhi’s urban environment measured also as per M/S Drager’s (Germany) standard procedure forpassive sampling (fortnightly basis) i.e. conventional CS2 desorption capillary GC-FID analytical techniques. The results
are summarized in following table.
Table 12: Benzene Concentration (µg/m3of Air) in Delhi’s Urban
Environment.
S. No. Area
/Category
Benzene Concentration (µg/m3of Air)
Aug’ 98 Nov’
98
May’
99
Jun’
99
Jul’
99
Aug’
99
Sep’
991. Residential and
Mixed Use- 88*
(76-99)
21**
(11-29)
12**
(5-17)
13** 18** 15**
2. Traffic 42* 195* 38* 20* 22* 24* 25*

Central Pollution Control Board
http://www.cpcbenvis.nic.in/newsletter/benzenefeb2002/feb02phy6.htm[9/6/2012 10:48:08 AM]
Intersection(39-45) (193-196) (32-43) (16-24)
3. Petrol Pump 164+
(61-365)
182+
(91-414)
- - - - -
Note 1) * Average of 4 values measured at one location
2) ** Average of 4 values measured at each of six locations
3) + Average of 4 values measured at each of three locations.
The levels of Benzene measured at ITO (B.S.Z. Marg) during Aug. 1998 & Aug. 1999 has shown a marked
decrease of about 43% from 42 µg/m3 to 24 µg/m3 .
The results of active sampling were in higher side probably due to several factors i.e. adsorbent material used,moisture content & presence of other pollutants in the air which need to be standardized. Whereas results of passivesampling were found in tune with on-line BTEX analyzers & portable G.C.
· Routine Benzene Monitoring (Passive sampling) in Delhi :
CPCB has been monitoring Benzene in Delhi at seven locations from May 1999 to April 2000, comprising Residential,Industrial & Commercial areas. Monthly variations in Benzene levels have been shown in Figure-3 .
· The maximum Benzene concentration has been observed at Moti Nagar with 75 µg/m3 during December 2000.

Central Pollution Control Board
http://www.cpcbenvis.nic.in/newsletter/benzenefeb2002/feb02phy6.htm[9/6/2012 10:48:08 AM]
· The minimum Benzene concentration observed at J.N.U. was 6 µg/m3 during June & July 1999.
· Benzene levels during winter season were observed higher & varies between 17 µg/m3 at JNU and 56 µg/m3 at ITO.
Lower values were observed during summer and monsoon ranging between 12 µg/m3 at JNU (both season) and 29 µg/m3
and 24 µg/m3 during monsoon and summer respectively at ITO.
· The monthly average values observed at all locations during monitoring period varies between 15 µg/m3 at JNU and
35µg/m3 at ITO.
· Overall (all seven locations) annual mean Benzene concentration has been calculated 26 µg/m3 during May
1999 to April 2000, which is 1.6 times higher than United Kingdom’s annual running mean standard i.e. 16 µg/m3
( 5 ppb).
Fig.3 : Benzene Level By Passive Sampling in Delhi During May 1999
-2000.
· Routine Benzene Monitoring (Passive sampling) in Kanpur :
CPCB has been monitoring Benzene in Kanpur city at five locations from June 1999 to May 2000, comprising

Central Pollution Control Board
http://www.cpcbenvis.nic.in/newsletter/benzenefeb2002/feb02phy6.htm[9/6/2012 10:48:08 AM]
Residential, Industrial & Commercial areas. Monthly variations in Benzene levels have been shown in Figure: 4.
· The maximum Benzene concentration has been observed at Dada Nagar with 90 µg/m3 during November 1999.
· The minimum Benzene concentration observed at I.I.T. Campus with 3 µg/m3 during September1999.
· Benzene levels during winter season were observed higher & varies between 8 µg/m3 at IIT Campus and 54 µg/m3
at Dada Nagar. Lower values were observed during summer and monsoon ranging between 6 µg/m3 and 5 µg/m3 at IIT
Campus both season and 35 µg/m3 and 33 µg/m3 during summer and monsoon respectively at Parade.
· The monthly average values observed at all locations during monitoring period varies between 7 µg/m3 at IIT
Campus and 41 µg/m3 at Parade.
· Overall (all five locations) annual mean Benzene concentration has been calculated 22 µg/m3 during June 1999 to
May 2000, which is 1.4 times higher than United Kingdom’s annual running mean standard i.e. 16 µg/m3 (5 ppb).
Fig. 4:Benzene Level By Passive Monitoring in Kanpur During 1999-2000
BTX Monitoring in Ambient Air
CPCB initiated Benzene monitoring in ambient air at selected locations with a view to collect background Benzenelevels in ambient air, their seasonal & diurnal variations. Passive monitoring & Benzene is being conducted at 7

Central Pollution Control Board
http://www.cpcbenvis.nic.in/newsletter/benzenefeb2002/feb02phy6.htm[9/6/2012 10:48:08 AM]
locations in Delhi (with effect from May1999) and 5 locations in Kanpur (with effect from June 1999) using Orsa5 Drager tubes (German make) containing coconut charcoal on fortnightly basis. Samples thus collected are extractedusing Carbon –di-Sulphide and analysed using Capillary Gas Chromatography with Flame Ionisation Detector.
During one year study period (1999-2000), Benzene concentration range between 6 µg/m3 and 75 µg/m3 in
Delhi with overall average annual average of 26 µg/m3 while Benzene concentration range between 3 µg/m3 and
90 µg/m3 in Kanpur with overall average annual average of 22 µg/m3 .
CPCB also initiated On-line BTX monitoring at selected locations in Delhi. Benzene levels monitored using on-line
BTX analyser (GC-PID based model MLU-950) varies 2.3µg/m3 and 38.1 µg/m3 with overall average of 12.5
µg/m3 average values for Toluene , m,p- Xylene, o- Xylene & Ethyl Benzene were recorded as 40.90, 17.30, 7.0 &
5.6 µg/m3 respectively. BTX analyser has been used to assess half an hourly values round the clock during samplingperiod.
On line Active BTX monitoring in Delhi :
CPCB initiated On-line BTX monitoring at ITO during Nov. 2000 subsequently at CPCB premises at East Arjun NagarDuring Nov. 2000, Feb.2001 & March 2001.
The monitoring of BTX in ambient air was conducted using continuous online instrument (MLU 950 of Synspec) from
28th March to 31st March and from 01st April to 04th April 2001 under foot over bridge at BSZ Marg, I.T.O., from 12th
April to 18th April 2001 in Jhilmil Industrial Area, G.T.Road, Shahdara , from 09th May to 16th May 2001 at National
Physical laboratory, Pusa Road, from 13th to 16th Sept 2001 at Hotal Taj Palace, Dhaula Kuan, from 17th to 21st Sept
2001 at Safdarjung Hospital, from 22nd Sept. to 5th Oct. 2001 at ITO and from 9th to 12th Oct.,2001 at Britannia Chowk,Ring Road.
Results of monitoring of BTEX in µg/m3 are shown in Table-13 and figure 5-8 which shows-
· That average Benzene levels were highest at I.T.O. (BSZ Marg) during winter (Nov. 2000) i.e. 38.1µg/m3 and lowest
at National Physical Laboratory (Pusa Road) during summer (May, 2001) i.e. 2.3 µg/m3 .
· Overall average Benzene conc. for Delhi was calculated 12.5 µg/m3 with 16.5µg/m3 & 7.0 µg/m3 during winterand summer season respectively.
· Toluene level was observed much high than Benzene and other parameter (i.e. Xylene and Ethyl Benzene) which
range between 5.1 µg/m3 at NPL Pusa Road (summer) and 152.0 µg/m3 at ITO, (winter) with overall average of 40.90
µg/m3 . Overall Toluene level was approximately more than 3 times, when compared with Benzene level.
· Overall average levels of m,p Xylene, o-Xylene and Ethyl Benzene were observed 17.3, 7.0 & 5.6 µg/m3

Central Pollution Control Board
http://www.cpcbenvis.nic.in/newsletter/benzenefeb2002/feb02phy6.htm[9/6/2012 10:48:08 AM]
respectively.
· Vehicular pollution seems to be the major contributor of high level at ITO during Nov. 2000 due to higherBenzene content in petrol as compared to Oct. 2001. Benzene content in petrol in National Capital Territory (NCT)and Mumbai has been reduced from 3% to 1% after Nov. 2000.
Table 13: BTX levels observed in Delhi during Nov. 2000 to Oct. 2001. Concentrations in µg/m3 at 25°C Locations Period BenzeneToluene m,p-Xylene o-Xylene Ethyl-BenzeneITO, BSZ Marg Nov. 2000 38.1 152.0 68.4 26.9 21.9East Arjun Nagar Nov. 2000 18.2 73.5 22.1 8.2 7.6East Arjun Nagar Feb. 2001 18.2 41.2 16.7 6.4 5.4East Arjun Nagar Mar. 2001 12.2 30.9 11.5 4.6 4.1ITO, BSZ Marg Mar. 2001 7.4 24.6 14.9 6.4 4.8ITO, BSZ Marg Apr. 2001 7.5 24.0 14.9 6.6 4.8Jhilmil Ind.Area Apr. 2001 5.6 14.5 9.6 4.2 3.1NPL, Pusa Road May. 2001 2.3 5.1 1.4 0.7 0.6Hotel Taj Palace Sept.2001 6.0 16.3 6.3 2.6 1.8SafdarJang Hospita Sept.2001 9.5 27.5 11.2 4.5 3.4ITO, BSZ Marg Sep-Oct.2001 10.1 31.4 15.1 6.0 4.4Britania Industrychowk Oct.2001 15.5 50.2 15.9 6.8 5.0 Delhi (Nov.2k-Oct.2k1) Minimum 2.3 5.1 1.4 0.7 0.6 Average 12.5 40.9 17.3 7.0 5.6 Maximum 38.1 152.0 68.4 26.9 21.9 Winter 16.5 56.0 22.2 8.8 7.1 Summer 7.0 19.8 10.5 4.5 3.5

Central Pollution Control Board
http://www.cpcbenvis.nic.in/newsletter/benzenefeb2002/feb02phy6.htm[9/6/2012 10:48:08 AM]

Central Pollution Control Board
http://www.cpcbenvis.nic.in/newsletter/benzenefeb2002/feb02phy6.htm[9/6/2012 10:48:08 AM]
Diurnal Variation :
Half hourly observations show (Figure:9) that concentration of all measured components remain prevalent since
Central Pollution Control Board
http://www.cpcbenvis.nic.in/newsletter/benzenefeb2002/feb02phy6.htm[9/6/2012 10:48:08 AM]
evening time till midnight which reflect that BTEX compounds do not dissipate into the environment immediately afterrelease. They persist in the lower atmosphere during dark and comparative cooler temperature in the night until oxidisedduring daylight. It is observed that BTX level build up in high conc. for a longer duration at Traffic intersection ascompared to residential & Institutional area.
Fig. 9 : Half Hourly Reading of MLU Analyser on Nov. 16th 2000 at ITO.
Table 14 : Benzene Emission from Vehicular Monitoring during 1999 in
Delhi. (By Using CS2-Method GC-FID, during January, 1999).
S.No. Type of Vehicle Sampling Code Benzene Conc.
(mg/m3)1. Maruti Car (without catalytic converter S-39
S-40
53
235 TOTAL 288
2. Maruti gipsy (with catalytic converter S-43
S-44
53
94 TOTAL 147
3. Ambrassoder (with catalytic converter) S-37
S-38
21
145 TOTAL 165
4. Three Wheeler (Petrol) S-33
S-34
330
24 TOTAL 354
5. Three Wheeler (Petrol) S-41
S-42
882
280 TOTAL 1162

Central Pollution Control Board
http://www.cpcbenvis.nic.in/newsletter/benzenefeb2002/feb02phy6.htm[9/6/2012 10:48:08 AM]
6. Two Wheeler Two stroke S-35
S-36
1574
666 TOTAL 2240
7. Two Wheeler Two stroke S-31
S-32
1528
222 TOTAL 1750
Table 15 : Benzene Emission from Vehicular Monitoring during August
1998 in Delhi. (By Using CS2-Method GC-FID During August 1998).
S.No. Type of Vehicle Sampling Code Benzene Conc.
(mg/m3)1. Two Wheeler with Lead Petrol LP1
LP2
1133
176 TOTAL 1309
2. Two wheeler with unlead petrol ULP1
ULP2
226
138 TOTAL 364
Back to Content

Central Pollution Control Board
http://www.cpcbenvis.nic.in/newsletter/benzenefeb2002/feb02phy7.htm[9/6/2012 10:48:10 AM]
BENZENE IN AIR AND IT'S EFFECT ON HUMAN HEALTH
BENZENE LEVELS IN MAJOR CITIES OF THE WORLD :
Table 16 : Benzene levels in major cities of the World.
Location Benzene Concentration (ug/m3 ) Reference Mean Maximum Houston, Texas, USA (1980) 18.8 122.9 Singh et al. (1982)Pittsburgh, PA, USA (1981) 16.3 210.6 Singh et al (1982)Oslo, Norway, (1980) 40.0 114.0 Wathne (1983)Rhine area, Germany, (1983) 4.6-22.4 - Bruckman et al. (1983)Black Forest, Germany (1983) 2.0 - Bruckman et al. (1983)London, England (1983) 23.0 85.0 Clark et al. (1984)Bilthven, Netherlands (1982-83) 2.8 10.4 RIVM (1988)Delhi, India (1999-2000) 25.0
13.0
75.0
38.0
CPCB Study, 1999-2000
CPCB Study, 2000-2001Berlin 49.0 Seifert and(1975-76) 43.4 Ullrich (1978) 68.9 Stockholm (20 min values) 84 Jonsson and Berg (1978) 460 Helsinki (2 h value) 100 Hasanen et al. (1981)Zurich 188 Grob and Grob (1971)Belgium (Brussel 68 sites 1994 1.6-11.3 *Denmark (Copenhagen 1995-96) 1995-96*Italy (Bari 8 sites 1993) 2.0-4.9 1993*Germany (13 cities 1993) 2.0-4.9 1993*Sweden (28 cities winter 1995-96) 2.1-5.0 1995-96*Netherlands (3 cities 1993-94) 2.4-4.7 1993-94*U.K.( 6 cities 1994) 2.2-4.8 1994*US Urban (1987-1990) 4-7 1987-1990*
* Source – WHO.

Central Pollution Control Board
http://www.cpcbenvis.nic.in/newsletter/benzenefeb2002/feb02phy7.htm[9/6/2012 10:48:10 AM]
Back to Content

Central Pollution Control Board
http://www.cpcbenvis.nic.in/newsletter/benzenefeb2002/feb02phy8.htm[9/6/2012 10:48:11 AM]
BENZENE IN AIR AND IT'S EFFECT ON HUMAN HEALTH
AIR QUALITY STANDARD FOR BENZENE :
UK Expert Panel on Air Quality Standards :
As regards exposure to general public UK Expert Panel on Air Quality Standards have recommended 5 ppb (16 µg/m3 )
as a rolling annual mean ;with a target of 1 ppb (3.2 µg/m3 ) for benzene concentration in air . Also they haverecommended that this Standard be reduced to the lower level of 1 ppb running annual average, and that the Governmentset a target date by which this be achieved.
European Commission Limit Value for Benzene :
The limit value must be expressed in µg/m3, standardized at a temperature of 293 K (20*C) and a pressure of 101.3 kPa.
Averaging period Limit Value Margin of tolerance Date by which limitvalue is to be met
Limit value for theprotection of humanhealth
Calendar year 5 ug/m3 5 ug/m3 (100 %) on 13December 2000, reducing on 1January 2006 and every 12months thereafter by 1 ug/m3 to reach 0% by 1 January 2010
1 January 2010 (1)
(1) Except within zones and agglomerations within which a time-limited extension has been agreed in accordance withArticle 3(2)n m
Air Quality Standards for Benzene in Different Countries
Country Standard Concentration measured as To be achieved byUK 16 ug/m3 – running annual mean 31st Dec., 2003European Commission 5 ug/m3 –annual average 31st Dec., 2010Japan 3 ug/m3 annual average* Existing StandardWHO Guidelines 5-20 ug/m3
* Prefer GC-MS (sample to be collected with canister or tube or its equivalent method).
Back to Content

Central Pollution Control Board
http://www.cpcbenvis.nic.in/newsletter/benzenefeb2002/feb02phy9.htm[9/6/2012 10:48:12 AM]
BENZENE IN AIR AND IT'S EFFECT ON HUMAN HEALTH
GASOLINE BENZENE REDUCTION PROGRAM IN INDIA :
Period Benzene Content Area CoveredBefore 1996
April, 1996
April , 2000
November, 2000
No specification
5%
3%
1%
Entire country
Entire Country
Metropolitan Cities
National Capital Territory(NCT) and Mumbai
Source: Air quality Status and trends, CPCB Report NAAQMS/14/2000-2001
Table 17: Specifications for Petrol in India and Europe
PARAMETERS SPECIFICATIONS India 20001 Mukhapadhyay
Committee 20052Europe20003
Europe20053
USA RFG-34
Sulphur
(per cent by weight)
0.1-0.5 0.03 0.015 0.005 0.002
Aromatics
(per cent by Volume)
No limit 45 42 35 25
Olefins
(per cent by Volume)
No limit 18 18 14-16 6
Benzene
(per cent by Volume)
3-5 1(in six metros)
3 (rest of the country)
1 1 0.8
Sources
1. A P Ram 2001, Advisor (refineries), Ministry of Petroleum and Natural Gas, Presentation on Fuel Qualitytrends in India, paper presented in Workshop on Automotive Technologies and Fuel Quality for EnvironmentalProtection, Indian Oil Corporation (R&D Centre), Indian Institute of Petroleum Management, Gurgaon, January 15-17,2001.
2. Anon 2001, Recommendations of Various Committees for Fuel Quality for year 2005, Central PollutionControl Board, January 31, 2001, mimeo.
3. D Visser 2001, shall Global Solutions, The Netherlands, Clean Fuel Specifications Development and impact on

Central Pollution Control Board
http://www.cpcbenvis.nic.in/newsletter/benzenefeb2002/feb02phy9.htm[9/6/2012 10:48:12 AM]
Refineries in Europe, paper presented in Workshop on Automotive Technologies and Fuel Quality for EnvironmentalProtection, Indian Oil Corporation (R&D Centre), Indian Institute of Petroleum Management, Gurgaon, January 15-17,2001.
4. Anon 2000, The California Reformulated Gasoline Regulations, Title 13, California Code of Regulations,Sections 2250-2273 (as last amended June 16, 2000), California Air resources Board, www.arb.ca.gov. as on January 29,2001.
Progressive Phase out of Benzene content in gasoline in Different Countries :
Many countries are progressively bringing down benzene content in gasoline towards 1 vol.% max.
Country Year Banzene, Vol % max
USA 1995 1.0EU 1985
2000
5.0
1.0Austria 1990 3.0
Italy 1993
1997
1999
3.0
1.4
1.0Finland 1993
1994
3.0 (95%) Encourages
1.0 do
In India it is desirable to target a maximum benzene concentration of 1.0 vol % keeping in view the high ambienttemperatures. In addition there is need to control the aromatic content of gasoline and install vapour recovery systemduring storage, loading and unloading operations in different stages of product handling from refineries to vehicle tanks.
Back to Content
Central Pollution Control Board
http://www.cpcbenvis.nic.in/newsletter/benzenefeb2002/feb02phy10.htm[9/6/2012 10:48:13 AM]
BENZENE IN AIR AND IT'S EFFECT ON HUMAN HEALTH
REFERENCES :
1. Air Quality Status and Trends, CPCB Report NAAQMS/14/2000-2001.
2. CPCB Parivesh Newsletter. ‘Vehicular Pollution’ June 1999, vol. 6 (I).
3. CPCB Parivesh Newsletter. ‘Air Pollution & Human Health’ Sept.2001.
4. Directive 2000 / 69 / EC of the European Parliament & of the Council, 16th November 2000.
5. Expert Panel on Air Quality Standards, Dept. of Environment, (U.K.)
6. Who Guideline, 1999.
7. Down to Earth, February 28, 2001.
8. Project Draft / Final Report entitled ‘‘Estimation of Benzene in Ambient Air, Its impact on Health in Mumbai’’conducted by NEERI and sponsored by CPCB, New Delhi (April, 2001).
9. Tyagi, S.K.; Kamyotra, J.S.; Makhijani,S.D.; Sengupta, B.; Henschel , P.; ‘‘Benzene Monitoring in UrbanEnvironment’’. Proceedings of the New Millennium Conference . ‘‘ Retrospect of Indian research on Environmental
Pollution : Focus 21st Centuary’’, New Delhi, November,. 1999.
10. WHO, Environmental Health Criteria Document –150 :Benzene, International Programme on Chemical Safety(IPCS), 1993 .
11. Berite, M.W. Measurement of Benzene, Toluene & Xylene in Urban Air. Atm. Environ. Vol-17 (9), 1983 :1713-1722
12. Monitoring of Benzene levels in Ambient Air of Delhi, CPCB Report, TOS/1/1999-2000.
Back to Content

ENVIS Centre, CPCB,Delhi, India
http://www.cpcbenvis.nic.in/newsletter//news.htm[9/6/2012 10:48:14 AM]
About Envis
Air Pollution
Water Pollution
Noise Pollution
Publications
News Letters
Annual Report
Highlights
News
Team
Home
News Letters
Water Quality Management in IndiaBio-mapping of Rivers - Case study Assam State - August-2005Sewage Pollution -February 2005Dioxin(PCDDs) And Furan(PCDFs) -December 2004Solid Waste Management in Slaughter House -September 2004Polycyclic Aromatic Hydrocarbons (PAHs) In Air And Their Effects On Human Health -November 2003Bio-monitoring of wetlands in wildlife habitats of India Part - I Bird Sanctuaries - July 2003Transport Fuel Adulteration - July 2003
Groundwater - July 2003R&D for Pollution Control CPCB Initiatives - June 2003
Inspection/Maintenance & Certification System for In-use Vehicles - May 2003
Alternative Transport Fuels An Overview-April 2003Odour Pollution and its Control - January 2003
Public Interest Litigations - December 2002
Climate Change - October 2002
Biodiesel As Automobile Fuel - September 2002
Benzene in Air and its Effect on Human Health - February 2002Air Pollution And Human Health-September 2001
Polychlorinated Biphenyls (PCBs) - December 2001
Environmental Management Plan Kanpur Urban Area- May 2001
Bio-Monitoring of Water Quality in Problem Areas - April 2001
Environmental Management System- February 2001
Common Effluent Treatment Plants - November 2000
Polluting Industries
Clean Coal Initiatives - June 2000
Bio-Mapping Of Rivers - March 1999
Auto Emissions - June 1999
Technologies for Pollution Control Industry - October 1999
Hazardous Waste Management - June 1998
Plastic Waste Management - September 1998
Municipal Solid Wastes - June 1997
Click here for LATEST Newsletters

ENVIS Centre, CPCB,Delhi, India
http://www.cpcbenvis.nic.in/newsletter//news.htm[9/6/2012 10:48:14 AM]
Cleaner Production Options for Pulp & Paper Industry - Sept 1997
Zoning Atlas For Siting Industries - June 1996
Bio-Monitoring of Water - September, 1995
Assessment and Development Study of River Basin - March 1995
Depletion of Ozone Layer and Its Implications - September 1994
Agro - based Industries - December 1994