central institute of technology final report · report of central institute of technology for the...
TRANSCRIPT

.
Central Institute of Technology
Final Report 1 January 2016 to 10 April 2016

Central Institute of Technology | 2016 Final Report 2
Statement of Compliance Executive Summary
Appointment of the Reporting Officer Compliance with Written Law Organisational Structure
Corporate Governance Compliance
Functions Report on Operations Financial Statements
Notes
Locked Bag 6
Northbridge WA 6865 T: 1300 300 822
W: www.central.wa.edu.au

Central Institute of Technology | 2016 Final Report 3
Hon Liza Harvey MLA Minister for Police; Road Safety; Training and Workforce Development; Women's Interests
In accordance with Section 63 of the Financial Management Act 2006, I hereby submit for your information and presentation to Parliament, the Annual Report of Central Institute of Technology for the period January 1 2016 to April 10 2016. The Report has been prepared in accordance with the terms of the appointment of the Reporting Officer, as outlined by the Treasurer and the provisions of the Financial Management Act 2006.
Satvinder Sekhon Reporting Officer 14 June 2016

Central Institute of Technology | 2016 Final Report 4
In October 2015, The Minister for Training and Workforce Development launched the Training Sector Reform Project (Reform Project) to examine the function and structure of Western Australia’s public training sector. The purpose of the Reform Project is to ensure a robust and sustainable public vocational education and training (VET) sector with high quality training that is accessible and equitable to the community and that supports improved outcomes for students. As a result of the State Government’s Training Sector Reform Project from 11 April 2016, the 11 former Institutes and their 70 campus locations will be managed by a network of five TAFE colleges. The five new TAFE colleges will be named North Metropolitan TAFE, South Metropolitan TAFE, North Regional TAFE, Central Regional TAFE and South Regional TAFE. New arrangements will also be introduced that will see greater collaboration among the network of colleges, allowing resources and expertise to be shared across WA. This will give students, particularly those in regional areas, access to more diverse training programs. The reforms will also see the reinstatement of the TAFE brand, in recognition of the strong historical association and awareness by local communities. As a result of the reform operations, students and staff at Central Institute of Technology (Central) will transition to North Metropolitan TAFE from April 11, 2016. Therefore outcomes relating to Central Institute of Technology will be reported on in the amalgamated TAFE’s end of financial year reporting.

Central Institute of Technology | 2016 Final Report 5
Under Section 68(1) of the Finance Management Act 2006 (FMA) it is necessary to appoint a Reporting Officer, to perform the duties in relation to the final reports for the abolished Institute. Approval was sought for the Treasurer to appoint a reporting officer who is responsible for the preparation of the final reports for any Institute closed by the reform. The report will be for the period 1 January 2016 to 10 April 2016 inclusive and include a set of financial statements and notes (including 2015 comparatives), an abridged report on operations and not include key performance indicators. The final report is to be submitted to the Minister for The Department of Training and Workforce Development within 90 days from the closure date of Central Institute of Technology, to be tabled in Parliament 14 days after that.

Central Institute of Technology | 2016 Final Report 6
Enabling Legislation Central Institute of Technology was established as a Statutory Authority in 1996 under section 35 of the Vocational Education and Training Act 1996. Legislation Administered The Minister for Training and Workforce Development administers the Vocational Education and Training Act 1996. Legislation Impacting on the Institutes Activities Central complies with the following relevant legislation: Archive Act 1983, Commonwealth Children and Community Services Act 2004 Classification Enforcement Act 1996 Commercial Tenancy (Retail Shops) Agreements Act 1985 Constitution Act 1889 Copyright Act 1968, Commonwealth Corruption and Crime Commission Act 2003 Disability Services Act 1993 Education Service Providers (Full Fee Overseas Students) Registration Act 1991 Education Services for Overseas Students Act 2000, Commonwealth Electoral Act 1907 Equal Opportunity Act 1984 Financial Management Act 2006 Freedom of Information Act 1992 Government Employees Superannuation Act 1987 Income Tax Assessment Act 1997, Commonwealth Industrial Relations Act 1979 Library Board of Western Australia Act 1951 Minimum Conditions of Employment Act 1993 Occupational Safety and Health Act 1984 Privacy Act 1988, Commonwealth

Central Institute of Technology | 2016 Final Report 7
Public Interest Disclosure Act 2003 Public Sector Management Act 1994 Spam Act 2003, Commonwealth State Records Act 2000 State Supply Commission Act 1991 Vocational Education and Training Act 1996 Workers’ Compensation and Injury Management Act 1981 Working with Children (Criminal Record Checking) Act 2004

Central Institute of Technology | 2016 Final Report 8
Central Institute of Technology was established as a statutory authority on 1 January 1997 under Section 35 of the Vocational and Education and Training Act 1996. The Institute is a body corporate with the Institute Governing Council established as the accountable authority. In 2016, Central Institute of Technology was responsible to Hon Liza Harvey MLA, Minister for Training and Workforce Development, with the primary purpose of delivering vocational education and training and other related activities determined by the Minister.

Central Institute of Technology | 2016 Final Report 9
Governing Council
Central’s Governing Council is responsible for overseeing the Institute’s operations and affairs. Whilst the Governing Council is the ultimate authority in the Institute, it delegates its powers as the employing authority and manager to the Managing Director. The Governing Council is responsible for ensuring that all delegations are carried out diligently and effectively.
The Governing Council consists of a Chairperson, Deputy Chairperson, the Managing Director and between 6 and 10 other members appointed by the Minister for Training and Workforce Development. Members are selected for their experience and expertise in education, training, industry or community affairs and for their ability to contribute to the strategic direction of the Institute.
Governing Council Members 2016
Name Position
Emeritus Professor William Louden AM Chairperson
Mr Peter Browne (Deputy Chair) Deputy Chair
Mr Stedman Ellis Member
Ms Mara West Member
Mr Paul Jones Member
Ms Joanne Farrell Member
Ms Dorothy Collins Member
Ms Dianne Bianchini Member
Mr Neil Fernandes Ex Officio Member

Central Institute of Technology | 2016 Final Report 10
College Executive
The Executive Management Team consists of the Managing Director, Executive Directors, Chief Financial Officer and Director Organisational Development. The Executive Management Team has overall responsibility for the day-to-day effective and efficient operation of the Institute, and undertakes strategic and business planning. Members chair the governance boards and committees at Central.
College Executive Members 2016
Name Position
Mr Neil Fernandes Managing Director
Mr Andrew Mulvey Executive Director, Business Services
Dr Derek Swarts A/Executive Director, Health and Community Services
Dr Peter Ebell Executive Director, Engineering, Resources and Construction
Ms Julie Zappa Executive Director, Creative Industries
Ms Melanie Sorensen Executive Director, Strategy and Development
Ms Jane Nicolson Director, Organisational Development
Mr Dominick Geraghty Chief Finance Officer

Central Institute of Technology | 2016 Final Report 11
Public Sector Standards and Ethical Codes (Breaches)
In 2016, for the period of January 1st to April 8th, Central received a total of 1 breach of standard claims. This breach was in relation to an alleged breach of the Employment Standards.
Codes of Ethics and Codes of Conduct (Ethical Codes) In early 2016, Central implemented an Integrity Framework that aligned with the Public Sector Code of Ethics. The framework comprises of policies and
key documents relating to integrity that provides staff with a clear understanding of their obligations as public sector employees. The framework is accessible to staff on Central’s intranet.
Public Interest Disclosures Central Institute of Technology does not tolerate corrupt or other improper conduct, including mismanagement of public resources, in the exercise of the public functions of the Institute and its officers, employees and contractors. Central’s Corporate Governance Policy outlines Central’s expectations of Central’s employees, and the Institute’s Public Interest Disclosure (PID) Procedure provides staff with the appropriate information on how and when to make a PID disclosure, and to whom. Record Keeping Plan In the period January 1st to April 8th 2016 Central staff created approximately 11,000 documents and 250 new containers in the TRIM system. Continuing from 2015, Central continued to mandate induction training for new employees. Records Management responsibilities was a component of the induction training. Corporate information staff continued to provide TRIM Records Management training. These sessions were provided as: • Classroom training sessions; and • One to one training for new staff and refresher training for existing staff Corporate Information Staff completed training in the following: • 2 staff members completed Diploma in Recordkeeping qualifications • 1 staff member completed Diploma in Business Management (Customer Service) • 1 staff member completed TRIM system (HPRM8) Administrator Training
Freedom of Information For the period of January 1st to April 8th there have been 3 applications for information under Freedom of Information. Two applications have been completed and one application is ongoing.

Central Institute of Technology | 2016 Final Report 12
Complaints Central Institute of Technology has a complaints management system and procedure designed to handle all student and service complaints. All complaints are managed confidentially, efficiently, promptly and impartially in compliance with the Standards for Registered Training Organisations (RTOs) 2015 and the Australian standard on effective complaints handling (AS/NZS 10002:2014). Central’s complaints policy provides for students and other stakeholders the opportunity to lodge a complaint by means of the agency’s website, by mail, by email, by contacting Central’s Student Services or directly with the Complaints Management Officer. In early 2016, Central’s Customer Complaints Policy, Customer Complaints Procedure Policy and Customer Complaints Appeal Procedure Policy were all reviewed and updated accordingly. For the period 1 January 2016 to 10 April 2016, a total of 32 complaints were registered of which a total of 23 complaints were lodged by current students. The total of 32 student complaints for this period of 1 January 2016 to 8 April 2016 represents 0.13% of the student population of 17,493. The balance of the 9 registered complaints arose from complaints referred by members of the public, 1 by a parent and in 1 case classified as ‘other’ lodged by a stakeholder employed by an outside contractor for security services to Central. The total registered complaints were resolved as follows: 22 by Central’s internal processes to the satisfaction of all parties, 1 was referred to an alternate process, 1 did not require any action and 8 remain open and ongoing. There were no applications for appeal against the sanctions imposed under Central’s Student Code of Conduct and By-Laws or the outcome of a registered complaint.

Central Institute of Technology | 2016 Final Report 13
Advertising In accordance with Section 175ZE of the Electoral Act 1907, the following is a statement for all expenditure incurred by Central Institute of Technology during 2016 in relation to advertising, market research, polling, direct mail and media advertising organisations: 1. The total expenditure for the 2016 period was $49,667.23 2. Expenditure was incurred in the following areas:
Occupational Safety and Health In 2016, the Occupational Safety and Health team have been focused upon implementing the recommendations made in the Compliance and Evaluation Report conducted at the end of 2015 to ensure compliance against the WorkSafe Plan and areas for focused strategic and operational improvement. The following table shows the results of the period against Central’s targets:
Expenditure Total Expenditure Amount
Advertising agencies $11,240.57 J Walter Thompson
$11,240.57
Media advertising organisations $17,062.14 AdCorp OMD (Optimum media Decisions) Carat Australia Media Service Pty Ltd
$364.60 $16,697.54 $6221.77
Online Advertising (in-house) $6,977.67 Facebook Google Adwords
$1209.85 $5767.82
Online/web development $14,386.85
Live Chat Mailchimp Bookeo Diversus
$500.64 $501.04 $1538.78 $11 846.39
Market research organisations Nil Nil
Polling organisations Nil Nil
Direct mail organisations Nil Nil

Central Institute of Technology | 2016 Final Report 14
Measure Actual results Results against target
2016 2015 Target Comment on result Number of fatalities 0 0 Zero (0) Nil
Lost time injury and/or disease (LTI/D) incidence rate 0 0 Zero (0) or 10% reduction on the previous three (3) years
Nil
Lost time injury and/or death severity rate 25% 25% Zero (0) or 10% improvement on the previous three (3) years
Longer investigation times required for LTI claims.
Percentage of injured workers returned to work within (i) 13 weeks and (ii) 26 weeks
100% 100% Greater than or equal to 80% return to work within 26 weeks
Early intervention Vocational Rehabilitation within the first 2-5 days has ensured return to work within 13 weeks.
Percentage of managers and supervisors trained in occupational safety, health and injury management responsibilities
90% 90% Greater than or equal to 80% Face to face training provided Injury Management to all our line managers.
Note 1. Lost time injury or disease incidence rate
The number of lost time injury and/or disease claims lodged where one day or shift or more was lost from work as a factor of the number of full-time equivalent employees.
Note 2. Lost time injury severity rate
The number of severe injuries (actual or estimated 60 days or more lost from work) as a factor of the total number of lost time injury and/or disease claims.
Note 3. Percentage of managers trained in occupational safety, health and injury management responsibilities
In 2012, the target for percentage of managers trained in occupational safety, health and injury management responsibility was set at greater than or equal to 50%. In 2013, this target was readjusted to 80%.

Central Institute of Technology | 2016 Final Report 15
Central Institute of Technology is established under section 35 of the Vocational Education and Training Act 1996 Section 37 of the Vocational Education and Training Act 1996 outlines the functions of a college. (1) The functions of a college are as follows:
(a) to provide vocational education and training; (ba) to tender for and enter into contracts for the provision by it of vocational education and training; (bb) to provide vocational education and training on a fee for service basis; (b) to confer awards and, if it is a registered training provider and, under the terms of its registration as such,
authorised to do so — (i) approved VET qualifications; and (ii) prescribed VET qualifications;
(ca) to provide, for a fee or otherwise, or enter into contracts to provide, products, consultancy or other services in the course of, or incidental to, the provision by the college of vocational education and training;
(c) to undertake research and development related to vocational education and training which has a direct practical application to industry, commerce and the community;
(da) to turn to account the vocational education and training expertise of the college by means of the sale of services and the commercial exploitation of intellectual property, including the assignment and licensing of such property;
(d) to promote equality of opportunity in the undertaking of vocational education and training; (ea) to provide adult and community education; (e) to provide or arrange for the provision of services to its students; (fa) to provide housing for its staff, and residential accommodation for its students; (fb) with the approval of the Minister, to establish and maintain branches of the college at such places in the
State as its governing council thinks fit; (f) with the approval of the Minister, on terms and conditions approved by the Treasurer, to participate in
business arrangements relating to the provision of vocational education and training; (g) to contribute to the general development of the community in the region of the college through such activities as may be authorised by
the Minister; (h) to provide education on behalf of another educational institution; (i) to perform any function prescribed.

Central Institute of Technology | 2016 Final Report 16
(2) A college must perform its functions in accordance with its strategic plan last approved under section 43 and its business plan last approved under section 44A. (3) A college is not to hold land or any estate or interest in land, but this subsection does not apply to the holding of land or an estate or interest in land that is part of a business arrangement in which the college participates under subsection (1)(f). (4) The power conferred by subsection (1)(f) is not subject to, and may be exercised despite, the State Supply Commission Act 1991.

Central Institute of Technology | 2016 Final Report 17
On the 11th April 2016, operations, staff and students of Central Institute of Technology will transition to North Metropolitan TAFE, as part of the Western Australian Training Sector Reform Project. For 2016, prior to the transition, Central Institute of Technology had 1234 casual, part-time, contract and full-time staff members across 5 of campuses located in Northbridge, Leederville, East Perth, Mt Lawley and Nedlands. As this data represents only part of the year, it is not comparable to previous years. There were 286 courses offered across Central’s 5 campuses. As this report is not for a full calendar year, it is not practical or meaningful to provide student and enrolment data for this period and full year student enrolment data will be reported on the in the Annual Report for North Metropolitan TAFE.


STATEMENT OF COMPREHENSIVE INCOME 1 January - Year EndedFOR THE PERIOD 1 JANUARY TO 10 APRIL 2016 10 April 2016 31 December 2015
Notes $ $COST OF SERVICESExpensesEmployee benefits expense 6 25,049,728 90,498,877 Supplies and services 7 5,186,153 25,508,463 Depreciation and amortisation expense 8 1,719,349 6,655,914 Grants and subsidies 9 7,406 26,842 Cost of sales 14 121,415 363,797 Other expenses 10 1,937,392 8,121,690 Total cost of services 34,021,443 131,175,583
IncomeRevenueFee for service 11 6,953,895 32,511,421 Student fees and charges 12 5,800,902 20,472,586 Ancillary trading 13 13,816 127,499 Sales 14 194,062 495,892 Commonwealth grants and contributions 15 17,538 419,228 Interest revenue 16 508,688 1,797,711 Other revenue 17 192,796 6,493,284 Total revenue 13,681,697 62,317,621
GainsGain on disposal of non-current assets 18 - 111,989 Total gains - 111,989
Total income other than income from State Government 13,681,697 62,429,610
NET COST OF SERVICES (20,339,746) (68,745,973)
INCOME FROM STATE GOVERNMENT 19Service appropriation 18,004,564 64,525,422 Services received free of charge 617,010 2,929,262 Total income from State Government 18,621,574 67,454,684
(1,718,172) (1,291,289)
OTHER COMPREHENSIVE INCOMEItems not reclassified subsequently to profit or lossChanges in asset revaluation surplus 32 - (3,682,228) Total other comprehensive income - (3,682,228)
TOTAL COMPREHENSIVE INCOME/(DEFICIT) FOR THE PERIOD (1,718,172) (4,973,517)
The Statement of Comprehensive Income should be read in conjunction with the accompanying notes.
Central Institute of Technology
SURPLUS/(DEFICIT) FOR THE PERIOD

Central Institute of TechnologySTATEMENT OF FINANCIAL POSITION As at Year EndedAS AT 10 APRIL 2016 10 April 2016 31 December 2015
Notes $ $ASSETSCurrent Assets Cash and cash equivalents 33 2,576,719 5,161,560 Restricted cash and cash equivalents 20,33 6,213,561 8,048,618 Inventories 21 217,523 178,407 Receivables 22 5,251,157 2,542,442 Other current assets 23 316,211 573,988 Other financial assets 24 41,200,000 34,272,382 Total Current Assets 55,775,171 50,777,397
Non-Current Assets Restricted cash and cash equivalents 20,33 356,000 279,000 Property, plant and equipment 25 262,238,140 263,459,340 Intangible assets 27 2,218,925 2,151,909 Other non-current assets - Total Non-Current Assets 264,813,065 265,890,249
TOTAL ASSETS 320,588,236 316,667,646
LIABILITIESCurrent LiabilitiesPayables 29 1,749,637 3,057,680 Provisions 30 13,775,494 13,462,797 Other current liabilities 31 14,076,315 7,455,384 Total Current Liabilities 29,601,446 23,975,861
Non-Current LiabilitiesProvisions 30 3,558,616 3,545,439 Total Non-Current Liabilities 3,558,616 3,545,439
TOTAL LIABILITIES 33,160,062 27,521,300
NET ASSETS 287,428,174 289,146,346
EQUITY 32Contributed equity 66,366,179 66,366,179 Reserves 109,004,937 109,004,937 Accumulated surplus/(deficit) 112,057,058 113,775,230
TOTAL EQUITY 287,428,174 289,146,346
The Statement of Financial Position should be read in conjunction with the accompanying notes.

Central Institute of TechnologySTATEMENT OF CASH FLOWS 1 January - Year EndedFOR THE PERIOD 1 JANUARY TO 10 APRIL 2016 10 April 2016 31 December 2015
Notes $ $CASH FLOWS FROM STATE GOVERNMENTService appropriation - Department of Training and Workforce Development 16,311,219 63,034,164 Net cash provided by State Government 16,311,219 63,034,164
Utilised as follows:CASH FLOWS FROM OPERATING ACTIVITIESPaymentsEmployee benefits (24,421,471) (92,807,353) Supplies and services (5,728,215) (21,465,287) Grants and subsidies (7,406) (26,842) GST payments on purchases (673,242) (3,027,355) GST payments to taxation authority - (214,191) Other payments (2,239,614) (8,387,723)
ReceiptsFee for service 10,615,198 32,459,777 Student fees and charges 7,175,585 21,020,824 Ancillary trading 13,816 127,499 Commonwealth grants and contributions 501,360 3,390,604 Interest received 370,806 1,730,871 GST receipts on sales 413,877 1,798,223 GST receipts from taxation authority 422,746 1,252,512 Other receipts 395,227 7,104,589 Net cash provided by/(used in) operating activities
33 (13,161,333) (57,043,852)
CASH FLOWS FROM INVESTING ACTIVITIESPaymentsPurchase of non-current physical assets (565,167) (5,545,582) Movement in term deposits (6,927,618) 1,727,619 Capital Contribution - (1,500,000) ReceiptsProceeds from sale of non-current physical assets - 120,546 Net cash provided by/(used in) investing activities (7,492,785) (5,197,417)
Net increase/(decrease) in cash and cash equivalents (4,342,899) 792,895
Cash and cash equivalents at the begining of period 13,489,178 12,696,283 CASH AND CASH EQUIVALENTS AT THE END OF PERIOD 33 9,146,280 13,489,178
The Statement of Cash Flows should be read in conjunction with the accompanying notes.

Central Institute of TechnologySTATEMENT OF CHANGES IN EQUITY AccumulatedFOR THE PERIOD 1 JANUARY TO 10 APRIL 2016 Contributed Equity Reserves Surplus / (Deficit) Total Equity
Notes $ $ $ $Balance at 1 January 2015 32 65,859,250 112,687,164 115,066,519 293,612,933
Surplus/(deficit) - - (1,291,289) (1,291,289) Other comprehensive income - (3,682,228) - (3,682,228) Total comprehensive income for the period - (3,682,228) (1,291,289) (4,973,517)
Transaction with owners in their capacity as owners : Capital appropriations 2,006,929 - - 2,006,929 Distribution to owners (1,500,000) - - (1,500,000) Total 506,929 - - 506,929
Balance at 31 December 2015 66,366,179 109,004,937 113,775,230 289,146,346
Balance at 1 January 2016 66,366,179 109,004,937 113,775,230 289,146,346
Surplus/(deficit) - - (1,718,172) (1,718,172) Total comprehensive income for the period - - (1,718,172) (1,718,172)
Balance at 10 April 2016 66,366,179 109,004,937 112,057,058 287,428,174
The Statement of Changes in Equity should be read in conjunction with the accompanying notes.

CENTRAL INSTITUTE OF TECHNOLOGY NOTES TO THE FINANCIAL STATEMENTS FOR THE PERIOD 1 JANUARY TO 10 APRIL 2016
1. Australian Accounting Standards (a) General The Institute's financial statements for the period ended 10 April 2016 have been prepared in accordance with Australian Accounting Standards. The term 'Australian Accounting Standards' includes Standards and Interpretations issued by the Australian Accounting Standard Board (AASB). The Institute has adopted any applicable new and revised Australian Accounting Standards from their operative dates.
(b) Early adoption of standards The Institute cannot early adopt an Australian Accounting Standard unless specifically permitted by Treasurer's Instruction (TI) 1101 'Application of Australian Accounting Standards and Other Pronouncements'. There has been no early adoption of any other Australian Accounting Standards that have been issued or amended (but not operative) by the Institute for the reporting period ended 10 April 2016.
2. Summary of significant accounting policies The following accounting policies have been adopted in the preparation of these financial statements. Unless otherwise stated, these policies are consistent with those adopted in the previous year.
(a) General statement The Institute is a not-for-profit reporting entity that prepares general purpose financial statements in accordance with the Australian Accounting Standards, the Framework, Statements of Accounting Concepts and other authoritative pronouncements of the AASB as applied by the Treasurer’s instructions. Several of these are modified by the Treasurer’s instructions to vary application, disclosure, format and wording. The Financial Management Act 2006 and the Treasurer’s instructions impose legislative provisions that govern the preparation of financial statements and take precedence over the Australian Accounting Standards, the Framework, Statements of Accounting Concepts and other authoritative pronouncements of the AASB. Where modification is required and has had a material or significant financial effect upon the reported results, details of that modification and the resulting financial effect are disclosed in the notes to the financial statements.
(b) Basis of preparation The financial statements have been prepared on the accrual basis of accounting using the historical cost convention, except for land and buildings which have been measured at fair value. The accounting policies adopted in the preparation of the financial statements have been consistently applied throughout all periods presented unless otherwise stated. The financial statements are presented in Australian dollars ($). Note 3 ‘Judgements made by management in applying accounting policies’ discloses judgements that have been made in the process of applying the Institute’s accounting policies resulting in the most significant effect on amounts recognised in the financial statements. Note 4 ‘Key sources of estimation uncertainty’ discloses key assumptions made concerning the future, and other key sources of estimation uncertainty at the end of the reporting period, that have a significant risk of causing a material adjustment to the carrying amounts of assets and liabilities within the next financial year. The financial statements have been prepared on a going concern basis which assumes that the Institute will be able to generate sufficient positive cash flows to meet its financial obligations and realise its assets and extinguish its liabilities in the normal course of business.
(c) Reporting entity The reporting entity comprises the Institute and bodies included at note 41 ‘Related bodies’.
(d) Contributed equity AASB Interpretation 1038 ‘Contributions by Owners Made to Wholly-Owned Public Sector Entities’ requires transfers in the nature of equity contributions, other than as a result of a restructure of administrative arrangements, to be designated by the Government (the owner) as contributions by owners (at the time of, or prior to transfer) before such transfers can be recognised as equity contributions. Capital appropriations have been designated as contributions by owners by TI 955 'Contributions by Owners Made to Wholly Owned Public Sector Entities' and have been credited directly to Contributed Equity.

The transfers of net assets to/from other agencies, other than as a result of a restructure of administrative arrangements, are designated as contributions by owners where the transfers are non-discretionary and non-reciprocal. See note 32 'Equity'.
(e) Income Revenue recognition Revenue is recognised and measured at the fair value of consideration received or receivable. The majority of operating revenue of the Institute represents revenue earned from student fees and charges, fee for service, ancillary services, trading activities and Commonwealth grants and contributions. The following specific recognition criteria must also be met before revenue is recognised for the major business activities as follows:
Sale of goods
Revenue is recognised from the sale of goods and disposal of other assets when the significant risks and rewards of ownership transfer to the purchaser and can be measured reliably.
Provision of services
Revenue is recognised by reference to the stage of completion of the transaction.
Interest
Revenue is recognised as the interest accrues.
Grants, donations, gifts and other non-reciprocal contributions
Revenue is recognised at fair value when the Institute obtains control over the assets comprising the contributions, usually when cash is received. Other non-reciprocal contributions that are not contributions by owners are recognised at their fair value. Contributions of services are only recognised when a fair value can be reliably determined and the services would be purchased if not donated.
State funds
The funds received from the Department of Training and Workforce Development in respect of the delivery of services forming part of the Delivery Performance Agreement are included in State funds, disclosed under ‘Income from State Government'. They are the result of training successfully tendered for under competitive tendering arrangements. This revenue is recognised at nominal value in the period in which the Institute meets the terms of the Agreement. See note 19 'Income from State Government'.
Gains
Realised and unrealised gains are usually recognised on a net basis. These include gains arising on the disposal of non-current assets and some revaluations of non-current assets.
(f) Property, plant and equipment Capitalisation/expensing of assets
Items of property, plant and equipment costing $5,000 or more are recognised as assets and the cost of utilising assets is expensed (depreciated) over their useful lives. Where applicable in accordance with TI 1101, the capitalisation threshold has been applied to the aggregate value of a group or network of assets where the cost of individual item may be below the threshold but collectively the cost of the items in the group or network exceeds the threshold. Items of property, plant and equipment costing less than $5,000 are immediately expensed direct to the Statement of Comprehensive Income (other than where they form part of a group of similar items which are significant in total).
Initial recognition and measurement
Property, plant and equipment are initially recognised at cost. For items of property, plant and equipment acquired at no cost or for nominal cost, the cost is the fair value at the date of acquisition.
Subsequent measurement
Subsequent to initial recognition as an asset, the revaluation model is used for the measurement of land and buildings and historical cost for all other property, plant and equipment. Land and buildings are carried at fair value less accumulated depreciation (buildings only) and accumulated impairment losses. All other items of property, plant and equipment are stated at historical cost less accumulated depreciation and accumulated impairment losses. Where market-based evidence is available, the fair value of land and buildings is determined on the basis of current market values determined by reference to recent market transactions. When buildings are revalued by reference to
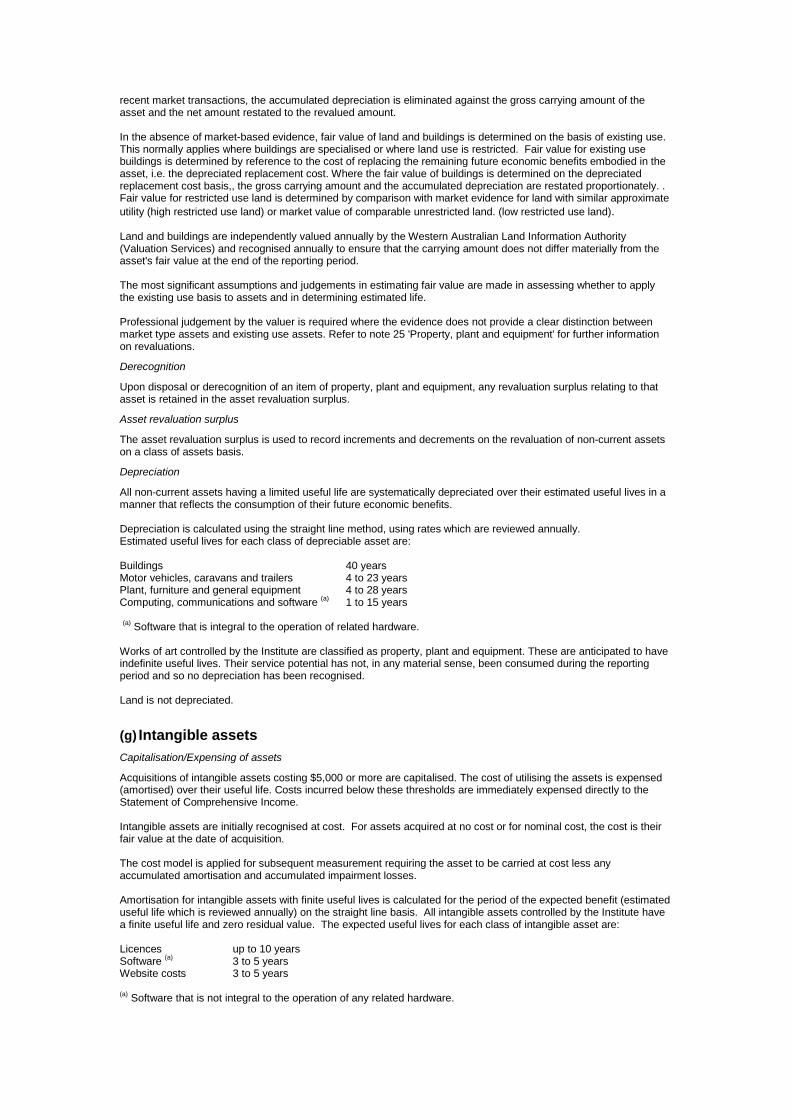
recent market transactions, the accumulated depreciation is eliminated against the gross carrying amount of the asset and the net amount restated to the revalued amount. In the absence of market-based evidence, fair value of land and buildings is determined on the basis of existing use. This normally applies where buildings are specialised or where land use is restricted. Fair value for existing use buildings is determined by reference to the cost of replacing the remaining future economic benefits embodied in the asset, i.e. the depreciated replacement cost. Where the fair value of buildings is determined on the depreciated replacement cost basis,, the gross carrying amount and the accumulated depreciation are restated proportionately. . Fair value for restricted use land is determined by comparison with market evidence for land with similar approximate utility (high restricted use land) or market value of comparable unrestricted land. (low restricted use land). Land and buildings are independently valued annually by the Western Australian Land Information Authority (Valuation Services) and recognised annually to ensure that the carrying amount does not differ materially from the asset's fair value at the end of the reporting period. The most significant assumptions and judgements in estimating fair value are made in assessing whether to apply the existing use basis to assets and in determining estimated life. Professional judgement by the valuer is required where the evidence does not provide a clear distinction between market type assets and existing use assets. Refer to note 25 'Property, plant and equipment' for further information on revaluations.
Derecognition
Upon disposal or derecognition of an item of property, plant and equipment, any revaluation surplus relating to that asset is retained in the asset revaluation surplus.
Asset revaluation surplus
The asset revaluation surplus is used to record increments and decrements on the revaluation of non-current assets on a class of assets basis.
Depreciation
All non-current assets having a limited useful life are systematically depreciated over their estimated useful lives in a manner that reflects the consumption of their future economic benefits. Depreciation is calculated using the straight line method, using rates which are reviewed annually. Estimated useful lives for each class of depreciable asset are: Buildings 40 years Motor vehicles, caravans and trailers 4 to 23 years Plant, furniture and general equipment 4 to 28 years Computing, communications and software (a) 1 to 15 years (a) Software that is integral to the operation of related hardware. Works of art controlled by the Institute are classified as property, plant and equipment. These are anticipated to have indefinite useful lives. Their service potential has not, in any material sense, been consumed during the reporting period and so no depreciation has been recognised. Land is not depreciated.
(g) Intangible assets Capitalisation/Expensing of assets
Acquisitions of intangible assets costing $5,000 or more are capitalised. The cost of utilising the assets is expensed (amortised) over their useful life. Costs incurred below these thresholds are immediately expensed directly to the Statement of Comprehensive Income. Intangible assets are initially recognised at cost. For assets acquired at no cost or for nominal cost, the cost is their fair value at the date of acquisition. The cost model is applied for subsequent measurement requiring the asset to be carried at cost less any accumulated amortisation and accumulated impairment losses. Amortisation for intangible assets with finite useful lives is calculated for the period of the expected benefit (estimated useful life which is reviewed annually) on the straight line basis. All intangible assets controlled by the Institute have a finite useful life and zero residual value. The expected useful lives for each class of intangible asset are: Licences up to 10 years Software (a) 3 to 5 years Website costs 3 to 5 years (a) Software that is not integral to the operation of any related hardware.

Licences
Licences have a finite useful life and are carried at cost less accumulated amortisation and accumulated impairment losses.
Computer software
Software that is an integral part of the related hardware is recognised as property, plant and equipment. Software that is not an integral part of the related hardware is recognised as an intangible asset. Software costing less than $5,000 is expensed in the year of acquisition.
Web site costs
Website costs are charged as expenses when they are incurred unless they relate to the acquisition or development of an asset when they may be capitalised and amortised. Generally, costs in relation to feasibility studies during the planning phase of a website, and ongoing costs of maintenance during the operating phase are expensed. Costs incurred in building or enhancing a web site that can be reliably measured, are capitalised, to the extent that they represent probable future economic benefits. .
(h) Impairment of assets Property, plant and equipment and intangible assets are tested for any indication of impairment at the end of each reporting period. Where there is an indication of impairment, the recoverable amount is estimated. Where the recoverable amount is less than the carrying amount, the asset is considered impaired and is written down to the recoverable amount and an impairment loss is recognised. Where an asset measured at cost is written down to recoverable amount, an impairment loss is recognised in profit or loss. Where a previously revalued asset is written down to recoverable amount, the loss is recognised as a revaluation decrement in other comprehensive income. As the Institute is a not-for-profit entity, unless asset has been identified as a surplus asset, the recoverable amount is the higher of an asset’s fair value less costs to sell and depreciated replacement cost. The risk of impairment is generally limited to circumstances where an asset’s depreciation is materially understated, where the replacement cost is falling or where there is a significant change in useful life. Each relevant class of assets is reviewed annually to verify that the accumulated depreciation/amortisation reflects the level of consumption or expiration of asset’s future economic benefits and to evaluate any impairment risk from falling replacement costs. Intangible assets with an indefinite useful life and intangible assets not yet available for use are tested for impairment at the end of each reporting period irrespective of whether there is any indication of impairment. The recoverable amount of assets identified as surplus assets is the higher of fair value less costs to sell and the present value of future cash flows expected to be derived from the asset. Surplus assets carried at fair value have no risk of material impairment where fair value is determined by reference to market-based evidence. Where fair value is determined by reference to depreciated replacement cost, surplus assets are at risk of impairment and the recoverable amount is measured. Surplus assets at cost are tested for indications of impairment at the end of each reporting period. See note 28 ‘Impairment of assets’ for the outcome of impairment reviews and testing. See note 2(n) 'Receivables' and note 22 'Receivables' for impairment of receivables.
(i) Leases The Institute has entered into operating lease arrangements for computers, motor vehicles and premises. Lease payments are expensed on a straight line basis over the lease term as this represents the pattern of benefits derived from the leased assets See note 34 ‘Commitments’.
(j) Financial instruments In addition to cash, the Institute has two categories of financial instruments:
• Loans and receivables; and • Financial liabilities measured at amortised cost.
These have been disaggregated into the following classes:
Financial assets
• Cash and cash equivalents • Restricted cash and cash equivalents • Receivables
Financial liabilities
• Payables • DPA clawback provision
Initial recognition and measurement of financial instruments is at fair value which normally equates to the transaction cost or the face value. Subsequent measurement is at amortised cost using the effective interest method.

The fair value of short-term receivables and payables is the transaction cost or the face value because there is no interest rate applicable and subsequent measurement is not required as the effect of discounting is not material.
(k) Cash and cash equivalents For the purpose of the Statement of Cash Flows, cash and cash equivalents (and restricted cash and cash equivalents) assets comprise cash on hand and short-term deposits with original maturities of three months or less that are readily convertible to a known amount of cash and which are subject to insignificant risk of changes in value.
(l) Accrued salaries Accrued salaries (see note 29 'Payables') represent the amount due to staff but unpaid at the end of the financial year, as the end of the last pay period for that financial year does not coincide with the end of the financial year. Accrued salaries are settled within a fortnight of the financial year end. The Institute considers the carrying amount of accrued salaries to be equivalent to its fair value. The accrued salaries suspense account (see note 20 ‘Restricted cash and cash equivalents’) consists of amounts paid annually into a suspense account over a period of ten financial years to largely meet the additional cash outlay in each eleventh year when 27 pay days occur instead of the normal 26. No interest is received on this account.
(m) Inventories Inventories are measured at the lower of cost and net realisable value. Costs are assigned by the method most appropriate to each particular class of inventory, with the majority being measured on an average cost basis. Inventories not held for resale are measured at cost unless they are no longer required, in which case they are measured at net realisable value. See note 21 'Inventories'.
(n) Receivables Receivables are recognised at original invoice amount less an allowance for any uncollectible amounts (i.e. impairment). The collectability of receivables is reviewed on an ongoing basis and any receivables identified as uncollectible are written-off against the allowance account. The allowance for uncollectible amounts (doubtful debts) is raised when there is objective evidence that the Institute will not be able to collect the debts. The carrying amount is equivalent to fair value as it is due for settlement within 30 days. See note 2(j) ‘Financial instruments’ and note 22 ‘Receivables’.
(o) Payables Payables are recognised when the Institute becomes obliged to make future payments as a result of a purchase of assets or services. The carrying amount is equivalent to fair value, as settlement is generally within 30 days. See note 2(j) ‘Financial instruments’ and note 29 'Payables'.
(p) Provisions Provisions are liabilities of uncertain timing or amount and are recognised where there is a present legal or constructive obligation as a result of a past event and when the outflow of resources embodying economic benefits is probable and a reliable estimate can be made of the amount of the obligation. Provisions are reviewed at the end of each reporting period. See note 30 ‘Provisions’.
(i) Provisions - employee benefits All annual leave and long service leave provisions are in respect of employees’ services up to the end of the reporting period.
Annual leave
Annual leave is not expected to be settled wholly within 12 months after the end of the reporting period and is therefore considered to be ‘other long-term employee benefits’. The annual leave liability is recognised and measured at the present value of amounts expected to be paid when the liabilities are settled using the remuneration rate expected to apply at the time of settlement. When assessing expected future payments consideration is given to expected future wage and salary levels including non-salary components such as employer superannuation contributions, as well as the experience of employee departures and periods of service. The expected future payments are discounted using market yields at the end of the reporting period on national government bonds with terms to maturity that match, as closely as possible, the estimated future cash outflows. The provision for annual leave is classified as a current liability as the Institute does not have an unconditional right to defer settlement of the liability for at least 12 months after the end of the reporting period.

Professional Leave
The provision for professional allowance leave relates to the entitlement of lecturers under the WA TAFE lecturers general agreement for four weeks professional leave during each calendar year of service. Since this entitlement cannot be accrued from year to year it is not ordinarily provided for at 31 December but has been provided at 10 April 2016.
Accrued Days Off
The provision for accrued days off relates to the optional entitlement under the Institute’s agency specific agreement for administrative staff to accrue an additional 10 days of leave per year in return for working an extra 2.18 hours per week. Since this entitlement cannot be accrued from year to year it is not ordinarily provided for at 31 December but has been provided at 10 April 2016.
Long service leave
Long service leave that is not expected to be settled within 12 months after the end of the reporting period is recognised and measured at the present value of amounts expected to be paid when the liabilities are settled using the remuneration rate expected to apply at the time of settlement. When assessing expected future payments consideration is given to expected future wage and salary levels including non-salary components such as employer superannuation contributions, as well as the experience of employee departures and periods of service. The expected future payments are discounted using market yields at the end of the reporting period on national government bonds with terms to maturity that match, as closely as possible, the estimated future cash outflows. Unconditional long service leave provisions are classified as current liabilities as the Institute does not have an unconditional right to defer settlement of the liability for at least 12 months after the end of the reporting period. Pre-conditional and conditional long service leave provisions are classified as non-current liabilities because the Institute has an unconditional right to defer the settlement of the liability until the employee has completed the requisite years of service.
Deferred Leave
The provision for deferred leave relates to Public Service employees who have entered into an agreement to self-fund an additional twelve months leave in the fifth year of the agreement. The provision recognises the value of salary set aside for employees to be used in the fifth year. This liability is measured on the same basis as annual leave. Deferred leave is reported as a current provision as employees can leave the scheme at their discretion at any time.
Superannuation
The Government Employees Superannuation Board (GESB) and other funds administer public sector superannuation arrangements in Western Australia in accordance with legislative requirements. Eligibility criteria for membership in particular schemes for public sector employees vary according to commencement and implementation dates. Eligible employees contribute to the Pension Scheme, a defined benefit pension scheme closed to new members since 1987, or the Gold State Superannuation Scheme (GSS), a defined benefit lump sum scheme closed to new members since 1995. Employees commencing employment prior to 16 April 2007 who were not members of either the Pension Scheme or the GSS became non-contributory members of the West State Superannuation Scheme (WSS). Employees commencing employment on or after 16 April 2007 became members of the GESB Super Scheme (GESBS). From 30 March 2012, existing members of the WSS or GESBS and new employees have been able to choose their preferred superannuation fund provider. The Institute makes contributions to GESB or other funds providers on behalf of employees in compliance with the Commonwealth Government’s Superannuation Guarantee (Administration) Act 1992. Contributions to these accumulation schemes extinguish the Institute’s liability for superannuation charges in respect of employees who are not members of the Pension Scheme or GSS. The GSS is a defined benefit scheme for the purposes of employees and whole-of-government reporting. However, it is a defined contribution plan for Institute purposes because the concurrent contributions (defined contributions) made by the Institute to GESB extinguishes the Institute’s obligations to the related superannuation liability. The Institute has no liabilities under the Pension Scheme or the GSS. The liabilities for the unfunded Pension Scheme and the unfunded GSS transfer benefits attributable to members who transferred from the Pension Scheme, are assumed by the Treasurer. All other GSS obligations are funded by concurrent contributions made by the Institute to the GESB.
The GESB makes all benefit payments in respect of the Pension Scheme and GSS, and is recouped from the Treasurer for the employer's share. See also note 2(q) 'Superannuation expense'.
(ii) Provisions - other
Employment on-costs
Employment on-costs, including workers’ compensation insurance, are not employee benefits and are recognised separately as liabilities and expenses when the employment to which they relate has occurred. Employment on-costs are included as part of 'Other expenses' and are not included as part of the Institute's 'Employee benefits expense’. The related liability is included in 'Employment on-costs provision'. (See note 10 'Other expenses' and note 30 'Provisions'.)

(q) Superannuation expense The superannuation expense in the Statement of Comprehensive Income comprises employer contributions paid to the GSS (concurrent contributions), the West State Superannuation Scheme (WSS), the GESB Super Scheme (GESBS) and other superannuation funds.
(r) Assets and services received free of charge or for nominal cost Assets or services received free of charge or for nominal cost that the Institute would otherwise purchase if not donated, are recognised as income at the fair value of the assets or services where they can be reliably measured. A corresponding expense is recognised for services received. Receipts of assets are recognised in the Statement of Financial Position. Assets or services received from other State Government agencies are separately disclosed under Income from State Government in the Statement of Comprehensive Income.
(s) Comparative figures Comparative figures are, where appropriate, reclassified to be comparable with the figures presented in the current financial year.
3. Judgements made by management in applying accounting policies The preparation of financial statements requires management to make judgements about the application of accounting policies that have a significant effect on the amounts recognised in the financial statements. The Institute evaluates these judgements regularly. Operating Lease Commitments The Institute has entered into a commercial lease and has determined that the lessor retains substantially all the significant risks and rewards incidental to ownership of the property. Accordingly, the lease has been classified as an operating lease.
4. Key sources of estimation uncertainty Key estimates and assumptions concerning the future are based on historical experience and various other factors that have a significant risk of causing a material adjustment to the carrying amount of assets and liabilities within the next financial year.
Long Service Leave
Several estimations and assumptions in calculating the Institute’s long service leave provision include expected future salary rates, discount rates, employee retention rates and expected future payments. Changes in these estimations and assumptions may impact on the carrying amount of the long service leave provision.
5. Disclosure of changes in accounting policy and estimates
Initial application of an Australian Accounting Standard The Institute has not applied any Australian Accounting Standards effective for reporting period 1 January 2016 to 10 April 2016 that impacted on the Institute.
Voluntary changes in accounting policy and estimates
There have been no changes in accounting policy or estimates for the reporting period 1 January 2016 to 10 April 2016.
Future impact of Australian Accounting Standards not yet operative The Institute cannot early adopt an Australian Accounting Standard unless specifically permitted by TI 1101 Application of Australian Accounting Standards and Other Pronouncements. Consequently, the Institute has not applied early any of the following Australian Accounting Standards that have been issued that may impact the Institute. Where applicable, the Institute plans to apply these Australian Accounting Standards from their application date.

Operative for
reporting periods
beginning on/after
AASB 9 Financial Instruments
This Standard supersedes AASB 139 Financial Instruments: Recognition and Measurement, introducing a number of changes to accounting treatments.
The mandatory application date of this Standard is currently 1 January 2018 after being amended by AASB 2012-6, AASB 2013-9, and, AASB 2014-1 Amendments to Australian Accounting Standards. The Institute has not yet determined the application or the potential impact of the Standard.
1 Jan 2018
AASB 15 Revenue from Contracts with Customers
This Standard establishes the principles that the Institute shall apply to report useful information to users of financial statements about the nature, amount, timing and uncertainty of revenue and cash flows arising from a contract with a customer. The mandatory application date of this Standard has been amended by AASB 2015-8 to 1 January 2018. The Institute has not yet determined the application or the potential impact of the Standard.
1 Jan 2018
AASB 2010-7 Amendments to Australian Accounting Standards arising from AASB 9 (December 2010)
[AASB 1, 3, 4, 5, 7, 101, 102, 108, 112, 118, 120, 121, 127, 128, 131, 132, 136, 137, 139, 1023 & 1038 and Int 2, 5, 10, 12, 19 & 127]
This Standard makes consequential amendments to other Australian Accounting Standards and Interpretations as a result of issuing AASB 9 in December 2010.
The mandatory application date of this Standard has been amended by AASB 2012-6 and AASB 2014-1 to 1 January 2018. The Institute has not yet determined the application or the potential impact of the Standard.
1 Jan 2018
AASB 2014-1 Amendments to Australian Accounting Standards
Part E of this Standard makes amendments to AASB 9 and consequential amendments to other Standards. It has not yet been assessed to determine the application or potential impact.
1 Jan 2018
AASB 2014-5 Amendments to Australian Accounting Standards arising from AASB 15
This Standard gives effect to the consequential amendments to Australian Accounting Standards (including Interpretations) arising from the issuance of AASB 15. The Institute has not yet determined the application or the potential impact of the Standard.
1 Jan 2017
AASB 2014-7 Amendments to Australian Accounting Standards arising from AASB 9 (December 2014)
This Standard gives effect to the consequential amendments to Australian Accounting Standards (including Interpretations) arising from the issuance of AASB 9 (December 2014). The Institute has not yet determined the application or the potential impact of the Standard.
1 Jan 2018
AASB 2015-6 Amendments to Australian Accounting Standards – Extending Related Party Disclosures to
Not-for-Profit Public Sector Entities [AASB 10, 124 & 1049]
The amendments extend the scope of AASB 124 to include application by not-for-profit public sector entities. Implementation guidance is included to assist application of the Standard by not-for-profit public sector entities. The Institute will be required to make related party disclosures, though there is no financial impact.
1 Jul 2016
AASB 2015-8 Amendments to Australian Accounting Standards – Effective Date of AASB 15
The Standard amends the mandatory effective date of AASB 15, consequential amendments originally set out in AASB 2014-5, and, Interpretation 1052 Tax Consolidation Accounting. There is no financial impact.
1 Jan 2017

Central Institute of TechnologyNOTES TO THE FINANCIAL STATEMENTS 16GLACT &PREV_LDGFOR THE PERIOD 1 JANUARY TO 10 APRIL 2016 1 January - Year Ended
10 April 2016 31 December 2015$ $
6 Employee benefits expense
Wages and salaries (a) 23,026,401 82,855,544 Superannuation - defined contribution plans (b) 2,023,328 7,643,333
25,049,728 90,498,877
(a) Includes the value of the fringe benefit to the employee plus the fringe benefits tax component, leave entitlements including superannuation contribution component.(b) Defined contribution plans include West State, and Gold State and GESB and other eligible funds.
Employment on-costs expenses, such as workers' compensation insurance, are included at note 10 'Other expenses'. Employment on-costs liability is included at note 30 'Provisions'.
7 Supplies and services
Consumables and minor equipment 438,430 2,074,672 Communication expenses 170,430 715,211 Utilities expenses 612,528 2,848,963 Consultancies and contracted services 2,721,302 12,195,254 Minor works 197,082 2,189,205 Repairs and maintenance 93,306 772,627 Operating lease and hire charges 419,486 1,521,679 Travel and passenger transport 29,483 265,467 Advertising and public relations 58,141 589,730 Supplies and services - other 398,462 2,079,905 Supplies and Services -PD staff activities 47,504 255,750
5,186,153 25,508,463
8 Depreciation and amortisation expense
DepreciationBuildings 1,407,394 5,226,418 Leasehold improvements - buildings 13,339 - Motor vehicles, caravans and trailers - - Plant, furniture and general equipment 128,995 482,234 Computers and communication network 169,621 947,262 Marine craft - - Library Collection - - Total depreciation 1,719,349 6,655,914
Total depreciation and amortisation 1,719,349 6,655,914
9 Grants and subsidies
RecurrentOther (student scholarships) 7,406 26,842
7,406 26,842
10 Other expenses
Audit Fees 105,000 105,000 Building maintenance 363,352 2,419,155 Doubtful debts expense (43,075) (3,616) Employment on-costs (a) 1,467,166 5,474,785 Donations 222 1,143 Student prizes and awards 35,125 123,099 Losses and write-offs 1,166 2,124 Other (b) 8,437 -
1,937,392 8,121,690
(a) Employment on-costs - Includes workers' compensation insurance and other employment on-costs. The on-costs liabilities associated with the recognition of annual and long service leave liabilities are included at note 30 'Provisions'. Superannuation contributions accrued as part of the provision for leave are employee benefits and are not included in employmenton-costs.(b) Provision for obsolete Bookshop Inventory stock
11 Fee for service
Fee for service - general 1,965,189 7,739,670 Fee for service - Department of Training and Workforce Development 22,167 27,185 Fee for service - Government (other than Department of Training and Workforce Development) 2,504,589 12,939,385 International division fees 2,461,950 11,805,181
6,953,895 32,511,421
12 Student fees and charges
Tuition fees 4,899,119 16,988,435 Enrolment fees - - Resource fees 819,641 3,003,332 Other college fees 41,310 105,555 Student Fees - RPL Fees & RPL Reversal 40,832 375,264
5,800,902 20,472,586
13 Ancillary trading
Live works (not a trading activity) 12,816 108,999 Other ancillary revenue 1,000 18,500
13,816 127,499

Central Institute of TechnologyNOTES TO THE FINANCIAL STATEMENTS 16GLACT &PREV_LDGFOR THE PERIOD 1 JANUARY TO 10 APRIL 2016 1 January - Year Ended
10 April 2016 31 December 2015$ $
14 Trading profit/(loss)
(a) Bookshop:Sales 194,062 495,892 Cost of sales: Opening inventory (164,793) (124,961) Purchases (162,488) (403,629)
(327,281) (528,590) Closing inventory 205,866 164,793 Cost of goods sold (121,415) (363,797) Trading profit/(loss) - Bookshop 72,647 132,095
72,647 132,095 See note 2(o) 'Inventories' and note 21 'Inventories'.
15 Commonwealth grants and contributions
Commonwealth specific purpose grants and contributions 17,538 419,228 17,538 419,228
This is a resource development grant from the Department of Education and Training.
16 Interest revenue
Interest revenue (from main operating account and term deposits held at various banks) 508,688 1,797,711 508,688 1,797,711
17 Other revenue
Rental and facilities fees 165,141 572,430 Other direct grants and subsidy revenue - 4,679 Copyright and royalties revenue 141 237 Sponsorship and donations revenue 10,712 253,872 Miscellaneous revenue 16,803 5,662,065
192,796 6,493,284
18 Net gain/(loss) on disposal of non-current assets
Net proceeds from disposal of non-current assetsPlant, furniture and general equipment - 93,750 Computers and communication network - 26,796 Total proceeds from disposal of non-current assets - 120,546
Carrying amount of non-current assets disposedPlant, furniture and general equipment - (1,965) Computers and communication network - (6,592) Total cost of disposal of non-current assets - (8,557)
Net gain/(loss) - 111,989
See note 25 ‘Property, plant and equipment’.
19 Income from State Government
Appropriation received during the year:Service appropriation (a) (State funds received from Department of Training and Workforce Development):
Delivery and Performance Agreement (DPA) 17,469,613 62,944,045 Other recurrent funds 534,951 1,581,377 Total State funds 18,004,564 64,525,422
Services received free of charge from other State government agencies duringthe financial period :
Department of Training and Workforce Development- Corporate systems support 514,037 2,573,289 - Marketing and publications - 11,924 - Human resources, and industrial relations support 2,220 24,584 - Other 100,753 255,940
617,010 2,865,737 Other Government - 63,525 Total resources received free of charge 617,010 2,929,262
Total income from State Government 18,621,574 67,454,684
(a) Service appropriations fund the net cost of services delivered.
20 Restricted cash and cash equivalents
CurrentSpecific capital works programs 1,233,074 1,730,624 Awards 129,562 129,562 Monies refundable to Training and Workforce Development for under delivery of SCH - 1,694,159 Monies refundable to Department of Education for VET Fee HELP Funds 4,805,375 4,452,107 Other 45,549 42,167
6,213,561 8,048,618
Non-currentAccrued salaries suspense account (27th Pay provision) 356,000 279,000
356,000 279,000
Total restricted cash and cash equivalents 6,569,561 8,327,618

Central Institute of TechnologyNOTES TO THE FINANCIAL STATEMENTS 16GLACT &PREV_LDGFOR THE PERIOD 1 JANUARY TO 10 APRIL 2016 1 January - Year Ended
10 April 2016 31 December 2015$ $
21 Inventories
CurrentInventories not held for resale:
Other (at cost) 19,841 13,614 19,841 13,614
Less: Provision for obsolete stock - - 19,841 13,614
Inventories held for resale:Bookshop (at cost) 205,866 164,793
205,866 164,793 Less: Provision for obsolete stock (8,184) -
197,682 164,793
Total 217,523 178,407
See also note 2(o) 'Inventories' and note 14 'Trading profit/(loss)'.
22 Receivables
CurrentReceivables - trade 820,908 575,323 Receivables - students 3,621,504 229,906 Receivables - other 30,739 33,376 Accrued revenue 728,978 1,456,090 Allowance for impairment of receivables (194,979) (231,681) GST receivable 244,006 479,428 Total current 5,251,157 2,542,442
Total receivables 5,251,157 2,542,442
Reconciliation of changes in the allowance for impairment of receivables:Balance at start of period (231,681) (275,264) Doubtful debts (expense) / reversal 43,075 5,993 Amount written off during the period - 70,285 Reversals of previous write offs (6,373) (32,695) Balance at end of period (194,979) (231,681)
The Institute does not hold any collateral or other credit enhancements as security for receivables.
See also note 2(p) 'Receivables' and note 38 'Financial instruments'.
23 Other assets
CurrentPrepayments 248,346 503,274 Other current assets (a) 67,865 70,714 Total current 316,211 573,988
(a) Represents the balance of outstanding corporate credit card accounts at the end of the period $7K (2015: $7K) and outstanding claims for reimbursement through the Institute's Worker's Compensation insurance $60K (2015: $63K).
24 Other financial assets
CurrentTerm deposits (a) 41,200,000 34,272,382
41,200,000 34,272,382
(a) Represents various term deposits held with Westpac with maturity up to 3 months from the reporting date.
In 2015 the total restricted cash balance of $8.3 million was held in term deposits (note 20). However, in 2016 there was no restrictions on the term deposit balance, as a result the balance is significantly higher than in 2015.

Central Institute of TechnologyNOTES TO THE FINANCIAL STATEMENTS 16GLACT &PREV_LDGFOR THE PERIOD 1 JANUARY TO 10 APRIL 2016 1 January - Year Ended
10 April 2016 31 December 2015$ $
25 Property, plant and equipment
LandAt fair value (a) 54,810,000 54,810,000
54,810,000 54,810,000 BuildingsAt fair value (a) 204,298,014 203,821,126 Accumulated depreciation (1,407,394) -
202,890,621 203,821,126 Buildings under constructionConstruction costs - 72,756
- 72,756 Leasehold improvementsAt cost 188,086 174,078 Accumulated depreciation (13,339) -
174,746 174,078 Plant, furniture and general equipmentAt cost 6,750,358 6,701,226 Accumulated depreciation (5,386,629) (5,257,634)
1,363,729 1,443,592 Computer equipment, communication networkAt cost 6,902,241 6,902,241 Accumulated depreciation (5,719,380) (5,549,759)
1,182,861 1,352,483 Works of art At fair value 1,816,183 1,785,306
1,816,183 1,785,306
262,238,140 263,459,340
(a) Land and buildings were revalued as at 1 July 2015 by the Western Australian Land Information Authority (Valuation Services). The valuations were performed during the year ended 31 December 2015 and recognised at 31 December 2015. In undertaking the revaluation, fair value was determined by reference to market values for land: $2,160,000 and buildings: $ 155,000. For the remaining balance, fair value of buildings was determined on the basis of depreciated replacement cost and fair value of land was determined on the basis of comparison with market evidence for land with low level utility (high restricted use land). See note 2(g) 'Property, plant and equipment'.
Information on fair value measurements is provided in Note 26.
Reconciliations of the carrying amounts of property, plant and equipment at the beginning and end of the reporting period are set out in the table below.
Land BuildingsBuildings under
constructionLeasehold
improvements
Plant, furniture and general equipment
Computer equipment,
communication network Works of art Total
10 April 2016 $ $ $ $ $ $ $ $Carrying amount at start of year 54,810,000 203,821,126 72,756 174,078 1,443,592 1,352,483 1,785,306 263,459,340 Additions - - - - 49,132 - 2,544 51,676 Transfers (a) - 476,888 (72,756) 14,008 - - 28,333 446,473 Depreciation - (1,407,394) - (13,339) (128,995) (169,621) - (1,719,349) Carrying amount at end of period 54,810,000 202,890,621 0 174,746 1,363,729 1,182,861 1,816,183 262,238,140
Land BuildingsBuildings under
constructionLeasehold
improvements
Plant, furniture and general equipment
Computer equipment,
communication network Works of art Total
31 December 2015 $ $ $ $ $ $ $ $Carrying amount at start of year 54,810,000 207,401,570 730,882 - 1,518,424 2,169,166 1,774,840 268,404,881 Additions - 2,006,929 3,430,396 - 409,367 137,172 10,466 5,994,329 Transfers (a) - 3,321,273 (3,948,350) 174,078 - - - (453,000) Other Disposals - - - - (1,965) (6,592) - (8,557) Expensed Work in Progress - - (140,171) - - - - (140,171) Revaluation increments/(decrements) - (3,682,228) - - - - - (3,682,228) Depreciation - (5,226,418) - - (482,234) (947,262) - (6,655,914) Carrying amount at end of period 54,810,000 203,821,126 72,756 174,078 1,443,592 1,352,483 1,785,306 263,459,340
(a) The Department of Lands is the only agency with the power to sell Crown land. The land is transferred to the Department of Lands for sale and the Authority accounts for the transfer as a distribution to owner.
Information on fair value measurements is provided in Note 26.

Central Institute of TechnologyNOTES TO THE FINANCIAL STATEMENTS 16GLACT &PREV_LDGFOR THE PERIOD 1 JANUARY TO 10 APRIL 2016 1 January - Year Ended
10 April 2016 31 December 2015$ $
26 Fair value measurements
Assets measured at fair value : Level 1 Level 2 Level 3 Fair ValueAt end of period
2016 $ $ $ $Land (Note 25) - 2,160,000 52,650,000 54,810,000 Buildings (Note 25) - 155,000 202,735,621 202,890,621
- 2,315,000 255,385,621 257,700,621
Assets measured at fair value : Level 1 Level 2 Level 3 Fair Value At end of period
2015 $ $ $ $
Land (Note 25) - 2,160,000 52,650,000 54,810,000 Buildings (Note 25) - 155,000 203,666,126 203,821,126
- 2,315,000 256,316,126 258,631,126
There were no transfers between Levels 1, 2 or 3 during the current and the previous period.
Valuation techniques to derive Level 2 fair valuesLevel 2 fair values of Non-current assets held for sale, Land and Buildings (Office Accommodation) are derived using the market approach.Market evidence of sales prices of comparable land and buildings (office accommodation) in close proximity is used to determine price persquare metre.
Non-current assets held for sale have been written down to fair value less costs to sell. Fair value has been determined by reference to marketevidence of sales prices of comparable assets.
Fair value measurements using significant unobservable inputs (Level 3)2016 Land Buildings
$ $Fair Value at start of period 52,650,000 203,666,126 Additions - 476,888 Depreciation Expense - (1,407,394) Fair Value at end of period 52,650,000 202,735,620
2015 Land Buildings$ $
Fair Value at start of period 52,650,000 207,246,570 Additions - 5,328,202 Revaluation increments/(decrements) recognised in Other Comprehensive Income - (3,682,228) Depreciation Expense - (5,226,418)
Fair Value at end of period 52,650,000 203,666,126
Valuation processes
There were no changes in valuation techniques during the period.
Transfers in and out of a fair value level are recognised on the date of the event or change in circumstances that caused the transfer. Transfers aregenerally limited to assets newly classified as non-current assets held for sale as Treasurer's instructions require valuations of land and buildingsto be categorised within Level 3 where the valuations utilise significant Level 3 inputs on a recurring basis.
Buildings (Level 3 fair valies)Fair value for existing use specialised building is determined by reference to the cost of replacing the remaining future economic benefits embodiedin the asset, i.e. the depreciated replacement cost. Depreciated replacement cost is the current replacement cost of an asset less accumulated depreciation calculated on the basis of such cost to reflect the already consumed economic benefit, expired economic benefit or obsolescence, and optimisation (where applicable) of the asset. Determination of the current replacement cost of such assets held by the Institute is calculated by reference to gross project size specifications.
Land (Level 3 fair values) Fair value for restricted use land is based on comparison with market evidence for land with low level utility (high restricted use land). The relevant comparators of land with low level utility is selected by the Western Australian Land Information Authority (Valuation Services) and represents the application of a significant Level 3 input in this valuation methodology. The fair value measurement is sensitive to values of comparator land, with higher values of comparator land correlating with higher estimated fair values of land.
Information about significant unobservable inputs (Level 3) in fair value measurements [where applicable]
Description Fair Value2016$000
Fair Value2015$000
Unobservable inputs
Land 52,650,000 52,650,000
Buildings 202,735,620 203,666,126
Reconciliations of the opening and closing balances are provided in Notes 25.
Basis of ValuationIn the absence of market-based evidence due to the specialised nature of the assets, non-financial assets are valued at Level 3 of the fair value hierarchy on an existinguse basis. The existing use basis recognises that restrictions or limitations have been placed on their use and disposal when they are not determined to be surplus to requirements. These restrictions are imposed by virtue of the assets being held to deliver a specific community service and the Institute's enabling legislation.
Current Use
Depreciated Replacement Cost Consumed economic benefit / obsolescence of asset. Historical cost of building per square metre floor area (m2)
Selection of land with similar approximate utility
ValuationTechnique(s)

Central Institute of TechnologyNOTES TO THE FINANCIAL STATEMENTS 16GLACT &PREV_LDGFOR THE PERIOD 1 JANUARY TO 10 APRIL 2016 1 January - Year Ended
10 April 2016 31 December 2015$ $
27 Intangible assets
Other (Student Management System - Work in Progress)At cost 2,218,925 2,151,909
2,218,925 2,151,909
2,218,925 2,151,909
Reconciliations
OtherCarrying amount at start of period 2,151,909 - Additions 67,016 2,151,909 Carrying amount at end of period 2,218,925 2,151,909
28 Impairment of assets
There were no indications of impairment to property, plant and equipment or intangible assets at 10 April 2016.
The Institute held no goodwill or intangible assets with an indefinite useful life during the reporting period. At the end of the reporting period there were no intangible assets not yet available for use.
All surplus assets as at 10 April 2016 have either been classified as assets held for sale or written off.
29 Payables
Current Trade payables 321 - Accrued expenses 1,175,432 2,476,696 Accrued salaries and related costs 568,891 577,041 Paid parental leave payable 4,993 3,943 Total current 1,749,637 3,057,680
See also note 2(q) 'Payables' and note 43 'Financial Instruments'.
30 Provisions
CurrentEmployee benefits provision Annual leave (a) 1,482,684 2,370,863 Long service leave (b) 10,388,455 10,185,797 Professional Leave (c) 855,335 - Accrued Days Off (c) 103,161 - Deferred Salary Scheme (d) 119,578 99,527
12,949,214 12,656,187 Other provisions Employment on-costs (e) 826,280 806,610
826,280 806,610
Total current 13,775,494 13,462,797
Non-currentEmployee benefits provision Long service leave (b) 3,342,942 3,331,661
3,342,942 3,331,661 Other provisions Employment on-costs (e) 215,674 213,778
215,674 213,778
Total non-current 3,558,616 3,545,439
(a) Annual leave liabilities have been classified as current as there is no unconditional right to defer settlement for at least 12 months after the end of the reporting period. Assessments indicate that actual settlement of the liabilities is expected to occur as follows:
Within 12 months of the end of the reporting period 1,292,311 2,066,451 More than 12 months after the end of the reporting period 190,372 304,413
1,482,683 2,370,863
(b) Long service leave liabilities have been classified as current where there is no unconditional right to defer settlement for at least 12 months after the end of the reporting period. Assessments indicate that actual settlement of the liabilities is expected to occur as follows:
Within 12 months of the end of the reporting period 5,155,208 5,074,888 More than 12 months after the end of the reporting period 8,576,189 8,442,570
13,731,397 13,517,458
c) Professional Allowance Leave is additional leave granted to Lecturers on an annual basis. This leave must be used each calendar year and cannot be accrued from year to year. Given the terms of this arrangement the entire liability is expected to be settled within 12 months.
The provision for Accrued Days Off is a similar arrangment, with the entire provision expected to be settled in the next 12 months.
(d) Deferred salary scheme liabilities have been classified as current where there is no unconditional right to defer settlement for at least 12 months after the end of the reporting period. Actual settlement of the liabilities is expected to occur as follows:
Within 12 months of the end of the reporting period - - More than 12 months after the end of the reporting period 119,578 99,527
119,578 99,527
(e) The settlement of annual and long service leave liabilities gives rise to the payment of employment on-costs including workers' compensation insurance. The provision is the present value of expected future payments. The associated expense, apart from the unwinding of the discount (finance cost), is disclosed in note 12 'Other expenses'.

Central Institute of TechnologyNOTES TO THE FINANCIAL STATEMENTS 16GLACT &PREV_LDGFOR THE PERIOD 1 JANUARY TO 10 APRIL 2016 1 January - Year Ended
10 April 2016 31 December 2015$ $
Movements in other provisionsMovements in each class of provisions during the financial year, other than employee benefits, are set out below.
Employment on-cost provisionCarrying amount at start of period 1,020,388 1,122,005 Additional provisions recognised 482,220 717,409 Payments/other sacrifices of economic benefits (460,654) (819,026) Carrying amount at end of period 1,041,954 1,020,388
31 Other liabilities
Current Income received in advance (a) 13,902,928 5,589,497 Grants and advances (provide details) - 1,694,159 Money/deposits held in trust 173,387 171,728 Total current 14,076,315 7,455,384
(a) Income received in advance comprises:Department of Training and Workforce Development - International Student Fees 2,122,557 - Department of Training and Workforce Development - Read Write Now Program 115,627 - Other Government (Commonwealth - VET Fee Help and Fee Help funds) 4,805,375 4,982,224 Fee for service 1,910,694 443,920 Student fees and charges 4,773,415 - Other 175,260 163,353
13,902,928 5,589,497
32 EquityThe Western Australian Government holds the equity interest in the Institute on behalf of the community. Equity represents the residual interest in the net assets of the Institute. The asset revaluation surplus represents that portion of equity resulting from the revaluation of non-current assets.
Contributed equityBalance at start of period 66,366,179 65,859,250
Contributions by ownersTransfer of net assets from other agencies - 2,006,929
Total contributions by owners - 2,006,929
Distributions to ownersTransfer of net assets to other agencies - (1,500,000) (Institute contribution for upgrade to Mt Lawley campus being coordinated by the Department of Training and Workforce Development)Total distributions to owners - (1,500,000)
Balance at end of period 66,366,179 66,366,179
ReservesAsset revaluation surplusBalance at start of period 109,004,937 112,687,165 Net revaluation increments/(decrements): Buildings - (3,682,228) Balance at end of period 109,004,937 109,004,937
109,004,937 109,004,937 Accumulated surplus/(deficit) Balance at start of period 113,775,230 115,066,519 Result for the period (1,718,172) (1,291,289) Balance at end of period 112,057,058 113,775,230
Total Equity at end of period 287,428,174 289,146,346
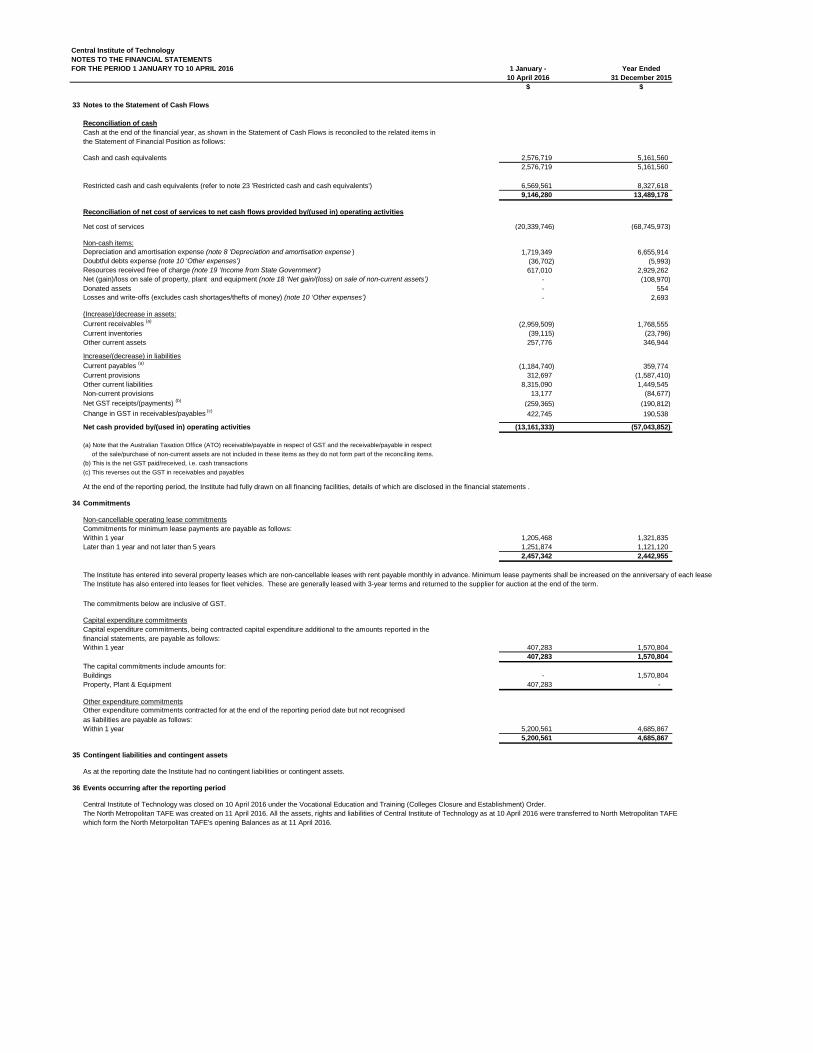
Central Institute of TechnologyNOTES TO THE FINANCIAL STATEMENTS 16GLACT &PREV_LDGFOR THE PERIOD 1 JANUARY TO 10 APRIL 2016 1 January - Year Ended
10 April 2016 31 December 2015$ $
33 Notes to the Statement of Cash Flows
Reconciliation of cashCash at the end of the financial year, as shown in the Statement of Cash Flows is reconciled to the related items in the Statement of Financial Position as follows:
Cash and cash equivalents 2,576,719 5,161,560 2,576,719 5,161,560
Restricted cash and cash equivalents (refer to note 23 'Restricted cash and cash equivalents') 6,569,561 8,327,618 9,146,280 13,489,178
Reconciliation of net cost of services to net cash flows provided by/(used in) operating activities
Net cost of services (20,339,746) (68,745,973)
Non-cash items:Depreciation and amortisation expense (note 8 'Depreciation and amortisation expense ) 1,719,349 6,655,914 Doubtful debts expense (note 10 ‘Other expenses’) (36,702) (5,993) Resources received free of charge (note 19 ‘Income from State Government’) 617,010 2,929,262 Net (gain)/loss on sale of property, plant and equipment (note 18 ‘Net gain/(loss) on sale of non-current assets’) - (108,970) Donated assets - 554 Losses and write-offs (excludes cash shortages/thefts of money) (note 10 ‘Other expenses’) - 2,693
(Increase)/decrease in assets:Current receivables (a) (2,959,509) 1,768,555 Current inventories (39,115) (23,796) Other current assets 257,776 346,944
Increase/(decrease) in liabilitiesCurrent payables (a) (1,184,740) 359,774 Current provisions 312,697 (1,587,410) Other current liabilities 8,315,090 1,449,545 Non-current provisions 13,177 (84,677) Net GST receipts/(payments) (b) (259,365) (190,812) Change in GST in receivables/payables (c) 422,745 190,538
Net cash provided by/(used in) operating activities (13,161,333) (57,043,852)
(a) Note that the Australian Taxation Office (ATO) receivable/payable in respect of GST and the receivable/payable in respect of the sale/purchase of non-current assets are not included in these items as they do not form part of the reconciling items.(b) This is the net GST paid/received, i.e. cash transactions(c) This reverses out the GST in receivables and payables
At the end of the reporting period, the Institute had fully drawn on all financing facilities, details of which are disclosed in the financial statements .
34 Commitments
Non-cancellable operating lease commitmentsCommitments for minimum lease payments are payable as follows:Within 1 year 1,205,468 1,321,835 Later than 1 year and not later than 5 years 1,251,874 1,121,120
2,457,342 2,442,955
The commitments below are inclusive of GST.
Capital expenditure commitmentsCapital expenditure commitments, being contracted capital expenditure additional to the amounts reported in the
Within 1 year 407,283 1,570,804 407,283 1,570,804
The capital commitments include amounts for:Buildings - 1,570,804 Property, Plant & Equipment 407,283 -
Other expenditure commitmentsOther expenditure commitments contracted for at the end of the reporting period date but not recognisedas liabilities are payable as follows:Within 1 year 5,200,561 4,685,867
5,200,561 4,685,867
35 Contingent liabilities and contingent assets
As at the reporting date the Institute had no contingent liabilities or contingent assets.
36 Events occurring after the reporting period
Central Institute of Technology was closed on 10 April 2016 under the Vocational Education and Training (Colleges Closure and Establishment) Order.The North Metropolitan TAFE was created on 11 April 2016. All the assets, rights and liabilities of Central Institute of Technology as at 10 April 2016 were transferred to North Metropolitan TAFEwhich form the North Metorpolitan TAFE's opening Balances as at 11 April 2016.
financial statements, are payable as follows:
The Institute has entered into several property leases which are non-cancellable leases with rent payable monthly in advance. Minimum lease payments shall be increased on the anniversary of each lease The Institute has also entered into leases for fleet vehicles. These are generally leased with 3-year terms and returned to the supplier for auction at the end of the term.

Central Institute of TechnologyNOTES TO THE FINANCIAL STATEMENTS 16GLACT &PREV_LDGFOR THE PERIOD 1 JANUARY TO 10 APRIL 2016 1 January - Year Ended
10 April 2016 31 December 2015$ $
37 Explanatory statement
Significant variations between estimates and actual results for 2016 and between actual results for 2015 and 2016 are shown below.Significant variances are considered to be those greater than 5% or 2% of the total cost of services.
Statement of Comprehensive Income 2016Variance 2016 2016 2015
Note Actual
Jan - 10 Apr Estimate
for 12 months Year ended 31
Dec COST OF SERVICES ExpensesEmployee benefits expense 25,049,728 95,389,432 90,498,875 (70,339,704) (65,449,147) Supplies and services 5,186,153 23,888,408 25,508,463 (18,702,255) (20,322,310) Depreciation and amortisation expenses 1,719,349 7,216,666 6,655,914 (5,497,317) (4,936,565) Grants and subsidies 7,406 43,815 26,842 (36,409) (19,436) Cost of sales 121,415 595,202 363,797 (473,787) (242,383) Loss on disposal of non current assets - 2,334 - (2,334) - Other expenses 1,937,392 7,996,656 8,121,690 (6,059,264) (6,184,298) Total cost of services 34,021,443 135,132,513 131,175,582 (101,111,070) (97,154,139)
Income Revenue
Fees for services 6,953,895 32,967,127 32,511,421 (26,013,232) (25,557,526) Student fees and charges 5,800,902 24,809,876 20,472,586 (19,008,974) (14,671,684) Anciliary Trading 13,816 214,536 127,499 (200,720) (113,682) Sales 194,062 502,497 495,892 (308,435) (301,830) Commonwealth grants and contributions 17,538 834,221 419,228 (816,683) (401,690) Interest revenue 508,688 1,500,643 1,797,711 (991,955) (1,289,023) Other revenue 192,796 871,723 6,493,284 (678,927) (6,300,488) Total Revenue 13,681,697 61,700,623 62,317,620 (48,018,925) (48,635,922)
Gains Gains on disposal of non current assets - - 111,989 - (111,989) Total Gains - - 111,989 - (111,989)
Total income other than income from State Government 13,681,697 61,700,623 62,429,609 (48,018,926) (48,747,912) NET COST OF SERVICES 20,339,746 73,431,890 68,745,973 (53,092,144) (48,406,226)
INCOME FROM GOVERNMENT Service appropriation 18,004,564 65,455,079 64,525,422 (47,450,515) (46,520,858) Service received free of charge 617,010 2,578,000 2,929,262 (1,960,990) (2,312,252) Total Income from State Government 18,621,574 68,033,079 67,454,684 (49,411,505) (48,833,110)
SURPLUS/ DEFICIT FOR THE PERIOD (1,718,172) (5,398,811) (1,291,289) 3,680,638 (426,884)
OTHER COMPREHENSIVE INCOME Items not classified subsequently to profit or loss Changes in asset revaluation surplus B - - (3,682,228) - 3,682,228 Total Other Comprehensive Income - - (3,682,228) - 3,682,228
TOTAL COMPREHENSIVE INCOME FOR THE PERIOD (1,718,172) (5,398,811) (4,973,517) 3,680,639 3,255,345
Narrative on variances between 2016 estimate and 2016 actual1. The variance is due to the estimates being prepared on the basis of a full year of operations whilst the actual results reflect that the college was closed on 10 April 2016.
Narrative on variances between 2016 actual and prior yearA. The variance is due to the prior year actuals being for a full year of operations whilst the actual results reflect that the college was closed on the 10 April 2016.B. A revaluation of land and buildings was not performed in 2016 compared to a revaluation decrement on land and buildings in 2015.
Variance between
Estimate and Actual 1
Variance between
Actual 2016 and 2015 A

Central Institute of TechnologyNOTES TO THE FINANCIAL STATEMENTS 16GLACT &PREV_LDGFOR THE PERIOD 1 JANUARY TO 10 APRIL 2016 1 January - Year Ended
10 April 2016 31 December 2015$ $
37 Explanatory statement (continued)2016 2016 2015
Statement of Financial Position
ASSETS Current AssetsCash and Cash equivalents 2,576,719 18,604,057 5,161,560 (16,027,338) (2,584,841) Restricted cash and cash equivalents 6,213,561 1,071,399 8,048,618 5,142,162 (1,835,057) Inventories 217,523 153,777 178,407 63,746 39,116 Receivables 5,251,157 4,405,669 2,542,442 845,488 2,708,715 Other current assets 316,211 620,368 573,988 (304,157) (257,777) Other financial assets 41,200,000 20,100,000 34,272,382 21,100,000 6,927,618 Total Current Assets 55,775,171 44,955,271 50,777,397 10,819,900 4,997,774
Non-Current Assets Restricted cash and cash equivalents 356,000 - 279,000 356,000 77,000 Property, plant and equipment 262,238,140 261,395,194 263,459,340 842,946 (1,221,200) intangible assets 2,218,925 2,166,667 2,151,909 52,258 67,016 TOTAL NON CURRENT ASSETS 264,813,065 263,561,861 265,890,249 1,251,204 (1,077,184)
TOTAL ASSETS 320,588,236 308,517,132 316,667,646 12,071,104 3,920,589
LIABILITIES Current Liabilities Payables 1,749,637 2,418,726 3,057,680 (669,089) (1,308,043) Provisions 13,775,493 12,935,612 13,462,797 839,881 312,696 Other current liabilities 14,076,316 2,378,788 7,455,385 11,697,528 6,620,931 Total Current Liabilities 29,601,446 17,733,126 23,975,861 11,868,320 5,625,585
Non-Current LiabilitiesProvisions 3,558,616 4,175,000 3,545,439 (616,384) 324,154 Total Non-Current Liabilities 3,558,616 4,175,000 3,545,439 (616,384) 324,154
TOTAL LIABILITIES 33,160,062 21,908,126 27,521,300 11,251,936 5,949,739
NET ASSETS 287,428,174 286,609,006 289,146,346 (819,168) 2,029,150
EQUITY Contributed equity 66,366,179 66,366,180 66,366,179 (1) (0) Reserves 109,004,937 112,687,165 109,004,937 (3,682,228) 0 Accumulated surplus/(deficit) 112,057,058 107,555,661 113,775,230 4,501,397 (1,718,172) TOTAL EQUITY 287,428,174 286,609,006 289,146,346 819,168 (1,718,171)
Narrative on variances between 2016 estimate and 2016 actual2. The variance is due to the estimates reflecting the financial position of the college after a full year of operations but the actual results reflect that the college was closed on 10 April 2016
Narrative on variances between 2016 actual and prior yearC. The variance is a result of the balances in 2015 reflecting a full year of operations in comparison to 2016 when the college was closed on 10 April 2016.
Actual As at 10 Apr
2016Estimate
for 12 months As at 31 Dec 2015
Variance between
Estimate and Actual 2
Variance between
Actual 2016 and 2015 C

Central Institute of TechnologyNOTES TO THE FINANCIAL STATEMENTS 16GLACT &PREV_LDGFOR THE PERIOD 1 JANUARY TO 10 APRIL 2016 1 January - Year Ended
10 April 2016 31 December 2015$ $
37 Explanatory statement (continued)2016 2016 2015
STATEMENT OF CASHFLOWS 1 Jan - 10 AprEstimate
for 12 monthsYear ended
31 Dec
Cashflows from State Government
Service appropriation 16,311,219 61,807,616 63,034,164 (45,496,397) (46,722,945) Net cash provided by State Government 16,311,219 61,807,616 63,034,164 (45,496,397) (46,722,945)
Cashflows from Operating Activities
PaymentsEmployee benefits (24,421,471) (94,958,356) (92,807,353) 70,536,885 68,385,882 Supplies and Services (5,728,215) (21,281,796) (21,465,287) 15,553,581 15,737,072 Finance Costs - - Grants and subsidies (7,406) (43,815) (26,842) 36,409 19,436 GST payments on purchases (673,242) (3,314,671) (3,027,355) 2,641,429 2,354,113 GST payments to taxation authority - (150,286) (214,191) 150,286 214,191 Other payments (2,239,614) (8,341,047) (8,387,723) 6,101,433 6,148,109
Receipts Fee for service 10,615,198 32,934,437 32,459,777 (22,319,239) (21,844,579) Student fees and charges 7,175,585 24,524,330 21,020,824 (17,348,745) (13,845,239) Ancillary trading 13,816 214,536 127,499 (200,720) (113,683) Commonwealth grants and contributions 501,360 834,221 3,390,604 (332,861) (2,889,244) Interest received 370,806 1,500,643 1,730,871 (1,129,837) (1,360,065) GST receipts on sales 413,877 1,395,060 1,798,223 (981,183) (1,384,346) GST receipts from taxation authority 422,746 2,069,896 1,252,512 (1,647,150) (829,766) Other receipts 395,227 1,375,053 7,104,589 (979,826) (6,709,362) Net cash provided by/(used in) operating activities 13,161,333 63,241,795 57,043,852 (50,080,462) (43,882,519)
Cash Flows from Investing Activities
PaymentsPurchase of non-current assets (565,167) (2,500,000) (5,545,582) 1,934,833 4,980,415 Movements in Term Deposits (6,927,618) - 1,727,619 (6,927,618) (8,655,237) Capital Contribution - - (1,500,000) - 1,500,000 ReceiptsProceeds from sale of non-current assets 120,546 - (120,546) Net cash provided by/(used in) investing activities (7,492,785) (2,500,000) (5,197,417) (4,992,785) (2,295,368)
Net increase/(decrease) in cash and cash equivalents (4,342,899) (3,934,179) 792,895 (408,720) (5,135,794) Cash and cash equivalents at the beginning of the period 13,489,178 23,609,635 12,696,283 (10,120,457) 792,895 CASH AND CASH EQUIVALENTS AT THE END OF THE PERIOD 9,146,280 19,675,456 13,489,178 (10,529,177) (4,342,899)
Narrative on variances between 2016 estimate and 2016 actual3. The variance is due to the estimates being prepared on the basis of a full year of operations whilst the actual results reflect that the college was closed on 10 April 2016.
Narrative on variances between 2016 actual and prior yearD. The variance is due to the prior year actuals being for a full year of operations whilst the actual results reflect that the college was closed on the 10 April 2016.
Variance between
Estimate and Actual 3
Variance between
Actual 2016 and 2015 D

Central Institute of TechnologyNOTES TO THE FINANCIAL STATEMENTS 16GLACT &PREV_LDGFOR THE PERIOD 1 JANUARY TO 10 APRIL 2016 1 January - Year Ended
10 April 2016 31 December 2015$ $
38 Financial instruments
(a) Financial risk management objectives and policiesFinancial instruments held by the Institute are cash and cash equivalents, restricted cash and cash equivalents,receivables and payables. The Institute has limited exposure to financial risks. The Institute's overall risk management program focuses on managing the risk identified below:
Credit riskCredit risk arises when there is the possibility of the Institute’s receivables defaulting on their contractual obligations resulting in financial loss to the Institute.
The maximum exposure to credit risk at the end of the reporting period in relation to each class of recognised financial assetsis the gross carrying amount of those assets inclusive of any allowance for impairment as shown in the table at note 38(c) ‘Financial instruments disclosures’ and note 22 ‘Receivables’.
Credit risk associated with the Institute’s financial assets is minimal because the Institute trades only with recognised, creditworthy third parties. The Institute has policies in place to ensure that sales of products and services are made to customers with an appropriate credit history. In addition, receivable balances are monitored on an ongoing basis with the result that the Institute's exposure to bad debt is minimal. At the end of the reporting period there are no significant concentrations of credit risk.
Liquidity risk arises when the Institute is unable to meet its financial obligations as they fall due.
The Institute is exposed to liquidity risk through its trading in the normal course of business.
Market risk is the risk that changes in market prices such as foreign exchange rates and interest rates will affect the Institute's income or the value of its holdings of financial instruments. The Institute does not trade in foreign currency and is not materially
(b) Categories of financial instrumentsThe carrying amounts of each of the following categories of financial assets and financial liabilities at the end of the reporting period are : 2016 2015
$ $Financial AssetsCash and cash equivalents 2,576,719 5,161,560 Restricted cash and cash equivalents 6,569,561 8,327,618 Receivables (a) 5,007,151 2,063,014 Other financial assets 41,200,000 34,272,382
Financial LiabilitiesPayables 1,749,637 3,057,680 DPA Clawback provision - 1,694,159 (a) The amount of loans and receivables excludes GST recoverable from the ATO (statutory receivable).
(c) Financial instrument disclosuresCredit riskThe following table discloses the Institute's maximum exposure to credit risk and the ageing analysis of financial assets. The Institute's maximum exposure tocredit risk at the end of the reporting period is the carrying amount of financial assets as shown below. The table discloses the ageing of financial assetsthat are past due but not impaired and impaired financial assets. The table is based on information provided to senior management of the Institute.
The Institute does not hold any collateral as security or other credit enhancements relating to the financial assets it holds.
Carrying Amount
Not past due and not impaired Up to 1 month 1-3 months
3 months to 1 year 1-5 Years
Impaired Financial Assets
$ $ $ $ $ $ $Financial Assets2016Cash and cash equivalents 2,576,719 2,576,719 - - - - - Restricted cash and cash equivalents 6,569,561 6,569,561 - - - - - Receivables (a) 5,007,151 3,836,720 788,668 41,346 143,611 1,827 194,979 Other financial assets 41,200,000 41,200,000 - - - - -
55,353,431 54,183,000 788,668 41,346 143,611 1,827 194,979 2015
Cash and cash equivalents 5,161,560 5,161,560 - - - - - Restricted cash and cash equivalents 8,327,618 8,327,618 - - - - - Receivables (a) 2,063,014 1,375,877 181,504 165,468 104,593 3,890 231,681 Other financial assets 34,272,382 34,272,382 - - - - -
49,824,574 49,137,437 181,504 165,468 104,593 3,890 231,681
(a) The amount of receivables excludes the GST receivables from the ATO (statutory receivable).
Liquidity risk
The Institute has appropriate procedures to manage cash flows including drawdowns of appropriations by monitoring forecastcash flows to ensure that sufficient funds are available to meet its commitments.
Market risk
exposed to other price risks. The Institute's exposure to market risk for changes in interest rates relates primarily to the long-term debt obligations.
Ageing analysis of financial assets
Past due but not impaired

Central Institute of TechnologyNOTES TO THE FINANCIAL STATEMENTS 16GLACT &PREV_LDGFOR THE PERIOD 1 JANUARY TO 10 APRIL 2016 1 January - Year Ended
10 April 2016 31 December 2015$ $
Liquidity risk and interest rate exposure
The following table details the Institute’s interest rate exposure and the contractual maturity analysis of financial assets and financial liabilities. The maturity analysis section includes interest and principal cash flows. The interest rate exposure section analyses only the carrying amounts of each item.
Interest rate exposure and maturity analysis of financial assets and financial liabilities
Weighted Average Effective Interest
RateCarrying Amount
Fixed Interest Rate
Variable Interest Rate
Non-Interest Bearing Nominal Amount Up to 1 month 1-3 months
3 months to 1 year
% $ $ $ $ $ $ $ $2016Financial AssetsCash and cash equivalents 1.75% 2,576,719 - 2,547,639 29,080 2,576,719 2,547,639 - -
Restricted cash and cash equivalents 1.77% 6,569,561 6,569,561 - - 6,569,561 6,469,561 - 100,000 Receivables (a) 5,007,151 - - 5,007,151 5,007,151 5,007,151 - - Other financial assets 3.10% 41,200,000 41,200,000 - - 41,200,000 8,700,000 32,500,000 -
55,353,431 47,769,561 2,547,639 5,036,231 55,353,431 22,724,351 32,500,000 100,000 Financial LiabilitiesPayables 1,749,637 - - 1,749,637 1,749,637 1,749,637 - -
1,749,637 - - 1,749,637 1,749,637 1,749,637 - -
(a) The amount of receivables excludes the GST receivables from the ATO (statutory receivable).
Weighted Average Effective Interest
RateCarrying Amount
Fixed Interest Rate
Variable Interest Rate
Non-Interest Bearing Nominal Amount Up to 1 month 1-3 months
3 months to 1 year
% $ $ $ $ $ $ $ $2015Financial AssetsCash and cash equivalents 1.75% 5,161,560 - 5,134,630 26,930 5,161,560 5,134,630 - -
Restricted cash and cash equivalents 3.11% 8,327,618 8,327,618 - - 8,327,618 - 8,227,618 100,000 Receivables (a) 2,063,014 - - 2,063,014 2,063,014 2,063,014 - - Other financial assets 3.11% 34,272,382 34,272,382 - - 34,272,382 - 28,272,382 6,000,000
49,824,574 42,600,000 5,134,630 2,089,945 49,824,575 7,197,644 36,500,000 6,100,000
Financial LiabilitiesPayables 3,057,680 - - 3,057,680 3,057,680 3,057,680 - - DPA clawback provision 1,694,159 - - 1,694,159 1,694,159 1,694,159 - -
4,751,839 - - 4,751,839 4,751,839 4,751,839 - -
(a) The amount of receivables excludes the GST receivables from the ATO (statutory receivable).
Interest rate sensitivity analysis
change in interest rates is held constant throughout the reporting period.
Carrying amountSurplus Equity Surplus Equity
10 April 2016 $ $ $ $ $
Financial AssetsCash and Cash equivalents 2,576,719 (25,476) (25,476) 25,476 25,476 Restricted cash and cash equivalents 6,569,561 (65,696) (65,696) 65,696 65,696 Other financial assets 41,200,000 (412,000) (412,000) 412,000 412,000
Total Increase/(Decrease) 50,346,280 (503,172) (503,172) 503,172 503,172
Carrying amountSurplus Equity Surplus Equity
31 December 2015 $ $ $ $ $
Financial AssetsCash and Cash equivalents 5,161,560 (51,346) (51,346) 51,346 51,346 Restricted cash and cash equivalents 8,327,618 (83,276) (83,276) 83,276 83,276 Other financial assets 34,272,382 (342,724) (342,724) 342,724 342,724
Total Increase/(Decrease) 47,761,560 (477,346) (477,346) 477,346 477,346
Fair valuesAll financial assets and liabilities recognised in the Statement of Financial Position, whether they are carried at cost or fair value, are recognised at amounts that represent a reasonable approximation of fair value unless otherwise stated in the applicable notes.
Maturity dates
Maturity dates
+ 100 Basis Points- 100 Basis Points
- 100 Basis Points
Interest rate exposure
Interest rate exposure
The following table represents a summary of the interest rate sensitivity of the Institute's financial assets and liabilities at the end of the reporting period on the surplus for the period and equity for a 1% change in interest rates. It is assumed that the
+ 100 Basis Points

Central Institute of TechnologyNOTES TO THE FINANCIAL STATEMENTS 16GLACT &PREV_LDGFOR THE PERIOD 1 JANUARY TO 10 APRIL 2016 1 January - Year Ended
10 April 2016 31 December 2015$ $
39 Remuneration of members of the Accountable Authority of Governing Council
$ 2016 2015$0 - $10,000 6 7 $70,000 - $80,000 1 - $290,001 - $300,000 - 1
$ $Base remuneration and superannuation 79,468 278,088 Annual leave and long service leave accruals (2,418) 2,733 Other benefits 512 23,025 Total remuneration of the members of the Institute 77,562 303,846
The total remuneration includes the superannuation expense incurred by the Institute in respect of members of the Institute.
Remuneration of senior officers
2016 2015$$10,001 - $20,000 - 1 $30,001 - $40,000 1 * 1 $40,001 - $50,000 3 * - $50,001 - $60,000 2 * - $150,001 - $160,000 - 1 $170,001 - $180,000 - 1 $180,001 - $190,000 - 1 $190,001 - $200,000 - 1 $240,001 -$250,000 - 2 $250,001 - $260,000 - 1
$ $Base remuneration and superannuation 282,084 1,479,023 Annual leave and long service leave accruals 119 9,839 Other benefits - 5,022 Total remuneration of senior officers 282,203 1,493,884
The total remuneration includes the superannuation expense incurred by the Institute in respect of senior officers otherthan senior officers reported as members of the Institute.
No senior officers are members of the Pension Scheme.
* The amounts paid to senior officers represent only payments made to staff from 1 January to 10 April, hence the remuneration paid to senior offers is much lower than in 2015.
40 Remuneration of auditorRemuneration paid or payable to the Auditor General in respect to the audit for the current financial year is as follows:
2016 2015$ $
Auditing the accounts, financial statements and key performance indicators 56,000 105,000
The amount of $56,000 for the 2016 audit is payable by the Department of Training and Workforce Development on the Institute's behalf.
41 Related bodiesThe Institute has no related bodies.
42 Affiliated bodiesThe Institute has no affiliated bodies.
43 Supplementary financial information2016 2015
(a) Write-Offs $ $ Public property written-off by the Governing Council during the financial year - 139,752 Bad debts - 70,285 Inventory 1,191 2,315 Other (Supplier credit balances) - 578
1,191 212,930
(b) Losses through theft, defaults and other causes Losses of public money and public and other property through theft or default - 8,294 Amounts recovered - (4,750)
- 3,544 44 Schedule of income and expenditure by service
The Institute provides only one service (as defined by Treasurer's Instruction 1101 (9) and that is Vocational Education and Training Delivery.
Remuneration of members of the InstituteThe number of members of the Institute whose total of fees, salaries, superannuation, non-monetary benefits and other benefits for the financial year, fall within the following bands are:
The number of senior officers other than senior officers reported as members of the Institute, whose total of fees,salaries, superannuation, non-monetary benefits and other benefits for the financial year, fall within the following bands are: