central bureau of (ages 15 and over) statistics - למ"ס · editor: nurit yaffe design...
TRANSCRIPT
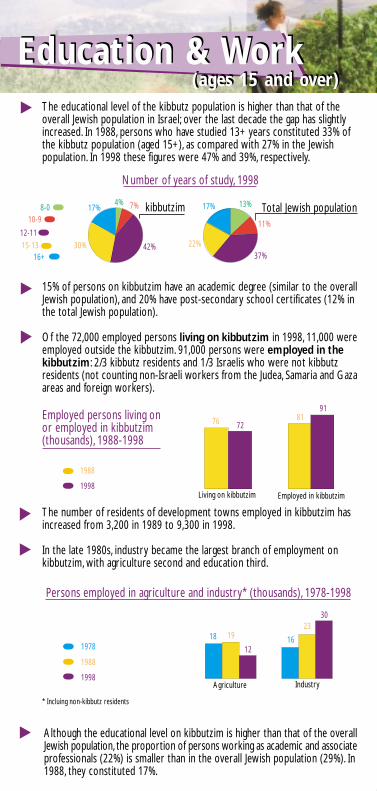
Persons employed in agriculture and industry* (thousands), 1978-1998
Food and beverages Metal, metal products and machinery Other
Jerusalem District 13%
Southern District 15%
Central District 6%Haifa District 6% 60% Northern District
Nights spent on kibbutzim, 1998
Industrial branches in kibbutzim 1996
34%26%
19%
21%
17%
14%
19%
50%
31%22%
9%
38%
IndustryAgriculture
16
2330
18 19
12
8191
Employed in kibbutzim
76 72
Living on kibbutzim
Number of years of study, 1998
Editor: Nurit Yaffe DESIGN PRODUCTION: ELTAN VISUAL COMMUNICATION
State of IsraelCentral Bureau of
Statistics
30% 42%
17%4% 7% kibbutzim
10-98-0
12-11
16+15-13 22%
37%
17% 13%
11%
Total Jewish population
Employed persons living onor employed in kibbutzim(thousands), 1988-1998
1988
1998
1978
1988
1998
Yad Tabenkin
Yohanan Simon, An evening on the kibbutz, 1947
KIBBUTZIM
15% of persons on kibbutzim have an academic degree (similar to the overallJewish population), and 20% have post-secondary school certificates (12% inthe total Jewish population).
Of the 72,000 employed persons living on kibbutzim in 1998, 11,000 wereemployed outside the kibbutzim. 91,000 persons were employed in thekibbutzim: 2/3 kibbutz residents and 1/3 Israelis who were not kibbutzresidents (not counting non-Israeli workers from the Judea, Samaria and Gazaareas and foreign workers).
Kibbutz industry includes 360 factories and eleven regional corporations,employing approximately 30,000 persons in 1996 (8.6% of all persons employedin industry in Israel). Income from kibbutz industry was NIS 13.7 billion (10.2%),the gross product was NIS 3.9 billion (8.3%), investments amounted to NIS0.9 billion, and the value of exports was NIS 3.6 billion (9.4%).
Kibbutz industry is concentrated in three groups of branches: plastics, rubberand chemicals; food and beverages; metal, metal products and machinery. Therespective concentration of these groups of branches in the overall industryin Israel is much lower.
Wages per employee in kibbutz industry are lower (NIS 76,400 per year) thanin Israeli industry in general (NIS 89,700).
In 1998, kibbutz members constituted 38% of all persons working in industryon kibbutzim.130 kibbutzim offer guest accomodations. In 1998 these included 5,500 roomsand 18,500 beds - 73% of which are in “zimmers” and 27% in guest houses.Of the nights spent in “zimmers” 17% were of foreign tourists, and in guesthouses - 42%.
The educational level of the kibbutz population is higher than that of theoverall Jewish population in Israel; over the last decade the gap has slightlyincreased. In 1988, persons who have studied 13+ years constituted 33% ofthe kibbutz population (aged 15+), as compared with 27% in the Jewishpopulation. In 1998 these figures were 47% and 39%, respectively.
The number of residents of development towns employed in kibbutzim hasincreased from 3,200 in 1989 to 9,300 in 1998.
In the late 1980s, industry became the largest branch of employment onkibbutzim, with agriculture second and education third.
Although the educational level on kibbutzim is higher than that of the overallJewish population, the proportion of persons working as academic and associateprofessionals (22%) is smaller than in the overall Jewish population (29%). In1988, they constituted 17%.
Employed Persons Income Exports
For additional information:
Central Bureau of StatisticsTel. 972-2-6592666 Fax. 972-2-6521340
Internet Site: www.cbs.gov.ilE-Mail: [email protected]
Yad TabenkinTel. 972-3-5346268 Fax. 972-3-5346376
Industry & Tourism
Plastics, rubber and chemicals
January 2000
* Incluing non-kibbutz residents
Education & Work(ages 15 and over)
STATISTICAL 6
Education & Work Industry & Tourism(ages 15 and over)
Number of kibbutzim by district, 1998
Main components of population change, 1998
±π∂∏
±π∑∏
±π∏∏
±¥∞
±≥∞
±≤∞
±±∞
±∞∞
π∞
∏∞
thousands
±ππ∏
Kibbutz population, 1968-1998
New immigrants2,600
Born1,700
Died800
Entered from other localities in Israel4,200
Left for other localities in Israel8,000
Kibbutz agriculture as a percentage of agriculture in Israel, 1997
FlowersFruitplantations
Vegetables,potatoes and melons
Field crops
5%13%
0% 1%
83%75%
12% 11%
Agricultural land of kibbutzim, 1997 Fish ponds 2%
Crops 63%
24%Natural pasture
11% Other(uncultivated landroads, etc.)
Crop land in kibbutzim, 1987-1997
19871997
Value added of agricultural output
Persons employed in agriculture on kibbutzim
Agricultural land
Fruit plantations
Of these: citrus
Field crops
Vegetables
Fish ponds
Cattle
Milk
Eggs
Water use
33%27%
38%
20%18%
49%
36%97%
38%51%
3%49%
In 1998 the population of the kibbutzim decreased by 700 persons.
The kibbutz population is aging; that most of the leavers are young acceleratesthis process. Between 1988 and 1998, the median age increased by 2.9 years(1.8 years in the Jewish population as a whole); the number of children aged0-4 decreased by 30% and that of persons aged 65+ increased by 10%.
Tel Aviv District 1
Added Subtracted
Jerusalem District 8
Haifa District 23
Central District 31
Southern District 65
Northern District 130
Judea, Samaria and Gaza Areas
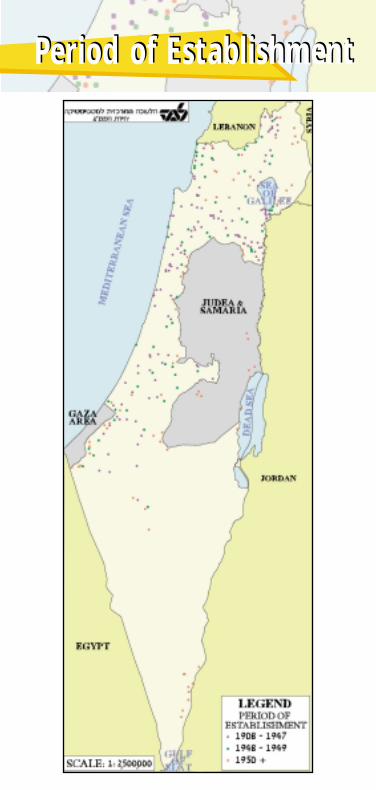
Period of EstablishmentThe first kibbutz was founded on 1908. By the end of 1948 there were 54,200people (6% of the population) living on 177 kibbutzim*. At the end of 1998there were 267 kibbutzim with 115,500 inhabitants - 2% of the population.* Plural of kibbutz in Hebrew.
The population of the kibbutzim increased until the late 1980s; since then ithas been decreasing. The immigrants of 1990-1991 who settled on kibbuzimhalted this trend temporarily. During 1992-1998 the population of the kibbutzimdecreased by approximately 14,000 persons (-11%). During this period theJewish population of Israel increased by 15% (the total population - by 19%).
Population AgricultureThe net domestic product from kibbutz agriculture increased over the years,as with Israeli agriculture in general; however, its proportion of the total productdecreased, in view of the relatively greater increase in other product components(particularly the industrial product), and the decline in the relative price ofagricultural products.
The share of the kibbutzim in the gross value added of agriculture has decreasedsince the early eighties due to the decrease in field crops, primarily cotton.
Israel’s agricultural land, aside from that of the kibbutzim, is divided as follows:38% in moshavim and collective moshavim, 9% in private ownership and otherentities in the Jewish sector, and 15% in the Arab sector.
Following the decrease in the profitability of agriculture, the number of kibbutzmembers working in this branch decreased. This was accompanied by an increasein the number of employees.
54% of the value of the kibbutz agricultural output is from livestock, and 46%from crops.
Over the years, the field crops branch in the kibbutzim has decreased (primarilydue to the decrease in cottom growing), even though it has remained the largestbranch; the proportion of the vegetable, potatoes and melons branch hasincreased. The flowers branch has grown rapidly, even though it is still only asmall part of all crops.
AgriculturePopulationPeriod of Establishment

Number of kibbutzim by district, 1998
Main components of population change, 1998
±π∂∏
±π∑∏
±π∏∏
±¥∞
±≥∞
±≤∞
±±∞
±∞∞
π∞
∏∞
thousands
±ππ∏
Kibbutz population, 1968-1998
New immigrants2,600
Born1,700
Died800
Entered from other localities in Israel4,200
Left for other localities in Israel8,000
Kibbutz agriculture as a percentage of agriculture in Israel, 1997
FlowersFruitplantations
Vegetables,potatoes and melons
Field crops
5%13%
0% 1%
83%75%
12% 11%
Agricultural land of kibbutzim, 1997 Fish ponds 2%
Crops 63%
24%Natural pasture
11% Other(uncultivated landroads, etc.)
Crop land in kibbutzim, 1987-1997
19871997
Value added of agricultural output
Persons employed in agriculture on kibbutzim
Agricultural land
Fruit plantations
Of these: citrus
Field crops
Vegetables
Fish ponds
Cattle
Milk
Eggs
Water use
33%27%
38%
20%18%
49%
36%97%
38%51%
3%49%
In 1998 the population of the kibbutzim decreased by 700 persons.
The kibbutz population is aging; that most of the leavers are young acceleratesthis process. Between 1988 and 1998, the median age increased by 2.9 years(1.8 years in the Jewish population as a whole); the number of children aged0-4 decreased by 30% and that of persons aged 65+ increased by 10%.
Tel Aviv District 1
Added Subtracted
Jerusalem District 8
Haifa District 23
Central District 31
Southern District 65
Northern District 130
Judea, Samaria and Gaza Areas
Period of EstablishmentThe first kibbutz was founded on 1908. By the end of 1948 there were 54,200people (6% of the population) living on 177 kibbutzim*. At the end of 1998there were 267 kibbutzim with 115,500 inhabitants - 2% of the population.* Plural of kibbutz in Hebrew.
The population of the kibbutzim increased until the late 1980s; since then ithas been decreasing. The immigrants of 1990-1991 who settled on kibbuzimhalted this trend temporarily. During 1992-1998 the population of the kibbutzimdecreased by approximately 14,000 persons (-11%). During this period theJewish population of Israel increased by 15% (the total population - by 19%).
Population AgricultureThe net domestic product from kibbutz agriculture increased over the years,as with Israeli agriculture in general; however, its proportion of the total productdecreased, in view of the relatively greater increase in other product components(particularly the industrial product), and the decline in the relative price ofagricultural products.
The share of the kibbutzim in the gross value added of agriculture has decreasedsince the early eighties due to the decrease in field crops, primarily cotton.
Israel’s agricultural land, aside from that of the kibbutzim, is divided as follows:38% in moshavim and collective moshavim, 9% in private ownership and otherentities in the Jewish sector, and 15% in the Arab sector.
Following the decrease in the profitability of agriculture, the number of kibbutzmembers working in this branch decreased. This was accompanied by an increasein the number of employees.
54% of the value of the kibbutz agricultural output is from livestock, and 46%from crops.
Over the years, the field crops branch in the kibbutzim has decreased (primarilydue to the decrease in cottom growing), even though it has remained the largestbranch; the proportion of the vegetable, potatoes and melons branch hasincreased. The flowers branch has grown rapidly, even though it is still only asmall part of all crops.
AgriculturePopulationPeriod of Establishment
Persons employed in agriculture and industry* (thousands), 1978-1998
Food and beverages Metal, metal products and machinery Other
Jerusalem District 13%
Southern District 15%
Central District 6%Haifa District 6% 60% Northern District
Nights spent on kibbutzim, 1998
Industrial branches in kibbutzim 1996
34%26%
19%
21%
17%
14%
19%
50%
31%22%
9%
38%
IndustryAgriculture
16
2330
18 19
12
8191
Employed in kibbutzim
76 72
Living on kibbutzim
Number of years of study, 1998
Editor: Nurit Yaffe DESIGN PRODUCTION: ELTAN VISUAL COMMUNICATION
State of IsraelCentral Bureau of
Statistics
30% 42%
17%4% 7% kibbutzim
10-98-0
12-11
16+15-13 22%
37%
17% 13%
11%
Total Jewish population
Employed persons living onor employed in kibbutzim(thousands), 1988-1998
1988
1998
1978
1988
1998
Yad Tabenkin
Yohanan Simon, An evening on the kibbutz, 1947
KIBBUTZIM
15% of persons on kibbutzim have an academic degree (similar to the overallJewish population), and 20% have post-secondary school certificates (12% inthe total Jewish population).
Of the 72,000 employed persons living on kibbutzim in 1998, 11,000 wereemployed outside the kibbutzim. 91,000 persons were employed in thekibbutzim: 2/3 kibbutz residents and 1/3 Israelis who were not kibbutzresidents (not counting non-Israeli workers from the Judea, Samaria and Gazaareas and foreign workers).
Kibbutz industry includes 360 factories and eleven regional corporations,employing approximately 30,000 persons in 1996 (8.6% of all persons employedin industry in Israel). Income from kibbutz industry was NIS 13.7 billion (10.2%),the gross product was NIS 3.9 billion (8.3%), investments amounted to NIS0.9 billion, and the value of exports was NIS 3.6 billion (9.4%).
Kibbutz industry is concentrated in three groups of branches: plastics, rubberand chemicals; food and beverages; metal, metal products and machinery. Therespective concentration of these groups of branches in the overall industryin Israel is much lower.
Wages per employee in kibbutz industry are lower (NIS 76,400 per year) thanin Israeli industry in general (NIS 89,700).
In 1998, kibbutz members constituted 38% of all persons working in industryon kibbutzim.130 kibbutzim offer guest accomodations. In 1998 these included 5,500 roomsand 18,500 beds - 73% of which are in “zimmers” and 27% in guest houses.Of the nights spent in “zimmers” 17% were of foreign tourists, and in guesthouses - 42%.
The educational level of the kibbutz population is higher than that of theoverall Jewish population in Israel; over the last decade the gap has slightlyincreased. In 1988, persons who have studied 13+ years constituted 33% ofthe kibbutz population (aged 15+), as compared with 27% in the Jewishpopulation. In 1998 these figures were 47% and 39%, respectively.
The number of residents of development towns employed in kibbutzim hasincreased from 3,200 in 1989 to 9,300 in 1998.
In the late 1980s, industry became the largest branch of employment onkibbutzim, with agriculture second and education third.
Although the educational level on kibbutzim is higher than that of the overallJewish population, the proportion of persons working as academic and associateprofessionals (22%) is smaller than in the overall Jewish population (29%). In1988, they constituted 17%.
Employed Persons Income Exports
For additional information:
Central Bureau of StatisticsTel. 972-2-6592666 Fax. 972-2-6521340
Internet Site: www.cbs.gov.ilE-Mail: [email protected]
Yad TabenkinTel. 972-3-5346268 Fax. 972-3-5346376
Industry & Tourism
Plastics, rubber and chemicals
January 2000
* Incluing non-kibbutz residents
Education & Work(ages 15 and over)
STATISTICAL 6
Education & Work Industry & Tourism(ages 15 and over)