central blood pressure -...
TRANSCRIPT

865
Although noninvasive blood pressure (BP) measured in the brachial artery (cuff BP) represents the basis for the pres-
ent management of hypertension,1–3 it has long been recognized that waveform morphology4–6 and BP5,7–10 differ considerably between the central aorta and peripheral arterial system. These discernible differences vary among individuals because of vari-able timing and amplitude of arterial wave reflections.11 More importantly, central systolic and pulse pressure (CBP) may pre-dict cardiovascular outcomes more accurately than cuff BP.12,13
The clinical application of CBP has been made possible by the advances in computational science and biomedi-cal engineering. Noninvasive CBP is obtained using either tonometry-based5,14,15 or, more conveniently, cuff-based tech-niques.16–18 Recently, the capability of the N-point moving average (NPMA) method to estimate central aortic systolic BP (SBP-C) was demonstrated.19 Using a common denominator
related to the sampling frequency, the NPMA is a mathemati-cal low-pass filter that is frequently used in the engineer-ing field for removing random noise from a time series. The high-frequency components, resulting primarily from arterial wave reflections,20 cause substantial transformations from cen-tral to peripheral aortic pressure waveforms and can be elimi-nated by the application of the NPMA.19 Applied on radial artery pressure waveforms obtained using arterial tonometry, the NPMA method with a common denominator of 4 (one quarter of the acquisition sampling frequency) has been shown to define SBP-C accurately.19 However, tonometry-based meth-ods for estimating SBP-C are limited by the requirements of a sophisticated tonometric device and a certain level of operator skill. A cuff-based technique using the NPMA method would likely be more welcomed in clinical practice given the confir-mation of its accuracy in measurement. In other words, this
See Editorial Commentary, pp 665–667
Abstract—The N-point moving average (NPMA) is a mathematical low-pass filter that can smooth peaked noninvasively acquired radial pressure waveforms to estimate central aortic systolic pressure using a common denominator of N/4 (where N=the acquisition sampling frequency). The present study investigated whether the NPMA method can be applied to brachial pressure waveforms. In the derivation group, simultaneously recorded invasive high-fidelity brachial and central aortic pressure waveforms from 40 subjects were analyzed to identify the best common denominator. In the validation group, the NPMA method with the obtained common denominator was applied on noninvasive brachial pressure waveforms of 100 subjects. Validity was tested by comparing the noninvasive with the simultaneously recorded invasive central aortic systolic pressure. Noninvasive brachial pressure waveforms were calibrated to the cuff systolic and diastolic blood pressures. In the derivation study, an optimal denominator of N/6 was identified for NPMA to derive central aortic systolic pressure. The mean difference between the invasively/noninvasively estimated (N/6) and invasively measured central aortic systolic pressure was 0.1±3.5 and −0.6±7.6 mm Hg in the derivation and validation study, respectively. It satisfied the Association for the Advancement of Medical Instrumentation standard of 5±8 mm Hg. In conclusion, this method for estimating central aortic systolic pressure using either invasive or noninvasive brachial pressure waves requires a common denominator of N/6. By integrating the NPMA method into the ordinary oscillometric blood pressure determining process, convenient noninvasive central aortic systolic pressure values could be obtained with acceptable accuracy. (Hypertension. 2014;63:865-870.) • Online Data Supplement
Key Words: arterial pressure ◼ blood pressure monitoring ◼ mathematical computing
Received August 12, 2013; first decision September 5, 2013; revision accepted November 27, 2013.From the Molecular Imaging Center, National Taiwan University, Taipei, Taiwan (Y.-T.S.); Departments of Medical Education (H.-M.C., C.-H.C.) and
Medicine (S.-H.S.), Taipei Veterans General Hospital, Taipei, Taiwan; Cardiovascular Research Center (S.-H.S., H.-M.C., C.-H.C.) and Departments of Medicine (H.-M.C., S.-H.S., C.-H.C.) and Public Health (H.-M.C., S.-H.S., C.-H.C.), National Yang-Ming University, Taipei, Taiwan; and Department of Biomedical Engineering, Chung Yuan Christian University, Chung-Li, Taiwan (W.-C.H.).
*Y.-T.S. and H.-M.C. are the first coauthors.The online-only Data Supplement is available with this article at http://hyper.ahajournals.org/lookup/suppl/doi:10.1161/HYPERTENSIONAHA.
113.02229/-/DC1.Correspondence to Chen-Huan Chen, Department of Medical Research and Education, Taipei Veterans General Hospital, No. 201, Sec. 2, Shih-Pai Rd,
Taipei, Taiwan. E-mail [email protected]
Application of the N-Point Moving Average Method for Brachial Pressure Waveform–Derived Estimation
of Central Aortic Systolic PressureYuan-Ta Shih,* Hao-Min Cheng,* Shih-Hsien Sung, Wei-Chih Hu, Chen-Huan Chen
© 2014 American Heart Association, Inc.
Hypertension is available at http://hyper.ahajournals.org DOI: 10.1161/HYPERTENSIONAHA.113.02229
Central Blood Pressure
by guest on July 9, 2018http://hyper.ahajournals.org/
Dow
nloaded from
by guest on July 9, 2018http://hyper.ahajournals.org/
Dow
nloaded from
by guest on July 9, 2018http://hyper.ahajournals.org/
Dow
nloaded from
by guest on July 9, 2018http://hyper.ahajournals.org/
Dow
nloaded from
by guest on July 9, 2018http://hyper.ahajournals.org/
Dow
nloaded from
by guest on July 9, 2018http://hyper.ahajournals.org/
Dow
nloaded from
by guest on July 9, 2018http://hyper.ahajournals.org/
Dow
nloaded from
by guest on July 9, 2018http://hyper.ahajournals.org/
Dow
nloaded from
by guest on July 9, 2018http://hyper.ahajournals.org/
Dow
nloaded from
by guest on July 9, 2018http://hyper.ahajournals.org/
Dow
nloaded from
by guest on July 9, 2018http://hyper.ahajournals.org/
Dow
nloaded from
by guest on July 9, 2018http://hyper.ahajournals.org/
Dow
nloaded from
by guest on July 9, 2018http://hyper.ahajournals.org/
Dow
nloaded from

866 Hypertension April 2014
simple method can be seamlessly equipped into current oscil-lometric BP monitors and provide convenient SBP-C estimates for the management of hypertension. However, for brachial artery pressure (BAP) waveforms obtained either invasively or noninvasively with oscillometric BP monitors, the perfor-mance of the NPMA method for SBP-C estimation has yet to be evaluated. Therefore, the present study aimed to develop and validate the application of the NPMA method to noninvasively derive SBP-C values from the noninvasive BAP waveforms.
MethodsStudy PopulationAll study protocols were approved by the Institutional Review Board of Taipei Veterans General Hospital and adhered to the principles of the Declaration of Helsinki.
Two independent groups were studied, the derivation group (n=40) and the validation group (n=100). The characteristics of the subjects in both groups have been presented in our previous studies (Table S1 in the online-only Data Supplement).21
Data AcquisitionThe study procedures have been described elsewhere.21 Briefly, in the derivation group, simultaneous invasive central aortic and BAP waveforms were obtained for 20 to 30 consecutive beats to cover ≥2 respiratory cycles.
To illustrate the contributions of different frequency components (hertz) to the construction of the BAP and aortic pressure waveforms, the discrete Fourier transformations of the individual invasive brachi-al and aortic waveforms were evaluated to yield the average moduli and phase angles ≤9 Hz.
Although we derived the denominator from the derivation group by investigating the relationship between invasive BAP and central aortic pressure waveforms, only noninvasive BAP waveforms could be obtained in the routine clinical practice. Therefore, we chose to examine the accuracy of the NPMA method for the noninvasive BAP waveforms and compared the estimates with the invasively measured SBP-C. In the validation group, invasive aortic pressure waveforms were recorded simultaneously with noninvasive BAP waveforms for 20 to 30 consecutive beats. The noninvasive BAP waveform was ob-tained at a cuff pressure of 60 mm Hg in the left arm using a com-mercially available oscillometric cuff-based device (VP-2000, Colin Corporation, Komaki, Japan).17
Study ProtocolIn the derivation group, by applying the NPMA method to the invasive brachial BP waveforms, we attempted to identify the optimal denomi-nator from N=2 to 10 for defining the SBP-C. The accuracy of these different denominators to obtain NPMA method–derived waveforms
and corresponding maximal values, the predicted SBP-C, was investi-gated. In the derivation group, we determined the optimal denominator from which the most accurate estimates could be rendered.
In the validation group with another 100 independent subjects, the accu-racy of the NPMA method with the optimal denominator was examined.
Statistical AnalysesData were presented as the mean±SD to assess differences between NPMA method–derived and measured SBP-C values. Furthermore, paired samples t tests and the Bland–Altman analysis were used to examine the agreement between measurements. Statistical signifi-cance was set at the 2-tailed P<0.05 level.
ResultsBased on the time domain (Figure 1A) and frequency domain (Figure 1B) analyses for the ensemble average pressure wave-forms, noticeable differences between the aortic and BAP waveforms were illustrated. As demonstrated in Figure 1B, frequency components >3 Hz contributed trivially to defining the SBP-C. In comparison, more high-frequency components were required to define the brachial SBP.
When applied on the BAP waveforms, the NPMA with the common denominator related to the sampling frequency could differ from that proposed by Williams et al19 for radial pressure waveforms. Applying NPMA with a denominator of N/4, as previously proposed, to the invasively obtained BAP waveforms in the derivation group, we observed a difference between the NPMA method–derived and invasively measured SBP-C values of −4.6±4.1 mm Hg. Therefore, the optimal denominator from N/2 to N/10 in the derivation group should be re-evaluated. As shown in Figure 2, acting as a low-pass filter, the NPMA exerted stronger filtering effects on BAP waveforms with a smaller denominator. With the denominators of N/6 and N/4, frequency components >4 Hz and >3 Hz, respectively, were eliminated.
Based on the results presented in Figure 3, we identified N/6 to be the optimal denominator for BAP waveforms, which provided the most accurate SBP-C estimates characterized by minimal systematic and random error (mean difference, 0.1±3.5 mm Hg) as compared with other denominators. In addition, the results of the Bland–Altman analysis shown in Figure 4 confirmed that no significant proportional systematic bias was noted for the denominator N/6.
Subsequently, the NPMA with the denominator N/6 was applied to noninvasive BAP waveforms in the validation
Figure 1. Comparisons of ensemble average pressure waveforms in the time domain (A) and frequency domain (B) between invasively measured central aortic and brachial pressure waveforms in the derivation group. SBP-B indicates brachial systolic blood pressure; and SBP-C, central aortic systolic blood pressure.
by guest on July 9, 2018http://hyper.ahajournals.org/
Dow
nloaded from

Shih et al NPMA Method for Estimating SBP-C 867
group for estimating SBP-C. As shown in the Table and Figure 5, compared with the invasively measured SBP-C, the denominator N/6 provided SBP-C estimates with a mean dif-ference of −0.6±7.6 mm Hg and without significant propor-tional systematic bias. In comparison with other denominators
(Table), the SBP-C estimated with N/6 had minimal system-atic and random error. When applying the NPMA N/6 method to derive noninvasive SBP-C, the 95% limits of agreement (mean difference±1.96×SD of differences) against the inva-sively measured SBP-C ranged from −15.6 to 14.2 mm Hg. In a supplementary analysis (Table S3), we also provided the absolute band errors between the various noninvasive BPs and the invasively measured SBP-C. The accuracy of SBP-C esti-mated with the NPMA N/6 clearly surpassed that of cuff SBP.
DiscussionThe NPMA method is a new and simple addition to the exist-ing armamentarium for estimating SBP-C values. After its introduction in 2011 by Williams et al,19 the present study further investigated the validity of this application on BAP waveforms and extended the use to the noninvasively obtained BAP waveforms, which could be acquired during routine BP measurement using an automatic sphygmomanometer.
Williams et al19 demonstrated that the optimal denomina-tor of NPMA method to derive SBP-C noninvasively using
Figure 2. Effects of the application of the N-point moving average method on brachial pressure waveforms to define central aortic systolic blood pressure (SBP-C) by exploiting different denominators with reference to invasively measured SBP-C (dotted line).
Figure 3. Effects of different denominators on the mean difference (A) and SD of the differences (B) between noninvasive N-point moving average–derived central aortic systolic blood pressure (SBP-C) vs invasively measured SBP-C in the derivation group (n=40).
Figure 4. Bland–Altman analysis. Central aortic systolic blood pressure (SBP-C) estimated by N-point moving average method with N/6 (N6 SBP-C) using invasively obtained brachial pressure waves vs invasively measured SBP-C in the derivation group (n=40). CI indicates confidence interval.
by guest on July 9, 2018http://hyper.ahajournals.org/
Dow
nloaded from

868 Hypertension April 2014
radial pressure waveform was N/4. As shown in Figure 2, the low-pass filtering effect of the NPMA increases with decreases in the denominator. The present study demonstrated that the NPMA filter mainly acts to remove the high-fre-quency components of the BAP waveforms resulting from the impact of wave reflections in the upper limbs. There has been an argument about the importance of amplification of pres-sure waveform in the forearm between the brachial and radial arteries.22 If the brachial-to-radial amplification is negligible, the denominator N/4 of NPMA method for the radial pressure waveforms may also work for the BAP waveforms. However, direct application of the denominator N/4 to the invasively measured BAP waveforms to derive SBP-C values produced a large systematic bias in the present study. On the contrary, in 10 subjects who had received sequential invasive mea-surements of BAP and radial pressure waveforms using the high-fidelity Millar catheters (online-only Data Supplement and Table S2), we found that radial SBP was significantly higher than brachial SBP by 4.4±3.8 mm Hg (P=0.005; Figure
S1A). The averaged foot-to-foot interval between the BAP and radial pressure waveforms was 26.8±18.2 ms (P=0.005). Moreover, the difference between the radial and brachial SBPs was likely attributable to the higher energy content in the high-frequency harmonics of the radial pressure wave-forms (Figure S1B). Thus, local wave reflections in the upper limb exert greater impact on the radial than the BAP wave-forms, so the radial pressure waveform is characterized by a sharper rise during systole and a higher peak (SBP) and larger pulse wave amplitude (pulse pressure).6,22 Therefore, to derive noninvasive SBP-C values by filtering out the influences of local reflection waves, the NPMA with a lesser low-pass filter-ing effect should be implemented for BAP waveforms in com-parison with that for radial pressure waveforms. In the first part of this study, we then determined that N/6 represents the optimal denominator for estimating SBP-C using the invasive BAP waveforms.
Subsequently, we investigated the accuracy of the applica-tion of the NPMA with this new denominator on the nonin-vasive BAP waveform in the independent validation group. Although the noninvasive BAP waveform is only a surrogate BAP waveform, its usefulness has been confirmed in numer-ous studies.16–18,23 Currently, all international standards, includ-ing European Society of Hypertension International Protocol,24 Association for the Advancement of Medical Instrumentation,25 and British Hypertension Society,26 require that the measure-ment error (mean differences against standards) of tested auto-matic BP monitors should surpass the minimal requirement of <5±8 mm Hg in validation studies for all BP parameters. The former number refers to systematic bias, which is the group average result for the validity evaluation, and the latter refers to random error, which suggests the scatter of the error. With the random error <8 mm Hg, the BP monitors could be regarded as a reliable tool for BP assessment. Exemplified by the stan-dards of automatic BP monitors, we demonstrated (Table and Figure 5) that the NPMA method could derive noninvasive SBP-C values within the required standards using the BAP waveforms (mean difference, −0.6±7.6 mm Hg).
The clinical usefulness of the noninvasive SBP-C in indi-vidual cases could be appreciated by the analysis of absolute band errors with reference to the invasive SBP-C (Table S3). The NPMA N/6–derived noninvasive SBP-C surpassed the cuff SBP with higher percentages of absolute error within the criteria of ≤5, 10, and 15 mm Hg. The filter of NPMA N/6 was also better than the NPMA N/4 filter because the latter yielded lower percentages of absolute error within the criteria of ≤10 and ≤15 mm Hg (Table S3).
In the validation group, the random error (SD of the differ-ences) of the NPMA method–derived SBP-C increased from 3.5 (in the derivation group) to 7.6 mm Hg. Similar to other noninvasive methods, the major source of errors arises from the decreased accuracy of sphygmomanometer-measured bra-chial BP.27 The improvement in the measurement accuracy of brachial BP by automatic BP monitors would be beneficial for risk assessment not only in current management of hyperten-sion, but also in the clinical application of central BP concepts in the near future.
In a previous study that tested the validity of 2 noninva-sive SBP-C measurement devices,28 large systematic bias and
Figure 5. Bland–Altman analysis. N-point moving average method–derived central aortic systolic blood pressure (SBP-C) with N/6 (N6 SBP-C) using noninvasive brachial pressure waves vs invasively measured SBP-C in the validation group (n=100). CI indicates confidence interval.
Table. Comparison of NPMA Method–Derived SBP-C With Different Denominators Between Noninvasive Brachial Pressure Waves and Invasively Measured SBP-C in the Validation Group
Parameters, mm Hg
Validation Group (n=100)
Mean Mean Difference±SD (R Value)
SBP-C 133.2±20.8 …
N=2 119.7±17.0 −13.5±8.8* (0.91*)
N=3 125.8±18.3 −7.4±7.9* (0.93*)
N=4 129.4±19.0 −3.8±7.7* (0.93*)
N=5 131.5±19.2 −1.7±7.6† (0.93*)
N=6 132.6±19.3 −0.6±7.6 (0.93*)
N=7 133.3±19.4 0.1±7.7 (0.93*)
N=8 133.7±19.4 0.6±7.8 (0.93*)
N=9 134.1±19.4 0.9±7.9 (0.93*)
N=10 134.4±19.4 1.2±7.9 (0.92*)
N indicates denominator; NPMA, N-point moving average; R, correlation coefficient between parameter systolic blood pressure (SBP) and aortic SBP; and SBP-C, central aortic SBP.
*P<0.01.†P<0.05.
by guest on July 9, 2018http://hyper.ahajournals.org/
Dow
nloaded from

Shih et al NPMA Method for Estimating SBP-C 869
random error proportional to the magnitudes of measured SBP-C values were noted with the NPMA method (mean dif-ference, 0.9±13 mm Hg), which was not evident in our study (Figure 5). The major source of error of such disappointing results may primarily arise from inaccurate cuff BP values used for calibration, as discussed in our previous study.27 Further studies should be performed to investigate and quan-tify the effects of calibration errors on different methods for estimating SBP-C and central aortic pulse pressure.
The effect of measurement error on the dilution of the prog-nostic value has been clearly delineated.29 Therefore, there is always a need for more accurate BP measurement devices. The prognostic value of conventional office BP readings has been outweighed by home BP and ambulatory BP measurement devices,3 mainly because of the regression toward the mean phenomenon,30 which likely could reduce the random error if a consistent relation exists, and also by avoiding the white-coat effect. Our study supports that brachial BP should be regarded as a surrogate for CBP blended with high-frequency noise result-ing from local wave reflections. Thus, CBP is naturally a more accurate BP value and a better predictor of future cardiovascu-lar events. Therefore, the development of a more user-friendly device with more accurate BP estimates, such as a cuff-based NPMA method–derived SBP-C BP monitor, is justified.
LimitationsThere were some limitations in this study. We evaluated the per-formance of the NPMA in subjects who were referred for diag-nostic catheterization. As with all invasive validation studies, whether our study population represents the general population remains questionable. Therefore, the accuracy of the NPMA in subjects with different characteristics should be investigated fur-ther. However, as shown in the previous report by William et al,19 the accuracy seemed robust when applying the NPMA method in the large ASCOT-CAFÉ cohort.31 We used the high-fidelity invasive brachial BP waveforms instead of the low-fidelity non-invasive BAP waveforms to identify the optimal NPMA common denominator in the derivation group. This may explain why it appears from the Table that N/7 may be preferable for noninvasive use than N/6. On the contrary, the use of high-fidelity brachial BP waveforms allowed for the detailed time domain and frequency domain analyses for the understanding and application of the NPMA method. Last, the NPMA method provides only SBP-C estimates. No other waveform characteristics can be obtained from the NPMA method–filtered brachial BP waveforms.
In conclusion, our study demonstrated that the NPMA method could be applied to derive SBP-C estimates using invasive and noninvasive brachial pulse waveforms, which was achieved principally by eliminating the aortic-to-BAP ampli-fication phenomenon. After comparison of the denominator used for radial pressure waveforms (N/4), we further deter-mined and validated that the optimal denominator for BAP waveforms was N/6. By integrating the NPMA method into ordinary oscillometric BP measurement, convenient noninva-sive SBP-C values could be obtained with acceptable accuracy.
PerspectivesCentral BP has been shown to provide better prognostic value than conventionally measured brachial cuff BP.12,13 The NPMA
method, a simple mathematical low-pass filter, can be added to the existing armamentarium for estimating SBP-C using tonometry-derived radial pressure waveforms.19 The present study further confirmed the validity of this application on BAP waveforms and extended the use to the noninvasively obtained BAP waveforms, which could be acquired during routine BP measurement using an automatic sphygmomanometer. The convenient CBP values obtained with automatic BP monitors, if its superior prognostic value could be further confirmed pro-spectively, will make the CBP concept successfully translated from research into clinical practice.
Sources of FundingThis study was supported by the National Science Council (NSC 96–2314-B-010-035-MY3), Ministry of Education, Aim for the Top University Plan (96A-D-D131), and a research grant from an Industry-Academia Cooperation between Microlife Co., Ltd., and National Yang-Ming University.
DisclosuresNone.
References 1. Chobanian AV, Bakris GL, Black HR, Cushman WC, Green LA, Izzo JL Jr,
Jones DW, Materson BJ, Oparil S, Wright JT Jr, Roccella EJ; Joint National Committee on Prevention, Detection, Evaluation, and Treatment of High Blood Pressure. National Heart, Lung, and Blood Institute; National High Blood Pressure Education Program Coordinating Committee. Seventh report of the Joint National Committee on Prevention, Detection, Evaluation, and Treatment of High Blood Pressure. Hypertension. 2003;42:1206–1252.
2. Mancia G, Fagard R, Narkiewicz K, et al. 2013 ESH/ESC guidelines for the management of arterial hypertension: the task force for the manage-ment of arterial hypertension of the European Society of Hypertension (ESH) and of the European Society of Cardiology (ESC). Eur Heart J. 2013;34:2159–2219.
3. Krause T, Lovibond K, Caulfield M, McCormack T, Williams B; Guideline Development Group. Management of hypertension: summary of NICE guidance. BMJ. 2011;343:d4891.
4. Kroeker EJ, Wood EH. Comparison of simultaneously recorded central and peripheral arterial pressure pulses during rest, exercise and tilted posi-tion in man. Circ Res. 1955;3:623–632.
5. Takazawa K, Tanaka N, Takeda K, Kurosu F, Ibukiyama C. Underestimation of vasodilator effects of nitroglycerin by upper limb blood pressure. Hypertension. 1995;26:520–523.
6. Nichols WW, O’Rourke MF, Vlachopoulos C. Mcdonald’s Blood Flow in Arteries: Theoretic, Experimental and Clinical Principles. London, United Kingdom: Arnold; 2011.
7. Segers P, Mahieu D, Kips J, Rietzschel E, De Buyzere M, De Bacquer D, Bekaert S, De Backer G, Gillebert T, Verdonck P, Van Bortel L; Asklepios investigators. Amplification of the pressure pulse in the upper limb in healthy, middle-aged men and women. Hypertension. 2009;54:414–420.
8. Kelly RP, Gibbs HH, O’Rourke MF, Daley JE, Mang K, Morgan JJ, Avolio AP. Nitroglycerin has more favourable effects on left ventricular afterload than apparent from measurement of pressure in a peripheral artery. Eur Heart J. 1990;11:138–144.
9. Avolio AP, Van Bortel LM, Boutouyrie P, Cockcroft JR, McEniery CM, Protogerou AD, Roman MJ, Safar ME, Segers P, Smulyan H. Role of pulse pressure amplification in arterial hypertension: experts’ opinion and review of the data. Hypertension. 2009;54:375–383.
10. Benetos A, Thomas F, Joly L, Blacher J, Pannier B, Labat C, Salvi P, Smulyan H, Safar ME. Pulse pressure amplification a mechanical bio-marker of cardiovascular risk. J Am Coll Cardiol. 2010;55:1032–1037.
11. Agabiti-Rosei E, Mancia G, O’Rourke MF, Roman MJ, Safar ME, Smulyan H, Wang JG, Wilkinson IB, Williams B, Vlachopoulos C. Central blood pressure measurements and antihypertensive therapy: a consensus document. Hypertension. 2007;50:154–160.
12. Wang KL, Cheng HM, Chuang SY, Spurgeon HA, Ting CT, Lakatta EG, Yin FC, Chou P, Chen CH. Central or peripheral systolic or pulse pres-sure: which best relates to target organs and future mortality? J Hypertens. 2009;27:461–467.
by guest on July 9, 2018http://hyper.ahajournals.org/
Dow
nloaded from

870 Hypertension April 2014
13. Jankowski P, Kawecka-Jaszcz K, Czarnecka D, Brzozowska-Kiszka M, Styczkiewicz K, Loster M, Kloch-Badełek M, Wiliński J, Curyło AM, Dudek D; Aortic Blood Pressure and Survival Study Group. Pulsatile but not steady component of blood pressure predicts cardiovascular events in coronary patients. Hypertension. 2008;51:848–855.
14. Benetos A, Tsoucaris-Kupfer D, Favereau X, Corcos T, Safar M. Carotid artery tonometry: an accurate non-invasive method for central aortic pulse pressure evaluation. J Hypertens Suppl. 1991;9:S144–S145.
15. Karamanoglu M, O’Rourke MF, Avolio AP, Kelly RP. An analysis of the relationship between central aortic and peripheral upper limb pressure waves in man. Eur Heart J. 1993;14:160–167.
16. Millasseau SC, Guigui FG, Kelly RP, Prasad K, Cockcroft JR, Ritter JM, Chowienczyk PJ. Noninvasive assessment of the digital volume pulse. Comparison with the peripheral pressure pulse. Hypertension. 2000;36:952–956.
17. Cheng HM, Wang KL, Chen YH, Lin SJ, Chen LC, Sung SH, Ding PY, Yu WC, Chen JW, Chen CH. Estimation of central systolic blood pres-sure using an oscillometric blood pressure monitor. Hypertens Res. 2010;33:592–599.
18. Weber T, Wassertheurer S, Rammer M, Maurer E, Hametner B, Mayer CC, Kropf J, Eber B. Validation of a brachial cuff-based method for esti-mating central systolic blood pressure. Hypertension. 2011;58:825–832.
19. Williams B, Lacy PS, Yan P, Hwee CN, Liang C, Ting CM. Development and validation of a novel method to derive central aortic systolic pres-sure from the radial pressure waveform using an n-point moving average method. J Am Coll Cardiol. 2011;57:951–961.
20. Chen CH, Nevo E, Fetics B, Pak PH, Yin FC, Maughan WL, Kass DA. Estimation of central aortic pressure waveform by mathematical trans-formation of radial tonometry pressure. Validation of generalized transfer function. Circulation. 1997;95:1827–1836.
21. Shih YT, Cheng HM, Sung SH, Hu WC, Chen CH. Comparison of two generalized transfer functions for measuring central systolic blood pres-sure by an oscillometric blood pressure monitor. J Hum Hypertens. 2013;27:204–210.
22. Adji A, O’Rourke MF. Brachial artery tonometry and the Popeye phe-nomenon: explanation of anomalies in generating central from upper limb pressure waveforms. J Hypertens. 2012;30:1540–1551.
23. Brett SE, Guilcher A, Clapp B, Chowienczyk P. Estimating central sys-tolic blood pressure during oscillometric determination of blood pressure: proof of concept and validation by comparison with intra-aortic pressure recording and arterial tonometry. Blood Press Monit. 2012;17:132–136.
24. O’Brien E, Atkins N, Stergiou G, Karpettas N, Parati G, Asmar R, Imai Y, Wang J, Mengden T, Shennan A; Working Group on Blood Pressure Monitoring of the European Society of Hypertension. European Society of Hypertension International Protocol revision 2010 for the valida-tion of blood pressure measuring devices in adults. Blood Press Monit. 2010;15:23–38.
25. Association for the Advancement of Medical Instrumentation. American National Standard. Electronic or Automated Sphygmomanometers. Arlington, VA: Association for the Advancement of Medical Instrumentation; 2009.
26. O’Brien E, Petrie J, Littler W, de Swiet M, Padfield PL, Altman DG, Bland M, Coats A, Atkins N. An outline of the revised British Hypertension Society protocol for the evaluation of blood pressure measuring devices. J Hypertens. 1993;11:677–679.
27. Shih YT, Cheng HM, Sung SH, Hu WC, Chen CH. Quantification of the calibration error in the transfer function-derived central aortic blood pres-sures. Am J Hypertens. 2011;24:1312–1317.
28. Ott C, Haetinger S, Schneider MP, Pauschinger M, Schmieder RE. Comparison of two noninvasive devices for measurement of central sys-tolic blood pressure with invasive measurement during cardiac catheter-ization. J Clin Hypertens (Greenwich). 2012;14:575–579.
29. Smith GD, Phillips AN. Inflation in epidemiology: “the proof and measurement of association between two things” revisited. BMJ. 1996;312:1659–1661.
30. Stigler SM. Regression towards the mean, historically considered. Stat Methods Med Res. 1997;6:103–114.
31. Williams B, Lacy PS, Thom SM, Cruickshank K, Stanton A, Collier D, Hughes AD, Thurston H, O’Rourke M; CAFE Investigators; Anglo-Scandinavian Cardiac Outcomes Trial Investigators; CAFE Steering Committee and Writing Committee. Differential impact of blood pressure-lowering drugs on central aortic pressure and clinical outcomes: principal results of the Conduit Artery Function Evaluation (CAFE) study. Circulation. 2006;113:1213–1225.
What Is New?•Central blood pressure (BP) has been shown to provide better prognostic
value than conventionally measured brachial cuff BP.•The N-point moving average method is a new and simple addition to the
existing armamentarium for estimating central aortic systolic BP using tonometry-derived radial pressure waveforms.
•The present study further investigated the validity of this application on brachial pressure waveforms and extended its use to the noninvasive brachial pressure waveforms, which could be acquired during routine BP measurement using an automatic sphygmomanometer.
What Is Relevant?•The present study demonstrated that by integrating the N-point moving
average method into ordinary oscillometric BP measurement, convenient
noninvasive central aortic systolic BP values could be obtained with ac-ceptable accuracy.
SummaryThe N-point moving average method was able to obtain a central aortic systolic pressure from the noninvasively recorded brachial pressure waveforms, which was obtained from ordinary oscillo-metric BP monitors.
Novelty and Significance
by guest on July 9, 2018http://hyper.ahajournals.org/
Dow
nloaded from

Yuan-Ta Shih, Hao-Min Cheng, Shih-Hsien Sung, Wei-Chih Hu and Chen-Huan ChenDerived Estimation of Central Aortic Systolic Pressure
−Application of the N-Point Moving Average Method for Brachial Pressure Waveform
Print ISSN: 0194-911X. Online ISSN: 1524-4563 Copyright © 2014 American Heart Association, Inc. All rights reserved.
is published by the American Heart Association, 7272 Greenville Avenue, Dallas, TX 75231Hypertension doi: 10.1161/HYPERTENSIONAHA.113.022292014;63:865-870; originally published online January 13, 2014;Hypertension.
http://hyper.ahajournals.org/content/63/4/865World Wide Web at:
The online version of this article, along with updated information and services, is located on the
http://hyper.ahajournals.org/content/suppl/2014/01/13/HYPERTENSIONAHA.113.02229.DC1Data Supplement (unedited) at:
http://hyper.ahajournals.org//subscriptions/
is online at: Hypertension Information about subscribing to Subscriptions:
http://www.lww.com/reprints Information about reprints can be found online at: Reprints:
document. Permissions and Rights Question and Answer this process is available in the
click Request Permissions in the middle column of the Web page under Services. Further information aboutOffice. Once the online version of the published article for which permission is being requested is located,
can be obtained via RightsLink, a service of the Copyright Clearance Center, not the EditorialHypertensionin Requests for permissions to reproduce figures, tables, or portions of articles originally publishedPermissions:
by guest on July 9, 2018http://hyper.ahajournals.org/
Dow
nloaded from

1
Application of the N-Point Moving Average Method for Brachial Pressure Waveform-derived Estimation of Central Aortic Systolic Pressure
Yuan-Ta Shiha, Hao-Min Chengb,d,e,f*, Shih-Hsien Sungc,d, Wei-Chih Hug,
Chen-Huan Chenb,d,e,f
Online Supplement
aMolecular Imaging Center, National Taiwan University, Taipei, Taiwan bDepartment of Medical Education and cDepartment of Medicine, Taipei Veterans
General Hospital, Taipei, Taiwan dCardiovascular Research Center, Departments of eMedicine and fPublic Health,
National Yang-Ming University, Taipei, Taiwan gDepartment of Biomedical Engineering, Chung Yuan Christian University, Chung-Li,
Taiwan * Yuan-Ta Shih and Hao-Min Cheng are the first coauthors

2
Online Supplement
Study population
All study protocols were approved by the Institutional Review Board of Taipei Veterans General Hospital and adhered to the principles of the Declaration of Helsinki.
Two independent groups were studied, the Derivation group (n = 40) and the Validation group (n = 100). The characteristics of the subjects in both groups have been presented in our previous studies.1 After providing informed consent, subjects who were referred for diagnostic cardiac catheterization were included in this study if they did not have acute coronary syndrome, peripheral arterial disease, rhythms other than normal sinus rhythm, or more than 3 mmHg pressure differences between the left and right arms. Subjects characteristics are presented in Table S1. Data acquisition The study procedures have been described elsewhere.1 Briefly, in the Derivation group, simultaneous invasive central aortic and brachial pressure waveforms were obtained for 20−30 consecutive beats to cover at least 2 respiratory cycles. A 2F custom-made dual pressure sensor catheter (Model SSD-1059, Millar Instruments Inc. Houston, TX, USA) was advanced within a standard 6F Judkins coronary artery catheter using a transradial approach. Under fluoroscopy, the first pressure sensor was positioned at the ascending aorta, close to the aortic valves, and the second pressure sensor was placed in the brachial artery at the level of the mid-humerus. Then the 6F Judkins catheter was carefully withdrawn to the level distal to the second sensor.
To illustrate the contributions of different frequency components (Hz) to the construction of the brachial and aortic pressure waveforms, the discrete Fourier transformations of the individual invasive brachial and aortic waveforms were evaluated to yield the average moduli and phase angles up to 9 Hz. While we derived the denominator from the Derivation group by investigating the relationship between invasive brachial and central aortic pressure waveforms, only noninvasive BAP waveforms could be obtained in the routine clinical practice. Therefore, we chose to examine the accuracy of the NPMA method for the noninvasive BAP waveforms and compared the estimates to the invasively measured SBP-C. In the Validation group, a 2F micromanometer-tipped catheter (Model SPC-320, Millar Instruments Inc.) was advanced into the ascending aorta until it was placed at the level of the aortic valves. Then, invasive aortic pressure waveforms were
3
recorded simultaneously with noninvasive BAP waveforms for 20−30 consecutive beats. The noninvasive BAP waveform was obtained at a cuff pressure of 60 mmHg in the left arm using a commercially available oscillometric cuff-based device (VP-2000, Colin Corporation, Komaki, Japan),2 which was designed to measure noninvasive blood pressures simultaneously over arms and ankles and estimate the brachial-ankle pulse wave velocity using the acquired BAP waveforms from the arms and ankles.3 The acquired BAP waveforms were calibrated to match the noninvasive brachial systolic /diastolic BP values measured with the same device with cuff size of 11-20 cm, 13-24.5 cm or 15.5-34 cm, corresponding to arm circumference of 17 to 23 cm, 20 to 32 cm and 30 to 38 cm, respectively. The noninvasive brachial systolic and diastolic BP values were the average of two consecutive readings immediately before the acquisition of the BAP waveforms.
The high fidelity Millar catheter had a flat frequency response from 0 to 1000 Hz. The frequency range of the oscillometric device to acquire the noninvasive BAP waveform was 0.13 to 30 Hz. We used the NI DAQ-6062 and LABVIEW 8.2 (National Instruments, Austin, TX, USA) for acquiring all invasive and noninvasive pressure waveform signals simultaneously with sampling frequencies of 500 Hz for the Derivation group, and 250 or 500 Hz for the Validation group, respectively. Study protocol
In the Derivation group, by applying the NPMA method to the invasive brachial blood pressure waveforms, we attempted to identify the optimal denominator from N = 2 to 10 for defining the SBP-C. The accuracy of these different denominators to obtain NPMA-derived waveforms and corresponding maximal values, the predicted SBP-C, was investigated. In the Derivation group, we determined the optimal denominator from which the most accurate estimates could be rendered. In the Validation group with another 100 independent subjects, the accuracy of the NPMA method with the optimal denominator was examined.
Commercial software (Matlab, version 7.0, The MathWorks Inc., Natick, MA, USA) was used to analyze the digitized signals. To avoid interobserver and intraobserver variation, batch analysis was used for all individual signals.

4
To investigate the difference between radial and pressure waveforms, radial pressure waveforms were invasively measured in 10 subjects with the high fidelity Millar Catheter (Model SSD-1059, Millar Instruments Inc. Houston, TX, USA) immediately after the recordings of brachial pressure waveforms. The recording sites for the radial pressure waveform were positioned carefully under fluoroscopy. The process of the signal acquisition and analysis has been detailed in the Method Section. Baseline characteristics of these 10 subjects are presented in Table S2.
Figure S1 presents the comparison of the ensemble average pressure waveforms of these 10 subjects, showing noticeable differences between the brachial and radial pressure waveforms in terms of their waveform shapes, systolic blood pressure (BP), and pulse pressure values. With similar mean BP and diastolic BP, there was a mean difference of 4.4 ± 3.8 mmHg (p=0.005) between radial and brachial systolic BPs (Panel A). The radial pressure waveform was more spiked during the systolic period. In addition, the averaged foot-to-foot interval between the radial and brachial pressure waveforms was 26.8 ± 18.2 msec (p=0.005), which was calculated with reference to the r waves on the electrocardiogram. In the frequency domain analysis (Panel B), a larger number of the harmonic components were required to define the radial systolic BP than the brachial systolic BP.
The above findings support that the more distal radial pressure wave faces earlier return of the local reflected waves than the more proximal brachial pressure wave, with resultant a more spiked upstroke and a higher value of systolic BP in the radial pressure waveform. As shown in Figure 1B, brachial systolic BP is mainly defined by the high frequency components of the pressure wave. Similarly, radial systolic BP is also mainly defined the high frequency components and the difference between the radial and brachial systolic BPs is likely due to the slightly higher energy in the high frequency components of the radial pressure waveform (Figure S1B). It is apparent that the local wave reflection in the upper limbs primarily contributes to the high frequency components of the radial and brachial pressure waveforms. Therefore, to derive central aortic systolic BP, it is reasonable that a stronger low pass filter is required for the radial pressure waveforms, which are subjected to more pronounced modifications by the local wave reflection on the high-frequency components than the brachial pressure waveforms.
5
References 1. Shih YT, Cheng HM, Sung SH, Hu WC, Chen CH. Comparison of two
generalized transfer functions for measuring central systolic blood pressure by an oscillometric blood pressure monitor. J. Hum. Hypertens. 2013;27:204-210.
2. Cheng HM, Wang KL, Chen YH, Lin SJ, Chen LC, Sung SH, Ding PY, Yu WC, Chen JW, Chen CH. Estimation of central systolic blood pressure using an oscillometric blood pressure monitor. Hypertens Res. 2010;33:592-599.
3. Yamashina A, Tomiyama H, Takeda K, Tsuda H, Arai T, Hirose K, Koji Y, Hori S, Yamamoto Y. Validity, reproducibility, and clinical significance of noninvasive brachial-ankle pulse wave velocity measurement. Hypertens Res. 2002;25:359-364.
4. Association for the Advancement of Medical Instrumentation. American national standard. Electronic or automated sphygmomanometers. Arlington, VA: AAMI; 2009.

6
Table S1. Subject characteristics
Characteristics Values (n = 140)
Men, % 76.4 Age, years 62.1 ± 11.1 Height, cm 163.4 ± 6.4 Weight, kg 70.7 ± 9.7 Waist circumference, cm 90.6 ± 7.7 Body mass index, kg/m2 26.4 ± 2.7 Left ventricular ejection fraction, % 55.4 ± 6.7 Smoking, % 25.7 Clinical diagnosis, % Hypertension 60.7 Type 2 diabetes mellitus 17.9 Dyslipidemia 35.0 Coronary artery disease 52.1 Chronic renal failure 2.9 Medications, % α-blockers 11.4 β-blockers 37.9 Calcium channel blockers 30 Angiotensin-converting enzyme inhibitors 14.3 Angiotensin receptor blockers 24.3 Diuretics 14.3 Antiplatelet agents 70.0 Statins 35.7 Blood Pressure Parameters, mmHg
Derivation group (n=40) Aortic systolic blood pressure 134.5 ± 20.9 Aortic mean blood pressure 97.5 ± 11.5 Aortic diastolic blood pressure 71.5 ± 9.4 Brachial systolic blood pressure 139.3 ± 19.8 Brachial mean blood pressure 97.7 ± 11.5 Brachial diastolic blood pressure 70.9 ± 9.5 Heart Rates (Baseline), beats/min 64.7 ± 9.5
Validation group (n=100) Aortic systolic blood pressure 133.2 ± 20.8

7
Aortic mean blood pressure 97.5 ± 12.9 Aortic diastolic blood pressure 70.9 ± 10.6 Noninvasive brachial systolic pressure 135.7 ± 19.6 Noninvasive brachial mean pressure 102.9 ± 15.6 Noninvasive brachial diastolic pressure 77.6 ± 11.8 Heart Rates (Baseline), beats/min 67.5 ± 12.0

8
Table S2. Subject characteristics
Characteristics Values (n = 10)
Men, % 70.0 Age, years 67.0 ± 11.8 Height, cm 160.6 ± 6.1 Weight, kg 64.5 ± 14.1 Waist circumference, cm 91.3 ± 21.6 Body mass index, kg/m2 25.4 ± 7.4 Left ventricular ejection fraction, % 52.3 ± 14.4 Smoking, % 10.0 Clinical diagnosis, % Hypertension 80.0 Type 2 diabetes mellitus 50.0 Dyslipidemia 70.0 Coronary artery disease 20.0 Chronic renal failure 10.0 Medications, % α-blockers 20.0 β-blockers 60.0 Calcium channel blockers 0.0 Angiotensin-converting enzyme inhibitors
40.0
Angiotensin receptor blockers 10.0 Diuretics 50.0 Antiplatelet agents 90.0 Statins 50 Blood Pressure Parameters, mmHg
Brachial systolic blood pressure 141.5 ± 25.7 Brachial mean blood pressure 96.0 ± 16.0 Brachial diastolic blood pressure 68.6 ± 13.3 Radial systolic blood pressure 145.8 ± 24.2 Radial mean blood pressure 96.0 ± 16.0 Radial diastolic blood pressure 68.7 ± 12.9
Heart Rates (Baseline), beats/min 79.4 ± 15.7

9
Table S3. Absolute band errors* between the various noninvasive blood pressures and measured central systolic blood pressure in the Validation group (n=100) Noninvasive BP
parameters Distributions of the absolute value of band error
<=5 mmHg <=10 mmHg <=15 mmHg Cuff SBP 60% 86% 95% N4-derived SBP 69% 82% 96% N6-derived SBP 68% 88% 99% BP = blood pressure; SBP = systolic blood pressure; N-point moving average method (NPMA)-derived central SBP with N/4 (N4-derived SBP) or N/6 (N6-derived SBP) using the noninvasive brachial pressure waves. *Band error was determined according to the suggestion of AAMI SP10 2009;4 error is the extent that estimated central SBP fell outside the range of mean ± S.D. of measured central SBP. If the value obtained from the noninvasive methods lies within the range of the variation of blood pressure, assign an error of 0 mmHg to this determination. If the value obtained from the noninvasive methods lies outside the range of the variation of blood pressure, subtract the value of the determination from the adjacent limit of the range of the variation of central SBP. The absolute difference represents the error for this table.

FigursubjeinvasSBP-
re S1. Compects) in the tsively measu-B = brachia
parisons of eime domain
ured radial (sl systolic blo
ensemble avn (Panel A) asolid line) anood pressure
10
verage pressand frequencnd brachial pe; SBP-R = r
sure waveforcy domain (pressure wavradial systoli
rms (derivedPanel B) be
veforms (dasic blood pres
d from 10 etween the shed line). ssure.
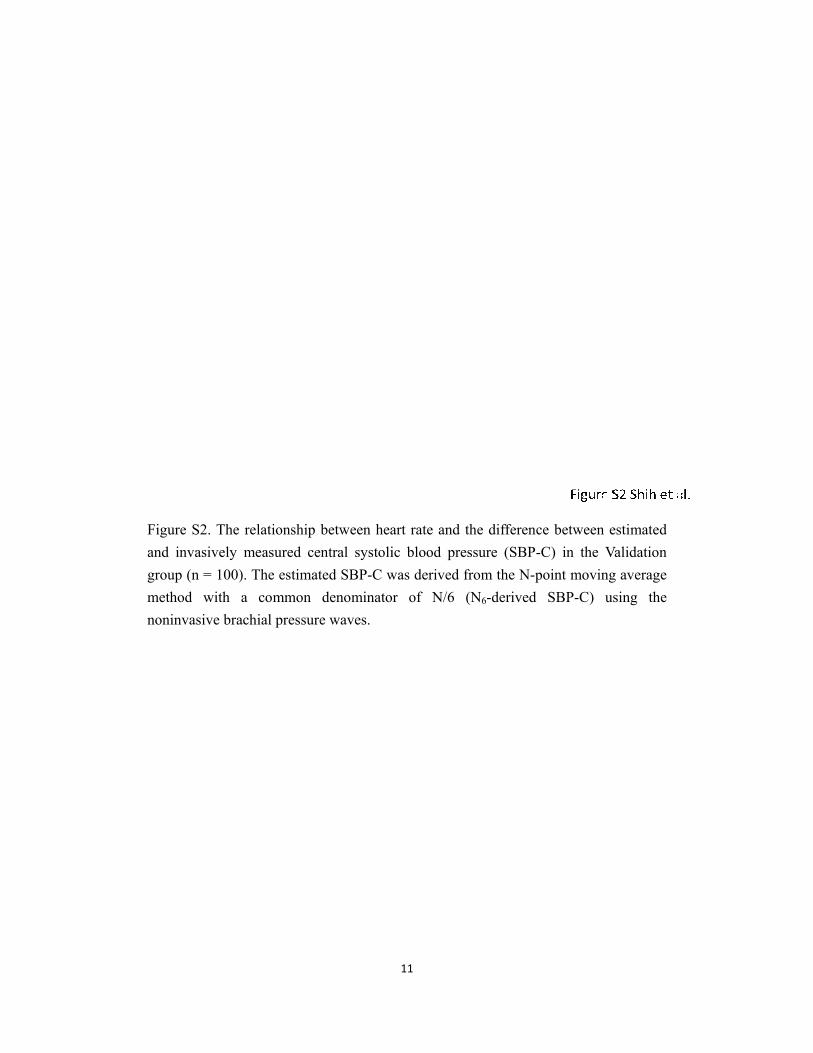
Figurand igroupmethononin
re S2. The rinvasively mp (n = 100). od with a nvasive brac
relationship bmeasured cen
The estimatcommon
hial pressure
between heantral systolited SBP-C wdenominatoe waves.
11
art rate and ic blood prewas derived fr of N/6
the differenessure (SBPfrom the N-p(N6-derived
nce between -C) in the Vpoint movin
d SBP-C) u
estimated Validation
ng average using the