central bank of seychelles report 2001.pdfcontents letter of transmittal board of directors list of...
TRANSCRIPT

CENTRAL BANK OF SEYCHELLES
ANNUAL REPORT 2001

CENTRAL BANK OF SEYCHELLES
ANNUAL REPORT
2001

CONTENTS
Letter of Transmittal
Board of Directors
List of Tables
Economic Review of 2001 1
Section One World Economic Conditions 4
Section Two Highlights of the Seychelles Economy 19
Section Three Financial Survey 23
Section Four Government Finance 36
Section Five The External Sector 50
Section Six The Real Sector: Production, Employment and Prices 69
Section Seven Investment and Offshore Developments 90
Section Eight Operations and Administration of the Central Bank 97


CENTRAL BANK OF SEYCHELLES
Board of Directors
(as at 31 December 2001)
Francis Chang Leng, Governor - Chairman Errol Dias - Member Francis Chang-Sam - Member
Secretary to the Board
Jean-Claude D’Offay

List of Boxes, Charts and Tables Box No. Title Page The External Sector 5.1 New foreign exchange laws 67 Chart No. Financial Survey 3.1 Growth rates of the money supply aggregates; 1996-2001 27 3.2 Growth rates of credit of the banking system; 1996-2001 28 3.3 Growth rates of credit held by the economic agents; 1996-2001 29 3.4 DBS Loans and Advances by Economic Sectors, 2001 33 3.5 The movement in credit/deposit ratio in 2001 34 3.6 The movement in the commercial credit and deposits in 2001 34 Government Finance 4.1 Government finance outcomes for 1998-2001 36 4.2 Major revenue flows in current receipts in 1998-2001 39 4.3 Government expenditure by main headings; 1998-2001 43 4.4 Source of government budget financing; 1998-2001 49 The External Sector 5.1 The overall balance, current account and capital &
Financial account of the BOP for 1995-2001 50
5.2 Trade in Goods, 1995-2001 54 5.3 Exports, 2001 55 5.4 Imports, 2001 57 5.5 Exchange rates 66

Chart No. Page The Real Sector: Production, Employment and Prices 6.1 Real GDP growth; 1990-2001 69
6.2 Inflation rate for 1996-2001 88
Offshore and Investment Developments 7.1 Number of IBCs registered per year
and their cumulative totals 92 Operations and Administration of the Central Bank 8.1 Advances to Government; 1996-2001 98 8.2 Currency in circulation; 1996-2001 99 8.3 Stock of Public Debt Instruments; 1996-2001 101 Table No. Financial Survey 3.1 Monetary Survey; 1996-2001 26
3.2 Credit; 1996-2001 30
3.3 Commercial Banks – Loans and Advances to Non-Government
Sector by Economic Sectors; 1997-2001 31
3.4 Loans by Development Bank by Economic Sectors; 1997-2001 32
3.5 Liquidity Indicators of Commercial Banks; 1996-2001 34
3.6 Interest Rates; 1996-2001 35
Government Finance 4.1 Government Budget; Summary 1999-2002 37
4.2 Government Budget; Revenue 1999-2002 40
4.3 Government Budget; Expenditure 1999-2002 45
4.4 Public Sector Capital Project Expenditure 1996-2001 47

Table No. Page The External Sector 5.1 Balance of Payments; 1996-2001 52
5.2 Domestic Exports; 1996-2001 54
5.3 Imports (cif) – by HS Sections; 1996-2001 56
5.4 Goods procured in ports; 1996-2001 58
5.5 Services 1996-2001 60
5.6 External Reserves; 1996-2001 64
5.7 Exchange Rates; 1996-2001 65
The Real Sector: Production, Employment and Prices 6.1 Gross Domestic Product by Kind of Economic Activity at constant market prices 70 6.2 Gross Domestic Product by Kind of Economic Activity at current market prices 71 6.3 Gross Domestic Product by Broad Productive Sectors at current market prices 73 6.4 Tourism 75
6.5 SMB Purchases of Vegetables and Fruits 78
6.6 Crops 79
6.7 Livestock (slaughters) 80
6.8 Estimates of Fish Landed 82
6.9 Employment 86
6.10 Average Monthly Earnings 87
6.11 Composition of Retail Price Index 89
Operations and Administration of the Central Bank 8.1 CBS Advances to government; 1996-2001 98
8.2 Circulation of Notes and Coins; 1996-2001 99
8.3 Bankers’Clearing House Activities; 1996-2001 100
8.4 Treasury Bill Yields; 1996-2001 102
8.5 Treasury Bills; 1996-2001 103
8.6 Treasury Bonds; 1996-2001 104
8.7 Government Stocks; 1996-2001 105

Table No. Page
8.8 Capital Fund Ratios of Commercial Banks; 1996-2001 105
8.9 Minimum Reserves and Local Assets Ratio; 1996-2001 106
8.10 Temporary Advances against Government Securities; 1996-2001 107
8.11 Government of Seychelles Re-finance Scheme; 1996-2001 107
8.12 Commercial Bank Advances to Non-Seychellois; 1999-2001 108
8.13 Commercial Bank Advances to Parastatals; 1999-2001 109
Technical Note
Owing to rounding of figures, the sum of separate items may not always add up to the total shown.
Abbreviations used in this Report are:
R = Seychelles Rupee
CBS = Central Bank of Seychelles n.a = Figure not available .. = Negligible -/0 = Nil

ECONOMIC REVIEW OF 2001
The Ministry of Agriculture and Marine Resources (MAMR) announced that Pakistan has
lifted the seven-year-old ban it imposed on the imports of copra from Seychelles in 1994.
With the lifting of the ban, Seychelles could now export its copra to Pakistan, which has
been its main market for that product, albeit, under a series of conditions imposed by the
Plant Protection unit in Pakistan. It is to be noted that an in-depth study carried out by
the FAO in 1995 indicated that Seychelles’ copra was free of any kind of diseases.
The Public Utilities Corporation (PUC) secured a loan amounting to US$25 million from
two international banks to finance the installation of four water desalination plants in
Seychelles. South Africa’s Nedbank has contributed US$14 million whilst Malaysia’s
Bumiputra Commerce Bank financed the balance of US$11 million. The loan agreement
with the two banks was signed by the Executive Chairman of the PUC board, Mr Mukesh
Valabhji, the Executive Vice-President of the London branch of Malaysia Bumiputra
Commerce Bank Mr Hashemi Albakri Bin Abu Bakar and the Senior Manager of South
Africa’s Nedbank Mr Johan Oelofse.
The Vice-President, Mr James Michel signed a letter of Commitment to the Organisation
of Economic Cooperation and Development (OECD) that the country would work
towards the establishment of international standards to eliminate harmful taxation
competition. Hence, Seychelles becomes one of the offshore-industry countries that is
recognised as a cooperating jurisdiction under OECD.
President Rene announced ministerial and principal secretary changes. Minister Patrick
Pillay became the new Minister for Health. Minister Jacquelin Dugasse, moved to the
Ministry of Industries and International Business. Mr. Joel Morgan, the Principal
Secretary for Industries and International Business, moved to the Ministry of Land Use
and Habitat. Mr. Joseph Nourrice from Land Use and Habitat became the new Principal
Secretary for Industries and International Business.
In April Air Seychelles’ new Boeing 767-300ER arrived. The national airline’s Chief
Executive (CEO), Captain David Savy, described it as a boost to the country’s tourist
January
March
April
Ministerial and PS changes
February
Letter of commitment to OECD
USD$25m for desalination plants
Ban on copra lifted
New Boeing 767-300ER for Air Seychelles
- 1 -

- 2 -
market in Europe. The new 246-seat aircraft, carries the name “Aldabra” from the older
Boeing 767-200ER.
Education Minister Danny Faure inaugurated the University of Seychelles-American
Institute of Medecine (USAIM) in a ceremony attended by other government ministers,
the new institutions administrators, top medical personnel and members of the diplomatic
corps.
The National Assembly supported the Government’s effort to ensure equitable
distribution of foreign exchange earned in the country’s economy by approving
amendments to strengthen legislation governing all transactions that deal in foreign
exchange. The amendments were: the Foreign Earnings (Regulations) Act, Exchange
Control Act, Central Bank of Seychelles Act, Trades Tax Act and Licences Act.
President France Albert Rene announced the appointment of three controllers under the
amendments to laws governing foreign exchange transactions in Seychelles. Mr Pierre
Laporte was appointed as Exchange Controller, Dr Peter Larose as Banking Controller
and Mr Patrick Vel as Price and Import Controller. He also announced the appointment
of Mr Francis Chang-Leng as Governor of the Central Bank, and Mr Mukesh Valabhji as
Presidential Economic Advisor.
Vice-President Mr James Michel inaugurated the R100 million Greater Victoria sewage
Treatment works at Providence. The system has a capacity to treat as much as 7000 litres
of sewage daily and is designed to cater for the needs of Victoria for the next 20 years.
President France Albert Rene inaugurated Praslin Airport at Amitie. He said the rebuilt
state-of-the-art airport is a key tool for tourism development on the island and represents
another important achievement by the Government for the people of Seychelles.
Seychelles acquired its biggest inter-island cargo ship, Praslin Dolphin, which has a cargo
capacity of 200 tonnes. The 34-metre long and 8.2-metre wide vessel belongs to
company Praslin Dolphin Ltd and was built by island Network in Sibou, Malaysia.
June
Inauguration of sewage treatment works
Inauguration of USAIM
July
Seychelles biggest cargo ship
May
President inaugurate Praslin Airport
Appointment of controllers
Amendment to Acts approved

- 3 -
Yve’s Pty Ltd, local distributor of UK- made Topaz made history in Seychelles when it exported
its first eight-tonne consignment of beauty products and toiletries to Madagascar. The co-owner of
the company, Mrs Yvette Breithaupt, expressed hope that the new venture would contribute in
increasing foreign exchange inflows.
South African company Biwater and the Government of Seychelles signed a contract to
build desalination plants on all three main islands within 16 months. The US$29 million
project, to which the government is contributing R22 million, will deliver an additional
daily total of 20,900 cubic metres of water into Seychelles’s distribution network.
The Seychelles Government issued an indemnity worth US$750m to the national airline’s
insurers. This was required to keep the carrier air-borne in the wake of the September 11
terrorist attacks in the United States. The Seychelles Government has made it clear that it
will do everything possible to ensure the continued viability and survival of the airline,
which carries 70 per cent of all tourist traffic to and from the country.
Air Seychelles acquired the services of a new Boeing 737-700 aircraft, named Amirantes.
The new aircraft is to be used on regional routes and thus release the other two Boeing
767-300s to longer distance journeys to Europe.
The Seychelles Marketing Board (SMB) installed a new R2 million pasta manufacturing
plant at its Bois de Rose premises. SMB is expected to meet the country’s growing
demand for the wheat products, currently estimated to be 18-22 tonnes per month.
The Budget for 2002 was approved by the National Assembly. In his Budget speech Mr
James Michel, the Minister for Finance announced a new housing scheme to allow
families to buy their homes at a discount, a reduction in the airport tax for residents from
R500 to R250 and the intensification of the war on price increase.
October
August
September
December
Desalina-tion project
US$750 million indemnity
Budget 2002 approved
Exports of beauty
Novembe r
New Boeing 737-700
New pasta plant

SECTION ONE
World Economic Conditions
1. Overview
In the year 2000, there were bright
prospects for the world economy after
attaining its fastest pace of growth for over
a decade and a half. With the exception of
Japan, healthy growth figures were being
recorded in all the main industrialised
economies. The world’s largest economy,
the United States was growing at 4.0 per
cent annually, stimulating demand from
around the world and inspiring exports
particularly from Asia. However, towards
the end of the year and during 2001, global
economic activity slowed down
significantly. Firstly, this was due to the
downturn in the performance of advanced
economies, particularly the US. Secondly,
there was a moderation in growth in a
number of emerging market countries. It
was estimated that in general, in 2001, no
growth was recorded in per capita world
output.
Growth eased in response to the impact of
higher prices on purchasing power (oil
prices) and weaker business confidence in
addition to spill over effects of the US
slowdown. In the year 2001, of the Group
of Seven (G7) leading high-income
economies, initial indications were that
only the UK had a reasonable chance of
performing in line with its long-term trend
and escape the recession that was first
experienced in Japan.
In attempts to boost the economy and limit
the impact of the downturn, the main
industrialised economies, eased their
monetary policy. After attaining its
highest level the preceding year, interest
rates were reduced significantly with the
hope to improve global liquidity
conditions. Nevertheless, some tightening
of monetary policy were however found
appropriate, largely reflecting the growing
financial problems in countries like
Argentina.
With the contraction of the previously
booming IT-related industry, global
demand was severely affected, although
the recent decline in oil prices were
boosting some other industries by helping
to contain inflationary pressures. Oil
- 4 -
ANNUAL REPORT 2001 WORLD ECONOMIC CONDITIONS
- 5 -
prices and production outlook however
remained highly uncertain. During 2001,
the world price of petroleum fell to US$
20.48 per barrel from US$ 32 a barrel at
the start of the year.
To add to the world economic difficulties,
on September 11, there was a terrorist
attack in New York and Washington that
resulted in an immediate blow to future
growth prospects, following the
consequential increase in uncertainty and
slip in confidence. Surprisingly, in spite
of the global slowdown, countries like
China, India and Russia, recorded rapid
economic growth over the period, proving
that some parts of the world were rather
resilient to international events.
1.1 Developed Countries
1.1.1 United States
In the USA, since the beginning of the
year, there were already indications of
weakening economic activity. That,
prompted the Federal Reserve Open
Market Committee (FOMC) to reduce
interest rates on January 3, for the first
time since late 1998, in a bid to improve
global liquidity condition and confidence
amid weakening sales and production. As
early as in the first quarter, there were
reports that the world most powerful
economy slowed to a near standstill.
Consequently, these were expected to lead
the rest of the world to recession, given
that global activity remained dependent on
developments in the US.
Based on some initial findings, up to mid-
year consumer spending and earlier
increase in government expenditure were
supporting the economy in attaining
expansion in GDP. Consumer and
business confidence however deteriorated
thereafter, which led to falling imports as
well as exports. There was also
weakening business profits and capital
spending, although household expenditure
was relatively stable. Even if the long-
term prospect for domestic economic
expansion and productivity was still
favourable, the economy started to show
signs of weak employment, productivity
and corporate investments.
Notwithstanding the fact that the US
official GDP figure from January to June
was still showing expansion, there were
also early signs that the world largest
economy would enter into a recession.
The persistence weakness in business and
consumer confidence was unfortunately
aggravated by the terrorist attacks on
September 11. The event had immediate
adverse effects on world economic
conditions, forcing policy-makers to adopt
urgent policy adjustments. In a bid to
limit the effects of the attacks, the Federal
Reserve cut interest rates further,
prompting other major central banks to
make a similar move in less than one week
after the event. There was a significant
blow to confidence and increase in
uncertainty about the US that led to
contraction in household and business

ANNUAL REPORT 2001 WORLD ECONOMIC CONDITIONS
- 6 -
expenditure. Nevertheless, the main
industry to be severely affected was
tourism and travel. The aftermaths of the
incident forced leading travel and tourism
industry associations worldwide to
collaborate and seek the assistance of
governments, to collectively address
concerns that were being faced by the
industry – a US$ 15 billion aid package
was subsequently approved in the US.
Many airlines were forced to reduce
employment as the global airline industry
contracted with the repercussions of the
event spreading within the USA and
internationally. Hundred of thousands of
travel-related employments were lost with
airlines reported to be operating 40 per
cent – 50 per cent below capacity.
Estimated job losses in New York City
alone were 100,000, amongst which, many
were in financial services, the state’s main
economic engine. There was a significant
reduction in the hotel occupancy rate in
Washington DC. The loss of business to
travel agents after the attacks was
estimated at US$ 51 million per day. The
national economy is expected to have lost
US$ 639 billion, based on reduction in
annual GDP.
In the year 2001, the month of September
was believed to be the poorest monthly
performance in economic activity for the
US economy. Not surprisingly therefore,
GDP for the third quarter declined in
output by 0.4 per cent, to represent the
worst achievement in US quarter three
GDP since 1991. Many views were that
the US economy was going to follow
Japan to recession predicting a continued
fall in GDP, although the long-term
growth prospects remained favourable.
Towards the end of the year, the US was
unexpectedly showing signs of an upturn
in activity. These were attributable to a
fall in unemployment and benefit
payments in addition to increases in
income that was boosting consumer
spending, restoring confidence and
signalling rise in investments.
December’s unemployment figure fell by
5.8 per cent, to represent the first drop
since May 2001. Even if job markets
remained weak, overall job losses
moderated and in December, personal
income rose for the first time in four
months.
Consumer spending, productivity and
demand for services that were on a
declining trend picked up towards the end
of the year, after being boosted by the
aggressive interest rates cuts – by 11 times
in 2001. However, consumer spending
that accounts for two-thirds of US
economic activity, recorded the weakest
increase in the States’ annual retail sales
since 1993. During the year, price index
fell by 1.8 per cent after attaining an
increase by 3.6 per cent the preceding
year. Inflation remained low and stable
with a recorded rise in CPI by only 1.6 per
cent.

ANNUAL REPORT 2001 WORLD ECONOMIC CONDITIONS
- 7 -
In the financial market, the US equity
market fell, due to weak corporate
earnings reports, a downward revision in
technological valuation, tightening credit
conditions and increase in expectations of
the US slowdown in light of increasing
uncertainty. However, confidence was
expected to have been on the upward trend
towards the end of the year.
In the three months ending December,
GDP recorded a surprise expansion by an
annualised rate of 0.2 per cent. This
implied that if one was to stick to the
definition of recession of two consecutive
quarterly contractions in GDP, then, the
US was not in recession during 2001.
However, arguments supporting the
alternative view was that the technical
definition does not give a correctly enough
representation of economic performance
since it covers a “long” time period and
may ignore performance of many
important variables. It was argued that
other indicators like movements in
unemployment as well as that in income
and prices on a monthly basis, for
example, would give better indications of
economic activity as opposed to the GDP
figure on its own.
1.1.2 European Union
1.1.2.1 Eurozone economies
An early sign of the slowdown in the
eurozone was visible in the decline in
business confidence, even if consumer
confidence, being backed by growth in
disposable income, remained strong at the
start of the year. Bearing in mind
monetary movements and inflationary
pressures, the Governing Council of the
European Central Bank (ECB) made its
first interest rates cut during the second
quarter of the year. In total the key ECB
rates were revised downwards on four
occasions during 2001.
In the second half of the year, growth
prospects weakened as the world
economic slowdown became more
pronounced and unfolding development in
the US following the September 11
incident was taking its own course. With
weak external demand, lower investment
confidence and slow moving domestic
demand, commodity prices followed a
downward trend and economic indications
were pointing to a lower than expected
real GDP growth rate. The easing of
monetary policy amid low inflationary
pressures was expected to stimulate
domestic demand, following improvement
in financing conditions in the euro area.
Nevertheless, throughout 2001, economic
activity remained weak with the
expectation of an upswing in 2002.
All through the year, euro area real GDP
growth rate year-on-year at the end of each
quarter maintained a downward trend.
The figure was expected to have declined
from 3.4 per cent in 2000 to between 1.3
per cent – 1.7 per cent in 2001 while
estimated inflation was around 2.6 per cent

ANNUAL REPORT 2001 WORLD ECONOMIC CONDITIONS
- 8 -
– 2.8 per cent. Contractions in imports
and exports were also expected. Although
long-term growth prospects remained
relatively strong in other regions, those in
larger EU accession countries gradually
deteriorated. In Poland, the weaker
exports demand was aggravating the
abating domestic economic environment.
With regards to the outlook in the Czech
Republic and Hungary, the situation
remained relatively benign even if
evidence of deterioration in growth
prospects was cropping in. On the other
hand, in Turkey according to the ECB,
economic situation “remains particularly
difficult” on expense of persistent high
inflation amid sharp decline in
consumption and investment demand.
In Russia however, economic outlook
remained positive. There was stronger
than expected influence on the economy
owing to the favourable terms of trade and
improved competitiveness experienced
over the previous three years.
Nevertheless, short to medium-term
growth was expected to be hampered by
the worsened global environment in
addition to the recent decline in oil prices.
In the world third largest and euro area’s
largest economy, outlook deteriorated
amid the world slowdown. The downturn
that became more pronounced in the
second half of the year, which had
hindered activity in Germany, was helping
to drag the euro area to a recession. At the
end of 2001, the German economy grew
by a mere 0.6 per cent, compared to 3.0
per cent the previous year, and
representing its poorest performance since
1993 in particular the unemployment
aspect was nearing the politically sensitive
point. There was also concerned over the
budget deficit that had widened to 2.6 per
cent of GDP, from 1.2 per cent in 2000. It
was believed to be a result of the tax cut
implemented at the start of the year, in
addition to the slowdown in global
activities. On the other hand exports
growth slowed to 5.1 per cent, from 13.2
per cent the previous year.
1.1.2.2 Non-eurozone economies
A preliminary overview of the UK’s
economy concluded that in general,
performance in 2001 was above that of
many industrialised economies. However,
according to the recent data released by
the Office of National Statistics (ONS),
GDP grew by just over 1.7 per cent,
compared to 2.2 per cent the previous
year. Unfortunately it was Britain’s worst
performance since 1992 when the
economy was recovering from its last
recession.
In the first half of the year, signs of
weakening in investment growth, fall in
equity market and the forecasted effects of
the foot and mouth disease on demand,
output, and confidence were negatively
impacting on the economic activity.
Notwithstanding these, the effects of the

ANNUAL REPORT 2001 WORLD ECONOMIC CONDITIONS
- 9 -
world slowdown were believed to be
softening in outlook. Persuaded by the
weaker than expected indicators of world
economic activities and in line with
attaining its long-term economic targets,
monetary policy was substantially eased
throughout the year whereby the Bank of
England cut interest rates seven times to a
37-year low of 4.0 per cent.
The seven cuts in interest rates helped to
restore business and consumer confidence
in addition to investment growth. Strong
performance in activity was apparent in
retail spending, household borrowing and
the housing market. Relatively high
spending by the public and private sectors,
stimulated growth and unlike some of the
world main economies, the UK recorded
no quarterly contraction in GDP during
2001. Nevertheless, some members of the
Monetary Policy Committee saw the
strong spending as being “unstable” as it
was directly being financed from
borrowing, and consequently expected to
be held back with increase in
indebtedness.
On the production side, performance
declined during the year, with the most
affected being the hi-tech industry and
investments in that sector originated from
the US, while in addition, the services
sector recorded sluggish performance.
The slowing global situation and weak
firm domestic demand, encouraged output
to be stimulated in the more sheltered
sectors, while those in the internationally
exposed areas contracted.
In consideration of international
competitions and also to some extent the
persistent strong value of the sterling,
downward pressures were being exerted
on prices. There were reports of reduction
in prices by companies of all sizes and in
all sectors resulting in declining profit
margin. Nevertheless, inflationary
pressure stayed within its target and long-
term trend, near 2.5 per cent.
In the labour market, unemployment was
contained, although a moderate increase
was recorded, especially towards the end
of the year. The percentage of people out
of work and claiming benefit was in
general steady at 3.2 per cent and stayed
below the European Union average, and
the lowest among the G7 industrial
countries.
1.1.3 Japan
From the start of the year, Japan showed
signs of declining business and consumer
confidence, which left little hope for
improvement in growth prospects. The
economy deteriorated as private
consumption weakened in addition to a
reduction in net exports and business fixed
investments.
Industrial production declined
substantially and these had adverse effects
on employment and income indicators.

ANNUAL REPORT 2001 WORLD ECONOMIC CONDITIONS
- 10 -
Japanese industrial output dropped by 7.9
per cent, to record the biggest fall in 26
years, when Japan’s industry was shaken
by the oil crisis. In December, the
recorded decrease in year-on-year output
was 14.9 per cent. Recent indicators
support the view that manufacturing
activity stayed frail for some time. In
addition, housing investment was sluggish
while public investment maintained a
downward trend.
With falling sales figures, Japanese stores
chose to slice prices: there were
increasing evidence of persistent
deflationary pressures as both consumer
and wholesales prices maintained a
downward trend. Import prices rose
towards the end of the year due to
continuing depreciation of the yen that
was however insufficient to exert
inflationary pressures. Deflationary forces
are expected to persist during 2002 and
year 2001 figures indicated that consumer
prices fell by 0.7 per cent, for a record
third year in a row.
In year 2001, Japan’s trade surplus
plunged 38 per cent to 6,611 bn yen, the
biggest decline since 1970. The drop in
December year-on-year was 18.4 per cent,
reflecting the slower demand for Japanese
exports amid the slowing global economy
and relatively weaker domestic demand
for imports as Japan struggled with
recession. Japanese companies were faced
with contracting demand in both the
domestic economy as well as in the US,
and at the same time, with increasing
competitions from neighbouring Asian
countries. A number of companies were
forced into bankruptcy after domestic
demand failed to reach profitability levels.
Some exporters (like carmakers) were
however helped by the preceding falling
value of the yen. Nevertheless, the US,
China and South Korea were of the view
that Japan may be using the yen
depreciation to “exports its way out of
recession”.
Unemployment for the year rose steadily,
increasing to 5.6 per cent in December as
companies restructured or collapsed while
deflation and diminishing domestic
demand persisted. Increases in
bankruptcies and insecurity about jobs
were having damaging effects on
consumer confidence. Spending by
salaried households fell by 4.4 per cent in
December on the year contrary to the 0.8
per cent decline recorded the previous
year.
In the financial market, in bids to inspire
the economy out of recession, the Bank of
Japan intervened when necessary (and
changed the guidelines for money market
operations) to ensure smooth fund
settlement and effective functioning of
markets. More importantly, after the
September 11 event, to make sure that
ample liquidity was available, the Bank of
Japan in effect returned to a zero-interest-

ANNUAL REPORT 2001 WORLD ECONOMIC CONDITIONS
- 11 -
rate policy. The Bank also adopted a
framework for further monetary stimulus;
consequently, the overnight inter-bank
interest rates and longer-term bond yields
fell. In addition, interest rates were also
lowered and at the end of the year, the
official discount rate had been reduced to
0.1 per cent.
1.2 Developing Countries
In the face of the global economic
slowdown, growth in developing countries
fell to 2.3 per cent in 2001, in comparison
to 5.8 per cent the previous year, mainly
due to external factors. Growth in Africa
remained almost unchanged in 2001 at
around 3.4 per cent and is expected to
increase slightly to about 3.5 per cent in
2002. From the UN’s point of view,
improved agricultural conditions and more
political stability were expected to boost
growth figures. It is expected that an end
to violence in some African nations would
revive investors and consumer confidence,
while some of the poorest African
countries, including Benin, Ethiopia, Mali,
Niger and Senegal, are expected to benefit
from debt relief.
In year 2001, the contraction of the
communications and technology sectors,
and the region’s trade relationship with the
US had significant adverse effects on most
East Asian economies. It was forecasted
that a recovery in exports and simulative
policies would push economies of the
region into achieving positive growth
figures by mid-2002. In China however,
albeit the global downturn, the Chinese
economy, finished the year 2001 with a
positive growth figure of 7.3 per cent, with
expectation of the economy remaining
robust during 2002. An exceptional
achievement.
1.2.2 Asia
In the slowing global economic
environment, imports in the Philippines
declined at its fastest pace in almost three
years in November. The fall in imports
was associated with the contraction in the
technological industry. Imports plunged
by 23.6 per cent compared to the previous
year to about US$ 2 billion, to represent
the biggest drop since December 1998.
The decline in imports was due to
reduction in orders from the US and Japan
by manufacturers. Falling imports of
electronic components also resulted in a
direct contraction in exports of electronic
goods. The government estimated that the
drop in exports (by 15 per cent in 2001)
slowed the economy to about 3.3 per cent
in 2001, from 3.9 per cent in 2000. The
economy was however expected to grow
by about 4.5 per cent in 2002.
Singapore, one of Asia’s strongest
economy suffered its worst recession in
four decades – the trade dependent
economy shrunk by 2.0 per cent in 2001,
contrary to a 9.9 per cent growth the
previous year that made it Asia’s best
performer. The year 2001’s outcome was

ANNUAL REPORT 2001 WORLD ECONOMIC CONDITIONS
- 12 -
associated with the contraction in global
electronic industry that contributes to more
than half of the output in the all-important
manufacturing sector, that itself accounts
for 22 per cent of GDP. The situation has
been worsened by the sharp slowdown in
the US, drop in global demand for IT-
related products and contraction in Asian
economies.
During 2001, Malaysia recorded a trade
surplus of 53.7 bn ringgit (about 14bn
US$), despite the global economic
slowdown. The recorded figure was 13.1
per cent lower than the previous year.
Both exports and imports fell in 2001, by
10.4 per cent and 9.9 per cent respectively.
Exports in comparison to main exporting
partners declined, with the exception of
exports to China and France, where a rise
was attained. Nevertheless, imports from
China rose, continuing the trend, which
started since March 2001.
1.2.3 Latin America
Overall, the year 2001 was a disappointing
one for Latin American bloc. The regional
GDP estimates for the region was flat and
therefore, in consideration of population
growth, this implied falling living
standards. These countries were affected
by the economic slowdown in the
developed economies, particularly the US,
instability in world financial markets and
falling prices for commodities. However,
during the year 2001, the Argentinean
crisis overshadowed other developments
in the region. The table below shows the
estimated Real GDP growth and inflation
forecast for some Latin American
countries, based on a country briefing
from the Economist Intelligent Unit (EIU).
Year 2001
Real GDP Growth Inflation Forecast
(%) (consumer prices, average % change)
Argentina -3.5 -0.8
Brazil 1.6 6.7
Chile 3.1 3.6
Colombia 1.8 8.0
Educator 4.2 37.7
Mexico -0.9 6.5
Peru -0.7 2.0
Venezuela 3.5 12.6
Source: EIU

ANNUAL REPORT 2001 WORLD ECONOMIC CONDITIONS
- 13 -
In Argentina, the effects of worsening
performance following increasing years of
negative growth became more pronounced
in 2001. Consumption and welfare
declined considerably as a result of cuts in
public wages and pensions, while
investments and employment level fell due
to deterioration in business environment.
Overall, economic activity remained
stagnant as domestic demand weakened.
In the financial market, the situation
worsened as confidence in the peso
deteriorated and the market collapsed.
The Government was forced to impose
restrictions on withdrawals from banks
and on access to US dollars from
transactions abroad. Shocks from
Argentina’s financial market were spread
to the Asian markets classified or placed in
the same investment basket by overseas
investors. Consequently, fund manager’s
attentions were switched from Argentina
to countries having the same economic
profile, like the Philippines for example.
International investors’ confidence was
reduced significantly when Argentina
failed to receive financial assistance from
the IMF after the former could not meet
the originally proposed fiscal target.
While monitoring the country’s economic
plans, the IMF has in recent years paid
US$ 40 billion to Argentina. Throughout
2001, the country deferred payments on its
foreign debt and was also “forced” to
delay other payment obligations – at the
end of December, total debt suspended
stood at US$ 141 billion.
In Brazil, slowing deflationary pressures
triggered by lower fuel prices and
strengthening of the domestic currency,
created favourable conditions for a
reduction in interest rates in year 2002.
This was after the central bank had raised
interest rates five times, by 375 basis
points since February 2001. The
tightening of monetary policy during 2001
was to reduce the upward pressures on
prices, triggered by a tumble in the
currency, by 30 per cent in the first three
quarters of the year.
In Mexico, historically low inflation
improved investment prospects, especially
in the agricultural sector. The country’s
annual inflation rate fell from 9.0 per cent
to 4.4 per cent in 2001, the lowest level
since inflation information first recorded
in 1968. This was believed to be
associated with the stronger currency and
a slowing economy that helped to restrain
the rise in consumer prices. The inflation
target for the year was 6.5 per cent and the
attained rate was accompanied by
considerable drop in real and nominal
interest rates. The currency (peso) gained
5.08 per cent against the US$ even as the
economy contracted. The falling inflation
also reduced financial risks, although
some small business owners and
consumers awaits recovery in the US, to

ANNUAL REPORT 2001 WORLD ECONOMIC CONDITIONS
- 14 -
which 90 per cent of Mexican exports
goes. It was however forecasted that a
weaker Mexican peso could reverse the
slowing inflation trend. The Bank of
Mexico estimated that GDP for the year
contracted by 0.3 per cent in real terms
and the economy experienced its first
recession since 1995.
1.2.3 The Middle East and Africa
Two of the main factors that continued to
influence economic activities in the
Middle East and Africa were the price of
oil, a legacy of economic policies and
structures that had emphasised a leading
role for the states. The economically
diverse region that includes oil-rich
economies of the gulf to resources-scares
countries in relation to population was not
isolated from the world economic
slowdown. More importantly, the decline
in oil prices had direct effects on
performance of many of these countries.
In Africa, economic and social
developments continued to be affected by
the AIDS epidemic, which had directly
offset the recent slight rise in life
expectancy.
In South Africa, the economic engine of
the African continent, economic growth in
year 2001 was 2.9 per cent and was
expected to be 3.1 per cent the following
year. Nevertheless, development in the
global environment resulted in slowing
growth in real value-added by the
manufacturing sector, while agricultural
output declined compared to the previous
year. There were also signs of falling
employment that was more subdued than
in any of the preceding five years.
In Ghana, the positive macro-economic
trend that started at the beginning of the
year continued, while inflationary pressure
was on a declining trend. Growth figures
was estimated at 5.8 per cent in 2001 and
expected to be maintained at 5.3 per cent
the preceding year.
However, in Zimbabwe , growth prospect
in 2001 deteriorated compared to the
previous year, and was expected to worsen
in 2002. Faced with increasing
inflationary pressures and rising
unemployment in addition to worsening
political crisis, the economy contracted by
6.6 per cent, compared to 5.5 per cent the
previous year.
Given the year 2001 performance, the very
diverse nature of the African continent and
improvement in investment environment,
growth prospect was expected to improve
in 2002. Based on a joint report by the
Organisation for Economic Cooperation
and Development (OECD) and the African
Development Bank (ADB), growth in
Africa in 2002 is expected to be at least
two percentage points above that of
industrialised nations. This was believed
to be attainable from increasing foreign
investment inflows. The study stated that
although many African countries have not

ANNUAL REPORT 2001 WORLD ECONOMIC CONDITIONS
- 15 -
capitalised on the benefits of globalisation,
some have been able to do so which could
be equally successful elsewhere in Africa.
Nevertheless, growth figure for the whole
continent was estimated by the
Organisation for Economic Co-operation
and Development (OECD) and the
African Development Bank (ADB) at 3.4
per cent in 2001 compared to 3.2 per cent
the previous year.
2. World economic outlook
following the September 11 event
Unfolding developments following the
September 11 event on the US,
deteriorated global economic outlook
sharply and consequently hampered
growth prospects in all major regions of
the world. Following the immediate
increase in uncertainty and confidence, the
projected world outlook was re-assessed
and the IMF, like many organisations,
revised its growth forecast downwards.
The attacks had sudden impact on demand
and activity, especially in the US; it
weakened consumer and business
confidence further and in the financial
market, there was a general shift away
from risky assets. There was a huge
deterioration in financial conditions of
emerging countries and a fall in
commodity prices as business activity
shrunk and unemployment swelled.
However, according to an IMF special
report released after the incident, many
factors exist in the global environment to
help stimulate an upturn in activity:
policy-makers’ intervention to help boost
activity had been quick with aggressive
easing of monetary policy in all major
economies; oil prices have fallen sharply
even if not to the advantage of vulnerably
poor oil-exporting countries; and the
existence of favourable economic
conditions like low inflation, generally
improved fiscal positions in many
emerging markets, especially in Asia, and
other supportive factors to domestic
demand. Nevertheless, the question of
uncertainty and possible external shocks
has not been ruled out. Furthermore, the
time lag in implementation of structural
reforms, particularly in Japan and the euro
area may help to retard the eventual upturn
in activity. The IMF projected a deeper
than expected and more prolonged global
slowdown in GDP growth rate of about
2.4 per cent, 0.2 per cent less than the
original forecast.
3. Currency movements
3.1 Movements of world’s major
currencies
At the start of the year, increasing
uncertainty surrounding growth prospects,
particularly the sluggish activity in the US
and Japan, resulted in the foreign
exchange markets being characterised by
relatively high volatility. However, the
euro, the common currency of the 12
member countries of Western Europe,
remained fairly stable at the start of the
year and was around its average of the

ANNUAL REPORT 2001 WORLD ECONOMIC CONDITIONS
- 16 -
year 2000, at US$ 0.92. Nevertheless,
against the Japanese yen, it appreciated
due to depreciation of the yen.
After a bright start, the euro inevitably fell
to a year low of US$ 0.837 in early July.
According to analysts, the drop reflected
the “unfavourable comparison” of the
monetary situation in the US and euro
area. Unlike the traditional expectations
that lower interest rates weaken a currency
as it becomes less attractive to investors,
due to the market’s focus on economic
growth, each cut by the Federal Reserve
gave a temporary boost to the dollar.
These were associated with views that the
ECB’s decision-making was unpredictable
in comparison to that of the Federal
Reserve.
However, like in recent years, the euro
recovered in the summer months and
appreciated by about 9.0 per cent, to US$
0.92 towards the end of August, which
provoked speculations about the strength
of the US dollar. There were views that
the demand for US dollar fell as the earlier
expected recovery before July failed to
materialise.
In September, developments in the foreign
exchange market were dominated by the
September 11 incident in the US, which
resulted in a temporary upsurge in market
uncertainty. At that moment, according to
the ECB, this appeared to “have shifted
the markets’ sentiment on exchange rates”.
Consequently, some downward pressures
were being observed following the urgent
intervention by the Japanese authority to
avoid further unanticipated depreciation of
the domestic currency. One of the
currencies to gain from these movements
was the Swiss franc, which in general
strengthened. The depreciation of the US
dollar however caused weakening in
currencies of emerging markets because of
their dependent on the US dollar.
However, in the third week of September,
the yen rose against the US dollar to its
highest level in six months, which
prompted further interventions by the
Japanese authority.
Following the terrorist attacks, the euro
appreciated above US$ 0.93, six days later
when the US equity markets reopened,
subsequent to their first suspension since
the Great Depression. Nevertheless, with
investors’ focus on growth prospects, and
seeing the US as the economy to lead the
upturn in activity, the US dollar regained
its strength.
In year 2001, the US dollar appreciated
against most of the main currencies and
was associated to the rising long-term US
bond yields. At the end of December, the
euro remained broadly stable against the
US dollar and Swiss franc but depreciated
against the pound sterling. During 2001,
the foreign exchange market was marked
by the steady depreciation of the Japanese
yen against the euro and the US dollar,

ANNUAL REPORT 2001 WORLD ECONOMIC CONDITIONS
- 17 -
which portrayed the protracted weakness
of the Japanese economy.
The table below summarises the average
exchange rate against the US dollar for
year 2000 and 2001.
Average rates of exchange in year 2000/2001
(Currency unit per US$)
Currency 2001 2000 Currency
Movements
Depreciation (%)
Australian Dollar 1.9346 1.7197 12.5
Canadian Dollar 1.5487 1.4855 4.3
Chinese Yuan 8.2770 8.2784 -0.02
Danish Krone 8.3323 8.0953 2.9
Euro 1.1171 1.0832 3.13
Hong Kong Dollar 7.7997 7.7924 0.09
Japanese Yen 121.6 107.8 12.8
Singapore Dollar 1.793 1.725 3.9
South African Rand 8.6093 6.9468 23.9
Pound Sterling 0.6946 0.6598 5.3
Source: Federal Reserve
4. Trade and investment
4.1. World trade
The slowdown in global activity was
associated with an extensively anticipated
deceleration in world trade. Expenditure
on information technological products,
which boosted the outstanding
performance in many regions the previous
year, contracted considerably to trigger the
sharper-than-expected downturn. This
was subsequent to the sharp decline in
share prices on major stock exchanges, the
impact of which was apparent on
investment and production sectors.
Falling oil prices have however helped
improve trade situation for some oil
importing countries and kept inflationary
pressures contained. The September 11
event, which hampered growth prospects
internationally, unfortunately deteriorated
trade outlook. In Japan for example, the
year 2001 recorded its worst performance
in years, following contraction in exports
while imports recorded moderate growth.
The prices of internationally traded goods
were nevertheless dropped due to low-
level inflation of the major trades in
Western Europe and in Asia. As early as
in the first half of the year, world trade had

ANNUAL REPORT 2001 WORLD ECONOMIC CONDITIONS
- 18 -
already contracted compared to the
previous year. Exports and imports of
office and telecommunication equipments
reported above 10 per cent drops in value.
Trade in Japan and developing countries
of Asia reduced even if in other more
fortunate countries, like China for
example, trade situations remained robust.
Towards the end of the year, uncertainty
surrounding trade and growth
developments expanded amid lower
growth forecast. At the end of the year,
world merchandise exports were expected
to grow by only 2.0 per cent in contrast to
the 7.0 per cent earlier forecasted. In
Western Europe and the transition
economies, the projected growth in trade
was around the 2.0 per cent global forecast
while that of North America was expected
to be below this average.
4.1. World investment
Due to the sharp global downturn in
addition to the economic crisis in
Argentina and Turkey, the year 2001
experienced a subdued investment
outlook, especially in the emerging
markets. In the developing economies,
this has been affected by political
instability and uncertainty, which have
been aggravated by the September 11
incident. However, the situation was
expected to improve, subsequent to an
upturn in activity in the US, on which the
global economic performance remained
dependent.

SECTION TWO
Highlights of the Seychelles Economy
Overview
A current review of the performance of the
economy in 2001 reveals some signs of
recovery and further strengthening of
some key economic activities in the real
economy relative to the past year or so.
However, it should be noted on the outset
that both external and domestic influences
affected the overall outcome for the year
under review. Externally, the continued
recession in many parts of the world,
coupled with the terrorist attacks in the US
in September had an adverse effect on our
main industry, tourism. This resulted in a
0.2 per cent fall in arrivals for the whole of
2001. Despite the fall in arrivals, there
was an increase in revenue and it is
expected that the industry would rebound
in the coming year. On the domestic front,
the foreign exchange shortage remained
one of the underlying problems
particularly to the industrial sector, which
is now the second main economic activity.
With the introduction of the foreign
exchange laws in June, it has helped to
curb down a significant portion of the
parallel market activities and there has
been an increase in the level of inflows
going to the banking system.
Monetary Developments
In terms of monetary developments in
2001, there was a worsening in the
movements of the main monetary
aggregates, namely liquidity and credit,
compared to 2000. There was an
acceleration in the rate of growth of
liquidity in 2001. The broad money
aggregate, M2(p), rose by 11 per cent per
cent compared to 8.2 per cent in the
previous year. For domestic credit, the
pace of growth was only marginally higher
than in 2000. For the year 2001, credit
grew by 11 per cent, an increase of 1
percentage point over that of last year's
growth rate.
During the year, the Central Bank also
changed one of the interest rates under its
control. As of November 1, 2001, the
maximum lending rate was abolished and
it is now up to the commercial banks to set
their own lending rates based on their
- 19 -

ANNUAL REPORT 2001 HIGHLIGHTS OF THE SEYCHELLES ECONOMY
- 20 -
perceived risks. The only interest rate
under the ambit of the Central Bank was
the minimum savings rate, which
remained fixed at 3.0 per cent.
Budgetary Outcome
The process of fiscal adjustment, which
was set in a momentous drive in 1999
continued to be a focal point of the
government’s macroeconomic policy for
the year 2001. Though the budgetary
outcome was above what had been
forecasted, when compared to the previous
year, there has been some improvement,
even though it was marginal. The
outcome is also the third consecutive year
of a reduction in the budget deficit, which
put the government well on course to
achieve a surplus in the next couple of
years. The fiscal balance for the year 2001
amounted to a shortfall of R340 million,
which was R1.8 million or 0.5 per cent
below last year’s outcome. The outcome
was 9.3 per cent of the estimated GDP for
2001.
Balance of Payments
The year 2001 saw a deterioration in the
external position of Seychelles as
indicated by the Balance of Payments
(BOP) estimates for the year. Following
the significant improvement in the external
sector in 2000, the widened gap between
domestic demand and supply as indicated
by the overall balance moved from a
surplus of R108 million in 2000 to a
deficit of R101 million in the year under
review. It was the higher growth in the
deficit in the current account over the
expansion in the capital and financial
account, which caused the overall outflow
of hard currency.
The worsening of the current account is
explained by a one-off transaction under
the Balance of Trade account. During the
year under review, the national airline, Air
Seychelles increased its fleet by replacing
one of its Boeing 767-200 aircraft with
another one of 767-300 in April and took
one 737-700 in November. The April
procurement was under a financial lease
agreement for which the transaction has to
be accounted for in the BOP calculations.
It is for this inclusion that has caused the
deterioration of the current account.
Without this transaction the current
account amounts to a shortfall of only R73
million a decline of R202 million relative
to the previous year.
For the “capital & financial account”, the
net balance amounted to R542 million, for
which a large proportion was accounted
for by net foreign direct investment. Net
FDI flows amounted to R283 million, was
attributable to investment in Seychelles
through equity capital. Equity capital
represents investment mostly in the
tourism industry in the 5-star
establishments.

ANNUAL REPORT 2001 HIGHLIGHTS OF THE SEYCHELLES ECONOMY
- 21 -
Exchange Rates
During the year under review, the Central
Bank made a second revision to its pegged
basket of currencies. The revision was
made to reflect the changes in the two
underlying indicators of the basket,
namely tourism and trade. Secondly, the
change was effected to incorporate the
Euro currencies, the French franc, Italian
lira and German mark into one single euro
weight. This meant that the basket of
currencies reduced from eight to six.
New Foreign Exchange measures in
2001
In June 2001 the government introduced a
set of measures aimed at boosting foreign
exchange earnings and to curb activity in
the parallel market. The crux of the
measures involved the amendment of the
existing foreign exchange laws which
provided for certain class of earners to
accept payment for goods and services
from non-residents in hard currency only
and for these earnings to be routed through
the domestic banking system. To this end,
there has been a general increase in the
amount collected through the system.
Since July 2001, there has been a monthly
average growth of 26 per cent in revenue
collected through the banking system.
The Real Economy
Compared to the year 2000, the early
indications showed that there has been an
increase in output in the major economic
sectors during the year under review. This
has been the result of a combination of
stronger nominal growth and a moderation
in the rate of inflation though the latter
remain relatively high compared to the
previous years. Central Bank estimated
that real growth for the year under review
was 0.9 per cent. Across the economy –
from the primary, secondary and tertiary
sectors – nominal output continued to
expand despite the generally difficult
conditions. Whilst most sectors of the
economy continued to grow, the secondary
and tertiary sectors proved to be the
locomotives of growth during the year
under review.
The pillars in the secondary sector
remained the industrial sector, particularly
manufacturing for which the most
important activities have been tuna
processing (canning) and building and
construction. The tuna-canning factory,
operated by the Indian Ocean Tuna Ltd
(IOT), remained the country’s biggest
manufacturing entity in terms of
employment, output and revenue, with a
workforce of just over 2500 employees
and turnover of R406 million. The latter
was 33 per cent above the amount earned a
year earlier. The company is expected to
continue to perform well in the coming
year through an increase in its output and
revenue through exports of its different
range of tuna products.
In the "building and construction" industry
the ongoing housing projects of the
government, the reclamation and private
investment in new buildings, particularly

ANNUAL REPORT 2001 HIGHLIGHTS OF THE SEYCHELLES ECONOMY
- 22 -
in the town area, have been among key
factors enabling this industry to grow.
Nevertheless, it depends to a significant
extent on foreign exchange to maintain a
stable level of activity.
In relation to the tertiary sector, which
consists mainly of service activities, the
most positive development in 2001 has
been the continued growth of the tourism
industry in terms of its value added,
employment and foreign earnings, as a
service-exporting activity. Tourism
remained the principal service activity in
2001 generating 55 per cent of the
country's foreign exchange earnings. The
industry was not severely affected as
previously thought as the fall in tourism
arrivals stood at only 0.2 per cent
compared to a 30 per cent decline in world
tourism. Prior to the September 11
terrorist attack, the two most notable
indicators of that sector had posted
positive growth. With regards to visitor
arrivals, a growth of 3.0 per cent was
registered for the first nine months in
relation to the same period in 2000.
Likewise the second indicator, tourism
income, posted an increase of 5.4 per cent.
Nevertheless, a new milestone was
attained in 2001, as there was an 8.1 per
cent growth in tourism income through
banks, with inflows rising to a record
R649 million. This increase stemmed
partly from the new foreign exchange laws
that were introduced in June and also the
higher yielded hotels such as Lemuria. As
a result, the average per diem expenditure
increased to R480. With the favourable
outcome, the industry remains optimistic
that there will be a rebound in activity in
2002.
Prices
As noted above, there was a general
moderation in prices in 2001, which gave
an average inflation rate of 6.0 per cent.
This deceleration in the rate of inflation
was mainly attributed to a significant
decline in the prices of fish and to a lesser
extent the prices of local non-fish products
(food & non-food). A growth of 4.7 per
cent was registered in the price of the local
goods index, representing a slowdown,
compared to a 7.2 per cent increase in the
previous year. However, there was an
increase in import prices from 4.4 per cent
in 2000 to 8.4 per cent in the current year
under review. The majority of imported
products are invoiced in US dollars, and
the year 2001 saw a further depreciation of
rupee against the dollar. This explained
partly the general increase in the prices of
imports.
Offshore Developments
During the year, the offshore sector
continued to flourish. Managed by the
Seychelles International Business
Authority (SIBA). Another 1,854 IBCs
were registered with the authority. In
addition, the Authority licensed eleven
new companies to operate within the
Industrial Trade Zone and also registered
the same amount of trusts.

SECTION THREE
Financial Survey
1. Overview
The two monetary aggregates that the
Central Bank monitors more closely are
liquidity and credit growth. In 2000, these
two indicators grew at a much slower pace
and their growth rates were below double
digits. However, during the year under
review, both these aggregates registered an
acceleration in their growth pattern, but it is
worth noting that they remained below
what were recorded in 1999 (Charts 3.1 &
3.2).
During the year under review, the rise in
liquidity was influenced by the movement
in both net foreign assets and domestic
assets. Net foreign assets grew by 2.2 per
cent, whilst domestic assets grew by 11 per
cent. In terms of the movement in credit, it
edged up by 1.0 percentage point relative to
the previous year's growth. The rise in
domestic credit in 2001 was influenced by
both agents in the financial market, namely
commercial banks and Central Bank. Their
debt portfolios increased by 11 per cent.
Loans and advances from the Development
bank however, grew less rapidly due to the
contractions in credits to most economic
sectors, portraying slowing activity in those
small to medium size businesses.
As regards policy, which targets the
financial system, there were a few changes
last year. These changes were related
mostly to two main indicators under the
ambit of the Monetary Authority, both of
the changes taking effect on November 1.
The first one is related to the maximum
lending rate. As of that date, the maximum
lending rate of 10.0 per cent no longer
exists The commercial banks are free to
charge their interest rates on loans based on
their perceived risks, except for loans under
special status. The minimum savings rate
was maintained at 3.0 per cent.
The second indicator that was changed is
the local asset ratio (LAR). This
requirement dictates the amount of
government securities that commercial
banks must hold in their portfolio of assets.
- 23 -

ANNUAL REPORT 2001 FINANCIAL SURVEY
- 24 -
Since September 1998, this ratio stood at 70
per cent. As of November 1, it was reduced
to 50 per cent.
2. Monetary Policy Instruments
Central Banks use monetary policy
instruments to meet certain objectives, and
in most cases, the main aim is to attain an
environment of stable and low inflation.
The Central Bank of Seychelles uses such
instruments mostly to achieve a manageable
liquidity level; to manage foreign currency
flows, and to fine-tune interest rates.
2.1 Interest rate floor Interest rates in Seychelles are generally
stable, particularly those that are set by the
monetary authority, namely the minimum
savings rate and the maximum lending rate.
The last time that the Central Bank made
major revisions to the level of those two
respective rates was in 1998. The Central
Bank lowered these rates twice in that year,
which brought the savings rate to 3.0 per
cent and the maximum lending rate to 10.0
per cent.
In 2001, the Central Bank made a revision
to one of those two rates, namely the
maximum lending rate. As of November 1,
the ceiling of 10.0 per cent no longer exist.
The commercial banks are free to set their
own lending rates based on the perceived
risks of the loans. As regards the minimum
statutory savings rate, it remained
unchanged at 3.0 per cent.
2.2 Minimum Reserve Requirement1 One of the statutory requirements on the
commercial banks is the minimum cash
reserve ratio held at the Central Bank. This
ratio, which is the percentage of a commercial bank’s liabilities, remained
unchanged at 2.5 per cent. During the year,
all banks were able to maintain that
directive.
2.3 Local Assets ratio2 The local assets ratio is an instrument that
is used by the Central Bank to influence liquidity at commercial banks. In
September 1998, in a monetary policy
package, which involved a change in
interest rates, the Bank also adjusted the
local asset ratio. It was increased to 70 per cent from 50 per cent. In 2001, in
anticipation of a new government housing
scheme, which would be taken up by the
commercial banks in the coming year, the Central Bank has as of November 1,
reduced this ratio to 50 per cent. During
2001, all commercial banks operating in
Seychelles were able to maintain this ratio.
______________________________ 1 The minimum reserve requirement is a minimum ratio of cash reserves to eligible deposits that commercial banks are required to hold at the Central Bank. The higher is this ratio, the lower is the money multiplier, thus the monetary impact of new injections of liquidity. The minimum reserve requirement was set at 20 per cent on 16 November 1992. As from 15 September 1998, this ratio was lowered to 2.5 per cent (see Section Eight in this report for further details). 2 With effect from 15 September 1998, the local assets ratio was raised from 50 per cent to 70 per cent.

ANNUAL REPORT 2001 FINANCIAL SURVEY
- 25 -
2.4 Central Bank advances to banks3
Commercial banks can from time to time be
in need of short-term liquidity. In order to
meet these shortfalls in liquidity
requirements, the commercial banks have
recourse to the Central Bank short-term
advances against their securities, which is
repayable in fourteen days. In 2001, total
advances to commercial banks fell by R231
million, or 48 per cent relative to the
previous year.
This represents a significant reduction in
the level of advances after attaining a
growth rate of 53 per cent the year before.
This has been the most recent contraction in
advances to banks since 1998. From the
total of R256 million disbursed by the
Central Bank in 2001, R277 million was
repaid over the period, leaving an average
outstanding stock of R4.0 million. The
banks actually repaid all of the advances
taken during the year together with the
outstanding amount of the previous year.
The fall in Central Bank’s advances during
the year under review represents an
improvement in banks’ liquidity position,
which was also indicated by the fall in the
ratio of credits to deposits.
2.5 Open-market operations 4
Open market operations is a monetary tool
used to control the level of liquidity in an
economy. In 2001, a new government bond
was issued and the existing government
stock remained opened for subscription. In
September, the government through the
Central Bank issued a new Treasury bond
with an authorised limit of R450 million.
This bond has a maturity of three years and
carries an interest rate of 7.5 per cent per
annum.
3. Money Supply In 2001, there was an upsurge in liquidity
growth compared to the previous year.
Movements in liquidity as measured by the
changes in the broad money aggregate
M2(p) showed a rise of 11 per cent, after
having reduced significantly by 8.2 per cent
at the end 2000 (Tablet 3.1 & Chart 3.1).
The main influential factor explaining this
acceleration in liquidity growth was due to
a R4.2 million or 2.2 per cent increase in
the country’s net foreign assets in contrast
to the R126 million reduction registered in
the previous year. Domestic assets also
influenced monetary growth during the year
despite expanding at a slower pace than in
2000. In 2001, domestic assets growth
slowed to 11 per cent down from 10 per
cent a year earlier.
________________________________ 3 This is the sole standing facility offered by the Central Bank of Seychelles. Since September 1993, the rate on advances has been set at 50 basis points above the average of the last tender rate, rounded to 1/8 of 1 per cent. 4 Open market operations are purchased/ sales of financial securities by Central Bank in the open economy to regulate the money supply. Such instruments frequently used to mop up excess liquidity. The securities involved can be both short and long term.

ANNUAL REPORT 2001 FINANCIAL SURVEY
- 26 -
Table 3.1 Monetary Survey;1 1996-2001
1996 1997 1998 1999 2000 2001
(R million) Net Foreign Assets 2 93.3 49.9 -87.0 -68.9 -194.6 -190.5 Central Bank (net) 86.7 62.4 -57.9 -51.0 -132.3 -162.6 Commercial banks 6.6 -12.5 -29.1 -17.9 -62.3 -27.8 Domestic Assets 1982.6 2291.7 2998.5 3442.7 3864.3 4280.9 Claims on private sector 314.6 387.6 460.0 503.4 565.6 643.5 Claims on parastatals 75.9 71.8 55.9 42.6 20.2 10.8 Claims on government (net) 1592.1 1832.4 2482.7 2896.7 3278.5 3626.6 Total Assets 2075.9 2341.6 2911.5 3373.8 3669.7 4090.4 Money Supply, M2(p) 1847.6 2205.9 2567.8 3056.9 3306.5 3682.5 Money Supply, M2 1530.5 1987.8 2389.5 2908.9 3174.2 3554.8 Money, M1 473.8 648.7 780.6 1071.2 1137.5 1290.6 Currency with public 163.9 192.2 206.4 247.9 264.4 279.9 Demand deposits 309.9 456.5 574.2 823.3 873.1 1010.7 (of which parastatals) 80.1 117.8 124.5 174.4 182.7 232.7 Quasi-money 1056.7 1339.2 1608.9 1837.7 2036.7 2264.2 Time deposits 699.5 926.6 1123.9 1253.6 1394.6 1540.0 (of which parastatals) 60.8 107.0 119.0 126.5 177.5 183.9 Savings deposits 357.3 412.5 484.9 584.1 642.7 724.2 Pipeline deposits 317.1 218.0 178.3 148.0 132.3 127.7 Other items, net 228.3 135.7 343.7 316.9 363.2 407.9 Figures do not necessarily add up due to rounding. 1 End-of-period data. 2 Excludes government balances abroad.
With the exception of pipeline deposits that
contracted due to continuous clearing, all
the other components of the money supply
registered growth. M1, which comprises of
"currency with the public" and "demand
deposits", picked up pace and grew by 14
per cent compared to 6.2 per cent in 2000.
The movement in M1 was related to the
significant increase in demand deposits,
which expanded by 16 per cent, compared
to 6.0 per cent in the previous year. The
expansion in demand deposits was itself
influenced by that of the private sector,
which accounted for 77 per cent of total
demand deposits. Private sector’s demand
deposits rose by R88 million or 13 per cent
compared to the previous year.
However, for the second consecutive year,
a slower growth rate of cash with the public
was recorded. At the end of 2001,
"currency with the public" grew by 5.9 per

ANNUAL REPORT 2001 FINANCIAL SURVEY
- 27 -
cent compared to 6.7 per cent in the
previous year. This reduction might be an
indication that economic agents are using
more the facility of e-money with the
increasing outlets accepting debit cards as a
means of payment.
The M2 definition of money, which is M1
plus quasi-money, increased by 12 per cent
compared to 9.1 per cent in 2000. The
growth in M2 was due to an 11 per cent
expansion in quasi-money, triggered by the
growth in savings deposits, which increased
by 13 per cent compared to 10 per cent in
the preceding year. Nevertheless, time
deposits, the major component of quasi-
money, grew less rapidly, expanding by 11
per cent, which was about the same pace of
growth than in the previous year and its
ratio to quasi-money has remained fairly
stable.
Chart 3.1. Growth rates of the money supply aggregates for 1996 to 2001
-40.0-30.0-20.0-10.0
0.010.020.030.040.050.0
1996 1997 1998 1999 2000 2001
Years
Per
cen
t
M2(p) M2 M1 Pipeline deposits
4. Net Foreign Assets
During 2001, there was a slight
improvement in the position of the
country's net foreign assets compared to the
previous year. Although it remained
negative, at the end of the year, the
country’s net foreign assets was negative
R191 million, compared to negative R195
million in 2000. This represented an
improvement of R4.2 million or 2.1 per
cent compared to the preceding year.
The positive movement in the net foreign
assets was due to the relatively significant
improvement in foreign reserves held by
the commercial banks, while that of the

ANNUAL REPORT 2001 FINANCIAL SURVEY
- 28 -
Central Bank’s declined. Commercial
banks’ net foreign assets bettered from
negative R62 million in 2000 to negative
R28 million in 2001, representing an
improvement of R35 million, or 55 per
cent. The Central Bank’s foreign reserve
however, dropped by R30 million, or 23 per
cent over the same period. Consequently,
its net foreign assets fell from negative
R132 million, to negative R163 million.
5. Domestic Credit
5.1 Central Bank and commercial
banks’ credit
Domestic credit has been one of the
primary factors affecting monetary growth
in the Seychelles economy. Therefore,
limiting its growth generally is a step in
containing the liquidity overhang.
The government succeeded in reducing the
pace of credit growth to 10 per cent in
2000, namely through the reduction of its
budget deficit, which thus led to less
recourse to financial resources. In 2001,
total credit in the economy expanded by
R440 million or 11 per cent (Chart 3.2,
Chart 3.3 & Table 3.2). This growth in the
year under review continued to portray the
relative stability in credit growth over the
past few years as witnessed in Chart 3.2.
The credit expansion in 2001 was due to the
increase in both commercial banks’ and
Central Bank’s lending, which grew by 11
per cent.
Chart 3.2. Growth rates of credit of the banking system - 1996 to 2001
-50.0
0.0
50.0
100.0
1996
1997
1998
1999
2000
2001
Years
Per
cen
t
Total domestic creditCommercial bank creditCentral Bank - credit
Being the case in recent years, the
government remained the main borrower
from commercial banks, and accounted for
83 per cent of banks’ credit in 2001. This
continued to be in the form of government
security holdings. Nevertheless,
government borrowing from banks grew
less rapidly in 2001, by 50 basis points
below the 11 per cent in the preceding year.

ANNUAL REPORT 2001 FINANCIAL SURVEY
- 29 -
Growth in commercial banks’ credit to the
private sector picked up pace and expanded
by 14 per cent compared to 12 per cent in
2000. Borrowing by the parastatals
continued to decline significantly, and at
the end 2001, it had been reduced
considerably by 47 per cent, (see Table
3.2). Nevertheless, the pace of the
contraction eased when compared to the
former year, and moreover, claims on
parastatals consisted of a mere 0.3 per cent
of commercial banks’ total credit.
Chart 3.3. Growth rates of credit held by the economic agents - 1996 to 2001
-60.0
-40.0
-20.0
0.0
20.0
40.0
60.0
80.0
100.0
120.0
1996 1997 1998 1999 2000 2001
Years
Per
cen
t
Commercial bank - parastatal Commercial bank - private
Commercial bank - government Central Bank - government
Unlike with the commercial banks, lending
by the Central Bank is only to the
government. At the end of 2001, the
increase in government borrowing stood at
11 per cent, compared to 9.2 per cent in
2000. The growth in borrowing by the
government from the Central Bank was
mainly in the form of advances. After
having been significantly reduced by 37 per
cent at the end of the year 2000, Central
Bank’s advances to the government picked
up pace and grew by 19 per cent by the end
of 2001.
The Government remained the largest
borrower in the economy, with the bulk of
its debt portfolio being in the form of
commercial bank claims, primarily in
holdings of securities. At the end of the
year, the government accounted for 86 per
cent of total loans, while the private sector
and the parastatals accounted for 14 per
cent and 0.2 per cent, respectively.

ANNUAL REPORT 2001 FINANCIAL SURVEY
- 30 -
Table 3.2 Credit;1/2 1996-2001
1996 1997 1998 1999 2000 2001
(R million) Total Credit 2139.8 2473.0 3197.6 3712.8 4090.3 4529.9 Commercial banks 1349.4 1546.2 2622.6 3072.7 3391.5 3755.9 Claims on private sector 314.6 387.6 460.0 503.5 565.6 643.5 Claims on parastatals 75.9 71.8 55.9 42.6 20.2 10.8 Claims on government 958.9 1086.9 2106.7 2526.6 2805.7 3101.6 Of which: Dev. Fund Stocks (68.6) (82.0) (89.1) (96.2) (100.7) (139.7) Treasury bonds (308.0) (326.1) (1130.7) (770.6) (903.6) (940.4) Treasury bills (471.9) (608.8) (832.2) (1621.6) (1777.1) (1771.0) Central Bank 790.5 926.8 575.0 640.1 698.8 774.0 Claims on government 790.5 926.8 575.0 640.1 698.8 774.0 Of which: Advances (503.6) (923.2) (469.0) (623.9) (395.8) (472.4) Treasury bonds (23.4) (3.2) (0.05) (0.05) (300.7) (300.7) Treasury bills (259.9) (0.4) (106.0) (16.2) (2.3) (1.0) Figures do not necessarily add up due to rounding. 1 End-of period data. 2 All figures for stocks, bonds and bills are at cost value.
5.2 Sectoral Development of Credit to
Private Sector and Parastatals
A closer look at commercial banks’ credit
to the non-government sector by economic
activities gives an indication of the
distributions of loans in the economy. In
year 2001, a total of R654 million worth of
credit was disbursed to the non-public
sector, compared to R586 million the
previous year.
Gross commercial banks’ loans and
advances therefore picked up pace and
accelerated by 12 per cent compared to 7.3
per cent at the end of the preceding period.
Mixed developments were once again
observed in the distribution of commercial
banks’ credit to the various sectors of the
economy. Loans to the “transportation”
and “wholesale & retail trade” sectors
contracted while those to the remaining
sectors increased. The lower credit
expansion in these two sectors, particularly
the “wholesale & retail trade” sector,
reflects the slowing activity associated with
the persistent foreign exchange shortages
experienced in the first half of the year.

ANNUAL REPORT 2001 FINANCIAL SURVEY
- 31 -
Table 3.3
Commercial Banks – Loans and Advances To Non-Government Sector by Economic Sectors;1 1997-2001
1997 1998 1999 2000 2001 1997 1998 1999 2000 2001 (R million) (per cent) Total Advances 459.3 515.8 546.0 585.8 654.1 100.0 100.0 100.0 100.0 100.0 Agriculture & fishing 26.7 26.6 26.6 11.6 13.9 5.8 5.2 4.9 2.0 2.1 Of which: Refinance scheme 18.8 18.3 18.8 3.1 1.5 4.1 3.5 3.4 0.5 0.2 Manufacturing 9.0 33.8 3.4 4.8 6.1 2.0 6.6 0.6 0.8 0.9 Of which: Refinance scheme 7.0 29.0 0.0 0.0 0.0 1.5 5.6 0.0 0.0 0.0 Construction 15.8 22.9 20.6 29.8 30.3 3.3 3.4 4.4 3.8 4.6 Transportation 14.6 8.6 4.8 4.7 4.5 3.2 1.7 0.9 0.8 0.7 Tourist facilities 82.2 75.1 87.4 107.7 140.8 17.9 14.6 16.0 18.4 21.5 Wholesale & Retail trade
64.0 58.8 51.3 38.7 37.7 13.9 11.4 9.4 6.6 5.8
Other businesses 69.8 81.9 104.6 99.5 102.7 15.2 15.9 19.2 17.0 15.7 Private households & Non-profit organisations 177.3 208.2 247.3 288.9 318.0 38.6 40.4 45.3 49.3 48.6 Of which Mortgage loans 93.0 80.5 114.2 156.6 177.4 20.2 15.6 20.9 26.7 27.1 Figures do not necessarily add up due to rounding. 1 End-of-period data.
The most significant decrease in credit was
to the “transportation” sector, which
contracted by 5.4 per cent, reducing the
share of credit to that sector slightly by 10
basis points to 0.7 per cent. Loans and
advances to the “wholesale & retail trade”
sector however, continued to shrink and fell
by 2.6 per cent, bringing its share of total
credit down from 6.6 per cent to 5.8 per
cent.
The most notably increase was observed in
credit granted to the “tourist facilities”
sector, to which loans and advances
expanded by 31 per cent in comparison to
23 per cent the previous year. The sector’s
share of total loans and advances was
increased from 18 per cent to 22 per cent.
The next major increase in credit was
experienced by the “manufacturing” sector.
Loans and advances to that sector expanded
by 27 per cent compared to the preceding
year. Nevertheless, this represents a slower
pace of growth compared to 42 per cent
recorded in the previous year and, in
addition, credit to that sector accounted for
only 0.9 per cent of commercial banks’
total loans and advances.
Loans and advances to the “private
household and non-profit organisations”
sector, which accounted for the majority of
commercial banks’ credit, increased by R29
million or 10 per cent. This however was
less rapid growth compared to the 17 per
cent recorded at the end of the previous
year.

ANNUAL REPORT 2001 FINANCIAL SURVEY
- 32 -
5.3 Development Bank’s Credit5
The Development Bank of Seychelles
(DBS) caters for the implementation of
economically sound, financially viable and
productive projects, which are mainly
undertaken by small to medium sized
enterprises. Since these enterprises would
not necessarily receive advances from the
commercial banks because of the risks
involved, DBS offers an alternative and
cheaper avenue for financial sources. This
is advantageous to these enterprises because
DBS normally lends for a longer duration
than commercial banks. The development
bank invests in industry-promoting sectors
such as agriculture, fishing, tourism,
industries, as well as other sectors as shown
in Table 3.4.
Table 3.4
Loans by Development Bank by Economic Sectors;* 1997-2001 1997 1998 1999 2000 2001 1997 1998 1999 2000 2001 (R million) (per cent) Total Advances 196.0 209.2 205.3 223.3 230.8 100.0 100.0 100.0 100.0 100.0 Agriculture 6.4 7.3 6.8 6.2 5.1 3.2 3.5 3.3 2.8 2.2 Fishing 21.7 23.9 9.5 21.2 18.8 11.1 11.4 4.6 9.5 8.1 Industry 27.1 25.5 20.5 18.2 15.6 13.8 12.2 10.0 8.1 6.7 Tourism 103.8 99.4 98.0 89.9 103.8 52.9 47.5 47.7 40.3 45.0 Other services 37.2 53.1 70.5 87.8 87.6 18.9 25.4 34.4 39.3 37.9 Figures do not necessarily add up due to rounding. End-of-period data.
From the Table 3.4, it can be observed that
at the end the year 2001, total DBS’s
advances increased by R7.5 million or 3.4
per cent, compared to the previous year.
However, this expansion in credit was due
to the increase in borrowings by the
“tourism” sector only, which expanded by
R14 million, or 15 per cent compared to the
preceding year, while loans to all the
remaining sectors contracted.
With the exception of loans to the “other
services” sector, the contraction recorded in
DBS’s credit by economic sector was above
10 per cent in all cases. The most
significant decrease was in the “agriculture”
sector, to which credit fell by 18 per cent at
the end of 2001, compared to the previous
year. Nevertheless, as can be seen from the
pie chart 3.4, agriculture continued to
account for the least percentage of DBS’
total advances – 2.2 per cent. Nonetheless,
it can be observed that during the year, in
most of the small to medium sized
enterprises, activity slowed significantly in
the majority of economic sectors.
________________________________ 5 From 17 January 1994, the Development Bank of Seychelles provided credit to Seychellois investors at concessionary rate of 12 per cent per annum. To qualify as ‘Seychellios’, Seychellois nationals must own at least 50 per cent of the investment. The minimum contribution for the investor was raised to 25 per cent from 15 per cent at the same occasion. The Development Bank does not provide credit for purposes of working capital. Previously it had lend at 12 per cent per annum for loans in excess of R50,000, rates varied between 9 per cent and 11 per cent depending on economic sector. This rule had been implemented on 17 July 1991.

ANNUAL REPORT 2001 FINANCIAL SURVEY
- 33 -
As has been the case in recent years, the
“tourism” sector remained the dominant
sector in terms of borrowing from DBS,
and in year 2001, it accounted for 45 per
cent of the bank’s total advances.
Chart 3.4. DBS Loans and Advances by Economic Sectors, 2001 Agriculture
2%
Fishing 8%
Industry7%
Tourism45%
Other Services38%
6. Commercial Bank’s Liquidity
During the year 2001, both commercial
banks’ credits and deposits increased in
comparison to the previous year. The
growth in credit was achieved by 11 per
cent, while the expansion in deposits over
the same period was by 13 per cent. At the
end of 2001, the credit to deposit ratio of
commercial banks contracted compared to
the preceding year. After increasing
slightly from 107.3 per cent in 1999 to
108.9 per cent the year after, in 2001, the
figure fell to 107.2 per cent, to about the
same level attained in 1999. The decrease
in the credit/deposit ratio signified the
improvement in the liquidity position of
commercial banks, which was also reflected
in the reduction in Central Bank’s advances
taken by banks during the year. As shown
in Chart 3.5, there were fluctuations in the
credit/deposit ratio, but the overall trend
was downwards. Chart 3.6 shows the
movement in credit and deposits on a
monthly basis during the year.

ANNUAL REPORT 2001 FINANCIAL SURVEY
- 34 -
Table 3.5 Liquidity Indicators of Commercial Banks;1 1996-2001
1996 1997 1998 1999 2000 2001
(R million) Credit 1181.4 1546.2 2622.6 3072.7 3391.5 3755.9 Deposits 1311.5 1958.9 2364.0 2864.5 3114.3 3505.1
(per cent) Credit-deposit ratio 90.1 78.9 110.9 107.3 108.9 107.2 Figures do not necessarily add up due to rounding. 1 End-of-period data.
7. Interest rates
As stated earlier, during 2001, the
minimum savings’ rate remained at 3.0 per
cent per annum, while as of November 1,
there was no maximum lending rate. There
was however, no movement in the yield on
government treasury bills, as all three bills
(91-day, 182-day and 365-day) continued to
be issued on tap.
With the exception of interest rates on time
deposits above twelve months, yields on all
other time deposits improved compared to
the previous year. The biggest increase was
by 220 basis points on deposits above three
months to six months, while interest rates
on deposits above six months to a year
grew by a mere 2 basis points. The
decrease in the weighted average interest
rates on deposits above twelve months
maturity was by 42 basis points to 4.72 per
cent.
Chart 3.5. The movement in Credit/Deposit Ratio in 2001
102.0103.0104.0105.0106.0107.0108.0109.0110.0
Jan
Mar
May Ju
l
Sep
Nov
Months
Cre
dit/
dep
osi
t ra
tio
Chart 3.6. The movement in the commercial credit and deposits in 2001
-2.0
-1.0
0.0
1.0
2.0
3.0
Jan
Mar
May Ju
l
Sep
Nov
Months
Per
cent
age
Growth in Credit Growth in deposits

ANNUAL REPORT 2001 FINANCIAL SURVEY
- 35 -
Since there was a change in the policy in
relation to the interest rates ceiling, this was
expected to have an effect on the average
lending rates. However, as the change took
effect on November 1, and the growth in
credit was fairly stable towards the end of
the period, this did not have a major
influence on the average lending rate during
the year. Furthermore, given that some
loans were taken prior to the change in
policy, the volume-weighted average
lending rate in 2001 was fairly stable at
11.1 per cent, when compared to the 11.5
per cent figure for the year 2000.
Table 3.6 Interest Rates;1 1996-2001
1996 1997 1 9 9 8 1999 2000 2001 Jan-Sep Oct-Dec
(per cent) Volume-weighted average deposit rates: Savings rate 8.00 8.00 7.11 3.00 3.00 3.00 3.00 Time deposits 7 days 8.36 7.86 7.11 2.75 2.93 2.79 2.89 > 7 days < 3 months 9.90 9.20 8.03 6.03 5.13 4.77 4.92 > 3 months < 6 months 9.44 9.11 8.77 6.94 4.71 4.76 4.98 > 6 months < 12 months 10.50 9.91 9.31 7.64 5.05 4.29 4.31 > 12 months 11.30 8.46 7.18 5.23 5.13 5.14 4.72 Volume-weighted Average lending rate 16.21 14.88 14.88 12.92 12.01 11.45 11.14 91-day treasury bill rate 11.33 10.50 10.50 4.50 4.50 4.50 4.50 1 Averages of quarterly data, compiled on an end-of-period basis, whereas that of the 91-day bill rate is the average of monthly data, compiled on an end-of-period basis.

SECTION FOUR
Government Finance
1. Overview
The process of fiscal adjustment, which
was set in a momentous drive in 1999
continued to be a focal point of the
government’s macroeconomic policy for
the year 2001. Though the budgetary
outcome exceeded the forecasted figures
when compared to the previous year, there
has been some improvement, albeit
marginal. The outcome is also the third
consecutive year of a reduction in the
budget deficit, which put the government
well on course to achieve a surplus in the
next couple of years. As shown below in
Chart 4.1 and Table 4.1, the fiscal balance
for the year 2001 amounted to a shortfall
of R340 million, which was R1.8 million
or 0.5 per cent below last year’s outcome.
In relation to the revised budgeted target,
the outcome was above by R75 million or
28 per cent.
Chart 4.1. Government finance outcomes for 1998 to 2001
-1000-500
0500
1000150020002500
1998 1999 2000 2001
Years
R m
illio
n
Overall balance Total Receipts Total outlays
- 36 -

ANNUAL REPORT 2001 GOVERNMENT FINANCE
- 37 -
Table 4.1
Government Budget; 1999- 2002 Summary
1999 1999 2000 2000 2001 2001 2002 Revised Revised Revised Budget Actual1 Budget Actual1 Budget Actual1 Budget
(R million)
Total Receipts 1484 1440 1528 1333 1405 1289 1516 Current receipts 1400 1400 1477 1283 1389 1275 1488 Of which: Trades tax [602] [577] [591] [578] [610] [596] [604] Transfers from Social Security [125] [77] [80] [80] [95] [105] [110] Business/income tax [182] [223] [205] [244] [219] [228] [240] Grants 84 41 51 50 16 14 28 Total Outlays 1822 1788 1947 1675 1670 1630 1765 Current outlays 1314 1352 1440 1358 1488 1421 1625 Appropriation items 1060 1019 1149 1083 1244 1139 1306 Of which: Ministries/departments [731] [705] [735] [712] [731] [735] [757] Social Security contributions [119] [119] [119] [119] [125] [125] [131] Current outlays to parastatals [32] [32] [33] [35] [72] [46] [101] Charges 254 333 291 274 243 282 319 Of which: Interest payments [243] [322] [280] [263] [231] [265] [307] Capital outlays 457 402 461 463 263 197 219 Net lending 52 33 46 -145 -80 12 -80 Of which: Parastatals [22] [7] [17] [-47] [-80] [16] [-80] Primary Balance2 -95 -26 -139 -79 -34 -75 -59 Overall Balance -338 -348 -419 -342 -265 -340 -248 Financing 338 348 419 342 265 340 248 Foreign loans (net) 47 -65 208 461 92 -62 552 Domestic loans (net) 271 447 210 9 173 429 -304 Cash movements 20 -34 0 -127 0 -27 0 Memorandum Items: Amortisation of loans 849 876 390 645 679 780 526
Foreign loans 91 100 112 40 90 220 306 Domestic loans 758 776 278 604 589 560 219 Figures do not necessarily add up due to rounding. 1 These series are subject to audit and might be revised accordingly. 2 The primary balance is obtained by excluding interest payments from the overall balance. Source: Ministry of Finance

ANNUAL REPORT 2001 GOVERNMENT FINANCE
- 38 -
The R340 million deficit was the result of
expenditure, which amounted to R1,630
million, exceeding revenue, which totalled
R1,289 million. However, it was the
shortfall in receipts that was the
determining factor in explaining the
overall outcome as spending came in
below to the budgeted target. Total
receipts were R116 million below
expectations, which completely
outweighed the savings in expenditure.
The lower inflow for revenue was due to
both of its components, namely current
receipts and grants. Current receipts came
in at R114 million below target, whilst
grants were marginally lower by R1.8
million. The reduction in spending on the
other hand was mainly due to two of its
main headings – current and capital
outlays – which were below their targeted
levels by R67 million and R66 million
respectively.
The only overrun was in net lending,
where instead of a net repayment of R80
million, the government made a net
lending of R12 million. One of the main
reasons why the net repayment did not
materialised during the year was because
the government did not implement its
proposed “home ownership scheme”.
The main source of budget financing came
from the domestic market. Domestic
borrowing amounted to R429 million on a
net basis whilst the government made a net
repayment on its stock of foreign debt by
R62 million. The remaining balance was
made up for by an increase of R27 million
in government’s cash balances, which is
mainly held with the Central Bank.
Compared with the previous year, the
shortfall in receipts over outlays narrowed
by R1.8 million. The decline though
marginal was due primarily to a cutback in
government expenditure as receipts were
lowered than in the previous year.
Provisional government finance data
shows that there was an abatement of R45
million in total spending compared to the
2000 level, mainly on account of capital
expenditure. Contrary to the positive
developments on the expenditure side,
revenue declined by R43 million. This
reduction was the result of lower revenue
flows in both current and grant receipts.
There were nonetheless, improved
performances in certain categories of
current revenue, most notably in the
collection of transfers from Social Security
Fund, trades tax and fishing licence fees,
which exceeded their 2000 aggregate
levels by R25 million, R18 million and
R12 million respectively.
As mentioned above, the reduction in the
deficit in the year under review was
marginal, but it is gradually being reduced
to a more sustainable level. The year
2001 is the third consecutive fiscal year
whereby the government has been able to

ANNUAL REPORT 2001 GOVERNMENT FINANCE
- 39 -
maintain this reduction and this shows the
strong government’s commitment in
reducing the shortfall further and thus
achieving a surplus. It is imperative
therefore, that the other ministries and
government agencies continue to give full
support to the Ministry of Finance in its
endeavour to bring down the deficit to a
more sustainable level.
2. Revenue
Total government revenue amounted to
R1,289 million, which was R116 million
or 8.2 below forecast (Table 4.2). The fall
in receipts was due to current receipts and
grants. Nevertheless, the current receipts
explained most of the decline, which stood
at 98 per cent. At the outset, the fall in
current revenue was mainly attributable to
lower inflows from “dividends &
interests” and “miscellaneous receipts”,
which together accounted for the bulk of
the shortfall. Grant receipts, which consist
mainly of capital project grants, came in at
R14 million, only R1.8 million below
budget.
Trades tax remained the primary source of
current income in 2001, totalling R596
million. “Income and business tax” also
continued to account for an important
share of total income, as did
“administrative fees & charges” and
“transfers from Social Security Fund”.
Through these channels, the government
collected R228 million, R132 million and
R105 million respectively. The evolution
of the importance of these flows is shown
below in Chart 4.2. It can be seen that the
contribution of “transfers from Social
Security Fund” and “administrative fees &
charges” increased during the year when
compared to the past three years.
Chart 4.2. Major revenue flows in current receipts in 1998 to 2001
0.0
200.0
400.0
600.0
800.0
1000.0
1200.0
1400.0
1998 1999 2000 2001
R m
illio
n
Transfers from SSF Trades Tax Income / business tax
Fees and Fines Administration fees & charges Dividends and Interest

ANNUAL REPORT 2001 GOVERNMENT FINANCE
- 40 -
Whilst trades tax continued to account for
the largest share of fiscal revenue, the
amount collected fell R14 million short of
the budgeted R610 million. This shortfall
was attributable to inflows from trades tax
on locally manufactured goods and import
duties, though trades tax on services also
fell short of budget. At R172 million tax
on locally manufactured goods represented
a shortfall of R7.6 million whilst import
duties fell by R4.9 million. Tax on
services fell marginally by R1.2 million.
Notwithstanding the overall shortfall,
trades tax collection for 2001 exceeded the
2000 level by R18 million. This was
mainly explained by the increase in trades
tax revenue on “miscellaneous
manufactured articles”. Tax collected on
this group of goods amounted to R30
million compared to R9.0 million in the
previous year.
Table 4.2
Government Budget; 1999-2002 Revenue
1999 1999 2000 2000 2001 2001 2002 Revised Revised Revised Budget Actual1 Budget Actual1 Budget Actual1 Budget
(R million)
Total Receipts 1484 1440 1528 1333 1405 1289 1516 Current receipts 1400 1400 1477 1283 1389 1275 1488 Transfers from social security fund 125 77 80 80 95 105 110 Trades tax 602 577 591 578 610 596 604 Income/business tax 182 223 205 244 219 228 240 Other indirect taxes 54 52 41 44 41 41 45 Fees and fines 81 93 87 84 96 89 97 Administration fees and Charges
126
123
126
126
126
132
130
Rent and royalties 13 13 12 15 12 14 18 Income – public service 10 10 10 9 10 8 10 Dividends and interest 160 190 144 58 102 26 122 Reimbursements 45 32 26 38 36 33 40 Miscellaneous 2 11 156 5 42 3 72 Grants 84 41 51 50 16 14 28 Figures do not necessarily add up due to rounding. 1 These series are subject to audit and might be revised accordingly. Source: Ministry of Finance

ANNUAL REPORT 2001 GOVERNMENT FINANCE
- 41 -
Contrary to trades tax, “income & business
tax” was R9.2 million or 4.2 per cent
above the targeted R219 million. The
higher amount collected relative to budget
owed largely to the corporate sector for
which the government received the bulk of
the revenue. However, compared to last
year, there was a decline in the revenue
from this heading. In 2000, the
government gained R244 million in
“income & business tax”, which
represented a fall of R16 million when
compared with this year’s outcome. This
was because there was a reduction of R18
million in business tax revenue received
from companies, which outweighed the
increases in the other headings of business
tax.
“Administrative fees & charges” collected
in 2001 totalled R132 million, surpassing
the forecasted level by R5.8 million or 4.6
per cent. This occurred largely on account
of higher inflows from “fees and charges”
levied by the Ministries of Health and
Tourism & Transport. For the Ministry of
Health, the higher revenue earned was in
respect of medical fees for which the
government collected an amount of R3.1
million compared to the budgeted R1.7
million. For the Ministry of Tourism &
Transport, the government gained
increased revenue through “airline
passenger fees” and “air navigation fees”.
These headings recorded inflows of R43
million and R17 million. These outcomes
were above their respective targets by
R7.8 million and R1.2 million. Compared
to last year, as shown above in Chart 4.2,
“administrative fees & charges” increased
in the current year under review. This
revenue item has risen by R5.7 million
above the aggregate of 2000.
After falling short of budget in 1998 and
1999 and being on target in 2000, there
was a higher than anticipated inflow in the
year under review for “transfers from
Social Security Fund". Against a
budgeted revenue of R95 million, the
government received a total of R105
million, representing an increase of R10
million or 11 per cent. The increase in this
revenue flow represents to some extent the
increase in salaries in the public sector,
which came into effect in June. This
year’s outcome is also an improvement
over last year’s aggregate total for
“transfers from Social Security Fund”. It
rose by R25 million, which has thus
increased the share of this revenue item in
total current revenue. From 6.2 per cent in
2000, it rose to 8.2 per cent in the year
under review (see Chart 4.2 above).
As noted above, it was the shortfalls in
“dividends & interests” and
“miscellaneous receipts” that caused total
current revenue to fall short of the target.
“Dividends & interests” fell by R77
million and “miscellaneous receipts” fell
by R39 million, which together make up
for the bulk of the decline in current
revenue relative to budget. The factor that

ANNUAL REPORT 2001 GOVERNMENT FINANCE
- 42 -
caused the decline in “dividends &
interests” was lower revenue on
government’s investment, which came in
at R25 million compared to a target of
R101 million. The lower than budgeted
revenue was because flows from the
Seychelles Marketing Board (SMB),
Seychelles Petroleum (SEPEC) and State
Assurance Corporation (SACOS) did not
materialised as anticipated. For
“miscellaneous receipts”, the reduced
revenue compared to budget was due
entirely to the “sales of assets” related to
the “homeownership scheme”, which the
government should have collected R40
million. With the scheme not being
implemented during the year, this revenue
was not received. Compared to last year,
these two headings of current revenue
continued to decline, this time by R32
million for “dividends & interests” and
R2.6 million for “miscellaneous receipts”.
For “dividends & interests”, it meant that
its share in total current revenue became
smaller, standing at 2.0 per cent compared
to 4.5 per cent a year earlier and 13 per
cent in 1998 and 1999 (see Chart 4.2
above).
Relative to 2000, total revenue (current
receipts plus grants) declined by R43
million to amount R1,289 million. This
reduction stemmed primarily from a R36
million and R32 million decline in
“grants” and “dividends & interests” and
to some extent a R16 million fall in
“income & business tax”. Despite these
shortfalls, there were some notable
increases. These were in terms of inflows
from “transfers from Social Security Fund,
“trades tax” and “administrative fees &
charges”. They exceeded the 2000
aggregate level by R25 million, R18
million and R5.7 million respectively.
This has also meant that their respective
shares in total revenue have also increased
over the four-year period of 1998 to 2001.
These changes can be observed in Chart
4.2 above and the respective shares over
the period are shown in the table below.
1998 1999 2000 2001
Shares in total revenue (in %)
Transfers from SSF 4.9 5.4 6.0 8.1
Trades tax 43 40 43 46
Administrative fees
& charges 7.3 8.5 9.5 10

ANNUAL REPORT 2001 GOVERNMENT FINANCE
- 43 -
3. Expenditure
The government’s efforts to curtail the
growth in expenditure have been a success
as is witnessed through the continuous
reduction in total spending since 1999
(Chart 4.1, Chart 4.3, & Table 4.3). For
2001, government overall expenses
amounted to R1,630 million and this
represented a saving of R41 million or 2.4
per cent relative to the budgeted target of
R1,670 million. It was savings in current
and capital expenditures that explained
this favourable performance. However,
spending in relation to net lending was less
encouraging. Compared to a targeted net
repayment of R80 million, the government
made a net lending of R12 million.
3.1 Current outlays
As mentioned above, current spending was
one of the headings of expenditure that
came in below budget. It amounted to
R1,421 million, which was 4.5 per cent
below expectations (Table 4.3). This
stemmed primarily from lower than
expected payments under the subheading
of “appropriation items”, which declined
by R105 million or 8.5 per cent relative to
the revised budget. The main
appropriation items that explained the
reduced spending was “centralised
payments” and “current outlays on
parastatals”, which were below their
respective budgets by R81 million and
R26 million.
However, despite the overall savings in
current outlays, there were instances of
excess spending, the main heading being
that of “charges” and to some extent
-2000
200400600800
1000120014001600
R m
illio
n
1998
1999
2000
2001
Chart 4.3. Government expenditure by main headings; 1998 to 2001
Current Capital Net lending

ANNUAL REPORT 2001 GOVERNMENT FINANCE
- 44 -
expenditure by “ministries &
departments”. For “charges”, there was an
overrun of R39 million, which was
explained by higher than expected
“interest payments” and also “salaries of
constitutional appointees”. They were
above their budgets by R34 million and
R4.6 million respectively. In terms of
“interest payments”, the rise in interest
paid compared to budget is explained by
the higher level of foreign loan
amortisation and domestic debt payments
during the year. The amount of public
debt interest paid to foreign creditors and
in the domestic market stood at R41
million and R224 million, which were
R7.5 million and R27 million above their
respective budgets. As for “ministries &
departments”, the excess spendings were
minimal at R4.7 million. For the other
main headings of expenditure under
current outlays, spending was below or on
target.
A comparison of current expenditure in
the year under review with that of 2000
reveals that there has been an increased in
this heading of spending in 2001. From
R1,358 million in 2000, aggregate current
expenditure increased to R1,421 million.
This rise of R64 million or 4.7 per cent
was primarily attributable to an increase in
payments in relation “appropriation items”
and “charges”, which rose by R56 million
and R7.9 million respectively. In
“appropriation items”, there were
increases in terms of “ministries &
departments”, “social security
contributions” by government and in
“centralised payments”. They were above
their 2000 levels by R24 million, R6.0
million and R17 million respectively.
3.2 Capital outlays
The most influential factor, which has
determined the overall outcome on total
expenditure in the year under review, has
been capital spending. Compared to a
budgeted expenditure of R263 million, the
government spent only R197 million, a
saving of R66 million or 25 per cent
(Chart 4.3 & Table 4.3). As has been the
norm in recent years, capital projects
accounted for the bulk of spendings under
capital budget. In 2001, a total of R186
million was spent on capital projects,
which represented a saving of R64 million
relative to the budgeted R250 million.
In terms of other capital expenditure items,
there was also a reduction in payments for
land acquisitions, which amounted to R4.6
million against the budgeted R6.5 million.
Development grants made by the
government during 2001 were strictly in
line with the budget, totalling R6.0
million.

ANNUAL REPORT 2001 GOVERNMENT FINANCE
- 45 -
Table 4.3 Government Budget; 1999-2002
Expenditure
1999 1999 2000 2000 2001 2001 2002 Revised Revised Revised
Budget Actual1 Budget Actual1 Budget Actual1 Budget
(R million) Total Budget Outlays 1822 1788 1947 1675 1670 1599 1765 Current Outlays 1314 1352 1440 1358 1488 1421 1625 Appropriation items 1060 1019 1149 1083 1244 1139 1306 Ministries/departments2 731 705 735 712 731 735 757 Tourism & Civil Aviation 51 47 44 42 48 48 72 Education 143 134 139 136 140 144 151 Health 141 141 135 133 137 137 140 Defence 60 61 63 62 60 65 64 Internal Affairs 61 60 66 65 68 69 68 Pension & Gratuities 31 37 44 38 35 36 38 Subventions 81 71 83 81 122 92 152 Regulatory bodies3 49 39 50 46 50 46 51 Parastatals 32 32 33 35 72 46 101 Social Security Contributions 119 119 119 119 125 125 131 Pension Scheme Contributions 7 7 7 7 7 7 7 Other appropriations4 91 81 161 127 225 144 222 Charges 254 333 291 274 243 282 319 Public debt interest 243 322 280 263 231 265 307 Other charges5 11 11 12 12 13 17 11 Total Capital Outlays 457 402 461 463 263 197 219
Development grants to parastatals
10
10
17
58
6
6
13
Land acquisitions 12 7 12 4 7 5 7 Capital projects 435 386 432 401 250 186 200 Net Lending 52 33 46 -145 -80 12 -80 BTL advances – parastatals 22 7 0 -47 -80 16 -80 BTL advances – others 29 26 28 -99 0 -5 0 Capital subscriptions 1 0 1 0 0 0 0 Equity participation 0 0 0 0 0 0 0 Figures do not necessarily add up due to rounding.
1 These series are subject to audit and might be revised accordingly. 2 Due to a reclassification, there is a break in the series of this item. Road and building maintenance, contributions to political parties, and housing improvement grants are examples of items that were recorded under “other current transfers” in previous Reports, but are included in various “ministries/departments” or “other charges” in this Report. 3 Regulatory bodies are Seychelles Licensing Authority, Seychelles Fishing Authority and Seychelles Bureau of Standards. For 1995 Seychelles International Business Authority is also regulatory body. 4 Examples of “other appropriations” are contributions to a training fund and international organisations. 5 “Other charges” consist of : salaries of constitutional appointees; contribution to political parties; and execution of elections. Source: Ministry of Finance
ANNUAL REPORT 2001 GOVERNMENT FINANCE
- 46 -
Compared to the previous year, capital
spending fell by a significant margin of
R266 million. Capital projects and
development grants to parastatals were the
main expenditures that came in below
their 2000 aggregate levels. They were
below their 2000 levels by R215 million
and R52 million respectively. In terms of
compensation for land acquisitions, there
was a slight excess spending of R1.0
million, which was nevertheless
outweighed by the savings of the other
main headings.
3.2.1 Public Sector Capital Project
Expenditure
Capital project expenditure of the
government for the year 2001 reached a
total of R186 million, showing a decline of
R215 million or 53 per cent relative to the
previous year (Table 4.4). In sectoral
terms, the fall in total capital project
expenditure was mainly attributable to
lower spending on “infrastructure and
utilities” and on “services”. They were
below their 2000 levels by R205 million
and R33 million respectively. The only
increase was in the subgroup of “economic
sectors”, which rose by R23 million to
amount of R27 million.
3.2.1.1 Economic Sectors
As noted above, outlays on “economic
sectors” rose by R23 million compared to
the previous year. The increase was
mainly attributable to the large rise in
expenditure on the fishing sector, which
represented spending on the coastal
fisheries development project during the
year. For the other sectors, expenditures
declined in comparison to prior year. This
reflected completion of projects that have
been undertaken.
3.2.1.2 Infrastructure and Utilities
This category of capital spending saw a
major decline in its level compared to the
previous year. It accounted for 95 per cent
of the fall in total capital project
expenditure. Total spending in this
category amounted to only R64 million
compared to R269 million in 2000. The
decline in the level of spending was
explained by all sub-headings with the
exception of expenditure on
“communications”. The “Seychelles
Satellite Project” explained the increase in
the latter. Again the reduced expenditure
under the heading of “infrastructure &
utilities” is explained by the completion of
some of the major projects in 2000,
namely the new Praslin airport, the
highway link on Mahé and the installation
of the new electricity generators at
Providence.

ANNUAL REPORT 2001 GOVERNMENT FINANCE
- 47 -
Table 4.4 Public Sector Capital Project Expenditure
1996 1997 1998 1999 2000 2001
(R thousand) Total 185,023 213,983 390,008 385,561 400,986 185,981 Economic Sectors 19,267 25,941 35,463 15,380 3,930 26,588 Agriculture 4,511 2,991 9,055 9,605 1,112 1,070 Fisheries 1,139 2,195 8,776 522 18 24,980 Tourism 949 2,372 882 2,823 2,674 477 Outer island development 1,882 708 2,500 500 - 0 Craft & home industries 595 1,393 2,515 - - 0 Trade & commerce 10,191 16,283 11,735 1,929 126 62 Infrastructure and Utilities 38,405 67,022 172,018 166,191 268,694 63,608 Transport 6,531 21,988 29,201 53,223 49,267 14,663 Water supply & sanitation 14,331 13,533 60,621 26,394 64,805 1,374 Communications 842 358 1,679 4,657 4,581 6,650 Land Reclamation 1,701 315 45,521 63,738 137,317 32,532 Land Bank 15,000 30,827 34,996 18,179 12,725 8,388 Services 127,351 121,020 182,527 203,990 128,362 95,785 Education 31,861 16,721 40,481 25,440 13,057 18,504 Health 15,575 15,593 14,054 4,190 6,726 9,379 Housing 41,280 41,748 63,377 82,195 58,826 21,725 Social development 17,525 27,102 34,878 15,658 8,934 6,830 Culture 172 197 99 276 908 96 Sports 180 1,567 3,089 2,063 1,915 15,324 Information & media 46 452 918 39,046 4,157 924 Internal affairs 8,456 7,008 9,817 5,012 4,226 677 Public sector management 798 4,972 4,832 9,850 17,910 13,656 Environment 11,458 5,659 10,982 20,259 11,704 8,670 Source: Ministry of Finance
Services
Total capital outlays in respect of
“services” also fell compared to a year
earlier. Total spending in that category
amounted to R96 million, a decline of R33
million. The fall was attributable mainly
to spending on housing. The government
continued to spend money on its social
programme, particularly on housing
projects. The decline reflected the
completion of some of the housing
projects and also the increased
participation of the private sector in
providing for housing development.
In spite of falls in other subheadings of
“services”, there were increases in
“education” and “youth & sports”. The
increase spending on capital expenditure
in “education” was attributable mainly to
the refurbishment of some schools and
also the construction of a new primary
school at Anse Aux Pins.

ANNUAL REPORT 2001 GOVERNMENT FINANCE
- 48 -
3.3 Net Lending
The only heading of government
expenditure that recorded an overrun was
in net lending. Compared to a forecasted
net repayment of R80 million, the
government made a net lending of R12
million. The budgeted outcome was
attributable to one subheading of net
lending, namely advances to parastatals, to
which the government provided advances
worth R16 million over the year. The
excess spending was due to a R20 million
advance made to the Seychelles Housing
Development Corporation (SHDC) for
housing improvement. The net repayment
of R80 million did not materialised due to
the non-realisation of the “home
ownership scheme” as it was expected to
be implemented in 2002. Nevertheless, it
is worth noting that there was a net
repayment of R3.4 million in relation to
“other parastatals” and a R4.8 million in
relation to “advances to other”, which
comprises mainly of advances to civil
servants including motor vehicle and
general purpose loans.
Analysing the 2001 outcome relative to
the previous year, it was observed that net
lending increased during the year. From a
net repayment of R145 million in 2000,
net lending amounted to R12 million in the
current year. The difference between the
two comparative periods is that in 2000,
there were net repayments in the two main
headings, namely “advances to
parastatals” and in “other loans” which are
advances made to public servants.
4. Financing
The R340 million deficit was financed
mainly through the domestic markets as
have been the case in recent years (Chart
4.4). Domestic loans net of repayments,
stood at R429 million. Gross borrowings
totalled R989 million and this consisted
primarily of treasury bonds (R612
million), government deposits (R219
million) and advances (R114 million).
Amortisation amounted to R560 million.
Foreign loan drawdown amounted to R158
million, representing a shortfall of R24
million relative to the budgeted R182
million. With amortisation amounting to
R220 million, the net outcome was a
repayment of R62 million. With net
domestic and foreign loans totalling R367
million, this resulted in a balance of R27
million, which was met by the movement
in cash balances of the government being
held mainly with the Central Bank.

ANNUAL REPORT 2001 GOVERNMENT FINANCE
- 49 -
C h a r t 4 . 4 . S o u r c e o f g o v e r n m e n t b u d g e t f i n a n c i n g ; 1 9 9 8 - 2 0 0 1
- 200
-100
0
1 0 0
2 0 0
3 0 0
4 0 0
5 0 0
6 0 0
7 0 0
1998
1999
2000
2001
R m
illio
n
Net fo re ign loans Net domest ic loans Cash movemen ts

SECTION FIVE
The External sector
1. Overview
On the actual external sector outcome,
provisional data for the transactions
undertaken by the economy with the rest
of the world in 2001 as measured by the
Balance of Payments (BOP) showed that
there has been a worsening outcome
relative to the previous year. Following the
significant improvement in the external
sector in 2000, the widened gap between
domestic demand and supply as indicated
by the overall balance moved from a
surplus of R108 million (US$19 million)
in 2000 to a deficit of R101 million
(US$17 million) in the year under review.
It was the higher growth in the deficit in
the current account over the expansion in
the capital and financial account, which
caused the overall outflow of hard
currency (Chart 5.1 & Table 5.1).
-800
-600
-400
-200
0
200
400
600
SR m
illio
n
1995 1996 1997 1998 1999 2000 2001
Chart 5.1. The overall balance, current account and capital & financial account of the BOP for 1995 to 2001
Current Account Capital & Financial Account Overall Balance
- 50 -

ANNUAL REPORT 2001 THE EXTERNAL SECTOR
- 51 -
The apparent worsening of the current
account position during 2001 was largely
influenced by a one-off transaction in the
“Balance of Trade account". This was
related to the aircraft acquired by Air
Seychelles in April, which was classified
as an import. This procurement by the
national carrier was made under a
financial lease agreement, for which under
the IMF BOP Manual 5 (IMF BOPM5)
guidelines such a transaction should be
included in the BOP calculations (for more
details on the incorporation of financial
lease transaction, see subsection 2.1 ) . If
the financial lease factor is removed, the
current account will remain in deficit, but
it shows a further reduction in the
shortfall, which amounts to only R73
million, hence is a marked improvement
relative to 2000. The other headings in the
current account showed positive
movements as observed under the
accounts of "services", "income", and
"current transfers". The surplus in respect
of services in the year under review was
mainly boosted by the heading of
"transportation". For the income account,
there was a contraction in its shortfall,
while the surplus under current transfers
expanded after falling in the previous year.
On the other hand, there was a reversal of
the decline in the "capital & financial
account" in 2000, where in the year under
review, it increased by R55 million
attributable to both of its accounts. The
"capital account" rose by 10 per cent to
amount R55 million for the year. In terms
of the second account, there was an
increase of R50 million in the financial
account to aggregate at R487 million. The
expansion was attributable to the rise of
R199 million in net direct investment
relative to the previous year. The net
inflow of FDI in the country in 2001 came
principally through new investment in the
form of equity capital and also re-invested
earnings. The flow of FDI is presently
being targeted in the tourism trade where
the high end of the market is being tapped.
The overall external deficit on the overall
balance was financed partly from a R61
million draw-down on reserves with the
balance representing accumulation of
arrears of R40 million.
In 2001, there was also a change in the
laws related to foreign exchange
transactions. At the start of the year, there
continued to be a shortage of hard
currency entering the banking system,
which prompted the government to put
forth a series of measures that will on one
hand increase the number of agents that
accept foreign currency payments for their
services and also to curb the parallel
market activity, thus channelling hard
currency flows into the banking system
(for more details, see Box 5.1 at the end of
this chapter).

ANNUAL REPORT 2001 THE EXTERNAL SECTOR
- 52 -
Table 5.1 Balance of Payments;1/2 1996-2001
1996 1997 1998 1999 2000 2001 Provisional
(R million) CURRENT ACCOUNT -289.9 -334.5 -566.9 -693.8 -247.5 -567.7 Goods, -846.6 -957.1 -1114.4 -1223.1 -625.0 -1005.5 Receipts (of which)
480.4 568.5 646.4 778.2 1112.8 1260.9 Merchandise exports (f.o.b) 315.1 358.7 490.9 596.6 740.8 948.0 Payments (of which) 1327.0 1525.6 1760.8 2001.4 1737.8 2266.4 Merchandise imports (f.o.b) 1238.5 1454.5 1713.2 1931.0 1658.7 2194.0 Service s 580.8 644.5 607.2 636.7 521.6 529.2 Receipts (of which) 1178.2 1285.9 1302.3 1473.9 1538.8 1658.9 Tourism income thru’ Commercial banks 524.5 612.5 583.8 596.2 600.0 648.8 Payments 597.4 641.4 695.1 837.1 1017.2 1129.7 Income -73.6 -62.0 -110.3 -133.0 -185.8 -110.9 Compensation of employees 1.7 -0.7 -7.6 -6.0 -18.7 -17.2 Credit 3.5 1.1 0.6 1.0 1.0 1.0 Debit 1.8 1.8 8.2 7.0 19.7 18.2 Investment income -75.3 -61.3 -102.7 -126.9 -167.1 -93.7 Receipts 49.7 50.0 29.3 47.0 61.1 53.1 Payments 125.0 111..3 132.0 173.9 228.2 146.7 Current transfers 49.5 40.1 50.6 25.5 14.7 19.5 General government GG
79.9 72.3 91.3 62.1 49.5 53.3 Receipts 85.1 75.8 91.6 62.2 50.0 55.4 Fishing license fees 51.1 41.7 32.2 32.8 24.8 37.7 Overseas grants 13.8 10.0 25.3 13.3 18.8 8.5 Educational grants 20.1 24.1 34.1 16.1 6.4 9.3 Payments 5.2 3.5 0.3 0.1 0.5 2.1 Other sectors -30.4 -32.2 -40.7 -36.6 -34.9 -33.8 Receipts 24.4 29.9 19.2 21.1 21.7 23.9 Payments 54.8 62.1 59.9 57.7 56.6 57.7 CAPITAL AND FINANCIAL ACCOUNT 186.5 213.1 453.7 611.1 487.1 542.2 CAPITAL ACCOUNT 28.1 34.0 114.0 88.0 50.0 55.0 FINANCIAL ACCOUNT 158.5 179.1 339.7 523.1 437.1 487.3
Direct investment 126.3 193.0 210.0 246.9 84.0 283.5 Abroad 64.6 75.4 70.0 48.1 60.0 65.0 In Seychelles (of which) 190.9 268.4 280.0 295.0 144.0 348.1 Sale of Assets (Privatised enterprises) 23.1 0.5 0.0 0.0 0.0 0.0 Equity capital 135.2 247.9 260.0 275.0 114.0 313.1 Re-invested earnings 32.6 20.0 20.0 20.0 30.0 35.0 Portfolio investment 33.0 15.3 10.8 2.9 5.4 6.8 Assets -33.1 -0.4 4.1 0.1 0.5 -0.4 Liabilities 0.0 14.8 14.9 3.0 6.0 6.4 Other investment -0.9 -29.2 118.9 273.3 347.7 197.4 Assets 58.6 64.0 29.8 69.3 84.9 51.3 Liabilities 57.7 34.8 148.7 342.6 432.6 248.7 Net errors and omissions 19.3 86.5 44.8 60.7 -104.8 -75.3 OVERALL BALANCE -84.1 -34.9 -68.4 -22.0 107.9 -100.7 Financing of overall balance 84.1 34.9 68.4 22.0 -107.9 100.7 Reserve assets3 24.2 -25.7 11.5 -45.0 -110.9 60.5 Arrears 59.9 60.6 56.9 67.0 3.0 40.3 Memorandum items: Current account (percentage of GDP) -11.9 -9.7 -19.3 -22.0 -7.3 -15.5 Trade Balance (f.o.b) -923.5 -1095.9 -1222.2 -1334.4 -917.9 -1245.9 Stock of Reserves (Gross)(R million) 103.4 129.1 118.2 160.2 271.1 210.6 Stock of Reserves (Gross) (Weeks of cif imports) million)
3.7 3.9 3.1 3.7 7.2 4.2 1 Contrary to the exchange record, this series is recorded on an accrual basis. 2 Data series differ from previous publications due to revisions 3 (-) sign indicates increase in reserves.

ANNUAL REPORT 2001 THE EXTERNAL SECTOR
- 53 -
2. Current account
2.1 Trade in goods
Following the 49 per cent contraction in
the deficit on account of transactions on
goods, which was registered in the
previous year, provisional indicators show
that the year 2001 posted an expansion in
the deficit by R381 million or 61 per cent.
The widening goods deficit was attributed
to a R529 million increase in payments to
R2,266 million, compared to the R264
million or 13 per cent contraction
registered in 2000. The 2001 outcome
was weighed against a 13 per cent rise in
receipts by R148 million to R1,261 million
in contrast to a considerable R335 million
or 43 per cent increase in the previous
year.
It should be noted on the outset that the
apparent worsening of the goods account
was attributable to a one-off transaction
during the year affecting merchandise
trade. In 2001, the national airline
acquired two new aircrafts, the first one a
Boeing 767-300 to replace the 767-200 in
April. The other, a Boeing 737-700 was
received in November. The aircraft was
acquired in April under a financial lease
agreement for which the transaction has
been taken into account both in the goods
account and financial account as outlined
in the IMF BOPM5 for which the Central
Bank is following.
According to the BOPM5, financial leases
or similar arrangements represent a form
of financing akin to a secured loan. It is a
long-term agreement, which gives the
lessee the right to decide on what to do
with the item at the end of the agreement.
The lessee is responsible for operation,
repair and maintenance of the item, and in
this case the aircraft. The lessee also has
the first option on disposal of the item
being leased at the termination of the
agreement. With the latter argument, the
value of the aircraft has been taken into
account both in the goods account as an
import and in the financial account falling
under "other investment" on the liability,
as it states that Air Seychelles has the right
of ownership.
Due to the above, the merchandise trade
balance of the goods account was the one
that was affected by the financial lease
transaction. Without it, the balance on the
goods account though remaining in deficit
showed a decline relative to 2000, falling
by R51 million.
Apart from the widening deficit in respect
of imports and exports (Chart 5.2), the
goods account was influenced also by a
R58 million or 19 per cent contraction in
the surplus under “goods procured in ports
by carriers”, while the deficit in respect of
“repairs on goods” fell from R12 million
to R6.4 million.

ANNUAL REPORT 2001 THE EXTERNAL SECTOR
- 54 -
-1500-1000-500
0500
1000150020002500
SR m
illio
n
1995 1996 1997 1998 1999 2000 2001
Chart 5.2, Trade in Goods, 1995 - 2001
Merchandise Exports Merchandise Imports Merchandise, net
2.1.1 Merchandise exports
Traditionally, Seychelles’ exports have
been mainly from the agricultural and
marine resources sectors, or goods whose
raw materials originated from those
sectors. With the authority’s continual
attention to these areas, the country’s
income from exports has been on the
increasing trend. In 2001, total exports of
merchandise (f.o.b.) stood at R948 million.
This represents growth of R207 million or
28 per cent compared to the previous
year’s 24 per cent rate. With the exception
of exports under “Fresh & Frozen Fish”
and “Frozen Prawns”, which declined, all
other exported items registered growth in
2001.
Table 5.2 Domestic Exports; 1996-2001
1996 1997 1998 1999 2000 2001
(R million) Total 315.1 358.7 490.9 596.6 740.8 948.0 Copra 0.0 0.0 0.0 0.0 0.0 0.3 Cinnamon bark 4.7 3.4 2.7 2.2 1.3 1.3 Frozen and fresh fish 11.2 20.4 13.2 28.3 20.7 10.7 Canned tuna 169.8 286.2 413.3 531.9 606.2 771.2 Shark Fins (Dried) 2.4 0.8 0.2 0.3 .. .. Frozen Prawns 10.9 22.7 34.1 7.7 18.3 12.1 Other exports 116.1 25.2 27.3 26.2 94.3 152.5
Source: Management and Information Systems Division

ANNUAL REPORT 2001 THE EXTERNAL SECTOR
- 55 -
Canned tuna remained the major
component of exports and accounted for
above 81 per cent of total export receipts
(see Chart 5.3). Income received from
exported canned tuna grew by R165
million or 27 per cent to R771 million.
This represents an increase in the pace of
growth compared to the 14 per cent rise in
2000, and reflects the promising exporting
potential of the Indian Ocean Tuna
Canning Factory, following its expansion
in the last couple of years. The company
also remained the country’s biggest
manufacturing entity.
Chart 5.3. Exports, 2001Frozen prawns
1.28%
Cinamon bark0.14%
Frozen and fresh fish
1.13%Other exports
16.1%
Copra0.03%
Canned tuna81.34%
Exports of items under “other exports”
grew by R58 million or 62 per cent to
R153 million. This was on account of the
growth in exports of “other processed
fish” and “other re-exports”, which rose by
R26 million and R28 million respectively.
Items under the former category include
shark’s fins, towards which fishermen’s
preference rose in relation to other catch,
confirmed by the increase in fishing of
sharks.
There was a further contraction in exports
of “Fresh & Frozen Fish”. After declining
by R8 million or 27 per cent in the
previous year, the figure dropped by R10
million to R11 million in 2001. This result
summarises the disappointing performance
in fishing activity in terms of catch.
Statistics from Seychelles Fishing
Authority (SFA) indicated that compared
to the previous year, there was a decline in
catch of fish from artisanal, semi-
industrial for which a portion of their
output is targeted for export. The lower
catch and exports of fresh and frozen fish
reflects, to some extent, fishermen’s
preference for other fishes, under other
categories for reasons such as higher
revenue per catch.

ANNUAL REPORT 2001 THE EXTERNAL SECTOR
- 56 -
Following the pick up in exports of frozen
prawns recorded in 2000, the year 2001
posted a decline, although the movement
was not as dramatic as that of 1999. In
2001, the value dropped by R6.2 million
or 34 per cent to R12 million in contrast to
the R11 million increase registered in the
preceding year. According to SFA, the
drop was mainly due to the lower
production of post larvae by the hatchery
and the problem of obtaining brood stock.
2.1.2 Merchandise imports
In spite of the imposition of import
restrictions and new regulations in regards
to foreign exchange transactions in mid-
2001, the year registered an increase in the
value of merchandise imported (c.i.f.).
Subsequent to the 14 per cent contraction
recorded in 2000, imports grew by R630
million or 32 per cent to R2,581 million in
2001. This growth, however, as explained
above was largely influenced by the
financial lease of the new aircraft to the
Air Seychelles fleet, which pushed up the
figure under “machinery and transport
equipment”. Furthermore, the improved
foreign exchange situations toward the end
of the year encouraged the increase in
imports. Nevertheless, mixed movements
were registered in the value of the items
imported in 2001.
Table 5.3 Imports (cif) – by HS1 Sections; 1996-2001
1996 1997 1998 1999 2000 2001
(R million) Description Total imports 1457.1 1711.2 2015.5 2271.8 1951.4 2581.1 Food and live animals 322.3 416.8 455.9 484.2 517.8 641.3 Beverages & tobacco 23.5 27.5 30.0 29.9 27.1 22.2 Mineral fuels etc. 211.3 252.0 189.5 229.0 423.7 412.7 Chemicals 90.8 125.6 129.1 138.3 128.7 145.0 Manufactured goods & Misc. manufactured articles 352.5 462.9 564.5 714.4 472.9 458.7 Machinery & transport equipment* 415.9 384.7 603.4 638.7 334.0 862.8 Other commodities 40.8 41.7 43.1 37.3 47.3 38.4 1 Harmonised System * Include the value of the Boeing 767-300 acquired by Air Seychelles in April 2001 under a financial lease agreement.
As stated above, the most notable
development was in the increase in
imports under “Machinery and transport
equipment”. Following the 48 per cent
contraction in imports of items under this
category in the previous year, the figure
grew by 158 per cent or R529 million to
R863 million in 2001. Consequently, its
share of total imports was exceptionally
raised to above 33 per cent (see Chart
5.4), in contrast to 17 per cent the previous
year. Excluding the financial lease of the

ANNUAL REPORT 2001 THE EXTERNAL SECTOR
- 57 -
new Boeing by the local airline, which
aggregate the figure by a significant R508
million, imports under “Machinery and
transport equipment” was more or less
normal and have grown by R21 million or
6.3 per cent and in general, remained more
or less in line with its trend. Furthermore,
without this transaction, total imports
would have been raised by only R123
million or 6.3 per cent, influenced by the
improvement in foreign earnings.
Chart 5.4. Imports, 2001
Food, live animals &
vegetable oils25%
Beverages and tobacco
1%
Mineral fuels16%
Machinery and transport
equipment33%
Other commodities
1%
Manufactured goods & misc.
man.18%
Chemicals6%
The next most noticeable growth in
imports was under “food, live animals &
vegetable oils”, which registered a
significant increase in the pace of growth.
From 6.9 per cent in 2000, the figure grew
by 24 per cent in 2001, to end the year at
R641 million. Amid soaring demand on
the local market for those products, this
development was related to the relatively
poorer performance of the domestic
agricultural sector due to the dry season of
2001 in the second half of the year (see
section six). Furthermore, apart from
meeting domestic consumption, movement
in imports of foodstuff reflected the
increase in consumption by tourism-
related establishments, confirmed by the
upsurge in the number of such businesses
in 2001.
The imported value of the other remaining
items posted a lower figure compared to
the previous year. The most noticeable
contraction was registered under imports
of “other commodities” which declined by
R8.9 million or 19 per cent to R38 million.
Imports of “Beverages and tobacco”
contracted further and dropped by R4.8
million or 18 per cent to R22 million.
Other drops were registered in imports of
mineral fuels and manufactured goods,
which declined by 2.6 per cent and 3.0 per
cent respectively. The lower value of

ANNUAL REPORT 2001 THE EXTERNAL SECTOR
- 58 -
imports was likely to be related to the
persistent foreign exchange shortage,
which was more evident in the first half of
the year.
The only increase apart from "machinery
& equipment was the imports of
chemicals. Following the 6.9 per cent
contraction in imports of chemicals the
previous year, in 2001, the total value
expanded by 13 per cent or R16 million to
R145 million.
2.1.3 Goods procured in ports
Subsequent to the significant 167 per cent
rise in the net inflow under “goods
procured in port by carriers” at the end of
2000, the surplus contracted by R58
million to R247 million in 2001. The
movement was on account of the R59
million or 16 per cent reduction in
receipts, weighed against a slight 2.3 per
cent decrease in outflows to R62 million.
The lower receipt was associated with the
decline in re-exports of petroleum
products, which contracted by R60 million
to R297 million and brought its share to 96
per cent of revenue. This fall in oil re-
export revenue is related mainly to the fall
in oil prices in 2001 relative to 2000. Re-
exports of food and beverages declined by
17 per cent to R7 million. Receipts in
respect of other re-exports posted an
increase of R2.5 million to R5.4 million
and represents outflow of nationalised
goods which are repatriated following
completion of various projects during the
year.
With the exception of petroleum products
in respect of Air Seychelles, which rose by
1.6 per cent growth, all the remaining
items under “payments” registered a slight
decline and remained more or less stable.
The rise in the consumption of oil by the
national carrier is related to the increase in
the number of aircraft in its fleet, which at
the end of 2001 was three compared to
two at the end of the previous year.
Table 5.4
Goods procured in Ports; 1996-2001
1996 1997 1998 1999 2000 2001
(R million)
Goods procured in port, net 104.5 148.9 105.1 114.2 304.4 246.8 Receipts 163.6 208.4 152.7 178.8 368.2 309.1 Petrol 151.3 200.1 140.3 169.5 356.8 296.6 Food and beverages 10.5 6.1 6.3 6.9 8.5 7.1 Others 1.8 2.2 6.1 2.4 2.9 5.4 Payments 59.1 59.5 47.7 64.6 63.8 62.3 Petrol 56.9 50.2 42.8 54.6 54.3 53.0 Food and beverages 2.3 9.3 4.8 10.0 9.5 9.3 Source: Management and Information Systems Division

ANNUAL REPORT 2001 THE EXTERNAL SECTOR
- 59 -
2.1.4 Repairs
Whilst repairs of foreign ships and aircraft
in Seychelles remained constant at R3.8
million when compared to the previous
year, payments for repairs on goods
abroad declined by R5 million to R10
million. Consequently, net income on
“repairs” posted a marked improvement,
whereby the shortfall dropped from the
R12 million in 2000 to R6.4 million in
2001. The lower payments for repairs
were associated with the significant 40 per
cent reduction in payments for repairs of
Air Seychelles’ aircraft abroad, which fell
to R9 million. This lower payment was
related to the replacement by Air
Seychelles, of one of its older aircraft with
a new one, towards which prior to
replacement, maintenance costs increased
in the preceding year. With regards to
repairs of Seychelles’ ships abroad,
however, the figure grew by 146 per cent
to R1.4 million, in connection with the
increase in the number of vessels
registered in Seychelles.
2.2 Services
After recording a contraction of R115
million or 18 per cent the preceding year,
the services account balance expanded, by
R7.5 million to R529 million. The
increase was related to the notable upsurge
in the net inflows under “transportation”
and an increase in net surplus under
“government services”, while the
remaining items under other major
headings recorded worsened
performances.
Net inflow under “transportation” was
boosted by the R53 million or 14 per cent
increase in passenger receipts, which
soared to R391 million compared to R340
million the preceding year. This
development was partly associated with
the increase in the number of seats on
offer by the national carrier, Air
Seychelles, following the introduction of
two additional planes to its fleet, and
simultaneously, offering flights to new
destinations. This was marked by the
airline’s R46 million or 12 per cent
increase in ticket sales to non-residents.
However, items under “other
transportation services” registered
worsened performances, whereby the net
inflow declined by R6.5 million to R83
million.
The drop in net inflow under “other
transportation services” was in connection
with the larger fall in receipts relative to
the drop in payments of aircraft landing
fees. Receipts shrunk by R7.7 million to
R115 million, compared to the R3.7
million or 2.9 per cent drop registered the
previous year. The decline in 2001 was as
a result of the fall in all categories of
receipts under “other transportation
services”, with the exception of airport
handling fees, which increased slightly by
2.0 per cent. The most noticeable fall was
registered in income from stevedoring,
which fell by R4.3 million to R45 million.
Payments of aircraft landing fees
contracted by R1.9 million or 5.6 per cent
to R32 million compared to the 18 per cent
decline recorded the previous year.

ANNUAL REPORT 2001 THE EXTERNAL SECTOR
- 60 -
Table 5.5
Services;1 1996-2001 1996 1997 1998 1999 2000 2001
(R million)
SERVICES, NET 580.8 644.5 607.2 636.7 521.6 529.2 Transportation 123.8 122.9 203.0 248.2 323.4 393.9 Passenger 191.9 201.8 312.2 345.0 340.1 390.9 Receipts 238.5 218.0 326.1 381.6 383.9 437.2 Ticket sales to non-residents by Air Seychelles 202.1 188.9 296.9 351.6 371.1 417.0 Others 36.4 29.2 29.2 30.0 12.9 20.2 Payments (tickets to foreign airlines by residents) 16.1 16.3 13.9 36.7 43.8 46.3 Freight -152.2 -156.1 -175.2 -181.6 -150.2 -79.7 Receipts 27.4 45.0 58.1 102.4 138.7 179.5 Payments 179.6 201.1 233.3 284.0 243.9 259.2 Other transportation services 84.0 77.3 66.0 84.8 88.5 82.7 Receipts (of which) 109.7 111.8 93.6 126.4 122.7 115.1 Marine and port charges 21.4 26.5 25.9 27.9 28.3 27.0 Income from stevedoring 42.0 23.0 24.3 53.4 49.2 44.9 Agency service income 14.3 21.1 18.0 16.2 16.0 14.6 Airport handling fees 17.3 13.5 14.0 14.3 15.1 15.4 Aircraft landing fees 14.6 27.7 11.4 14.6 14.2 13.1 Payments of aircraft landing Fees abroad 25.6 34.5 27.7 41.6 34.3 32.4 Travel 558.6 647.8 574.6 611.3 617.7 599.2 Receipts 699.3 787.1 709.0 724.0 761.3 777.4 Tourism earnings 696.0 783.0 703.0 717.9 754.6 770.0 (of which income thru’ Commercial banks) 524.5 612.5 583.8 596.2 600.0 648.8 Others 3.3 4.1 6.0 6.1 6.7 7.4 Payments 140.6 139.3 134.3 112.7 143.6 178.3 Foreign travel expenditure 113.4 115.0 98.0 95.0 118.9 139.8 Training of residents abroad 27.2 24.3 36.3 17.7 24.7 30.8 Others 0.0 0.0 0.0 0.0 0.0 0.0 Insurance, net -33.3 -37.1 -49.1 -18.3 -19.1 -11.7
Royalty payments -3.1 -3.0 -2.0 -2.5 -2.5 -2.5 Financial and Business Services -106.4 -119.3 -140.5 -147.1 -252.2 -297.4
Receipts (of which) 18.6 30.7 38.9 47.8 47.8 52.6 Telecommunications Seychelles 17.4 25.3 28.0 40.8 40.8 42.0 Payments 125.0 150.0 179.4 193.5 300.0 350.0 Government services 41.2 33.1 31.0 64.8 51.1 56.1 Receipts 69.3 53.2 56.1 86.9 77.7 79.6 USAF Tracking Station 19.1 0.0 0.0 0.0 0.0 0.0 Foreign embassies in Seychelles 10.0 2.7 2.2 3.0 3.0 3.0 Licences and other fees 40.2 50.5 53.8 83.9 74.7 76.6 Payments 28.2 20.2 25.1 22.0 26.7 23.5 Expenses by Seychelles embassies 3.2 3.2 4.5 6.7 6.8 6.4 Tourism promotion 25.0 17.0 20.8 15.3 19.8 17.1

ANNUAL REPORT 2001 THE EXTERNAL SECTOR
- 61 -
With regards to “travel”, the single most
important service component, net inflow
contracted by 3.0 per cent to R599 million,
following the slight 1.0 per cent increase
registered the prior year. The movement
in 2001 was associated with the R35
million rise in payments, balanced against
a R16 million increase in receipts. Under
the receipts component, tourism earnings
maintained the increasing trend, which
started at the end of 1999 while in-flight
sales by Air Seychelles grew by 11 per
cent to R7.4 million. In 2001, tourism
earnings stood at R770 million, of which
R649 million was through the commercial
banks. Tourism income through the
commercial banks swelled by R49 million
or 8.1 per cent in comparison to the
previous year, mainly due to the
implementation of foreign exchange
regulations, which took effect in mid-2001
and at the same time reflects the higher
yield from the tourism trade, namely five-
star establishments. On the payments side,
the expansion was associated with the
rising foreign travel expenditure, which
grew by R21 million to R140 million.
Net outflow from insurance payment
improved from R19 million in 2000 to
R12 million in 2001. This was associated
with the significant improvement in
receipts, which expanded by 166 per cent
to R18 million, while payments increased
by 14 per cent to R29 million. The
favourable movement in 2001 related to
the reinsurance of higher claims that was
due.
Net outflow in relation to “financial and
business services” recorded an upsurge of
R45 million to R297 million, although the
rate of the increase declined from 72 per
cent to 18 per cent over the period 2000 to
2001. The outcome in 2001 was mainly
due to the upsurge in other payments while
that under “operational lease” grew by 4
per cent to R107 million. Items under
“others”, related to payments such as
management fees, accounting fees, legal
fees, cost of advertising (mainly by five
stars hotels), management and consultancy
fees, expanded by 23 per cent to R243
million. Nonetheless, this represent a
lower rate of growth compared to the 96
per cent rate recorded at the end of the
previous year.
Unlike in 2000 when the surplus in
“Government services” attained a 21 per
cent drop, at the end of 2001, the figure
enlarged by 10 per cent to R56 million.
This movement was associated with the
2.4 per cent increase in receipts to R80
million whilst payments contracted by 12
per cent to R24 million. The higher
receipts is explained by the increase under
“licences and other fees”, which grew by
2.5 per cent to R77 million, in contrast to
the 11 per cent contraction recorded the
previous year. Payments fell at the
expense of “payment by Seychelles
embassies abroad” which contracted by
R400 thousand or 5.8 per cent to R6.4
million and “tourism promotion” fell by
R2.8 million or 14 per cent to R17 million.
The fall in tourism promotion reflects the

ANNUAL REPORT 2001 THE EXTERNAL SECTOR
- 62 -
effort made by STMA to reduce
promotional costs by effective means of
advertising.
2.3 Income
In 2001, net income flows accruing to the
Seychelles economy increased
significantly as reflected by the narrowing
of the deficit to R111 million (US$19
million). This improvement was attributed
to the better position of both major
headings of income “compensation of
employee” and “investment income”.
Firstly, the narrowing of the shortfall in
“compensation of employees, which
amounted to R17 million, was due to a fall
in payments whilst receipts remained
unchanged relative to the previous year.
Therefore, the reduction in the deficit in
income was ascribed to investment
income. The movement in “investment
income” showed a reduction in its shortfall
by R74 million or 44 per cent relative to
the previous year. This was explained by
the fall in payments, which outweighed the
reduction in receipts. The decline in
outflows was due to lower payments made
to non-residents on account of “dividends
& distributed profits” and “interest paid”.
2.4 Transfers
Net transfers continued to remain in
surplus in 2001 amounting to R20 million
(US$3.3 million), representing an increase
of R4.9 million relative to 2000. This rise
was explained by the larger increase in
revenue over payments during the year.
Receipts rose by R5.4 million, whilst
payments increased by R1.6 million.
Current transfers to the government, which
represents the bulk of the flows, recorded
a surplus of R55 million. Of this total
amount, R38 million was on account of
fishing license fees. This was R13 million
higher than the level of 2000. For the
other grant receipts, there was an increase
of R2.9 million in “educational grants”,
whilst there was a decline of R10 million
in “overseas grants” relative to 2000.
Net transfers to the private sector
remained in deficit in 2001, totalling R34
million compared to R35 million the year
before. This slight improvement reflected
the higher increase in receipts compared to
the rise in payments. Receipts amounted
to R24 million compared to R22 million in
2000 whilst payments increased by R1.1
million to R58 million.
3. Capital and financial account
3.1 Capital account
There was a slight increase in inflows in
respect of the capital account. According
to data from the Ministry of Foreign
Affairs, capital grants to Seychelles in
2001 from bilateral and multilateral donors
amounted to R55 million. This
represented a rise of R5.0 million or 9.9
per cent relative to the previous year.
3.2 Financial account
The financial account is the largest
component of the “capital and financial
ANNUAL REPORT 2001 THE EXTERNAL SECTOR
- 63 -
account” and it is made up of four main
headings, namely “direct investment”,
“portfolio investment”, “other investment"
– which consist largely of loans – and
“reserve assets”. The latter is shown as a
“below the line” item as these flows go
towards financing the overall balance of
payments.
Provisional indicators for 2001 show that
the net capital flows (excluding reserve
assets) stood at a net of R487 million. At
this level, the financial account surplus
represented a rise of R50 million or 11 per
cent relative to the previous year. A net
direct investment inflow of R283 million
was recorded whilst the surplus in “other
investment” amounted to R197 million.
Portfolio investment, which is minimal in
the context of Seychelles, registered a
surplus of R6.8 million.
Net foreign direct investment in the
Seychelles economy reached an estimated
R283 million (US$48 million), an increase
of R199 million relative to 2000.
Investment in the form of equity capital
reached R313 million (US$53 million), a
growth of 175 per cent. The further
growth in capital investment occurred in a
number of sectors, however, the bulk of it
represented investment in the tourism
sector, namely in the building of new five-
star establishments. Based on current
information available, one can expect
investment in the tourism industry to
continue to grow. Re-invested earnings by
foreign companies in the country
amounted to R35 million, a growth of 17
per cent.
Outward foreign direct investment totalled
an estimated R65 million (US$11 million),
an increase of R5.0 million or 8.3 per cent
relative to 2000. Outward FDI represent
investment of equity capital by Seychellois
residents or resident firms abroad and re-
investment of resident’s funds abroad.
Portfolio investment, which represents
mainly commercial banks’ investment
abroad, remained in surplus in the year
under review. It rose for a second
consecutive year, this time by R1.4 million
to amount R6.8 million. The surplus was
a culmination of inflows (liabilities)
totalling R6.4 million and outflows
(assets) in the order of negative R0.4
million.
The last heading of the financial account –
other investment – remained in surplus in
the current year review. Nevertheless, the
net position declined by R150 million or
43 per cent relative to the previous year.
At the aggregate level it amounted to R197
million (US$34 million). On the asset
(debit), currency and deposits fell by R34
million. However, the bulk of the change
in “other investment” is accounted for on
the liability side (credit). Inflows totalled
R249 million (US$42 million), a decline
of R184 million or 43 per cent relative to
2000. This fall represented mainly net
repayments made on foreign loans. It
should be noted that in 2001, the financial

ANNUAL REPORT 2001 THE EXTERNAL SECTOR
- 64 -
lease of one of the new aircraft of the
national airline is taken into account in
“other investment”. Based on the
guidelines of the IMF BOPM5, such an
agreement represent a form of financing
akin to a secured loan.
During the year, the Central Bank made a
total draw down of R143 million whilst
repaying R93 million. This gave a net
inflow of R50 million, which was almost
half what was received in the previous
year.
Loan disbursed in favour of the
government totalled R0.6 million, a fall of
R216 million. In contrast the level of
amortisation stood at R187 million, an
increase of R110 million. On a net basis,
the government made a net repayment of
R187 million on its foreign commitments.
Other net repayments were in respect of
parastatals and private organisations.
4. External reserves
After two consecutives years of increasing
reserves, gross official reserves declined in
the year under review. Gross official
reserves, which comprise Central Bank
and Government reserves, fell by R61
million or 22 per cent to close the year at
R213 million equivalent to US$37 million
(Table 5.6). This was equivalent to 4.3
weeks of 2001 imports (c.i.f.). On the
other hand, after increasing for the past
four years, short-term liabilities decreased
by R30 million or 7.5 per cent to stand at
R373 million (US$64 million).
Despite the decline in liabilities, on a net
official basis, reserves deteriorated by R31
million. This adverse movement in the net
position reflected the larger margin of the
fall in gross reserves. At the end of the
year, the net official reserve position stood
at negative R160 million (US$27 million).
Table 5.6 External Reserves;1 1996-2001
(R million)
1996 1997 1998 1999 2000 2001 Gross official reserves 103.4 129.1 117.6 162.7 274.2 213.4 Central Bank 99.2 127.2 115.2 160.2 271.1 210.6 Government 4.2 1.9 2.4 2.5 3.1 2.8 Central Bank’s short-term Borrowings 12.5 64.8 173.1 211.2 403.4 373.2 Net official reserves 90.9 64.3 -55.5 -48.5 -129.2 -159.8
1 End-of period data.
5. Exchange rates
The Seychelles rupee remained pegged to
the Seychelles trade and tourism weighted
basket (STTWB) during 2001. At the
beginning of the year, the Central Bank
announced a revision in the weights of the

ANNUAL REPORT 2001 THE EXTERNAL SECTOR
- 65 -
currencies in the basket. This new set of
weights came into effect on January 3.
The revision was effected to reflect the
significant changes in tourism and trade
patterns over the past three years. The
basket was also revised to incorporate the
euro, the common currency of the
European Monetary Union countries. In
the light of this, the weights of the three
euro-zone currencies, namely the Italian
lira, German mark and French franc, have
been amalgamated into the new euro
weight. Thus, the STTWB now comprises
of six currencies instead of the previous
eight. The new revised basket is shown
below.
Currency Weight (%)
Euro 37.7
US dollar 25.7
UK sterling 15.7
South African rand 10.5
Singapore dollar 7.7
Japanese yen 2.7
Total 100.0
Table 5.7
Exchange Rates;1 1996-2001
1996 1997 1998 1999 2000 2001 (Seychelles Rupees per currency unit)
US dollar 4.9699 5.0269 5.2638 5.3418 5.7132 5.8585 Pound sterling 7.7991 8.2379 8.7229 8.6415 8.6446 8.4397 Deutsche mark 3.2899 2.9029 2.9989 2.9217 2.6917 2.6851 Japanese yen 0.0455 0.0416 0.0404 0.0471 0.0530 0.0483 French franc 0.9676 0.8624 0.8945 0.8710 0.8026 0.8004 Italian lira 0.0032 0.0030 0.0030 0.0030 0.0027 0.0027 South african rand 1.1602 1.0915 0.9572 0.8742 0.8248 0.6925 Singapore dollar 3.5066 3.3921 3.1481 3.1515 3.3132 3.2714 1 Period averages.

ANNUAL REPORT 2001 THE EXTERNAL SECTOR
- 66 -
In terms of the movement in the exchange
rate of the rupee in the year under review,
there has been a general appreciation of
the domestic currency vis-à-vis major
world currencies with the exception of the
US dollar and the Swiss Franc (Table 5.7
& Chart 5.). Against these two currencies
the rupee depreciated by 2.5 per cent and
2.8 per cent respectively. Nevertheless,
the magnitude of the changes during 2001
has reduced compared to the previous
year. The largest gain was against the
South African rand, where the rupee
appreciated by 16 per cent. This was
followed by the Japanese yen of 8.9 per
cent and the UK Pound sterling by 2.4 per
cent. The other movements ranged
between 0.2 per cent and 1.3 per cent.
Chart 5.5 Exchange rates
-1.0000
0.0000
1.0000
2.0000
3.0000
4.0000
5.0000
6.0000
7.0000
8.0000
9.0000
10.0000
1996 1997 1998 1999 2000 2001
Sey
chel
les
rupe
es p
er c
urre
ncy
unit
UK Sterling S. African Rand Singapore Dollar
US Dollar Swiss Franc Euro

ANNUAL REPORT 2001 THE EXTERNAL SECTOR
- 67 -
Box 5.1 – New foreign exchange laws
At the end of 2000 and at the beginning of the year, foreign exchange flows through the
commercial banks continued to decline. In a bid to prevent this situation to deteriorate much
further, the government legislated amendments to the existing foreign exchange laws. In May
2001, the National Assembly approved these new legislations for amendments of the Foreign
Earnings Regulations Act, Exchange Control Act, Licensing Act, Trades Tax Act and Central
Bank Act. The new regulations were aimed at; increasing the inflow of foreign currency
through the banking system and thus control illegal foreign exchange transactions, controlling
imports in addition to maintaining price stability.
In brief, the amendments to the respective acts were as follows;
Foreign Earnings (Regulations) Act
This was to stipulate that unless exemption is granted otherwise, for certain categories of
goods and services, rendered to or on behalf of “non-residents”, payments have to be in
foreign currency. Prescribed businesses or authorised dealers to which this change in policy
applied was stated as follows; Hotels, Guesthouses, Self-catering Establishments, Luxury
Villas, Tour Operators, Travel Agents, Car Hire Operators, Helicopter Seychelles, Air
Seychelles, Hirecraft Operators (of a minimum length of six metres), Diving Businesses,
Casinos and Cruise Ships temporarily operating in Seychelles waters under licence issued by
the Seychelles Licensing Authority.
Exchange Control Act
The Act was amended to address the illegal foreign exchange activities and make sure that all
foreign exchange transactions are those authorised and be at a rate determined by the Central
Bank of Seychelles. In addition, it states that without Exchange Control exemption, export
from or import into Seychelles more than R2,000 in Seychelles currency is an offence.
Penalties relating to failure to comply with this Act is a fine of not less than R250,000 and not
exceeding R500,000 and to imprisonment for a term of 5 years.
Licensing Act
Amendments to this act in summary relates to the new reporting requirements of licensed
businesses in relation to foreign exchange transactions and penalties relating to failure to
comply to this recommendations.

ANNUAL REPORT 2001 THE EXTERNAL SECTOR
- 68 -
Trades Tax Regulations
This amendment was to stipulate that in addition to the Commissioner of Taxes and
Controller of Prices, a Controller of Imports and Exports is appointed. Moreover, for each
import and export of commodities, the importer/exporter must obtain a permit.
Central Bank Act
This act was amended to allow for the appointment of an Exchange Controller, whose
responsibility is to enforce the Foreign Earnings (Regulations) Act and include making sure
that all foreign exchange entering the country goes through the banking system.

SECTION SIX
The Real Sector: Production, Employment and Prices 1. Macroeconomic developments
in 2001 - Overview
The year 2001 saw a moderation in the
inflation rate, falling from 6.3 per cent in
2000 to 6.0 per cent. With a further
growth in nominal Gross Domestic
Product (GDP), it induced a further growth
in the real economy despite the prevailing
constraints on the supply of foreign
exchange. Preliminary estimates made by
the Central Bank of Seychelles (CBS)
pointed to a 0.9 per cent increase in real
GDP, a slowdown of 0.5 per cent,
compared to a growth of 1.4 per cent in
the preceding year (Chart 6.1 & Table
6.1). Most economic activities registered
increases in value added, with the
exception of "agriculture, forestry &
fishing" and "other services".
Chart 6.1. Real GDP growth
-4.0
-2.0
0.0
2.0
4.0
6.0
8.0
10.0
1990 1991 1992 1993 1994 1995 1996 1997 1998 1999 2000 2001
Years
Per
cen
tag
e
Real GDP growth
- 69 -

ANNUAL REPORT 2001 THE REAL SECTOR: PRODUCTION, EMPLOYMENT AND PRICES
- 70 -
The performance of the primary sector
was more or less encouraging in 2001.
Agricultural level of production was
affected by the drought although there was
an increase in demand. This increase in
demand has encouraged the Ministry of
Agriculture and Marine Resources to focus
on enhancing production to achieve food
security for the next ten years. The
Ministry is aiming to produce 80 per cent
of fruit and vegetables locally, whilst all
livestock needed should also be produced
locally. On a more positive note, a growth
was recorded in the number of cottage
industry. Another significant
development relates to cash crops,
whereby the Ministry are targeting a niche
in the world market.
Table 6.1
Gross Domestic Product by Kind of Economic Activity at constant market prices
1996 1997 1998 1999 20001 20012
Percentage change 4.9 4.6 5.5 2.9 1.4 0.9
(R million) GDP at constant market prices 2029.0 2122.1 2238.8 2303.7 2336.0 2358.2Agriculture, forestry and fishing 64.1 65.0 64.4 67.5 67.2 67.0 Mining, manufacturing and Handicrafts 280.0 368.0 389.3 433.4 439.8 434.2 Electricity and water 107.6 128.6 138.5 149.7 156.1 160.3 Building and construction 133.0 148.6 159.7 167.7 175.9 182.9 Transport, distribution and Communications 612.7 597.4 657.1 690.0 721.0 732.7 Hotels and restaurants 89.2 75.9 76.3 72.8 76.0 79.0 Financial and business services 240.9 250.0 242.7 244.8 245.2 249.3 Government services 242.0 224.1 245.0 239.9 237.5 238.2 Other services 259.3 264.5 265.7 237.9 217.3 214.6
1 Provisional 2 Estimate Source: Management and Information Systems Division and Central Bank of Seychelles.
The fisheries sector also registered a
decline in relation to 2000. In terms of
catches, all the existing methods, namely
artisanal, semi-industrial and industrial
fishing, registered declines. Similarly, the
lobster season registered a drop in
landings when compared to the previous
year. The only improvement relating to
2000, was an increase in shark fishing,
which also accounts for the lower level of
predatory recorded in 2001. However,
exports of fish were on the up, especially
through the cannery, although in terms of
catch the industrial sector experienced a
decline.
With regards to manufacturing, a growth
was registered mainly on account of the

ANNUAL REPORT 2001 THE REAL SECTOR: PRODUCTION, EMPLOYMENT AND PRICES
- 71 -
Indian Ocean Tuna canning factory.
Nevertheless, the foreign exchange
shortage, continued to affect growth in the
industrial sector, as a substantial of
manufacturing input depends on imports.
This sector, which has grown in
importance over the past few years, has
again performed below its full potential.
The severe drought that prevailed during
the second half of the year also had a
negative impact on production of that
sector. The production of soft drinks, beer
& stout, and mineral water were directly
affected by the drought. Adverse effects
were also felt in the production of jams, as
local output for fruits were also
constrained by the lack of rainfall.
However, the main manufacturing activity
of tuna canning continued to improve in
performance with increases in both output
and revenue earned from its exports. On
its own, the production of canned tuna
increased by 29 per cent compared to the
preceding year, and was the main impetus
for the recorded growth in manufacturing
during 2001.
Following the expansion phase over the
past couple of years, the Indian Ocean
Tuna (IOT) canning factory is now
regarded as the country's biggest
manufacturing entity in terms of its value
added contribution to the economy. By
the end of 2001, exports had risen to R771
million, with IOT becoming one of the
major exporters of canned tuna in Europe.
Furthermore, IOT has also become the
major employer with a total of more than
2500 employees at the end of the year.
Table 6.2 Gross Domestic Product by Kind of Economic Activity
at current market prices
1996 1997 1998 1999 20001 20012
(R million) GDP at market value 2588.7 2829.6 3201.0 3330.2 3397.7 3633.7
Agriculture, forestry and fishing 97.4 98.8 84.2 103.2 100.1 99.1 Mining, manufacturing and Handicrafts 321.7 406.8 482.1 503.4 491.7 585.1 Electricity and water 52.5 69.5 80.1 76.1 61.3 63.9 Building and construction 208.1 212.7 264.9 323.5 341.1 354.7 Transport, distribution and Communications 799.6 816.7 963.6 1043.1 1085.8 1150.9 Hotels and restaurants 247.2 268.9 289.5 264.7 295.6 313.3 Financial and business services 287.5 320.8 341.7 350.3 355.0 376.2 Government services 351.0 376.0 410.0 423.0 440.3 469.0 Other services 223.7 259.4 284.9 242.9 226.8 221.4
1 Provisional 2 Estimate Source: Management and Information Systems Division and Central Bank of Seychelles.

ANNUAL REPORT 2001 THE REAL SECTOR: PRODUCTION, EMPLOYMENT AND PRICES
- 72 -
On the construction front, there was a
further increase in the sector in 2001,
mainly on account of activities relating to
the construction of five star
establishments, namely Banyan Tree and
Beachcomber. As noted earlier, the
drought also affected the number of
activities, but again the foreign exchange
shortage was the major constraint. Despite
the fact that a significant portion of raw
materials for the construction industry is
locally available, the industry remains
largely dependent on imported inputs,
notably cement, steel and most of the
finishing materials. Among the major
construction projects in 2001, were the
continuation of housing projects, both by
the government and the private sector, and
other works relating to the continuation of
the East Coast Reclamation Project.
In spite of the country experiencing a
further period of drought, the combined
output of electricity and water increased in
2001. In nominal terms it registered a
growth of 4.2 per cent over 2000. The rise
was largely influenced by growth in
electricity, primarily due to improved
capacities following the completion of the
installation of the new generators. In
terms of production, there was a 41 per
cent growth in electricity output.
For the third segment of economic
activity, the tertiary sector, which
comprises of "financial & business
services" and "hotels & restaurants", there
continued to be strong growth (Table 6.1-
6.3). At current prices "financial &
business services" grew by 6.0 per cent.
With the effect of falling prices, it is an
area where real growth was achieved in
2001.
Output of the tertiary sector, the largest
component of gross domestic product,
produced positive results. In terms of
tourism activities, the country's main
economic activity, there was a 0.2 per cent
decline in tourist arrivals in 2001. This
was partly influenced by the terrorist
attack on the United States. Nevertheless,
not everything was gloom as there was a
substantial increase in tourism earnings.
Compared to 2000, tourism income
through the banking sector increased from
R600 million to R649 million in 2001,
which represented a growth of 8.1 per
cent. Furthermore, the higher yielded
market targeted by the government has
started to have the desired effect on the
economy. The Lemuria five-star resort
has contributed 12 per cent of total tourism
income on its own. Repercussions on
other areas of the economy such as
"transportation" and "other services",
contributed to the increased activity in the
tourism sector (see tourism).

ANNUAL REPORT 2001 THE REAL SECTOR: PRODUCTION, EMPLOYMENT AND PRICES
- 73 -
Table 6.3 Gross Domestic Product by Broad Productive Sectors
at current market prices
1996 1997 1998 1999 20001 20012
(R million) GDP 2588.7 2829.5 3201.3 3330.2 3397.7 3633.7 Agriculture, forestry and fishing 97.4 98.8 84.2 103.2 100.1 99.1 Industries 560.6 666.1 800.3 878.2 865.7 975.4 Tourism 370.7 415.4 549.4 538.7 573.9 620.5 Government 351.0 376.0 410.0 423.0 440.3 469.0 Other services 1209.0 1273.2 1357.4 1387.1 1417.7 1469.6
1 Provisional 2 Estimates Source: Management and Information Systems Division and Central Bank of Seychelles
The R49 million increase in income was a
result of the new foreign exchange laws,
which allow proper channelling of foreign
exchange earnings. Secondly, the newly
built five star establishments offer a higher
yielded level of revenue. Despite the drop
in arrivals, there was minimal negative
impact on transportation services, as there
was a growth in terms of air
transportation, mainly due to the
acquisition of two aircrafts, a Boeing 767-
300 in April and a Boeing 737-700 by Air
Seychelles. There was also a growth in
terms of tour operating activities during
the year under review.
Other factors boosting transportation were
increased activities in the port in relation
to both tuna handling following the return
of normal weather conditions and an
increase in merchandise imports.
There was a further rise in output in the
communication sector. The increased
dynamism of this sector reflects stronger
competitions between Airtel and Cable &
Wireless, the two rival operators. Both
companies registered increases in their
output. Through a larger choice of
products and cheaper communication
charges, the competitive spirit in the sector
has stimulated the upward trend since
1999. There was also a further growth in
mobile services during 2001, which played
a large part in these companies' output.
In relation to financial and business
services, the growing trend was
maintained in 2001. Firstly, this reflected
the rise in banking activities during the
year. There was also a further investment
in ATM facilities, especially through the
Seychelles Savings Bank (SSB) offering
such services on a larger scale. The
second argument relates to insurance
activities, whereby the competition
between Harry Savy and the well
established State Assurance Corporation

ANNUAL REPORT 2001 THE REAL SECTOR: PRODUCTION, EMPLOYMENT AND PRICES
- 74 -
of Seychelles (SACOS) intensified over
the course of the year.
Outlook for 2002 for the economy will
depend much on the policies that
government pursues. Given present
circumstances, the primary focus will
remain on addressing the foreign exchange
shortage, as it still remains the core of the
distortions to economic efficiency. Access
to raw materials and other inputs required
in the production process has been a
constraint especially for producers. This
in itself is hampering the export prospects
of the country.
For the medium term, a lot will depend on
the tourism industry, through the five-star
establishments. The early indications are
very promising, with most of these hotels
operating at near full capacity. With the
construction of other such establishments,
the industry is expected to boost further
the country's foreign exchange revenue.
Besides the tourism industry, the
government would be hoping that its effort
in promoting increased activity in the area
of fisheries would be further exploited to
the full. Much hope relies on the tuna-
canning factory, which attained a new
record in terms of exports during the year
under review. The government's plan to
have its own purse seigning fleet, whereby
discussions started with a German
shipping yard, would also be a major boost
to the economy in future. The acquisition
of an oil tanker, The Seychelles Pride, is
envisaged to make a significant eonomic
contribution.
2. Tourism
In 2001, the tourism sector continued to
play a major role in the economy with an
ever-increasing interest in its future
potential. With about 55 per cent of the
country's foreign exchange earnings,
tourism remained one of the principal
economic activities in 2001, accounting
for an increasing number of employees.
For the industry itself, it has been very
fruitful, despite suffering a setback after
the September attacks in the United States.
The two main indicators, which portray
the economic vigour of the sector, namely
tourist arrivals and income, were generally
positive.
Tourism arrivals for the year stood at
129,762, which represented a decline of
only 0.2 per cent relative to 2000 (Table
6.4). It is worth noting that the tourism
data for the year clearly showed an
increase up to September, where it had
risen by 3.0 per cent in relation to the
same period in 2000. Following the
September 11th attacks there was a
negative impact to the extent that there
was a decline in bookings for the
following months.

ANNUAL REPORT 2001 THE REAL SECTOR: PRODUCTION, EMPLOYMENT AND PRICES
- 75 -
Table 6.4 Tourism
1996
1997 1998 1999 2000 2001
Visitor nights – thousands 1270 1340 1347 1299 1352 1350 Visitor arrivals – thousands 131 130 128 125 130 130 Average length of stay (nights) 9.7 10.3 10.5 10.4 10.4 10.4 Tourism income – R million 524 612 584 596 600 649 Average expenditure Per diem – Rupees 413 457 434 460 445 480 Memorandum Hotel bed occupancy rate (%) 57 56 53 53 52 51
Source: Management and Information Systems Division (except tourism income, which is compiled by Central Bank based on commercial bank purchases of foreign exchange from the tourism sector) In terms of geographical distribution,
Europe remained the primary supply of
visitors with a market share of 79 per cent
despite the terrorist treat. Nevertheless,
the September 11th events did have a
negative influence on its market share as it
fell by 0.1 per cent. France remained the
most important market with a 20 per cent
share of total arrivals. This amounted to
25,459 visitors, which is 10 per cent short
of the previous year's record.
Regarding the other major European
countries, there were mixed movements in
terms of their market shares. For instance,
France, Germany, Scandinavia and other
European suppliers all posted declines.
On the other hand, the United Kingdom,
Italy and Switzerland contributed more
tourists in 2001, and thus enhanced their
respective market shares. The increases
were mainly 6.3 per cent, 6.0 per cent and
4.8 per cent respectively.
All other major markets posted increases
in their market share with the exception of
Oceania, which remained the same. The
number of visitors from Africa, Asia,
America and Oceania increased relative to
2000. Increases of 1.0 per cent, 2.8 per
cent, 9.9 per cent and 12 per cent were
recorded for all these respective markets.
For the second indicator, tourism income,
the year registered a new record. Income
coming through the banking system rose
by 8.1 per cent relative to 2000 to amount
to R649 million (Table 6.4). This increase
was two fold. On the one hand, there are
the higher yield hotels, which have come
online during the year. On the other hand,
the government introduced new measures
in relation to foreign exchange
transactions. The new amendments to the
Foreign Earnings (Regulations) Act make
provision for an increase number of
services to accept payment in foreign
currency. The laws also make sure that

ANNUAL REPORT 2001 THE REAL SECTOR: PRODUCTION, EMPLOYMENT AND PRICES
- 76 -
the earnings are channelled through the
banking system. These new set of laws
were put in place as of June 1.
One of the main developments in the
tourism industry during the year has been
the continued role of the Seychelles
Tourism Marketing Authority (STMA) to
promote Seychelles as a safe destination.
Through a more focused marketing
approach, it helped enhanced and upgrade
the contributions of the sector. The
prospects of the coming years look
positive, especially after it launched its
Vision 21, which highlighted the tourism
development until 2010.
Acknowledging the advantages of the
industry for the economy, and the
challenges ahead, STMA has set some
targets to boost the overall contribution of
that sector. In the coming years, tourism
in the Seychelles will be expanded
gradually, with facilities, services and
infrastructure developed to a higher
quality level and more activities provided
for tourists.
The tourist markets will be broadened to
include more nationalities and both
general and special interest tourists, and
access will be improved to reach more
market areas. On the other hand,
expenditures per tourist day will be
increased and there will be more value-
added in the country, which will enhance
economic benefits to the Seychelles.
Tourism will also be developed on a
sustainable basis and not exceed carrying
capacities, and the unique land and marine
environment and cultural heritage of the
Seychelles will continue to be protected
and conserved. Seychellois will continue
to be sensitised to the importance of
tourism and providing value for money to
tourists.
Some of the main tourist projects that were
being undertaken in 2001 was a new 100
room 5-star resort, owned by Banyan Tree,
which was nearing completion by the end
of the year, with approvals awarded for
further luxury projects. The Beachcomber
investors purchased the Reef Hotel in
order to train prospective workers for the
industry and are also constructing a five-
star resort on Ste Anne island. Other five
star projects are also being considered.
These new hotels would further enhance
bed capacity in Seychelles and cater for
the expected increase in visitor arrivals.
The second notable development is the
expansion and upgrade of the Air
Seychelles fleet following Air Seychelles’
acquisition of a new Boeing 767-300
aircraft, which replaced the Boeing 767-
200. There was also the acquisition of a
third aircraft a Boeing 737-700 that would
operate on regional routes. This
development boosted capacity, service its
present markets more effectively and
allow the tapping of new potential
markets.

ANNUAL REPORT 2001 THE REAL SECTOR: PRODUCTION, EMPLOYMENT AND PRICES
- 77 -
The airline continued with its code sharing
agreements with other airlines during
2001. In October, it signed an agreement
with Condor of Germany, which launched
a joint flight operation between the two
countries. Air Seychelles is also expected
to do well financially in the fiscal year
2000-2001. This follows another
profitable year of profit estimated at US$
1.5 million. The year was the fourth
consecutive year of good performance.
On the domestic side, the new airport on
Praslin was officially opened on June 23,
thus enabling better services and facilities.
The overall prospects for the tourism
industry for 2002 look bright, especially
upon the completion of the major projects
within the industry. It is expected to
improve the employment level in the
country and increase the economic output
further, which would have multiplier
effects in the rest of the economy.
3. Agriculture
Overview
During 2001 agricultural output was again
on the increasing trend. However,
production level was hampered by one of
the most severe droughts in recent times.
One encouraging note was a general
increase in demand for fruits and
vegetables and livestock. This has
encouraged the ministry to focus on
enhancing production and thus achieve
food security within the next ten years.
Increases were also recorded in the
number of cottage industries. For the
future the main aim of the government is
to try and produce at least 80 per cent of
all fruits and vegetables locally, whilst all
livestock for local consumption should be
produced 100 per cent by local
entrepreneurs.
Another major development is the new
interest relating to cash crops, such as
cinnamon and essential oils. The Ministry
of Agriculture and Marine Resources
(MAMR) is targeting a niche in the World
market where the demand has definitely
gone up. The copra industry has been
relatively disappointing as it is labour-
intensive and also not too profitable.
Concerning livestock, the main concern is
to bring in new breeds of pigs to re-orient
the bloodlines for better quality pork.
The Ministry of agriculture, through the
assistance of the Food and Agriculture
Organisation (FAO) and the European
Union (EU) has benefited in improving the
facilities such as roads, water systems and
also the control of fruit flies and pests.
On a more encouraging note, a New
Agriculture Policy (NAP) has been drafted
for the next decade to achieve a higher
food security through a sustainable
agricultural production. The government
would be the facilitator of this policy, with
the co-corporation of private entrepreneurs
a crucial ally in achieving the necessary
targets.

ANNUAL REPORT 2001 THE REAL SECTOR: PRODUCTION, EMPLOYMENT AND PRICES
- 78 -
Fruit and Vegetables
Data of purchase of fruits and vegetables
by the SMB - the traditional measure for
local production of fruits and vegetables -
showed an overall decline during 2001.
During the first half of the year there was
an increase in locally produced items,
influenced by a general increase by local
entrepreneurs. However, the severe
drought that prevailed in 2001, particularly
in the second half of the year hampered
the local production of fruits and
vegetables, which fell by 26 per cent
relative to the previous year.
Nevertheless, there was an increase in
demand for fruits, which encouraged the
MAMR to increase the capacity of
provision of planting materials in order to
increase supply. During the year, there
was also the notion whereby there was an
increase in the number of cottage industry.
This encouraged the production of
cassava, papaya, banana, to be used for
chips and jams. So generally, there were
more individuals interesting in crops and
planting methods.
The output for vegetables was also very
satisfactory. However, imports still
account for total supply of vegetables.
This is because of certain environmental
conditions, which constrain the production
of certain vegetables. Nevertheless,
production of tomato, lettuce and cabbage
still relies on local output. With the
reduction in local production, the
opportunity cost was an increase in
imported items, which was 4.4 per cent
higher in relation to the previous year.
Table 6.5
SMB Purchases of Vegetables and Fruits
1996 1997 1998 1999 2000 2001 (tonnes)
Total 5,481 5,409 5,964 6,097 6,349 6,545 Local 333 160 247 388 278 206 Change (%) 51 -52 54 57 -28 -26 Imported 5,148 5,249 5,717 5,710 6,071 6339 Change (%) 17 2.0 8.9 -0.1 6.3 4.4 Source: Seychelles Marketing Board
Cinnamon
Cinnamon production, which is one of the
country's major traditional cash crops
increased relative to the previous year.
According to production indicators
published by MISD, cinnamon warehouses
deliveries increased by a staggering 648
per cent. From an output of only 25
tonnes in 2000, it amounted to 187 tonnes
in 2001. As for exports, there was a 17
per cent decline relative to 2000. There
were also some promoters in the
production of essential oils, like vanilla.

ANNUAL REPORT 2001 THE REAL SECTOR: PRODUCTION, EMPLOYMENT AND PRICES
- 79 -
Copra
Unlike cinnamon, copra experienced an
increase in both delivery to warehouses
and exports. According to the indicators,
deliveries rose by 12 per cent whilst
exports increased by 38 per cent. In terms
of exports, the year's output was higher
than in 2000, but all exports were in the
first nine months, whilst there was no
exportation in the fourth quarter. There
are two setbacks that have been identified
as the downfall of copra production. The
first one is that it is labour intensive and
secondly, it is not profitable in the world
market.
Tea
The year 2001 was another setback for tea
production, which resulted from the
persistent drought throughout the year.
Relative to 2000, production fell by 6.1
per cent totalling 231 tonnes (Table 6.6).
Prospects for the year will again depend
on improvement of the weather conditions.
Table 6.6
Crops
1996 1997 1998 1999 2000 2001 (tonnes)
Copra (exports) 0 0 0 0 52 72 Copra (warehouse deliveries) 393 314 259 301 377 421 Cinnamon bark (exports) 318 220 289 214 177 147 Cinnamon bark (warehouse Deliveries) 280 241 478 385 25 187 Tea, green leaf (processed) 223 270 250 236 246 231 Source: Management & Information Systems Division
Other developments in agriculture
In the year 2001, the Ministry of
Agriculture continued to improve farm
infrastructure. This led to improved roads
and irrigation reservoirs. There was also
the African Development Bank (ADB),
which financed integrated agricultural
project, which was completed in
December 2001. This project resulted in
improved water systems and roads
particularly at La Gogue, Anse Boileau,
Praslin and Val D'en Dor. Foreign
assistance was also received from the
Food and Agriculture Organisation (FAO)
for projects relating to farm development
systems. This includes new approaches
for higher productivity, and making
research and production become closer so
that individual farmers can fare on their
own. Another foreign assistance was from
the European Union (EU), which was for
the control of infestation of fruit flies and
pests. This particular project, which has
two different stages started in 2001.
Finally, the Seychelles government
financed the importation of new blood

ANNUAL REPORT 2001 THE REAL SECTOR: PRODUCTION, EMPLOYMENT AND PRICES
- 80 -
lines for pigs. This project was to induce a
new breed of pigs, as a solution to in
breeding.
4. Livestock
During the fiscal year 2001, livestock
reflected the general trend in agriculture,
with an increase in production. The
impetus for livestock production was again
centred towards local production. Firstly
in relation to chicken production, it can be
said that the output from broiler chicken
was fairly stable. There was an increase in
demand for meat according to prevailing
trend. As regards layer chickens, the
outcome was more encouraging, with
production increasing. There was also
increase in the supply of eggs fuelled by
increasing demand, thus creating a glut in
the market. Nevertheless, it is difficult to
change policies relating to chicken
production although there is a higher
demand with the extra hotels and specific
demand for chicken products. The total
production thus is still made up of 20 per
cent of imported products, with the rest
accounted for by local production.
In relation to pork, there was a general
increase in production. Local demand is
catered for by 60 to 70 per cent of total
production, with the rest being imported
for processing. There has been an increase
in farm gate prices which has encourage
people to go in the industry, and thus has
increase the total participation in
production.
Table 6.7
Livestock (slaughters)1
1996 1997 1998 1999 2000 2001 (units)
Cattle 162 91 123 139 147 129 Pigs 5,302 5,165 6,430 6,629 8,619 8,648 Chicken (‘000) 720 806 684 695 734 700 1 Le Rocher Abattoir only
Plans for 2002
The Ministry responsible for agriculture
has outlined a New Agricultural Policy
(NAP) 2000-2010 for the coming decade
to replace the current Agricultural Sector
Policy formulated in 1992/93. The main
target of the NAP is to present new
opportunities and challenges in national
food security. This means that new targets
have to be set in national agricultural
production. This development is to bridge
the gap in knowledge and understanding
of all factors that constrained national
agricultural production. The Ministry also
believes that to achieve its overall
objective of a higher food security through

ANNUAL REPORT 2001 THE REAL SECTOR: PRODUCTION, EMPLOYMENT AND PRICES
- 81 -
sustainable agricultural production, it
would have to entail both arable crops and
livestock production, primarily in domains
where there are comparative advantages.
At the end of the planned period, it is
envisioned that all the poultry meat and
pork that is to be consumed should be
produced locally, whilst 80 per cent of
fruit and vegetables would be produced
locally. The other two important facets of
national food security, import and storage
would be dealt with by other government
policies and institutional mechanisms.
The new policy also spells out the role of
government as facilitator, whilst the
private sector would be encouraged to
directly engage in national agricultural
production.
On a shorter time period, for the coming
year 2002, the ministry has targeted an
increase in the volume of fruit and
vegetables production. Increasing the
consumption of these two commodities
would enhanced the health of the
Seychellois as illustrated by current trends.
Secondly, production needs to increase
because of the increase in demand,
especially for vegetables. To increase the
production of fruits, the Ministry would
also be encouraging the entrepreneurs of
cottage industry. The high demand has
also alerted the Ministry to review its land
policy, whereby it will try to increase area
for production. The need for an increase
in pig production is yet another aim of the
ministry, especially with the intention to
inject new blood lines.
Finally, the ministry has identified the
need to exploit cash crops and essential
oils production. They will need to create a
niche, as demand exists on the world
market.
5. Fisheries
The year 2001 was not a particularly good
year for the fisheries industry. According
to the statistics obtained from the
Seychelles Fishing Authority (SFA), catch
through all the existing methods of fishing,
namely artisanal, semi-industrial and
industrial, all registered declines.
Similarly, the lobster season, which was
opened from November to January for the
third consecutive year, indicated a sharp
drop in landings estimated at between 4.5
to 5.0 metric tonnes compared to 10 metric
tonnes in the previous year. The fishery
was also closely monitored with night
patrols organised, and catch and effort data
collected on a regular basis.
On the other hand, there was an increase in
shark fishing, as there is a high value for
their fins on the international market. The
opportunity cost of these landings was a
reduction incurred in tuna and swordfish
landings, especially via long-lines.

ANNUAL REPORT 2001 THE REAL SECTOR: PRODUCTION, EMPLOYMENT AND PRICES
- 82 -
5.1 Artisanal and semi-industrial
fishing sector
In 2001, landing through artisanal fishing
catch which represents fishing along the
coast (including through the use of traps)
decreased slightly to 4,290 metric tonnes.
This represents a 474 metric tonnes
decrease or 10 per cent fall over the
previous year's level when landings
totalled 4,764 metric tonnes (Table 6.8).
Table 6.8
Estimates of Fish Landed
1996 1997 1998 1999 2000 2001
( Metric tonnes)
Artisanal method 4,510 4,095 3,334 4,842 4,764 4,290 Semi-industrial (longline) 210 311 280 457 290 238 Industrial method - Caught 265,658 271,095 252,595 331,424 330,340 277,000 - Transhipped 163,657 200,279 151,592 257,447 269,673 235,000 Source: Seychelles Fishing Authority
The fuel voucher scheme was again
renewed last year with certain allocation to
individual fishermen reduced. Other
fishermen who did not meet the required
criteria had the allocation cancelled
altogether.
During the last month of 2001, all the
various components of the Japanese Grant
Aid project was received and preparation
was started to begin selling the engines
and equipment in early January 2002. The
project, valued at R25 million, involves
the acquisition of an ice plant of 5 metric
tonnes daily capacity situated at Anse
Royale, which became operational in
December 2001, 60 inboard engines, 5
fishing vessels and an assortment of
fishing gears and equipment to be sold to
local fishermen.
Besides artisanal fishing, SFA continued
to concentrate its effort to promote the
development of the semi-industrial long-
line fishery targeting tuna and swordfish.
One more vessel from Sri Lanka, a 22-
metre long-liner financed under the EU
disbursement project joined the existing
fleet. This brought the total number of
long-line fleet to 10.
During the year, the fleet landed a total of
238 metric tonnes of tuna and swordfish
compared to 290 metric tonnes in 2000.
The year's output comprised of 51 per cent
swordfish and 30 per cent tuna. The year
also saw a decline in the predation rate,
dropping from 11 per cent in 2000 to 6.0
per cent. On the other hand, several of the
semi-industrial boats carried out trips
specifically targeting sharks due to the
high value of their fins on the international

ANNUAL REPORT 2001 THE REAL SECTOR: PRODUCTION, EMPLOYMENT AND PRICES
- 83 -
market, and this explains the decline in the
landings of tuna and swordfish.
5.2 Industrial fishing The purse seining fleet remains the most
important fleet in industrial fishing, which
at the moment is done entirely by foreign
vessels. The policy of the government
with regards to this type of fishing is to
licence the foreign vessels, whilst
attempting to derive maximum benefit
from using Port Victoria. During the year
2001, 52 vessels were licensed to fish in
the Seychelles EEZ, compared to 51 in the
previous year. The total purse seine catch
for last year was 277,000 metric tonnes
compared to 330,000 for the year 2000,
representing a decline of 16 per cent
(Table 6.8). There was an increase in
transhipment activity. In 2001, 85 per cent
of the total catch (235,000 metric tonnes)
was transhipped compared to 82 per cent
(269,000 metric tonnes) in the previous
year.
Furthermore, the Seychelles government
over the past years has recognised the
advantages of having their own fishing
fleet, which would generally reduce
importation. In 2001, discussions between
the Seychelles government and a ship
building company, Lindenau GMB, started
for Seychelles to own its own purse
seining fleet.
As regards industrial long-lining activity
the number of licences increased
drastically for the year 2001. Over R9.0
million in licence fees were collected
compared to R5.8 million in the previous
year.
Outlook
In 2002, the SFA would continue to
implement the projects initiated during the
year 2001, of which the most important
are the fisheries management measures for
monitoring and control of the Fishery
Reserves in the Southern Island Groups,
the fuel voucher scheme and the Vessel
Monitoring System (VMS) programme.
The implementation of the VMS
programme would continue to receive high
priority and it is planned that the program
would be operational by mid-2001.
It is also planned that the Japanese Grant
Aid project would become fully
implemented during the course of the year
in order to promote the development of the
local artisanal fishing industry.
5.3 Aquaculture (Prawn Farming) The year 2001 was the seventh year that
the aquaculture industry, more specifically
the production of prawns, has been in
operation. The industry, which started in
the mid-1990s by the Seychelles
Marketing Board (SMB) as part of its
endeavour to diversify its operations,
especially its export-oriented activities is
recognised for its high business risks and
the corresponding high returns. The profit
margins are among the highest compared
to other industries due to the ever-
expanding demand in the global market.

ANNUAL REPORT 2001 THE REAL SECTOR: PRODUCTION, EMPLOYMENT AND PRICES
- 84 -
At the outset, production was relatively
high as the environment on Coetivy was
well endowed for prawn farming. With
increases in world demand, the project
induced increases in revenue. However, in
1999, production suffered a setback due to
uncontrollable environmental factors. The
overall production was hindered by a non-
availability of brood stocks, from
Mozambique (floods) and Madagascar
(disease). This also resulted in a drop in
exports. However, in 2000 both
production and exports picked up again.
During 2001, the Coetivy prawn farm
produced 281 metric tonnes of shrimps,
which is 34 per cent less than the previous
year. This is mainly attributed to the
hatchery not producing enough post larvae
and again the problem of obtaining brood
stock. On the other hand, there was a 12
per cent increase in the export of prawns.
A total of 279 metric tonnes was exported
in 2001. The SMB feed factory also
exported 4,500 metric tonnes of shrimp
feed. The plant has a capacity of 6000
metric tonnes.
6. Industries The fiscal year under review was yet
another difficult year for the industrial
sector, particularly in the first half of the
year and for the small to medium sized
industries. The main reason being the
shortage of hard currency for imports one
of the main components for industrial
activity. Most of these entities produced
below their potential level. Information on
industrial development in 2001, based on
surveys from the major enterprises,
indicated that this was another difficult
year for industry. The survey showed that
the foreign exchange shortage was the
main factor hindering growth prospects
across industries. Amongst other factors
affecting output in 2001 was the severe
drought, particularly in the latter part of
the year. Industries, which consume a
considerable amount of water, particularly
the brewery was the one principally
affected by this constrain.
Despite the gloomy picture for the
industrial sector, the outcome of the
Indian Ocean Tuna (IOT) canning factory was a success story. The canning
factory remained the country’s biggest
manufacturing entity in terms of
employment, output and revenue. On the
employment front, the company now
provides employment for just over 2500
employees whilst with regards to revenue
for the first half of the year, a turnover of
R406 million was achieved which was 33
per cent above the amount earned for the
same period a year earlier. By the end of
2001, the total value of exports increased
in line with production, rising by 27 per
cent to R771 million in relation to the
preceding year. The factory was able to
meet most of its external demand
particularly in the European market. The
United Kingdom remained the major
market with a 41 per cent share of total
exports. During the year, Seychelles
became the major exporter of tuna to
Europe with both France and Italy, moving
to IOT as their main supplier.

ANNUAL REPORT 2001 THE REAL SECTOR: PRODUCTION, EMPLOYMENT AND PRICES
- 85 -
On the other hand, Kreol' Or, an entity,
which produces gold jewellery and craft
items, experienced contrasting outcomes
although it registered a general decline in
its turnover. Its gold section saw a
reduction in production and thus its
turnover due to the foreign exchange
problem. This was compensated by its
craft section whereby sales increased from
R815,297 in 2000 to R914,726 in 2001.
The level of production of gold jewellery
fell compared to the preceding year, which
followed the same trend as the value of
sales. As for the craft section, the
increasing trend was maintained in its
production, thus explaining the rise in
sales figures. Compared with 2000
figures, there was a 40 per cent drop in the
exports of the company, as it is difficult to
purchase raw materials for its gold section
and also to offer proper marketing
campaign overseas. In terms of
investment, Kreol'Or was considering to
purchase the premises where the factory is
located or even purchase a new factory.
7. Employment
During the year 2001, there was a further
growth in employment according to the
records of the Social Security Fund.
Relative to 2000, employment grew by
882 or 2.2 per cent, as illustrated below in
Table 6.9. Compared to 39,381 people
employed in 2000, the total number of
people officially employed in the year
under review stood at 40,263. The overall
growth in employment was reflective of
both the private and parastatal sectors,
which posted growth of 6.0 per cent and
5.8 per cent respectively. The private
sector accommodated 1,191 new
employees, whilst 322 employees joined
the parastatal sector. This was at the
expense of government employment,
which declined by 4.5 per cent or by 631
workers. By the end of the year, the stock
of employment pool at the private,
parastatal and government sectors stood at
20,944, 5, 872 and 13, 447 respectively.
In the private sector, the increasing pace of
growth in the manufacturing, tourism and
other related services was the main factor
in the expansion of job creation. Further
intakes by the Indian Ocean Tuna Canning
factory, parallel to further expansion, was
the dynamo in the new placements in
manufacturing. In the tourism sector, the
opening of new hotels increased the
number of vacancies in that economic
activity, which thus caused a
corresponding effect for the other related
services.
These developments in the labour market
had certain effects on the share of each

ANNUAL REPORT 2001 THE REAL SECTOR: PRODUCTION, EMPLOYMENT AND PRICES
- 86 -
sector in total employment, albeit only
marginal. With the growths, the private
sector rose by two-percentage points from
50 per cent to 52 per cent. Likewise the
parastatal sector's share rose by one
percentage point to 15 per cent. As a
result, the opportunity cost was a three-
percentage points decline in the
government's share of total employment,
which left its share at 33 per cent.
Table 6.9 Employment
Dec. Dec. Dec. Dec. Dec. Dec. 1996 1997 1998 1999 2000 2001
Total 30,935 33,328 36,207 37,465 39,381 40,263
Private Sector 13,534 16,486 17,675 17,908 19,753 20,944 Parastatals 4,836 5,368 4,921 5,100 5,550 5,872 Government 12,565 11,474 13,611 14,457 14,078 13,447
Source: Social Security Fund
8. Earnings
According to data from MISD, for 2001
the average monthly earnings rose by 1.6
per cent compared to last year. In 2001
the ‘all sectors’ average monthly earnings
at current prices reached R3,385 compared
to R3,332 in the previous year (Table
6.11). This rise in earnings was mainly
attributed to the private and government
sectors employees whose average monthly
earning grew by 3.1 per cent and 0.6 per
cent respectively. On the other hand,
parastatal sector employees saw a 1.2 per
cent fall in their average earnings. From
an average of R3,693 in 2000, it fell to
R3,648 in the year under review.
The growth in earnings was induced by
increases in most of the industries
involved with the exception of “wholesale
& retail” which posted a decline in
average earnings by R105. The highest
increases were recorded in respect of
wholesale and retail trade, and restaurants,
which grew by 5.7 per cent and 5.4 per
cent respectively. The latter reflects the
increased activities in the tourism industry
over the past year particularly with the
introduction of 5-star establishments.
During 2001, private sector employees
working within the non-tourism related
‘transport storage and communication’
industry registered the highest average
earnings at R4,937. The lowest earning in
the sector was in relation to wholesale and
retail trade, which earned R2,390 on
average.

ANNUAL REPORT 2001 THE REAL SECTOR: PRODUCTION, EMPLOYMENT AND PRICES
- 87 -
In the government sector, public
administration employees were the highest
earners with an average of R3,949, whilst
in the parastatal sector, tourism related
employees were the top earners with
R5,475.
Table 6.10 Average Monthly Earnings
1996 1997 1998 1999 2000 2001
(rupees – current prices)
All Sectors 2,911 2,954 3,135 3,250 3332 3385
Private Sector 2,719 2,651 2,829 2,990 3094 3189 Parastatals 3,180 3,429 3,725 3,669 3693 3648 Government 3,103 3,251 3,410 3,474 3561 3581
9. Prices
Since 1982, through a stable economic
environment and a system of price control,
the Seychelles economy was characterised
by low and stable inflation for a period of
eighteen years. This trend ended in 1999,
following a surge in inflation, which
prompted a concerned reaction by the
authorities. The retail price index (RPI),
which measures movements in prices,
indicated a 6.3 per cent increase by the end
of that year. This was the highest growth
since the early 1980s.
Throughout the year 2000, this high level
of prices persisted, averaging 6.3 per cent,
thus maintaining the same level of prices
as in the previous year. The government
had as one of its priorities to curb this
prevailing level of inflation. At the
beginning of 2001, no major change
occurred, prompting the authorities to find
ways of cutting down the average inflation
rate.
By the end of the year under review, there
was a slight fall in prices, with the year's
average standing at 6.0 per cent (Chart
6.2). This deceleration in the rate of
inflation was mainly attributed to a
significant decline in the prices of fish and
to a lesser extent the prices of local
products (food & non-food). A growth of
4.7 per cent was registered in the price of
the local goods index, a slowdown,
compared to a 7.2 per cent increase in the
previous year.
In actual fact there was a decline in the
prices of certain imported items, as the
government targeted private merchants to
sell at the right retail prices. The majority
of imported products are invoiced in US
dollars, and the year saw a further
depreciation of rupee against the dollar.
This explained the general increase in the
prices of imports.
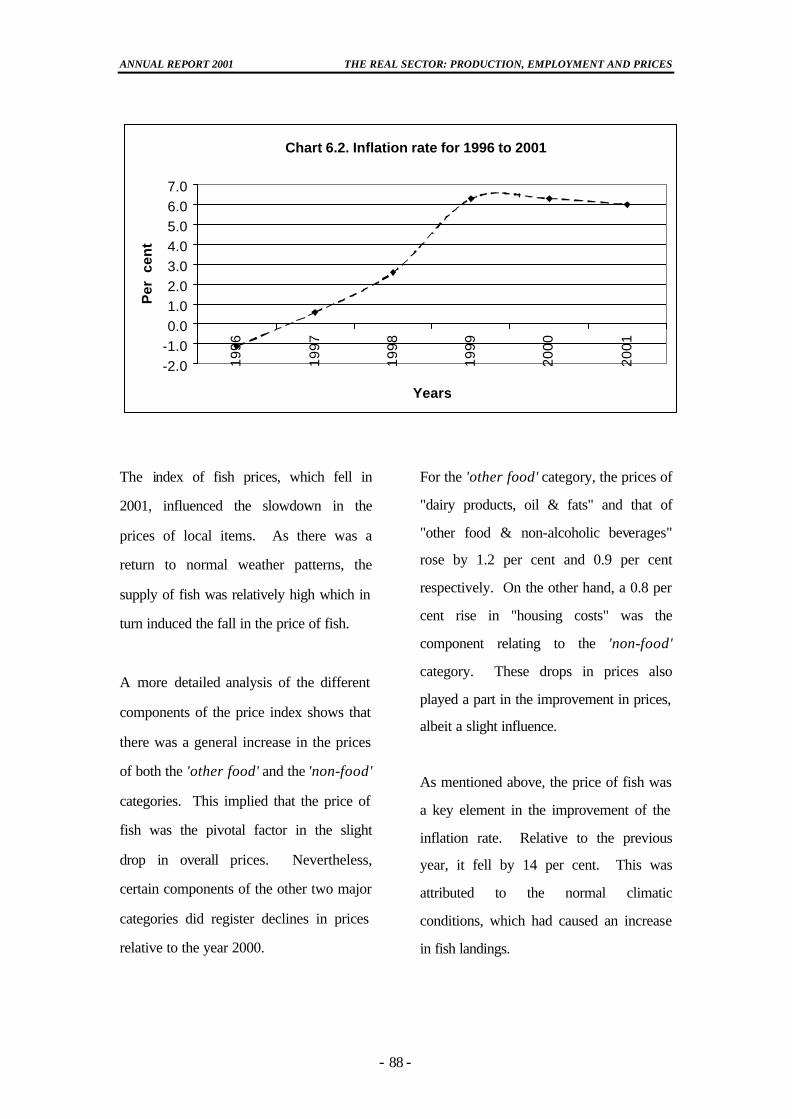
ANNUAL REPORT 2001 THE REAL SECTOR: PRODUCTION, EMPLOYMENT AND PRICES
- 88 -
Chart 6.2. Inflation rate for 1996 to 2001
-2.0-1.00.01.02.03.04.05.06.07.0
1996
1997
1998
1999
2000
2001
Years
Per
cen
t
The index of fish prices, which fell in
2001, influenced the slowdown in the
prices of local items. As there was a
return to normal weather patterns, the
supply of fish was relatively high which in
turn induced the fall in the price of fish.
A more detailed analysis of the different
components of the price index shows that
there was a general increase in the prices
of both the 'other food' and the 'non-food'
categories. This implied that the price of
fish was the pivotal factor in the slight
drop in overall prices. Nevertheless,
certain components of the other two major
categories did register declines in prices
relative to the year 2000.
For the 'other food' category, the prices of
"dairy products, oil & fats" and that of
"other food & non-alcoholic beverages"
rose by 1.2 per cent and 0.9 per cent
respectively. On the other hand, a 0.8 per
cent rise in "housing costs" was the
component relating to the 'non-food'
category. These drops in prices also
played a part in the improvement in prices,
albeit a slight influence.
As mentioned above, the price of fish was
a key element in the improvement of the
inflation rate. Relative to the previous
year, it fell by 14 per cent. This was
attributed to the normal climatic
conditions, which had caused an increase
in fish landings.

ANNUAL REPORT 2001 THE REAL SECTOR: PRODUCTION, EMPLOYMENT AND PRICES
- 89 -
Table 6.11 Composition of Retail Price Index1
1996 1997 1998 1999 2000 2001
Weights
(percentage change)
All Items 1,000 -1.1 0.6 2.7 6.3 6.3 6.0 Local 656 -1.3 0.4 3.2 4.4 7.2 4.7 Imported 344 -0.5 1.2 1.3 10.3 4.4 8.4 Fish 32 -7.3 12.0 10.8 -15.3 -6.5 15.5 Other Food Items 234 -2.2 0.7 1.0 1.9 2.9 3.2 Local 119 1.9 1.0 1.5 0.9 4.5 2.7 Imported 115 -2.6 0.3 0.3 3.3 0.7 3.8 Non-Food Items 734 -0.4 0.0 2.7 8.6 7.7 6.1 Local 505 -0.9 -0.5 3.0 6.7 8.6 4.6 Imported 229 0.3 1.4 1.8 12.9 5.5 9.8 1 Period averages.
Source: Management & Information Systems Division

SECTION SEVEN
Offshore and Investment Developments
1. Overview
During the year, activity in the offshore
sector, which is managed by the
Seychelles International Business
Authority (SIBA) improved further when
compared to 2000. Firstly, there was an
increase of 503 International Business
Companies (IBCs) above the total
registered in the previous year. Since
1996, this has been the highest recorded
growth. Secondly, each quarter of the year
recorded the highest ever number of
registration to date, which brought the
total registered IBCs for the year to 1,854.
Furthermore, a total of eleven new
companies were awarded licences to
operate within the Industrial Trade Zone
(ITZ). The year also saw the registration
of eleven new trusts, with the final quarter
accounting for six of them.
The companies that were licensed in 2001
were involved in a wide range of
activities. One such activity is the re-
distribution of EPSON point of sale
equipment to African states. Furthermore,
the SIBA screening process ensures that
only projects with a high-value added
nature and not detrimental to the
environment should be accepted. There
were also some significant expansion on
existing companies, such as Chelle
Medical and Planus Dental Technology.
There was a record R309 million in
revenue generated from tuna industrial
fishing in 2000. This left the net revenue,
which includes expenditure in Port
Victoria, foreign fishing vessels
expenditure and license fees payments, to
around R170 million.
In February, SEYSAT Limited, a joint
venture company between the Seychelles
government and a foreign company, leased
the SEYSAT-1A slot to a satellite
operating company, NEWSAT-1. The
SEYSAT slot project was first initiated by
the government in 1988, following the
- 90 -

ANNUAL REPORT 2001 OFFSHORE AND INVESTMENT DEVELOPMENTS
- 91 -
availability of commercially attractive, but
unclaimed slots.
DISTAFRIC Company Ltd started its
operations within the SITZ. The company
specialises in importing IT products in
bulk, store them in Seychelles, and then
re-export them to Zimbabwe, Kenya and
South Africa.
A workshop involving the commercial
implications of interconnection was held at
the Berjaya Beau Vallon Bay Resort in
July. Forty delegates from the
Commonwealth Telecommunication
Organisation (CTO) attended the five-day
workshop, which was officially launched
by Mr Errol Dias, the Principal Secretary
for Information Technology and
Communication.
Seychelles first Internet Service Provider,
ATLAS, announced its plans for
expansion to its stakeholders. The
expansion, which involves the acquisition
of 60 additional modems to add to the
existing 30 analogue ones, was expected to
make ATLAS one of the fastest hubs in
the region. Further expansion by ATLAS
included the added international roaming
services to its customers.
The Savings Bank of Seychelles became
the fourth local bank to become a member
of VISA International network. The
project, which became operational in
September, was expected to be followed
by another venture, which involves the
issue of its own VISA EFTPOS terminals
to retail outlets. This would enable
payments to be made by credit and debit
cards.
The Banque Francaise Commercial (BFC)
adopted a more professional approach
following a change in management. The
bank has also increased its staff by 25 per
cent. Two further developments is the
launching of Internet banking in October,
and the expansion in its ATM facilities
from 5 to 6 machines by the end of the
year. The bank has also agreed to cater for
the needs of IBCs, ITZ companies and
other offshore corporate customers.
The Investment Desk issued an additional
21 ‘certificates of approval’ under the
Investment Promotion Act (IPA) 1994. At
the end of 2001, a total of 119 companies
had attained the IPA stature after their
approval by this body, with companies in
relation to ‘tourism development
investment’ receiving the bulk of these
certificates.
During the year, the Seychelles Industrial
Development Corporation (SIDEC)
reported that it had approved 57 cases for
assistance at a value of R78,000, whilst
total disbursement stood at R597,300. The
European Credit Line Project, which is
also under SIDEC's auspices, sanctioned a
total of R629,100 worth of loans, whilst
disbursing R594,000 in 2001.

ANNUAL REPORT 2001 OFFSHORE AND INVESTMENT DEVELOPMENTS
- 92 -
2. Offshore developments
The registration of International Business
Companies (IBCs) by the Seychelles
International Business Authority (SIBA)
was a key component of the country's
offshore sector. These IBCs are
incorporated in Seychelles through 18
registered agents, and these agents offer
the marketing for the country's offshore
services abroad. An IBC could be
registered in less than 2 hours, which is the
minimum reported time for registration.
During the year, a record 1,854 new
International Business Companies (IBCs)
was registered with the Seychelles
offshore industry. Rela tive to the
aggregate figure of 1,351 for 2000, there
was an increase of 503 IBCs in 2001,
representing a 37 per cent growth in
registration. Since 1995, there has been an
increasing trend in the number of
registered IBCs (Chart 7.1), bringing the
aggregate number of IBCs registered with
SIBA to a total of 8,013 at the end of the
year under review.
Chart 7.1. Number of IBCs registered per year and their cumulative totals
909
1134
1090
1340
1351
1854
1244
2378
3468
4808
6159
8013
1996
1997
1998
1999
2000
2001
Cumulative total
Total yearly registration
Furthermore, the year was a record
breaking one for SIBA. All the respective
quarters of the year recorded the highest
number of registration to date. The
recorded number of registered IBCs from
quarter one to quarter four were 440, 513,
422, and 479 respectively. This
performance is an indicator of SIBA's
established position as an offshore centre.
Over the past year, 11 new companies
were licensed to operate within the
Seychelles International Trade Zone
(SITZ). The fourth quarter again
accounted for the lion's share of activity
with 3 companies being licensed.
Nevertheless, it can be said that the limited
number of activities and the delay in
completion of infrastructure of the zone
are constrains that are holding back the
applications of prospective companies for
setting up their respective projects.
Furthermore, eleven trusts were registered

ANNUAL REPORT 2001 OFFSHORE AND INVESTMENT DEVELOPMENTS
- 93 -
during the course of the year, bringing the
total number to 32 by the end of the year.
During the fourth quarter, the company
registered six trusts, the highest figure in
one quarter.
Since the establishment of the SITZ in
1995, the year 2001 has been the most
successful year on record. The companies
that were licensed were engaged in a wide
range of activities. One notable activity is
the redistribution of EPSON point of sale
equipment. This involves the sea-to-air
redistribution concept, whereby the
products are imported in bulk by sea,
stored in Seychelles and exported to
African countries by air.
There are currently 24 active SITZ
companies, which have passed the
screening process of the SITZ Authority.
This screening ensures that accepted
projects are those, which will have a
positive impact on the local economy, of a
high-value added nature and not
detrimental to the environment.
Some existing companies, namely Chelle
Medical and Planus Dental Technology
were undergoing significant expansion
process. The former is involved in the
light assembly of laryngeal masks, whilst
the latter deals with the manufacturing of
dentures and other products.
The SITZ with US$150 million per annum
accounts for 22 per cent of all exports
from Seychelles. It is expected that once
the newly licensed companies are in place,
there will be a significant improvement in
total exports.
After experiencing a drop in 1998, revenue
from industrial tuna fishing activity
experienced an upward trend. Total
revenue reached a record R309 million
(US$56m) in the year 2000, with net
revenue standing at R170 million
(US$31m). By the end of 2001, it was
expected that the same pattern would be
maintained. Net revenue comprised vessel
expenditure in Port Victoria, spending by
foreign fishing companies and payment of
licenses for access to the Exclusive
Economic Zone (EEZ).
The commercialising of a satellite orbital
slot network, SEYSAT, first initiated by
the government in 1988, started during the
year. The project was initiated when there
were a few unclaimed but commercially
attractive orbital slots. SEYSAT is to be
developed into a four-slot project,
SEYSAT-1A, up to SEYSAT-4A.
According to SEYSAT Limited General
Manager, Dr George Ah-Thew, SEYSAT
is a joint venture between the Seychelles
Government and a foreign company,
which aims to maximise the commercial
benefits from the slots and spectrum

ANNUAL REPORT 2001 OFFSHORE AND INVESTMENT DEVELOPMENTS
- 94 -
resources made available to Seychelles.
The foreign company, which specialises in
orbital operations and provides the satellite
to commission the slots, holds 80 per cent
of the shares. Since February 2001, slot
SEYSAT-1A has been leased to
NEWSAT-1, a satellite operating
company. The satellite slot leasing is
expected to generate joint venture revenue
in the coming years.
DISTAFRIC Company Ltd, begun its
operations from its facilities in the SITZ.
The company was set up for the re-
distribution of IT products to the African
markets. It is the regional distributor for
Sub Saharan Africa of EPSON point of
sale and technology products. Such
products are stored in the SITZ, after
being imported in bulk from China,
Philippines and Japan by sea. The
products are then air freighted to countries
such as Zimbabwe, Kenya and South
Africa for delivery.
In July forty delegates from the
Commonwealth Telecommunication
Organisation (CTO) member countries
attended a five-day workshop at the
Berjaya Beau Vallon Bay Resort. The
workshop was officially launched by Mr
Errol Dias, the Principal Secretary for
Information Technology and
Communication. The theme of the
discussions involved the commercial
implications of interconnection.
The country's first Internet Service
Provider (ISP), ATLAS, marked its 5th
year of operations by assuring its
customers and stakeholders of its
commitment to further upgrade its systems
and services. It is expected that it will
become one of the fastest hubs in the
region, increasing its 64Kbps and 30
analogue modems with the installation of
60 additional modems. This will increase
ATLAS bandwidth of incoming calls to
4Mbps. During the middle of 2001,
ATLAS started to offer the services of
international roaming to its customers.
The Seychelles Savings Bank (SSB)
invested over Rs1 million (US$182,000)
in a major VISA project, which became
operational in September. This follows
the bank's ongoing endeavours to keep
abreast of technological innovation and
upgrade its customer services. This
development has made SSB the fourth
local bank following Nouvobanq, Barclays
and Banque Francaise, to become a
member of VISA international network.
Another venture to issue its own VISA
EFTPOS terminals to retail outlets is
currently underway.
Banque Francaise Commercial (BFC) has
taken a new focus on professionalism,
better services and improved efficiency
following a change of management. This
has resulted in a 25 per cent increase in its
staff, and has selectively recruited

ANNUAL REPORT 2001 OFFSHORE AND INVESTMENT DEVELOPMENTS
- 95 -
professionals at managerial and clerical
levels. It was also expected that the
number of its ATM would be increased
from 5 to 6 by the end of 2001. The bank
also started their Internet banking in
October. The bank is also dedicated to
cater for the specific needs of International
Business Companies (IBCs), ITZ
companies and other offshore corporate
customers.
3. Investment
3.1 The Investment Desk
During the year 2001, the onshore
investment in Seychelles maintained its
growing trend, which started in the
previous year. The investment desk
accorded 21 new businesses the
Investment Promotion Act (IPA) status,
compared to 14 in 2000. Furthermore,
there were two tourism related businesses,
which renewed their IPA certificates. Out
of these 21 new businesses, 15 were
‘tourism development’ investment, 3 were
‘agriculture and marine resources’
investments, 2 were ‘industrial and
manufacturing sector’ and 1 was
‘professional services’ investment. The
'boat charter' and the 'yachts and
liveaboard' categories had the bulk of the
'tourism development projects’ with 5 new
businesses being granted IPA status each.
Since the IPA came into effect in 1995,
there has been 108 Certificates of
Approval that has been issued. The bulk
of these certificates were issued to
companies in relation to ‘tourism
development investment’ category with
69, which reflects the government’s
persistent attempt to provide incentives to
develop and promote the country’s main
service industry. The other 47 companies
issued with certificates were as follows:
17 were ‘professional services’
investment; 13 were ‘industrial and
manufacturing sector’ investment; and 17
were ‘agriculture and marine resources
investment. The remaining one was on
account of a latest category, the
'professional services investment'.
3.2 SIDEC
3.2.1 Young Enterprise Scheme
During 2001, a total of 1,109 applications
for financial assistance were received by
the Small Business Bureau (SBB), which
manages the Young Enterprise Scheme
(YES), under the patronage of the
Seychelles Industrial Development
Corporation (SIDEC). The Loans
Committee reviewed 466 viable cases, of
which only 57 were approved for
assistance at a total value of R78,000.
However, disbursement during the year
amounted to a total of R597,300, which
comprised partly of loans approved during
the year and outstanding loans approved
prior to 2001.
Since it was launched in 1996, a total of
R51.1 million in loans for 1,513 small
enterprises have been approved, of which
a total of R49.3 million has already been

ANNUAL REPORT 2001 OFFSHORE AND INVESTMENT DEVELOPMENTS
- 96 -
disbursed. In terms of financial assistance,
the "fishing" sector remained the major
beneficiary with a share of 20 per cent of
the aggregate borrowing under the
scheme. This reflected the government's
effort to enhance the artisanal and semi-
industrial fishing sector, and thus
highlighted the role of fisheries in the
economy. Other major beneficiaries of
the YES scheme includes the "retailing",
"social services", "maintenance" and the
"agricultural" sectors with shares of 14 per
cent, 11 per cent, 10 per cent and 9.0 per
cent respectively.
3.2.2 European Union Credit Line
Project
Under the European Union Credit Line
Project a total of R629,100 in loans were
sanctioned, whilst disbursement stood at
R594,600. Since the project was
inaugurated in 1995, a total of R4.1
million has already been disbursed out of
the R7.0 million grants available under the
credit line at a concessionary rate of 3.0
per cent per annum.
Carpentry and handicraft businesses have
received the main assistance under the
project's finance with a combined share of
53 per cent of all total loans under the
project. The districts of Mont Fleuri has
benefited the most under the project with a
share of 7.9 per cent of total loans.
However, English River and Anse Boileau
remained major beneficiaries under the
project with a share of 7.2 per cent of total
loans each.

SECTION EIGHT
Operation and Administration Of the Central Bank1
1 All the data presented in this section is actual.
1. Overview
In its ongoing role as the monetary
authority, the Central Bank continued to
ensure that the financial system was
working efficiently throughout the year.
This was done through the compliance of
financial institutions to the respective acts,
namely the Financial Institutions Act.
Furthermore, the Bank continued to assist
the government in monitoring the
economic performance and to implement
new measures for further progress.
In terms of policy measures during the
year, there were changes to two key
indicators under the ambit of the Bank.
The first one is related to interest rates.
The last change in interest rates was
effected in September 1998 when the
Bank reduced the minimum savings to 3.0
per cent and that of the maximum lending
rate to 10.0 per cent. Since then, these two
rates have remained stable. As of
November 1, 2001, the Central Bank
abolished the maximum lending rate and
the banks are now allowed to set their own
lending rate. The second main indicator
that was changed relates to the local assets
ratio. This ratio dictates how much the
commercial banks have to investment in
government paper. Since November 1,
2001, this ratio has been reduced to 50 per
cent, down from 70 per cent, implemented
in September 1998.
2. Banking Services
2.1 Currency and Banking
Operations
The Banking Services Division is
responsible for the issuing of currencies;
managing accounts held with the Bank on
behalf of the government, commercial
banks, other local financial institutions,
foreign government agencies and
international agencies. It is also
accountable for the daily financial
transactions of the Bank and administers
temporary advances made to the
government, whilst closely monitoring the
external reserves. The sale of the
- 97 -

ANNUAL REPORT 2001 OPERATIONS AND ADMINISTRATION OF THE CENTRAL BANK
- 98 -
numismatic coins and dealings in notes
and coins with dealers abroad remained
another responsibility of the Division.
2.1.1 Government accounts
The government continued to rely to some
extent on the Central Bank to finance its
budget deficit. Total advances at the end
of the year averaged to R494 million,
which is R436 million higher than the
average amount of the previous year
(Table 8.1 & Chart 8.1). Likewise, there
was a 19 per cent increase in the end of
period advances for the year amounting to
R472 million. It is worth noting at the
outset that total advances to the
government is made of two main
components, namely short-term advances;
and foreign loans borrowed by the Central
Bank on-lend to the government. At the
end of the year, short-term advances
amounted to R116 million and the
difference was the foreign loan component
on lending.
Table 8.1
CBS Advances to government; 1996-2001 1996 1997 1998 1999 2000 2001
(R million) Advances1 542.4 734.6 874.8 547.2 58.3 493.9 Advances2 503.6 923.2 469.0 623.9 395.9 472.4
1 Yearly averages of monthly data compiled on an end-of-period basis. 2 End-of-period data.
(1) Average (2) End-of-period
Chart 8.1. Advances to Government
0
100
200
300
400
500
600
700
800
900
1000
1996 1997 1998 1999 2000 2001
(R m
illio
n)
-200.00
-100.00
0.00
100.00
200.00
300.00
400.00
500.00
600.00
700.00
800.00
Advances (1) Advances (2) Growth (1) Growth (2)

ANNUAL REPORT 2001 OPERATIONS AND ADMINISTRATION OF THE CENTRAL BANK
- 99 -
2.1.2 Currency issues
Total currency in circulation at the end of
the year increased by 6.0 per cent or R17
million amounting to R299 million relative
to R282 million in the previous year
(Table 8.2 &Chart 8.2). Out of the R299
million, R280 million worth was "currency
with the public", while the rest was cash at
banks. This year's growth in currency in
circulation represented a slowdown
compared to the previous year. The total
notes increased by 5.9 per cent standing at
R281 million while, coins had the largest
increase of 7.9 per cent relative to the
preceding year reporting an amount of
R18 million. Furthermore, the share of
notes declined whereas that of coins
increased by 0.1 per cent.
Table 8.2
Circulation of Notes and Coins;1 1996-2001 1996 1997 1998 1999 2000 2001
(R million) Total 174.20 202.97 219.24 264.27 282.23 299.24 Notes 160.50 189.07 204.29 247.94 265.27 280.94 Coins 13.70 13.90 14.95 16.33 16.96 18.30 (per cent) Share Notes 92.1 93.2 93.2 93.8 94.0 93.9 Coins 7.9 6.8 6.8 6.2 6.0 6.1 1 End-of-period data
Chart 8.2.Currency In Circulation
0
50
100
150
200
250
300
350
1996 1997 1998 1999 2000 2001
Year
(R m
illio
n)

ANNUAL REPORT 2001 OPERATIONS AND ADMINISTRATION OF THE CENTRAL BANK
- 100 -
2.1.3 Numismatic Issues
The sale of numismatic coins both local on
the market and abroad accumulated a total
revenue of R52,893, which was 39 per
cent lower than the level recorded in year
2000.
2.1.4 Accounts of commercial banks
The commercial banks have a mandatory
cash reserve ratio of 2.5 per cent of all
eligible deposits that they have to maintain
at the Central Bank. This requirement
remained unchanged during 2001 and all
the six commercial banks operating in
Seychelles were able to meet this
directive.
The activities of the banker’s clearing
house remained under the ambit of the
Central Bank. The total number of items
cleared stood at 609,284 showing a decline
of 1.8 per cent relative to the previous
year. As a result, the total amount cleared
showed a decline of 10 per cent standing
at R1.7 billion at the end of the year 2001
(Table 8.3).
Table 8.3
Bankers’ Clearing House Activities; 1996-2001 1996 1997 1998 1999 2000 2001
(Total) Number of items cleared 577,923 591,415 623,749 644,593 620,492 609,284 Amount (R’000) 1,161,2 1,327,170 1,543,457 1,641,388 1,861,626 1,676,372
(Daily average) Number of items cleared 2,309 2,394 2,536 2,568 2533 2,447 Amount (R’000) 4,621 5,373 6,274 6,539 7598 6,732
2.1.5 Other Accounts
The Central Bank continued to administer
two other groups of accounts on behalf of
the government in addition to the accounts
of government and those of banks. The
first set of account includes those of local
and international financial institutions,
foreign government agencies and accounts
in respect of the pipeline scheme. The
second group of accounts consisted of
several interest bearing “special funds” of
the government (labelled special deposits).
For the financial year ending December
2001, the balance on these accounts was
R814,305 showing an increase of 4.8 per
cent relative to the preceding year.
2.1.6 Annual Balances
At the end 2001, the net operating profit
reached an aggregate of R11 million
representing a fall of 43 per cent relative
to 2000. Total income declined by 30 per
cent mainly due to a R16 million declined
in "other income". Furthermore, there was
a fall of 23 per cent in total expenditure
regardless of the increase in administrative

ANNUAL REPORT 2001 OPERATIONS AND ADMINISTRATION OF THE CENTRAL BANK
- 101 -
expenses, currency expenses, depreciation
and maintenance of property and finance
and interest charges. In accordance with
Section 16 (1), Section 16(3) and Section
16(4) of the Central Bank of Seychelles
Act, as amended, the net profit was
appropriated to the General Reserve
Accounts in amounts determined by the
Board. The Revaluation and Reserve
Account, showed a credit balance of R20
million reflecting a gain on the revaluation
of Central Bank external reserve.
2.1.7 External Reserves
The official external gross reserve at the
end of the financial year 2001 stood at
R211 million, representing a decline of
R60 million relative to 2000. The SDR
holdings was SDR 18,336 equivalent to
R132,639 after accounting for the General
Reserve Account of IMF, whereas the
balance of the reserve tranche with the
Fund stood at nil at the end of December.
The SDR allocated to Seychelles by the
International Monetary Fund declined by
11 per cent to reach an amount of R2.9
million.
2.2 Administration and Public Dept
In accordance with the Local Loans Act,
1960, as amended in 1985 (stocks and
treasury bonds) and the Land Acquisition
Compensation Act, 1997 (land acquisition
bonds), the main function of the
Administration and Public Debt Division
remains the management of domestic
public debt instruments on behalf of the
government.
The major development for the year was
the introduction of a 7.5 per cent, 3-year
Treasury bond in September. With a limit
of R450 million, the bond was fully
subscribed by the end of the year.
Altogether four bonds reached maturity
during the year and this comprised of the
11 per cent 3-year bond issued in 1998,
6.75 per cent 2-year bond and 7.5 per cent
3-year bond both issued in 2000 and the
6.75 per cent 2-year bond issued in 1999.
The last bond was fully redeemed during
the year. Chart 8.3 shows the total stock
of the three different types of government
paper.
Chart 8.3. Stock of Public Debt Instruments
0
500
1000
1500
2000
2500
1996 1997 1998 1999 2000 2001
Years
Sto
ck (
Rm
illio
n-A
vera
ge)
Treasury bills Treasury bonds Government stocks

ANNUAL REPORT 2001 OPERATIONS AND ADMINISTRATION OF THE CENTRAL BANK
- 102 -
2.2.1 Treasury Bills
Since the introduction of the tap system in
September 1998, there has been no new
issues of treasury bills. Hence the 91-day
bills, 182-day bills and 365-day bills
remained with their actual limits of R700
million, R650 million and R650 million
respectively.
There were also no change in the rates
with annual yields for 91-day, 182-day and
365-day bills remaining at 4.5 per cent, 5.0
per cent and 5.5 per cent respectively
(Table 8.4). The total value of bills sold
during the year amounted to R4.6 billion,
showing a slight increase of 1.3 per cent
when compared to fiscal year 2000. This
was accounted for by the 1.1 per cent and
1.7 per cent increase in the sales of the 91-
day and 182-day bills respectively, whilst
the sale of the 365-day bills declined by
1.0 per cent. The slight change in the
amount of bills sold reflected the near
subscription for this government
instrument.
Table 8.4
Treasury Bill Yields;* 1996-2001
Issues 1996 1997 1998 1999 2000 2001
(per cent) Tender 91-day 11.51 - - - - - 182-day 11.67 - - - - - 365-day 11.71 - - - - - Tap 91-day 10.50 10.50 8.00 4.50 4.50 4.50 182-day - - 5.00 5.00 5.00 5.00 365-day - - 5.50 5.00 5.50 5.50
* Yearly averages of monthly data, compiled on an end-of-period basis.
Total redemptions outweighed sales by 0.2
per cent to stand at R4.6 billion. At this
level it was R139 million or 3.1 per cent
higher than the R4.5 billion reported
during the previous year.
Despite redemptions outweighing sales,
the average stock outstanding at cost value
continued to increase standing at R1.9
billion, representing a 2.3 per cent increase
(Table 8.5). Commercial banks remained
the main subscribers, holding a share of
R1.8 billion.

ANNUAL REPORT 2001 OPERATIONS AND ADMINISTRATION OF THE CENTRAL BANK
- 103 -
Table 8.5 Treasury Bills;1 1996-2001
1996 1997 1998 1999 2000 2001
(R million) Stock outstanding 1/3/ 766.0 757.7 876.4 1388.8 1889.8 1933.9 91-day bills (tap issue) 41.8 623.1 628.6 - - - 91-day bills4/ 187.1 - 117.1 599.8 679.3 689.5 182-day bills4/ 271.3 31.7 99.1 474.9 606.6 630.5 365-day bills4/ 265.8 102.9 31.7 314.1 603.8 614.1 Stock outstanding 2/3/ 830.9 788.9 897.1 1424.7 1945.7 1991.1 91-day bills (tap issue) 43.0 639.9 644.0 - - - 91-day bills4/ 198.3 - 118.2 606.6 687.0 697.2 182-day bills4/ 291.7 33.3 101.6 486.7 621.7 646.0 365-day bills4/ 297.9 115.6 33.4 331.4 637.0 647.9 Held by Central Bank 158.4 53.5 9.4 59.5 18.6 6.3 Commercial banks 502.9 581.0 724.7 1180.2 1709.5 1813.6 Savings Bank5 43.2 - - - - - Other financial institutions 9.5 7.9 2.9 8.5 18.0 10.4 Others 117.0 127.3 147.2 176.4 199.7 160.7 Citibank NA - 19.3 12.8 - - -
1 At cost value. 2 At face value. 3 Annual and quarterly data are averages of monthly data, compiled on an end-of-period basis. 4 With effect from September 15, 1998, new issues of 91-day, 182-day and 365-day bills were placed on tap. 5 Savings Bank holdings have been incorporated in that of commercial banks as it became a commercial bank in 1997.
2.2.2 Treasury Bonds
As noted above, a new issue of a 7.5 per
cent, 3-year bond was introduced in
September with a limit of R450 million.
This accounted for the high increase of
R174 million in sales of Treasury bonds,
amounting to a total R612 million for the
whole year compared to R438 million in
the previous year (Table 8.6). The bulk of
the sale was recorded in third quarter with
a total of R411 million sold.
Total redemptions rose by more than R300
million, standing at R555 million. Yet
again, the highest redemption was in the
third quarter of the year with R284
million. This was mainly due to the fact
that the 6.75 per cent 2-year bond issued in
1999 was fully matured in September.
Hence, stock outstanding for the year
averaged to R1.2 billion, compared to the
average R1.1 million in 2000. This
represented an increase of 6.8 per cent. As
in previous years, commercial banks still
held the largest share of the total, with
R931 million.

ANNUAL REPORT 2001 OPERATIONS AND ADMINISTRATION OF THE CENTRAL BANK
- 104 -
Table 8.6
Treasury Bonds;1 1996-2001 Authorised 1996 1997 1998 1999 2000 2001 Date Issued Limit
(R million) Stock outstanding 347.5 438.9 707.3 1255.8 1141.2 1218.7 03/08/01 7.5%, 3-yr - - - - - 146.3 25/09/00 6.75%, 2-yr - - - - 38.2 277.0 07/02/00 7.5%, 3-yr - - - - 210.1 300.0 15/09/99 6.75%, 2-yr 250.0 - - - 83.3 250.0 166.7 01/09/98 6.0%, 1-yr 500.0 - - 139.7 360.4 - - 01/09/98 6.75%, 2-yr 200.0 - - 44.3 199.6 157.3 0.4 01/09/98 7.5%, 3-yr 150.0 - - 17.5 149.1 150.0 132.5 01/09/98 8.0%, 5-yr 50.0 - - 2.3 34.6 50.0 50.0 01/02/97 11.0%, 3-yr 200.0 - 19.8 159.5 200.0 180.2 40.4 01/02/97 11.5%, 5-yr 150.0 - 13.6 85.3 105.5 105.5 105.5 01/10/95 12.0%, 3-yr 250.0 128.6 250.0 242.2 123.3 - - 01/09/93 12.5%, 2-yr 250.0 64.7 13.4 - - - - 15/11/92 12.0%, 5-yr 150.0 150.0 141.2 16.5 - - - 01/08/90 16.5%, 3-yr 10.0 - - - - - - 01/08/90 16.5%, 5-yr 10.0 4.2 0.9 - - - - Held by Central Bank 23.5 20.0 1.8 0.1 0.1 0.0 Commercial banks 195.4 317.9 565.6 1040.1 903.7 930.8 Savings Bank2 38.6 - - - - - Other financial institutions 8.1 2.5 1.5 0.0 0.0 - Others 81.9 98.5 138.5 215.7 237.4 287.9
1 Annual data are averages of monthly data, compiled on an end-of-period basis. 2Savings Bank holdings have been incorporated in that of commercial banks as it became a commercial bank in 1997.
2.2.3 Seychelles Stocks
For the current year, the only government
stock available on the market was the 8.0
per cent stock redeemable in 2009, which
recorded a total sale of R39 million. At
this point it was R35 million higher than
the level recorded in 2000. There were no
transactions in the redemptions of stocks
for the year, resulting in a 20 per cent
increase in the stock outstanding averaging
to R124 million (Table 8.7). This was
being held entirely by commercial banks,
which indicates an increase of R24 million
relative to the preceding year.

ANNUAL REPORT 2001 OPERATIONS AND ADMINISTRATION OF THE CENTRAL BANK
- 105 -
Table 8.7 Government Stocks;1/2/ 1996-2001
Authorised 1996 1997 1998 1999 2000 2001 Limit
(R million) Stock outstanding 73.6 78.7 86.5 91.9 99.9 124.2 8.00%, 2009 50.0 - - - 2.1 9.9 34.2 8.50%, 2005/07 30.0 - 18.7 26.5 29.8 30.0 30.0 8.00%, 2004 60.0 58.9 60.0 60.0 60.0 60.0 60.0 9.50%, 1993/97 14.7 14.7 - - - - - Held by Central Bank 3.6 0.0 0.0 0.0 0.0 0.0 Commercial banks 62.1 78.7 86.5 91.9 99.9 124.2 Savings Bank3 5.4 - - - - - Other financial institutions 2.5 0.0 0.0 0.0 0.0 0.0
1 Yearly averages of monthly data, compiled on an end-of-period basis. 2 At cost value. 3Savings Bank holdings have been incorporated in that of commercial banks as it became a commercial bank in 1997.
2.3 Banking Supervision
The Bank Supervision Division was again
upholding its duties of conducting
inspections to all the commercial banks
operational in the country. Altogether, the
division carried out nine inspections
during 2001. The Division completed the
on-site inspection of one bank and also
carried eight spot inspections in all other
banks including the Bureau De Change.
2.3.1 Minimum Required Capital and Investment of Capital Funds
For the year under review, no alteration was made in the minimum reserve requirement of the commercial banks and all of them were able to meet this requirement. At the end of the year, the capital funds ratio averaged R211 million, 2.6 per cent higher than the R205 million reported last year (Table 8.8). This comprised the assigned capital and reserve fund, which accumulated R111 million and R100 million respectively.
Table 8.8 Capital Fund Ratios of Commercial Banks;1 1996-2001
1996 1997 1998 1999 2000 2001
(R million)
Capital Funds 127.77 147.77 170.54 188.48 205.16 210.60 Assigned capital 79.04 90.75 100.97 104.45 110.75 110.80 Reserve fund 48.73 57.03 69.57 84.03 94.41 99.80 Minimum required capital funds (5% of A) 2/3/ aA
57.56 83.67 112.08 124.10 - - Memorandum item Eligible deposit liabilities (A) 1151.18 1673.3 2241.64 2482.05 - - 1 Annual averages of monthly aggregates compiled on a monthly basis.
2 Figure for 1999 relate to the first four months only. 3 As of May 1999, the Minimum required capital was replaced by a new requirement known as the Risk Weighted Capital Adequacy Ratio (RWCAR) set at a minimum of 8.0 per cent.

ANNUAL REPORT 2001 OPERATIONS AND ADMINISTRATION OF THE CENTRAL BANK
- 106 -
2.3.2 Minimum Reserve
Requirements and Local Assets
Ratio
During the year 2001, the minimum
reserve requirement eligible deposits to be
maintained by all banks as deposits with
the Central Bank remained fixed at 2.5 per
cent (Table 8.9). However, the outcome at
the end of the financial year 2001 was 4.8
per cent, an increase of 1.0 per cent
relative to the 3.8 percent of the previous
year.
Table 8.9
Minimum Reserves and Local Assets Ratio;1 1996-2001
1996 1997 1998 1999 2000 2001 (per cent)
Minimum reserve requirement Statutory limit 20.00 20.00 14.62 2.50 2.50 2.50 Outcome 21.01 21.49 21.62 3.56 3.79 4.76 Minimum local assets Statutory limit 50.00 50.00 55.83 70.00 70.00 66.54 Outcome 60.41 60.53 71.85 97.11 95.83 95.03
1 Yearly averages of weekly data. Note: Minimum local assets ratio was reduced to 50 per cent in November 2001.
As regards the local assets ratio, again all
the commercial banks were able to meet
the directive and it was even higher than
the prescribed limit. For all the banks
together, the actual outcome stood at 95
per cent. From January to October the
local asset ratio was maintained at 70 per
cent. As of November 1, 2001, the Central
Bank reduced it to 50 per cent to allow the
banks to subscribe to the housing loan
scheme.
2.3.3 Advances against government
securities
Advances against securities is a facility
extended to commercial banks in times of
liquidity shortage. Total advances for the
year declined by 48 per cent or R231
million standing at R255 million (Table
8.10). With a maturity of 14 days, most of
the advances were repaid during the year.
Hence, total repayments stood at R277
million, R22 million higher than total
advances. The stock of credit for the year
averaged to R4 million showing a decline
of 34 per cent compared to the R6.1
million of the previous year. The reduced
level of advances taken by banks during
the year reflected to some extent their
increased liquidity position.

ANNUAL REPORT 2001 OPERATIONS AND ADMINISTRATION OF THE CENTRAL BANK
- 107 -
Table 8.10 Temporary Advances against Government Securities; 1996-2001
1996 1997 1998 1999 2000 2001
(R million) Advances 315.6 189.5 151.3 318.0 485.4 254.7 Repayments 317.3 189.5 141.3 328.0 463.4 276.7 Stock of credit1 8.4 4.9 3.5 6.6 6.1 4.0 1 Yearly data are averages of monthly data, compiled on an end-of-period basis.
2.3.4 Government of Seychelles
Concessionary Re-finance
Scheme
The scheme provides finance to export-
oriented and import-substitution industries
and is administered by the Bank on behalf
of the Ministry of Finance. During the
year, the Ministry of Finance approved
only one line of credit worth R2.0 million.
There was a drop of 49 per cent in total
advances disbursed under the scheme with
an overall amount of R3.5 million (Table
8.11). In addition to that, total repayments
fell by 77 per cent standing at R5.1
million. It is worth noting that the decline
in advances under the scheme reflects the
introduction of other schemes, which are
targeting this group of economic activity
and at the same time with the maturity
profile of these loans standing at 5 years,
most companies under the scheme are near
the end of their loan repayment.
Table 8.11 Government of Seychelles Re-finance Scheme; 1996-2001
1996 1997 1998 1999 2000 2001
(R million) Stock of credit1 25.7 26.1 38.4 21.3 4.9 2.2 Of which: Export-oriented: Private sector 7.7 10.5 23.4 6.3 3.7 2.2 Public sector 18.1 15.7 15.0 15.0 1.3 0.0 Advances 56.4 55.5 89.5 43.1 6.9 3.5 Repayments 52.0 57.7 68.0 71.6 22.6 5.1
1 Yearly data are averages of monthly data, compiled on an end-of-period basis.

ANNUAL REPORT 2001 OPERATIONS AND ADMINISTRATION OF THE CENTRAL BANK
- 108 -
2.3.5 Advances to non-Seychellois
The Central Bank was again reporting the
total advances disbursed to non-
seychellois investors and private
individual by commercial banks. During
the course of the year, total advances
amounted to R47 million, representing an
increase of R26 million compared to the
preceding year (Table 8.12). The tourism-
related sector was the main beneficiary of
the scheme with R36 million covering 76
per cent of the total advances distributed.
Table 8.12
Commercial Bank Advances to Non-Seychellois;1 1999-2001 1 9 9 9 2 0 0 0 2 0 0 1 Limit Outstanding Limit Outstanding Limit Outstanding R million % R million % R million % Advances 30.5 20.6 46.7 Tourism 15.9 (52.3) 12.8 (61.9) 35.5 (75.8) Wholesale/retail 0.0 (0.0) .. (0.2) 0.2 (0.4) Building and construction 0.1 (0.2) 0.2 (0.9) 0.9 (1.9) Manufacturing 0.0 (0.0) 0.0 (0.0) 1.2 (2.6) Agriculture 0.0 (0.0) 0.0 (0.0) 0.0 (0.0) Fishing 0.2 (0.7) 0.2 (1.1) 0.5 (1.2) Real estate 0.7 (2.3) 0.0 (0.0) 0.0 (0.0) Individuals & households 1.5 (4.8) 1.2 (5.7) 2.0 (4.4) Other businesses 12.1 (39.7) 6.2 (30.1) 6.4 (13.8)
1 End-of-period data
2.3.5 Advances to parastatals
Credit extended to parastatals
organisations, jointly controlled by the
Central Bank and the Ministry of Finance
was set up at a ceiling of R40 million at
the end of the year 2001 (Table 8.13).
However, the outstanding balance stood at
R11 million compared to R21 million in
the year 2000. The largest share of the
commercial banks credit to such economic
entities was accredited to the tourism
industry with an aggregate of 62 per cent,
followed by the "building and
construction" sector with 32 per cent of
the total.

ANNUAL REPORT 2001 OPERATIONS AND ADMINISTRATION OF THE CENTRAL BANK
- 109 -
Table 8.13
Commercial Bank Advances to Parastatals;1 1999-2001 1 9 9 9 2 0 0 0 2 0 0 1 Limit Outstanding Limit Outstanding Limit Outstanding R million % R million % R million % Advances 68.6 27.6 44.9 20.8 40.4 10.5 Tourism 5.5 3.1 (11.2) 11.0 6.9 (33.3) 7.5 6.6 (62.1) Wholesale/retail 0.0 0.0 (0.0) 0.0 0.0 (0.0) 0.0 0.0 (0.0) Building and construction 34.5 20.2 (73.2) 30.0 11.8 (56.7) 30.0 3.4 (32.4) Manufacturing 2.5 1.5 (5.4) 2.5 1.0 (4.7) 2.5 0.4 (4.1) Agriculture 0.4 0.4 (1.4) 0.4 0.4 (2.1) 0.4 0.1 (1.4) Fishing 1.0 0.8 (2.9) 1.0 0.7 (3.2) 0.0 0.0 (0.0) Transport 13.7 1.6 (5.8) 0.0 0.0 (0.0) 0.0 0.0 (0.0) Communications 11.0 0.0 (0.0) 0.0 0.0 (0.0) 0.0 0.0 (0.0) 1 End-of-period data
2.3.6 Advances to wholesale and retail
trade
The Central Bank continued to monitor
commercial banks credits to wholesale and
retail traders. Following that of the
previous year all activities were on the
account of the private sector with total
advances standing at R22 million.
2.3.7 Pipeline foreign exchange
payment scheme
Throughout the year 2001, the monetary
authority focused its priorities on
improving the foreign exchange inflows.
The main target was to increase the
foreign exchange receipts through the
official channel and to reduce the activities
of the parallel market. As a first step, the
government together with the Central
Bank introduced a set of foreign exchange
measures on June 1, 2001 to achieve this
aim. As a result of the new implemented
laws, total inflows into the commercial
banks increased by 11 per cent to amount
to R835 million compared to R755 million
reported in the previous year. The highest
revenue increase was recorded during the
second half of the year representing a 37
per cent increase relative to the same
period in 2000. The bulk of the total
foreign exchange inflow was recorded in
September with an amount of R99 million.
Having achieved this objective
successfully, the government expects to
intensify its efforts to increase the foreign
exchange inflows in the coming year for
the benefits of the country.
2.3.8 Banking Licences
The commercial banks operating in
Seychelles renewed their licences in
accordance with the Financial Institutions
Act 1984, as amended and the Licences
Act 1986, and with the Financial
Institutions (Domestic Banking Business)
Regulations, 1996. Only one new

ANNUAL REPORT 2001 OPERATIONS AND ADMINISTRATION OF THE CENTRAL BANK
- 110 -
institution was licensed to conduct
Investment Banking Business.
3. Research and Statistics
For the period of the year 2001, the main
duties of the Research and Statistics
Division was to advise Government and
the Board of Directors on general
economic issues. It was also responsible
for the dissemination of information to the
public through the Bank’s quarterly
reviews and annual reports.
During the year, the Division also created
new initiatives. With the internet medium
becoming a platform for the exchange and
dissemination of information, the Bank
through the Division decided to create its
own web-site. Through training from the
South African Development Community
(SADC) IT Forum, staff from the Division
were able to design the website for the
Central Bank of Seychelles which
officially came online in mid-September,
2001 with the following address:
www.cbs.sc. From then on the public was
able to acquire information such as the
publications of the Bank, which include
recent quarterly reviews and annual
reports, daily exchange rates, important
economic statistics and other
administrative matters. The Division is
also the liaison office with most
international organisation for which the
Bank has to provide statistical
information.
4. Administrative Matters
4.1 Higher Education and Training
4.1.1 General
Miss Juliette Bertin, Data Processing
Supervisor, attended the SADC Central
Banks IT Forum Training Programme on
web-site design, which was held in
Pretoria, South Africa during the period of
January 29 to February 2. She also
attended the Networking Course, which
was held at the same venue from March 19
to 23.
Mr. Darell Edmond, Senior Bank Clerk
attended the SADC Central Banks IT
Forum Training Programme on Service
Level Management, which was held in
South Africa, during the period September
10 to 14.
In September, Miss Juliette Bertin, Data
Processing Supervisor was granted study
leave for three academic years to undergo
a course at Coventry University, in United
Kingdom leading to a Bachelor’s Degree
in Business Computing.
Mr. Philip Moustache, Bank Supervision
Officer was nominated to attend the Sub-
Regional Training Workshop on
combating money laundering which was
held in Switzerland during the period
November 19 to 23.
Mr. Philip Pierre and Miss Dorotha Michel
resumed duties both as Research Officers

ANNUAL REPORT 2001 OPERATIONS AND ADMINISTRATION OF THE CENTRAL BANK
- 111 -
on June 13 and December 17 respectively
after successfully completing their degree
in Economics. Miss Dorotha Michel was
on a 6-months study leave at La Trobe
University, Melbourne, Australia while
Mr. Philip Pierre, was at the University of
Wales, Aberystwyth, UK on a 3-year
study leave.
4.2 Courses, Workshops and
Seminars
Ms Maryline Joseph, Bank Supervision
Officer attended the Eastern Southern
African Forum (ESAF) Banking
Supervisors Group-Regional Workshop,
which was held in Cape Town, South
Africa from January 8 to 12.
Ms Jennifer Morel, Director General
Supervision attended a seminar on on-site
and off-site supervision, which was held in
Basel Switzerland from June 26 to 28.
Mr. Patrick Stravens, the Monetary and
Banking Advisor attended a workshop in
Pretoria, South Africa from July 2 to 3.
The subjects covered were the strategic
framework for payment, clearing and
settlement systems, exchange controls,
legal and operational framework of SADC
Central Banks and Information
Technology.
Mr. Philip Moustache the Bank
Supervision Officer attended the Risk
Based Bank Supervision course in
Nairobi, Kenya from July 9 to 13. The
objectives of the course were to expose
participants to the practical and hands-on
bank supervision practices and also to
discuss contemporary bank supervision
policies, practices and procedures that will
contribute to efficient examination
process.
Mr. Jean-Claude D’Offay, Director
General Administration and Public Debt
attended the T&D Forum and SADC
Conference on Human Resources, which
was held in Windhoek, Namibia during the
period August 6 to 9. The objective of the
conference was to share experiences on
local and international best practices of
human resources policies and procedures
in order to improve the management of
human resources in SADC Central Banks.
Ms Jennifer Morel, Director General Bank
Supervision attended a workshop on
Banking and Finance which was held in
Malta from 1 to 12 October. The aim of
the workshop was to disseminate
knowledge and provide training on
banking and finance, covering a variety of
themes with a focus on small states.
Another objective of the course was to
enable the participants to benefit from the
sharing of ideas and experiences during
discussions.
Mr. Jacques Berlouis, Treasurer, attended
a one-week work attachment at the Bank
of Mauritius from October 10. The aim of
the attachment was to work into the

ANNUAL REPORT 2001 OPERATIONS AND ADMINISTRATION OF THE CENTRAL BANK
- 112 -
system of collecting, sorting and
distribution of soiled and mutilated notes
and discuss measures against forging and
counterfeit currency.
Mr. Pierre Laporte, Director General of
Research and Statistics was nominated to
attend a workshop on Financial Markets
and Derivatives which was held during the
period October 15 to 19 in Pretoria, South
Africa. The purpose of the workshop was
to familiarise participants with practical
aspects of financial market activities such
as stock exchange trading, the basics of
derivatives and also financial market
activities in a Monetary Union.
Mr. Philip Pierre, Research Officer
attended the 4th Workshop on Statistics for
SADC Central Banks held during the
period October 17 to 26 in South Africa.
Balance of Payments, monetary statistics
and government statistics were topics
being discussed during the workshop,
which were all based on IMF manuals.
Ms Jennifer Morel Director General
Banking Supervision attended the focused
seminar: Offshore Banking Centres held in
Basel, Switzerland during the period
November 28 to 29.
Mr. Patrick Stravens, Director General of
Banking Services, Monetary and Banking
Advisor attended the Euro presentation,
which was held in Nairobi, Kenya on
November 29.
4.3 Official meetings and visits
Mr. Jean-Claude D’Offay, Director
General Administration and Public Debt
attended the COI Banking and Finance
meeting in Mauritius from November 8 to
9.
4.4 Resignation and Appointment
Mr. Patrick Stravens, Director General
Banking Services, resigned from his post
in February and was subsequently
appointed as Monetary and Banking
Advisor to the Bank with effect from
February 9.
Mr. Bernard Vel, Director General of
Administration and Public Debt, resigned
from the services of the Bank and Mr
Jean-Claude D’Offay became his
successor on January 16.
Mr. Norman Weber, Governor, resigned
from the services of the Bank. With his
departure, the President announced the
appointment of Mr. Francis Chang-Leng,
General Manager as his successor. With
Mr. Chang-Leng assuming the office of
the Governor, Dr. Peter Larose, Advisor in
the Ministry of Finance, was appointed
General Manager of the Bank.
Miss Caroline Abel, Research Officer, was
promoted to the post of Senior Research
Officer in the Research & Statistics
Division, effective June 1.

ANNUAL REPORT 2001 OPERATIONS AND ADMINISTRATION OF THE CENTRAL BANK
- 113 -
5. Board of Directors
With the departure of Mr. Norman Weber
as Governor of the Bank early in the year,
the Board of Directors changed. With Mr.
Francis Chang-Leng appointed as
Governor, he became the new Chairman of
the Board. Mr. Errol Dias and Mr. Francis
Chang-Sam remained as Directors. Mr.
Jean-Claude D’Offay was appointed as the
new secretary to the Board, replacing Mr.
Patrick Stravens. During the year, the
Board held three meetings.