central america regional competitiveness and integration...
TRANSCRIPT
Central America
Regional Competitiveness and Integration
Interim Report
May 27, 2012
Overview of Study
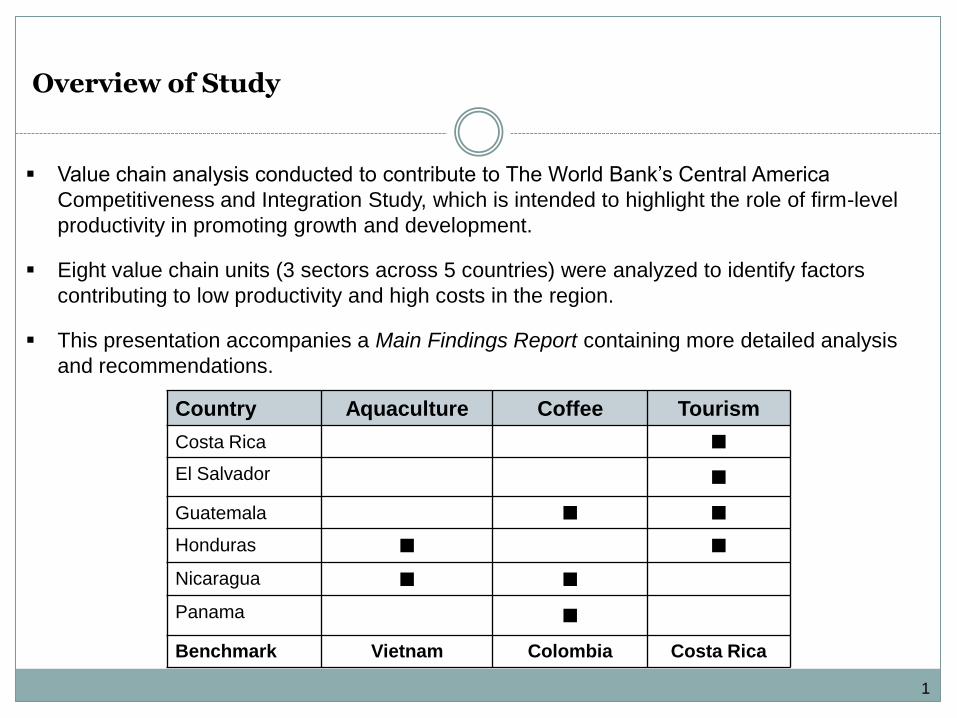
Country Aquaculture Coffee Tourism
Costa Rica
El Salvador
Guatemala
Honduras
Nicaragua
Panama
Benchmark Vietnam Colombia Costa Rica
Value chain analysis conducted to contribute to The World Bank’s Central America
Competitiveness and Integration Study, which is intended to highlight the role of firm-level
productivity in promoting growth and development.
Eight value chain units (3 sectors across 5 countries) were analyzed to identify factors
contributing to low productivity and high costs in the region.
This presentation accompanies a Main Findings Report containing more detailed analysis
and recommendations.
1
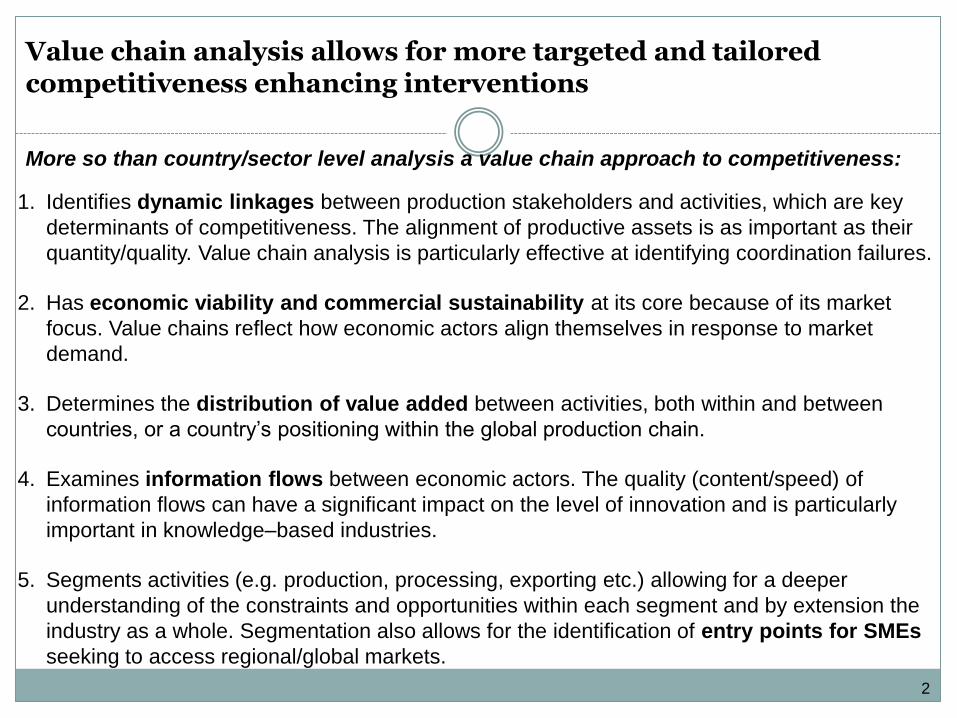
1. Identifies dynamic linkages between production stakeholders and activities, which are key
determinants of competitiveness. The alignment of productive assets is as important as their
quantity/quality. Value chain analysis is particularly effective at identifying coordination failures.
2. Has economic viability and commercial sustainability at its core because of its market
focus. Value chains reflect how economic actors align themselves in response to market
demand.
3. Determines the distribution of value added between activities, both within and between
countries, or a country’s positioning within the global production chain.
4. Examines information flows between economic actors. The quality (content/speed) of
information flows can have a significant impact on the level of innovation and is particularly
important in knowledge–based industries.
5. Segments activities (e.g. production, processing, exporting etc.) allowing for a deeper
understanding of the constraints and opportunities within each segment and by extension the
industry as a whole. Segmentation also allows for the identification of entry points for SMEs
seeking to access regional/global markets.
Value chain analysis allows for more targeted and tailored competitiveness enhancing interventions
More so than country/sector level analysis a value chain approach to competitiveness:
2
Contents
1. Regional overview
2. Aquaculture value-chain
3. Tourism value-chain
4. Coffee value chain
3
Regional Overview
The need to shift the regional integration agenda
1. The rise of global value chains means competitiveness is now increasingly defined by non-
traditional factors such as private standards for market access, transport and logistic costs,
and network interoperability. Productivity, product customization, and time to market are more
important now than ever before.
2. The rise of global value chains has shifted the regional integration agenda from traditional
state-led free trade initiatives to the development of regional public goods such as intra-
regional transportation networks, market intelligence, production technologies and research
and development resources.
3. The development of regional public goods i.e. non-tradables such as infrastructure,
harmonized product standards and customs procedures is particularly important for regions
like Central America where countries share similar export product portfolios.
4. Central America has made significant progress on the traditional regional integration agenda
of lower tariffs and free trade agreements. The average MFN tariff has fallen from 40% to
10% since the 1980s. There are now 42 free trade agreements covering 237 bilateral
relationships representing 89% of intra-LAC trade.
5. The regional integration agenda in Central America has not adequately evolved to help firms
in the region access global value chains and compete effectively against foreign competition.
4
Regional Overview
The Lack of Regional Public Goods
1. Central America not effectively levering its proximity – in both a physical and cultural sense
- to major markets like the United States and the EU. The aquaculture, coffee, and tourism
value chains are weakened by poor market intelligence and trade promotion.
2. Weak end-market linkages lead to a poor understanding of customer needs resulting in
missed product development, value-addition, and branding opportunities.
3. All three value chains are weakened by a lack of research and development, technical
extension services, and poor intraregional transport and logistic networks.
4. International transport linkages could be improved; however the biggest challenges relate
to weak logistics and customs procedures that can cause shipping delays, product loss,
and impede product traceability and certification processes, which are increasingly
important for agribusiness products like coffee and aquaculture.
5. Coordinated efforts between public and private sector required to shift integration agenda
and build competitiveness are lacking.
5
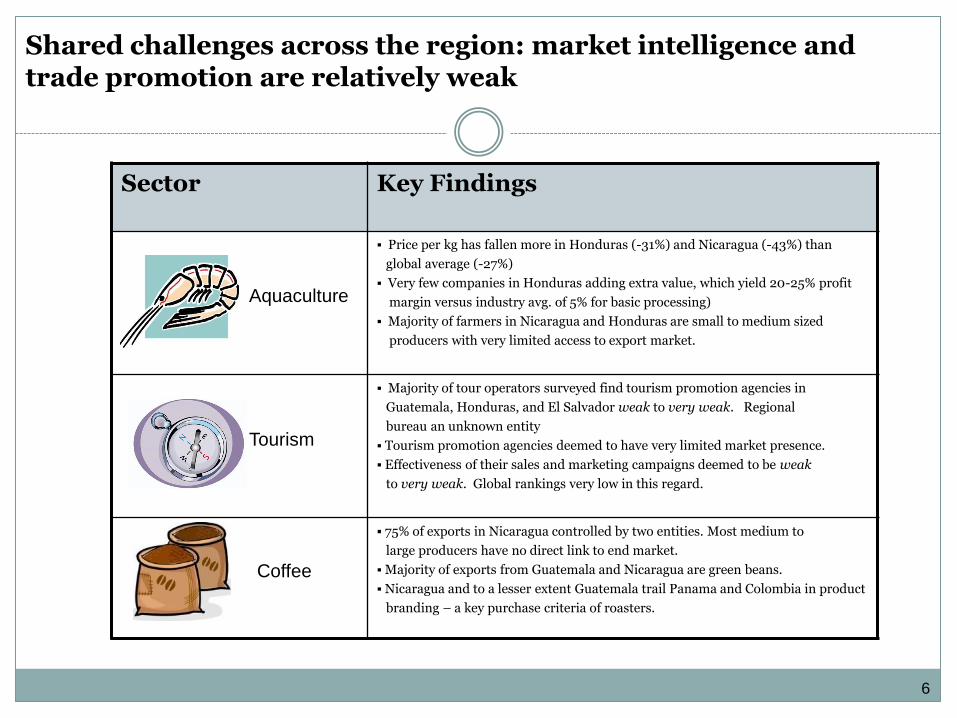
Shared challenges across the region: market intelligence and trade promotion are relatively weak
Sector Key Findings
Price per kg has fallen more in Honduras (-31%) and Nicaragua (-43%) than
global average (-27%)
Very few companies in Honduras adding extra value, which yield 20-25% profit
margin versus industry avg. of 5% for basic processing)
Majority of farmers in Nicaragua and Honduras are small to medium sized
producers with very limited access to export market.
Majority of tour operators surveyed find tourism promotion agencies in
Guatemala, Honduras, and El Salvador weak to very weak. Regional
bureau an unknown entity
Tourism promotion agencies deemed to have very limited market presence.
Effectiveness of their sales and marketing campaigns deemed to be weak
to very weak. Global rankings very low in this regard.
75% of exports in Nicaragua controlled by two entities. Most medium to
large producers have no direct link to end market.
Majority of exports from Guatemala and Nicaragua are green beans.
Nicaragua and to a lesser extent Guatemala trail Panama and Colombia in product
branding – a key purchase criteria of roasters.
Tourism
Aquaculture
Coffee
6
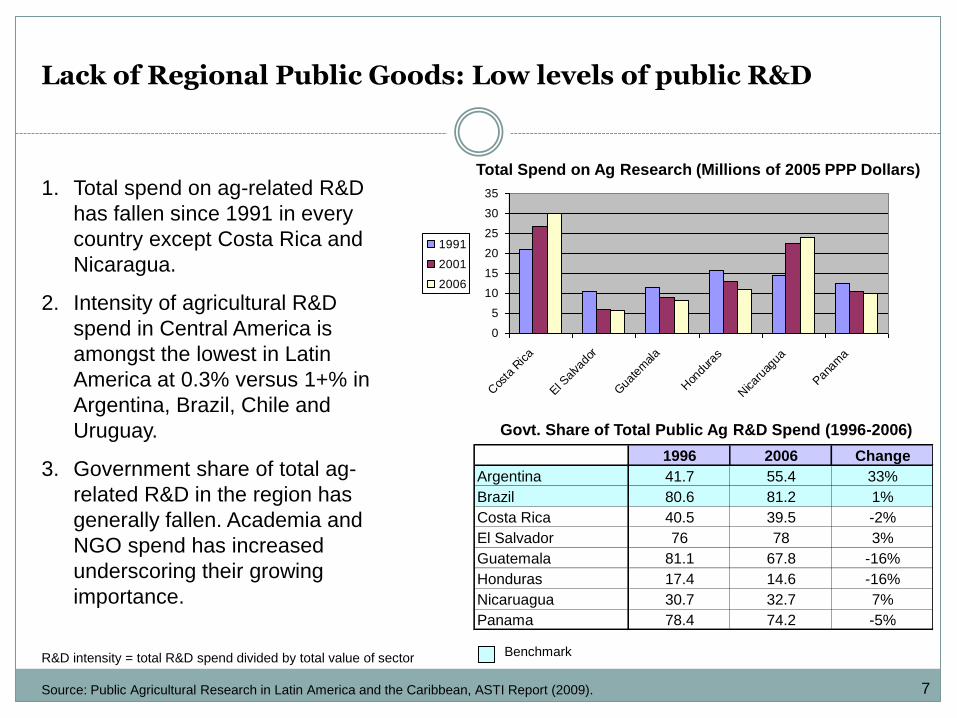
Lack of Regional Public Goods: Low levels of public R&D
Source: Public Agricultural Research in Latin America and the Caribbean, ASTI Report (2009).
Govt. Share of Total Public Ag R&D Spend (1996-2006)
0
5
10
15
20
25
30
35
Cos
ta R
ica
El S
alva
dor
Gua
tem
ala
Hon
dura
s
Nicar
uagu
a
Pan
ama
1991
2001
2006
Total Spend on Ag Research (Millions of 2005 PPP Dollars)
1. Total spend on ag-related R&D
has fallen since 1991 in every
country except Costa Rica and
Nicaragua.
2. Intensity of agricultural R&D
spend in Central America is
amongst the lowest in Latin
America at 0.3% versus 1+% in
Argentina, Brazil, Chile and
Uruguay.
3. Government share of total ag-
related R&D in the region has
generally fallen. Academia and
NGO spend has increased
underscoring their growing
importance.
R&D intensity = total R&D spend divided by total value of sector
7
1996 2006 Change
Argentina 41.7 55.4 33%
Brazil 80.6 81.2 1%
Costa Rica 40.5 39.5 -2%
El Salvador 76 78 3%
Guatemala 81.1 67.8 -16%
Honduras 17.4 14.6 -16%
Nicaruagua 30.7 32.7 7%
Panama 78.4 74.2 -5%
Benchmark
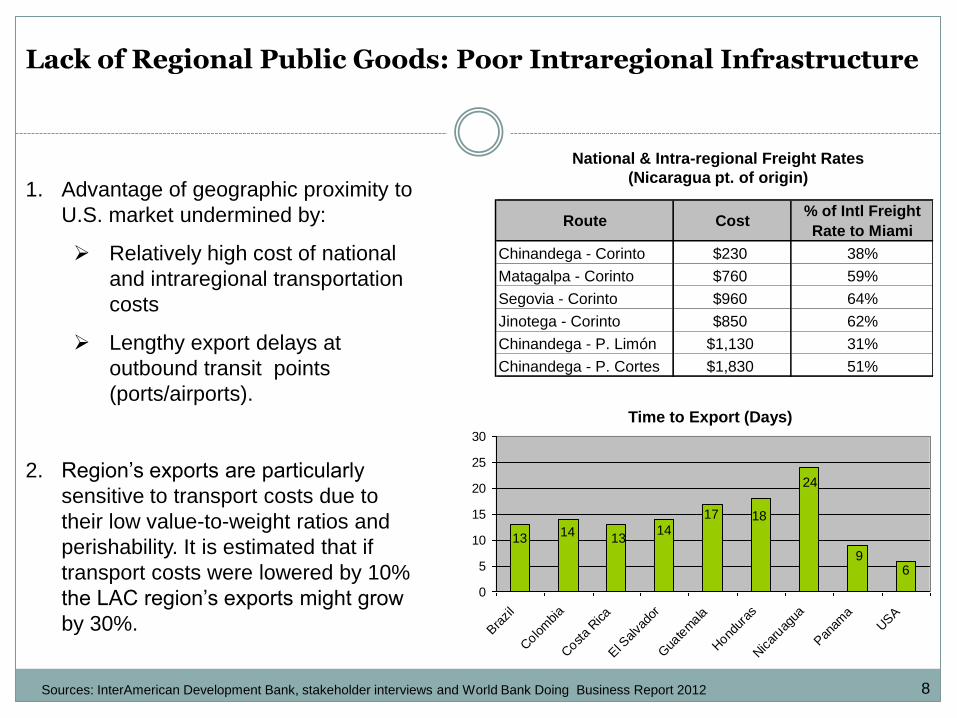
Lack of Regional Public Goods: Poor Intraregional Infrastructure
1. Advantage of geographic proximity to
U.S. market undermined by:
Relatively high cost of national
and intraregional transportation
costs
Lengthy export delays at
outbound transit points
(ports/airports).
2. Region’s exports are particularly
sensitive to transport costs due to
their low value-to-weight ratios and
perishability. It is estimated that if
transport costs were lowered by 10%
the LAC region’s exports might grow
by 30%.
0
5
10
15
20
25
30
Bra
zil
Colo
mbia
Cost
a Rica
El S
alva
dor
Gua
temala
Hond
uras
Nicar
uagua
Pan
ama
USA
Time to Export (Days)
24
18
6
17
13
9
14 13
14
National & Intra-regional Freight Rates
(Nicaragua pt. of origin)
Sources: InterAmerican Development Bank, stakeholder interviews and World Bank Doing Business Report 2012 8
Route Cost% of Intl Freight
Rate to Miami
Chinandega - Corinto $230 38%
Matagalpa - Corinto $760 59%
Segovia - Corinto $960 64%
Jinotega - Corinto $850 62%
Chinandega - P. Limón $1,130 31%
Chinandega - P. Cortes $1,830 51%
Lo
w
Med
ium
H
igh
Lack of Regional Public Goods: coordinated efforts between public and private sector required to effectively shift integration agenda are lacking
Investment Climate for PPP in Latin
America and the Caribbean
Source: Evaluating the Environment for public-Private Partnerships in Latin America and the Caribbean: The 2010 Infrascope, Economist Intelligence Unit 2010
1. The costs and benefits of regional
integration can be highly asymmetric
undermining the consensus national
governments require to pursue an
integration agenda.
2. Only Panama is deemed to possess an
investment climate that is highly conducive
to public private partnerships for
infrastructure projects. This is problematic
given the need to improve the region’s
transport infrastructure.
3. Latinobarometro survey results indicate
that support for economic integration in
Latin America and the Caribbean has
declined steadily since the late 1990s.
9
Regional Overview
Overarching recommendations
1. Improve the quantity and quality of regional public goods (RPG). The competitiveness of
aquaculture, coffee, and tourism in the region have been undermined by a lack of R&D,
market intelligence, and trade promotion. All three of these RPGs could be provided more
effectively and efficiently on a regional basis versus country-level institutions and initiatives.
2. Improve security: exporters in the region incur both explicit and hidden security costs. Added
transport and security service fees represent explicit costs; however, actual security costs are
much higher if the cost of lost tour business (region-wide) and early harvesting of crops to
avoid theft (aquaculture in Nicaragua) are also included.
3. Reduce transport and logistics costs. Transport and logistics costs constitute one of the
biggest obstacles to the region’s competitiveness in aquaculture, coffee, and tourism. To
reduce delays and improve the region’s time to market performance port and airport cargo
handling procedures should be streamlined and customs documentation standardized across
countries and modes of transport.
10
Regional Overview
Overarching recommendations
4. Redefine proximity to market: Getting close to the customer in terms of understanding their
product and service needs is more important than geographic proximity. The majority of
shrimp exports are in commodity form and the vast majority of coffee exports are made-up of
green beans with limited specialty coffee designations indicating more value can be captured
by understanding/satisfying end-customer needs.
5. Create a constituency for, and technical capacity to pursue, a regional integration agenda.
The opportunity cost of not pursuing increased regional integration should be made more
explicit. Technical capacity of regional and national institutions to pursue regional integration
in close consultation with the private sector should be improved.
11
Contents
1. Regional overview
2. Aquaculture value-chain
3. Tourism value-chain
4. Coffee value chain
12
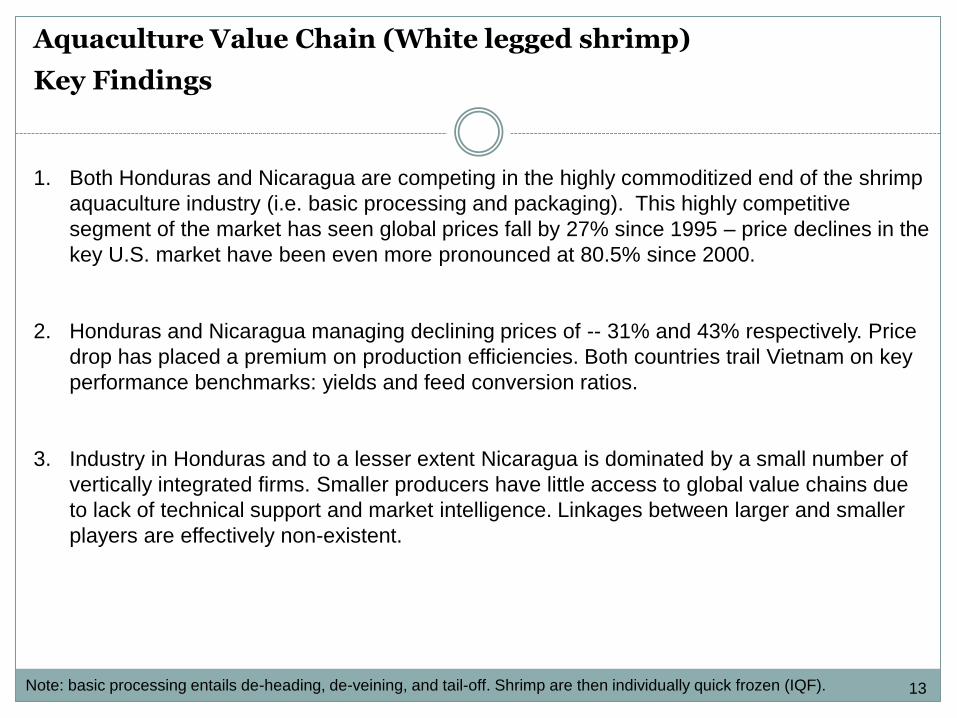
Aquaculture Value Chain (White legged shrimp)
Key Findings
1. Both Honduras and Nicaragua are competing in the highly commoditized end of the shrimp
aquaculture industry (i.e. basic processing and packaging). This highly competitive
segment of the market has seen global prices fall by 27% since 1995 – price declines in the
key U.S. market have been even more pronounced at 80.5% since 2000.
2. Honduras and Nicaragua managing declining prices of -- 31% and 43% respectively. Price
drop has placed a premium on production efficiencies. Both countries trail Vietnam on key
performance benchmarks: yields and feed conversion ratios.
3. Industry in Honduras and to a lesser extent Nicaragua is dominated by a small number of
vertically integrated firms. Smaller producers have little access to global value chains due
to lack of technical support and market intelligence. Linkages between larger and smaller
players are effectively non-existent.
13 Note: basic processing entails de-heading, de-veining, and tail-off. Shrimp are then individually quick frozen (IQF).
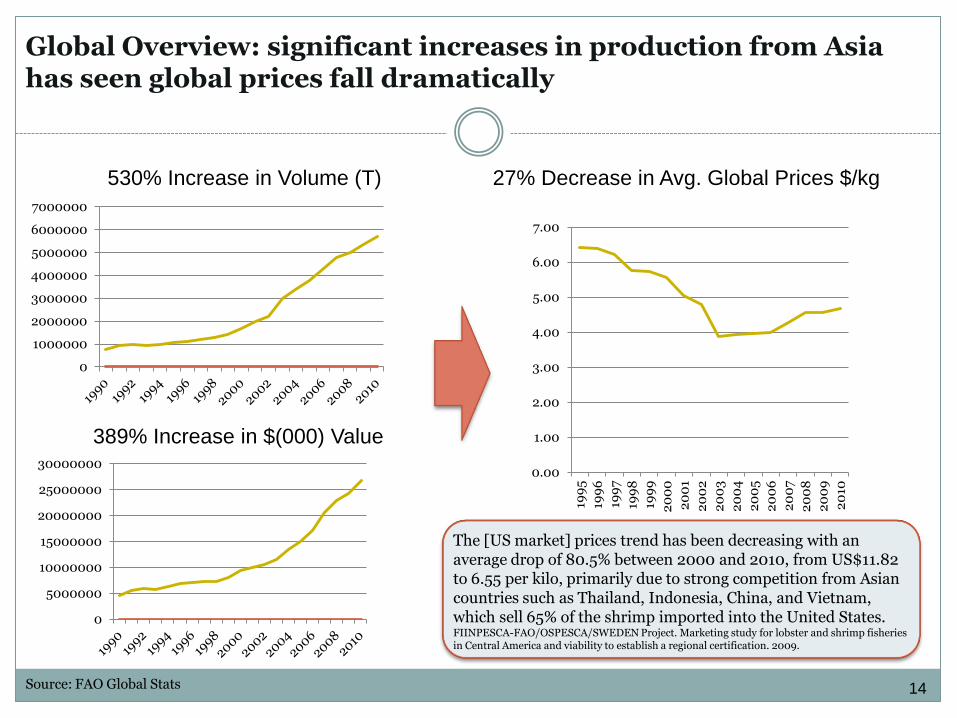
Global Overview: significant increases in production from Asia has seen global prices fall dramatically
0
1000000
2000000
3000000
4000000
5000000
6000000
7000000
0
5000000
10000000
15000000
20000000
25000000
30000000 0.00
1.00
2.00
3.00
4.00
5.00
6.00
7.00
199
5
199
6
199
7
199
8
199
9
20
00
20
01
20
02
20
03
20
04
20
05
20
06
20
07
20
08
20
09
20
10
27% Decrease in Avg. Global Prices $/kg 530% Increase in Volume (T)
389% Increase in $(000) Value
Source: FAO Global Stats
The [US market] prices trend has been decreasing with an average drop of 80.5% between 2000 and 2010, from US$11.82 to 6.55 per kilo, primarily due to strong competition from Asian countries such as Thailand, Indonesia, China, and Vietnam, which sell 65% of the shrimp imported into the United States. FIINPESCA-FAO/OSPESCA/SWEDEN Project. Marketing study for lobster and shrimp fisheries in Central America and viability to establish a regional certification. 2009.
14
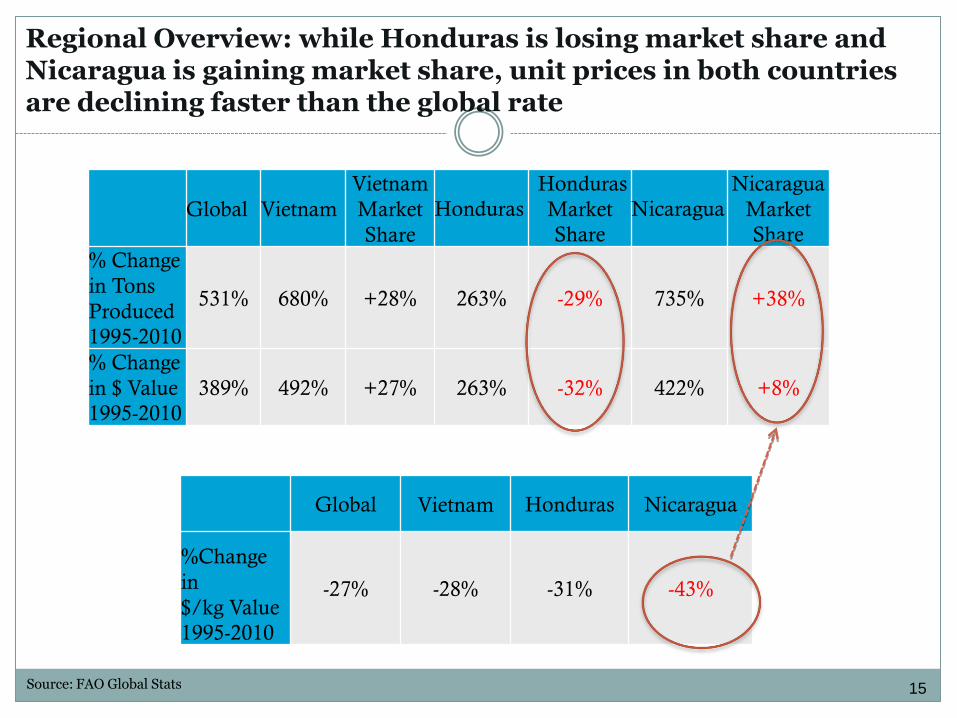
Global Vietnam Honduras Nicaragua
%Change
in
$/kg Value
1995-2010
-27% -28% -31% -43%
Regional Overview: while Honduras is losing market share and Nicaragua is gaining market share, unit prices in both countries are declining faster than the global rate
Global Vietnam
Vietnam
Market
Share
Honduras Honduras
Market
Share Nicaragua
Nicaragua
Market
Share % Change
in Tons
Produced
1995-2010
531% 680% +28% 263% -29% 735% +38%
% Change
in $ Value
1995-2010 389% 492% +27% 263% -32% 422% +8%
Source: FAO Global Stats 15
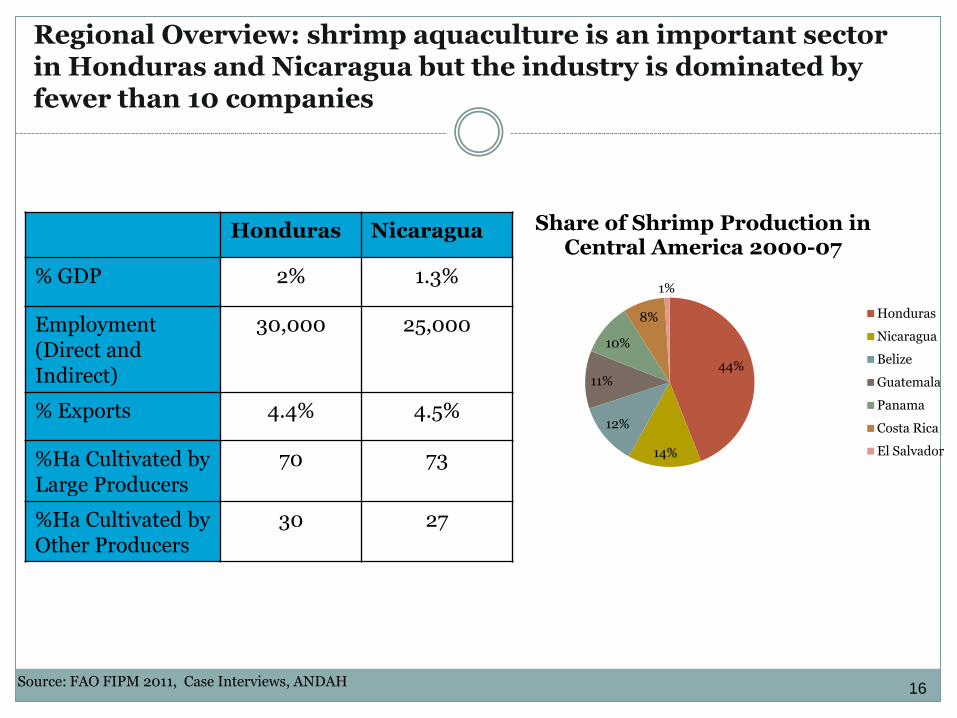
Honduras Nicaragua
% GDP 2% 1.3%
Employment (Direct and Indirect)
30,000 25,000
% Exports 4.4% 4.5%
%Ha Cultivated by Large Producers
70 73
%Ha Cultivated by Other Producers
30 27
44%
14%
12%
11%
10%
8%
1%
Share of Shrimp Production in Central America 2000-07
Honduras
Nicaragua
Belize
Guatemala
Panama
Costa Rica
El Salvador
Source: FAO FIPM 2011, Case Interviews, ANDAH
Regional Overview: shrimp aquaculture is an important sector in Honduras and Nicaragua but the industry is dominated by fewer than 10 companies
16
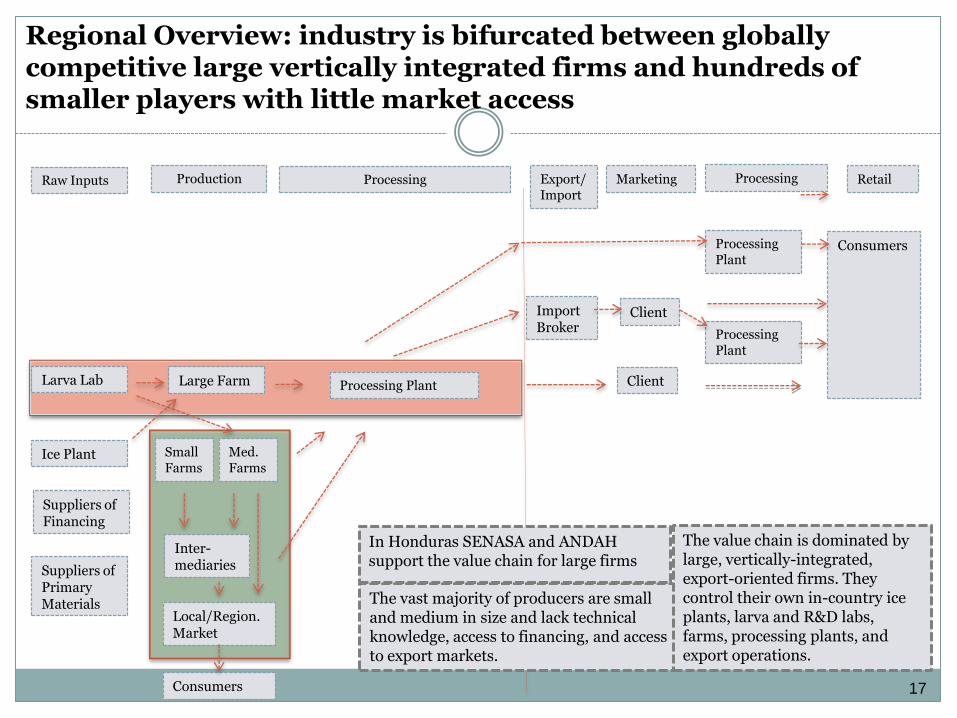
Inter- mediaries
Med. Farms
Local/Region. Market
Consumers
Processing Plant
Import Broker
Client
Consumers
Processing Plant
Client
Processing Plant
Larva Lab
Small Farms
Suppliers of Primary Materials
Raw Inputs Production Processing Export/ Import
Marketing Processing Retail
Large Farm
Ice Plant
Suppliers of Financing
The vast majority of producers are small and medium in size and lack technical knowledge, access to financing, and access to export markets.
The value chain is dominated by large, vertically-integrated, export-oriented firms. They control their own in-country ice plants, larva and R&D labs, farms, processing plants, and export operations.
Regional Overview: industry is bifurcated between globally competitive large vertically integrated firms and hundreds of smaller players with little market access
In Honduras SENASA and ANDAH support the value chain for large firms
17
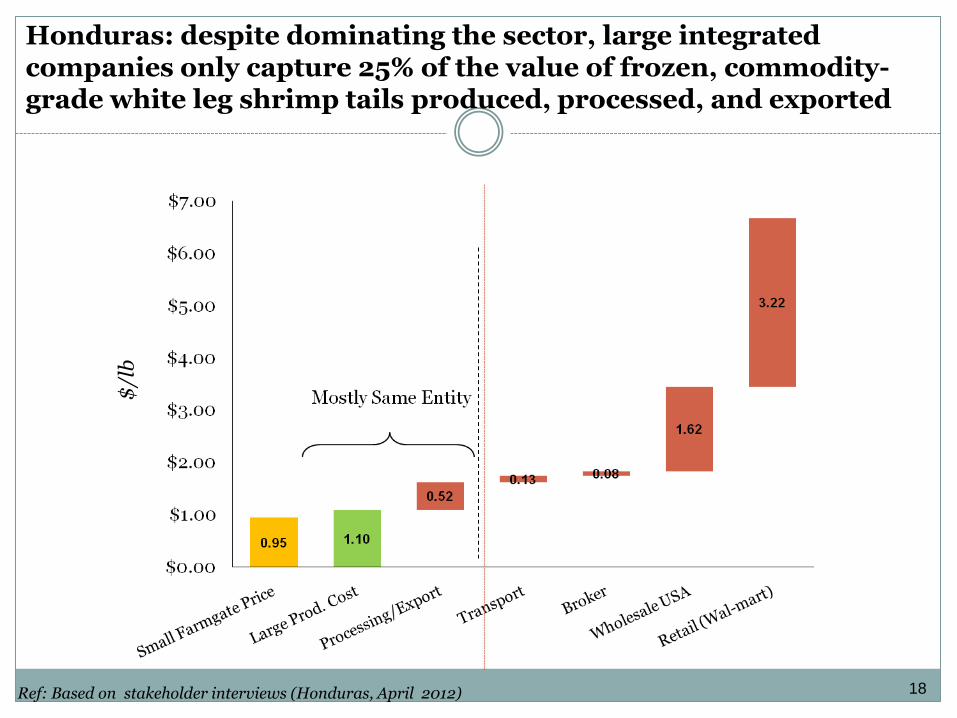
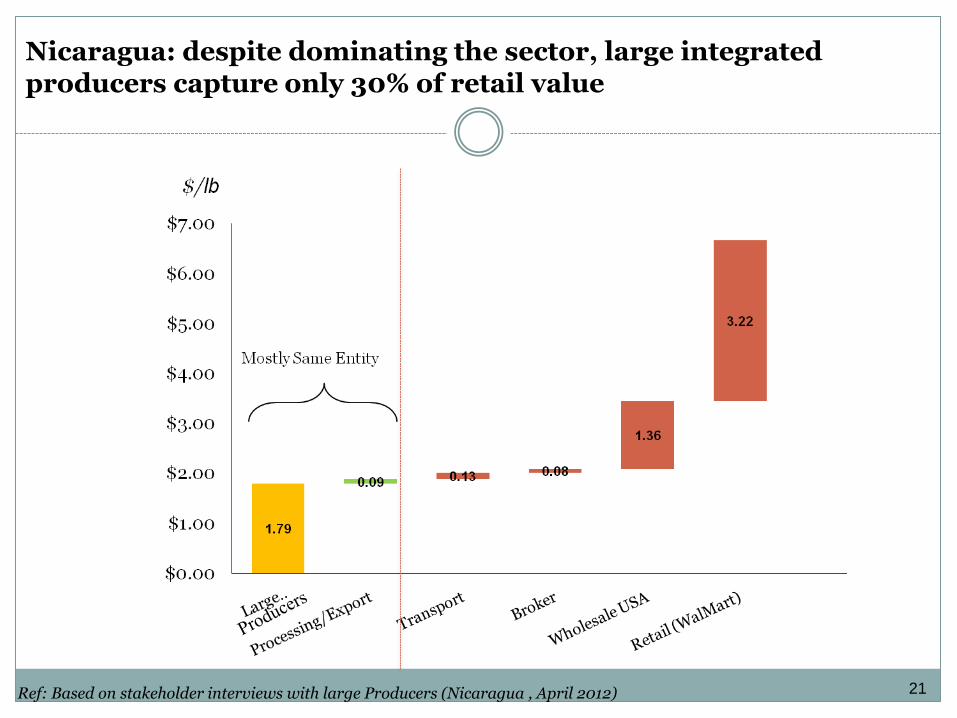
Ref: Based on stakeholder interviews (Honduras, April 2012)
$/l
b
Honduras: despite dominating the sector, large integrated companies only capture 25% of the value of frozen, commodity-grade white leg shrimp tails produced, processed, and exported
18
Ref: Based on stakeholder interviews with Large Producers (Honduras, April 2012). Note: Basic processing includes de-heading & de-veining. “Value-add processing” includes spicing, breading, skewering.
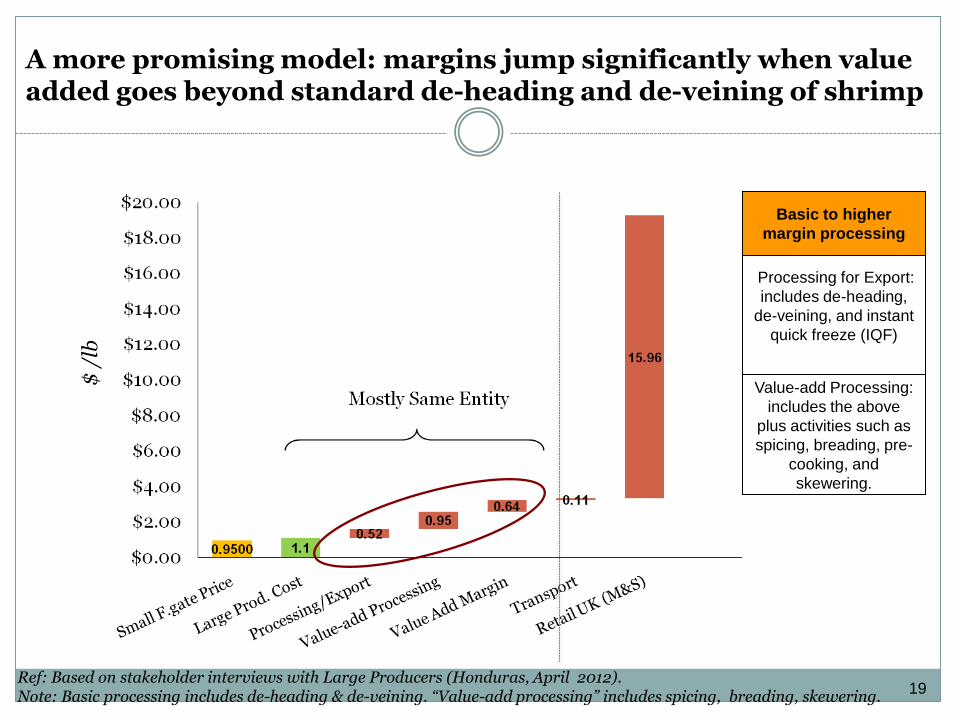
A more promising model: margins jump significantly when value added goes beyond standard de-heading and de-veining of shrimp
$
/lb
Processing for Export:
includes de-heading,
de-veining, and instant
quick freeze (IQF)
Value-add Processing:
includes the above
plus activities such as
spicing, breading, pre-
cooking, and
skewering.
Basic to higher
margin processing
19
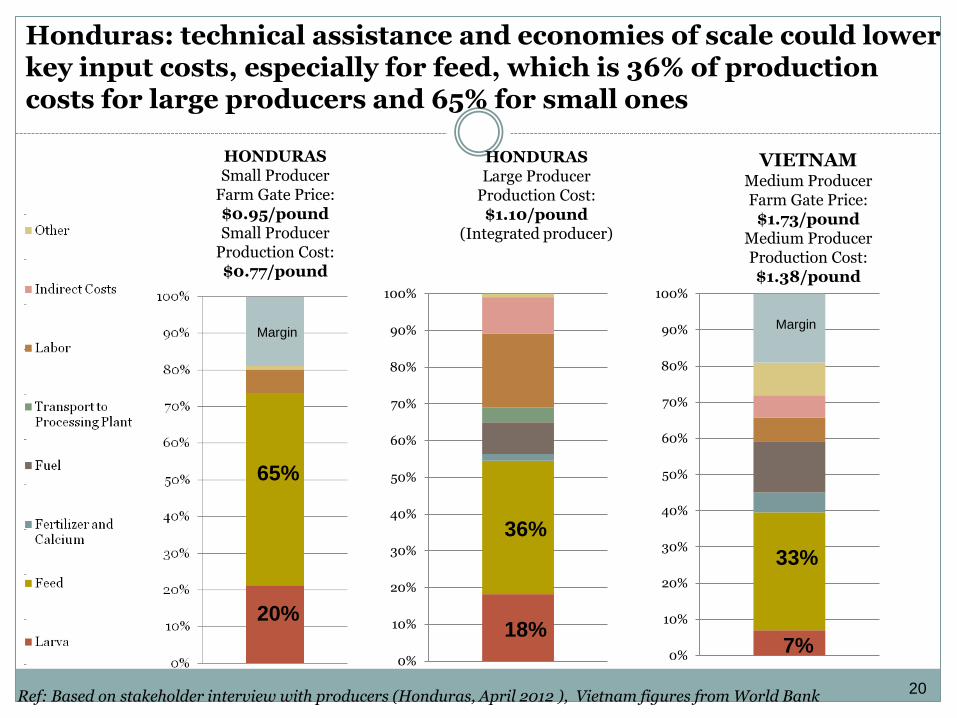
Ref: Based on stakeholder interview with producers (Honduras, April 2012 ), Vietnam figures from World Bank
HONDURAS Small Producer
Farm Gate Price: $0.95/pound Small Producer
Production Cost: $0.77/pound
HONDURAS Large Producer
Production Cost: $1.10/pound
(Integrated producer)
VIETNAM Medium Producer Farm Gate Price:
$1.73/pound Medium Producer Production Cost: $1.38/pound
Honduras: technical assistance and economies of scale could lower key input costs, especially for feed, which is 36% of production costs for large producers and 65% for small ones
0%
10%
20%
30%
40%
50%
60%
70%
80%
90%
100%
0%
10%
20%
30%
40%
50%
60%
70%
80%
90%
100%
65%
36%
Margin Margin
20
33%
20% 18%
7%
Ref: Based on stakeholder interviews with large Producers (Nicaragua , April 2012)
Nicaragua: despite dominating the sector, large integrated producers capture only 30% of retail value
21
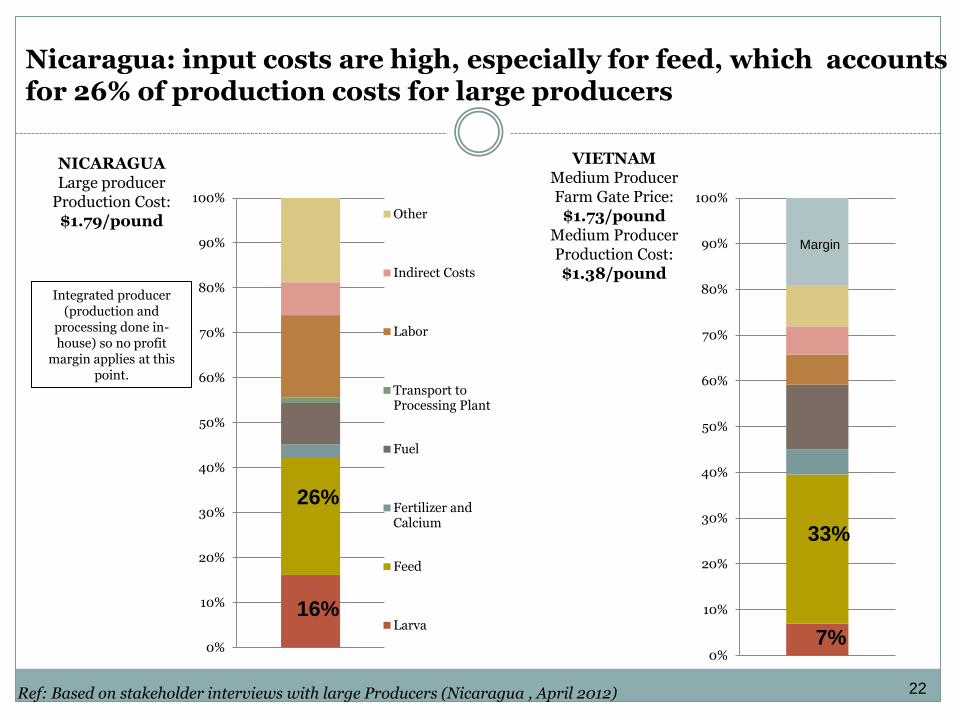
NICARAGUA Large producer
Production Cost: $1.79/pound
VIETNAM Medium Producer Farm Gate Price:
$1.73/pound Medium Producer Production Cost: $1.38/pound
Nicaragua: input costs are high, especially for feed, which accounts for 26% of production costs for large producers
0%
10%
20%
30%
40%
50%
60%
70%
80%
90%
100%
0%
10%
20%
30%
40%
50%
60%
70%
80%
90%
100%
Other
Indirect Costs
Labor
Transport to Processing Plant
Fuel
Fertilizer and Calcium
Feed
Larva
26%
Ref: Based on stakeholder interviews with large Producers (Nicaragua , April 2012)
Margin
22
Integrated producer (production and
processing done in-house) so no profit
margin applies at this point.
33%
16%
7%
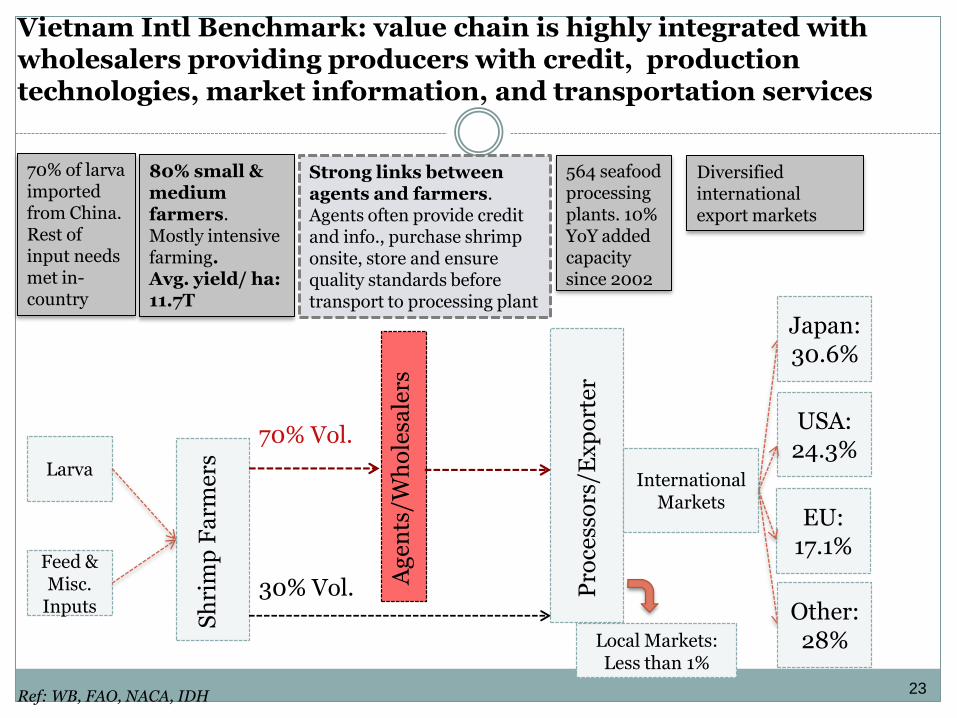
Sh
rim
p F
arm
ers
80% small & medium farmers. Mostly intensive farming. Avg. yield/ ha: 11.7T
564 seafood processing plants. 10% YoY added capacity since 2002
Strong links between agents and farmers. Agents often provide credit and info., purchase shrimp onsite, store and ensure quality standards before transport to processing plant
Ag
ents
/Wh
ole
sale
rs
70% Vol.
30% Vol. Pro
cess
ors
/Ex
po
rter
Diversified international export markets
Japan: 30.6%
USA: 24.3%
EU: 17.1%
Other: 28%
International Markets
Local Markets: Less than 1%
Larva
Feed & Misc.
Inputs
70% of larva imported from China. Rest of input needs met in-country
Ref: WB, FAO, NACA, IDH
Vietnam Intl Benchmark: value chain is highly integrated with wholesalers providing producers with credit, production technologies, market information, and transportation services
23
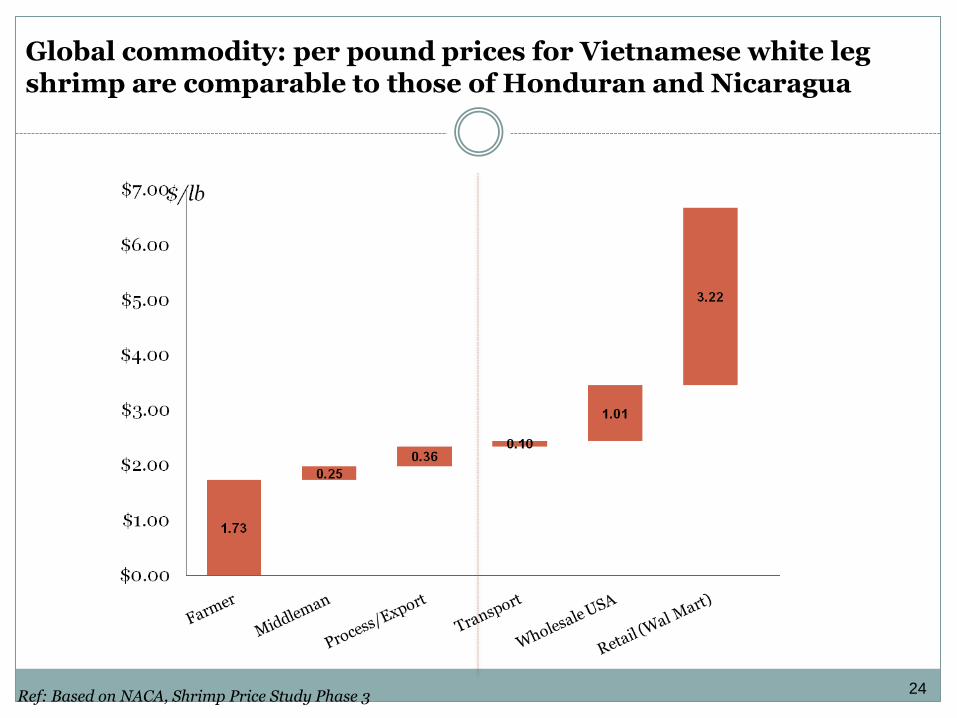
Ref: Based on NACA, Shrimp Price Study Phase 3
Global commodity: per pound prices for Vietnamese white leg shrimp are comparable to those of Honduran and Nicaragua
24
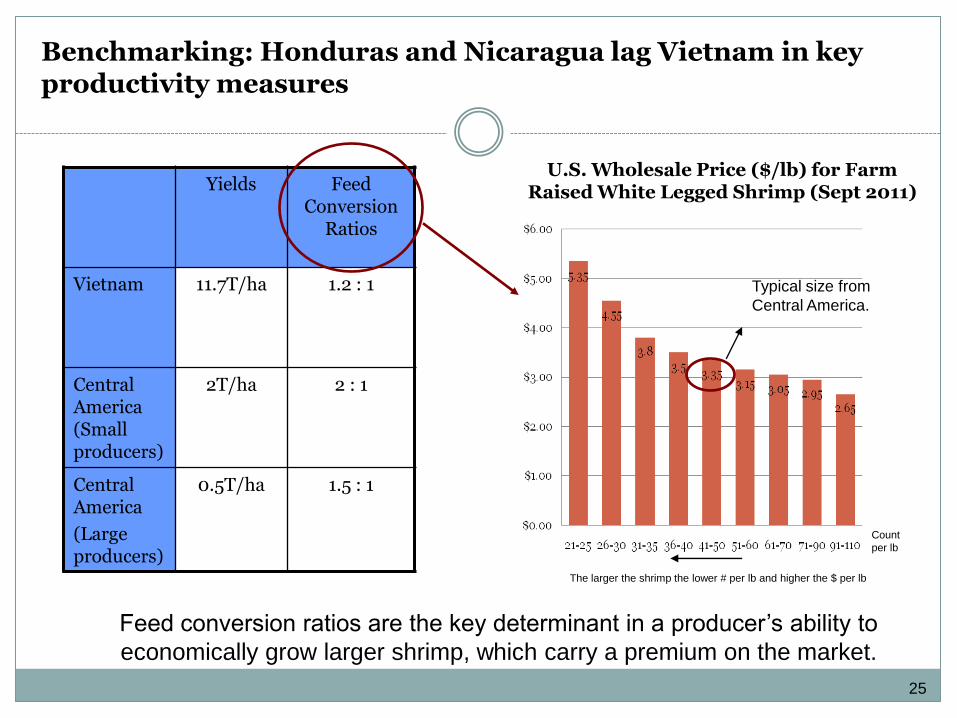
Benchmarking: Honduras and Nicaragua lag Vietnam in key productivity measures
Yields Feed Conversion
Ratios
Vietnam 11.7T/ha 1.2 : 1
Central America (Small producers)
2T/ha 2 : 1
Central America
(Large producers)
0.5T/ha 1.5 : 1
Feed conversion ratios are the key determinant in a producer’s ability to
economically grow larger shrimp, which carry a premium on the market.
The larger the shrimp the lower # per lb and higher the $ per lb
U.S. Wholesale Price ($/lb) for Farm Raised White Legged Shrimp (Sept 2011)
Count
per lb
25
Typical size from
Central America.
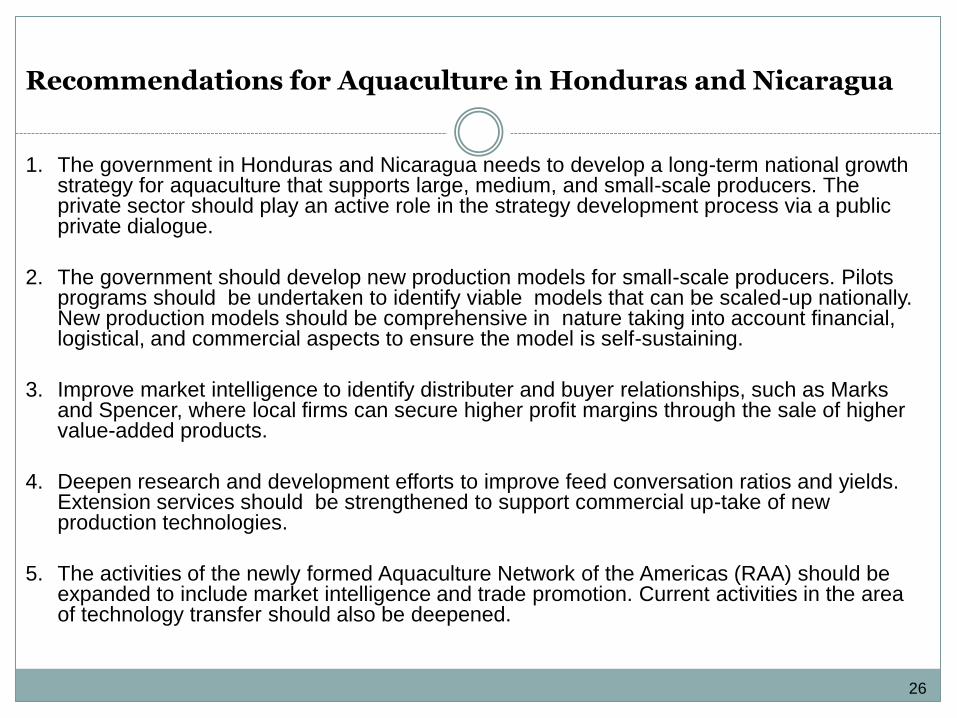
Recommendations for Aquaculture in Honduras and Nicaragua
1. The government in Honduras and Nicaragua needs to develop a long-term national growth strategy for aquaculture that supports large, medium, and small-scale producers. The private sector should play an active role in the strategy development process via a public private dialogue.
2. The government should develop new production models for small-scale producers. Pilots programs should be undertaken to identify viable models that can be scaled-up nationally. New production models should be comprehensive in nature taking into account financial, logistical, and commercial aspects to ensure the model is self-sustaining.
3. Improve market intelligence to identify distributer and buyer relationships, such as Marks and Spencer, where local firms can secure higher profit margins through the sale of higher value-added products.
4. Deepen research and development efforts to improve feed conversation ratios and yields. Extension services should be strengthened to support commercial up-take of new production technologies.
5. The activities of the newly formed Aquaculture Network of the Americas (RAA) should be expanded to include market intelligence and trade promotion. Current activities in the area of technology transfer should also be deepened.
26
Contents
1. Regional overview
2. Aquaculture value-chain
3. Tourism value-chain
4. Coffee value chain
27
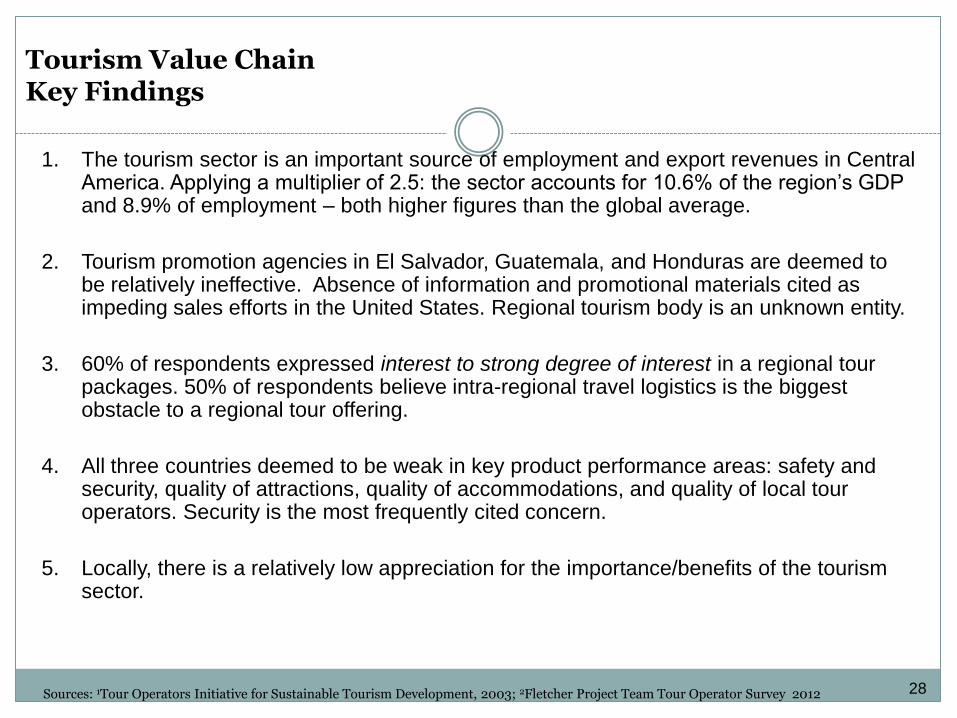
Tourism Value Chain Key Findings
1. The tourism sector is an important source of employment and export revenues in Central America. Applying a multiplier of 2.5: the sector accounts for 10.6% of the region’s GDP and 8.9% of employment – both higher figures than the global average.
2. Tourism promotion agencies in El Salvador, Guatemala, and Honduras are deemed to be relatively ineffective. Absence of information and promotional materials cited as impeding sales efforts in the United States. Regional tourism body is an unknown entity.
3. 60% of respondents expressed interest to strong degree of interest in a regional tour packages. 50% of respondents believe intra-regional travel logistics is the biggest obstacle to a regional tour offering.
4. All three countries deemed to be weak in key product performance areas: safety and security, quality of attractions, quality of accommodations, and quality of local tour operators. Security is the most frequently cited concern.
5. Locally, there is a relatively low appreciation for the importance/benefits of the tourism sector.
Sources: 1Tour Operators Initiative for Sustainable Tourism Development, 2003; 2Fletcher Project Team Tour Operator Survey 2012 28
Global Overview: the tourism industry is a large and growing part of the global economy
Sources: 1Word Bank Yearbook of Tourism Statistics, as of 4/17/12 2WTTC, “World Economic Impact: 2012;” 2CAVC Report
Global Economic Impact of
Tourism (2011)2
2.8 3.3 4.9 5.3
0246
GDP
Emplo
y...
Inve
stm
ent
Exports
Perc
enta
ge
2.8 3.3
9.1 8.7
0
5
10
GDP Employment
Direct
IndirectPe
rcen
tage
Multiplier Effect of Tourism (2011)2
• Directly created 98+ million jobs in 20111
• Multiplier effect of tourism is estimated between 2.3 - 2.52
Global tourism receipts (1995-2010)1
0
200
400
600
800
1000
1200
1995 2000 2005 2010
World
Bill
ion
s in
US$
29
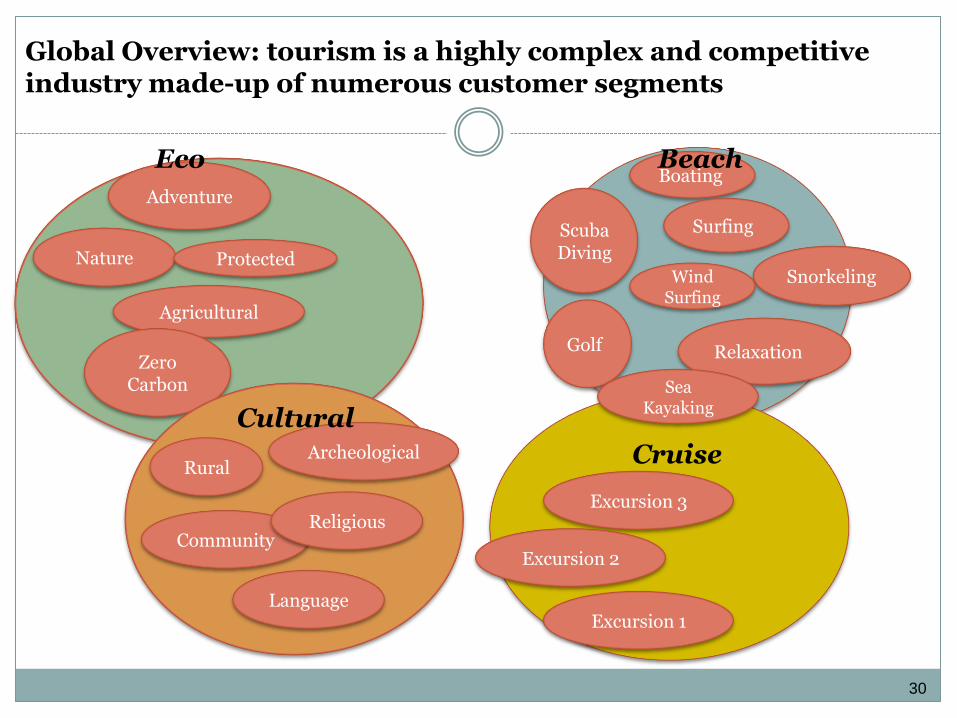
Global Overview: tourism is a highly complex and competitive industry made-up of numerous customer segments
Boating
Relaxation Golf
Beach
Snorkeling
Scuba Diving
Surfing
Wind Surfing
Adventure
Nature
Agricultural
Zero Carbon
Protected
Rural
Community
Archeological
Religious
Language
Cruise
Excursion 3
Excursion 2
Excursion 1
Eco
Cultural
Sea Kayaking
30
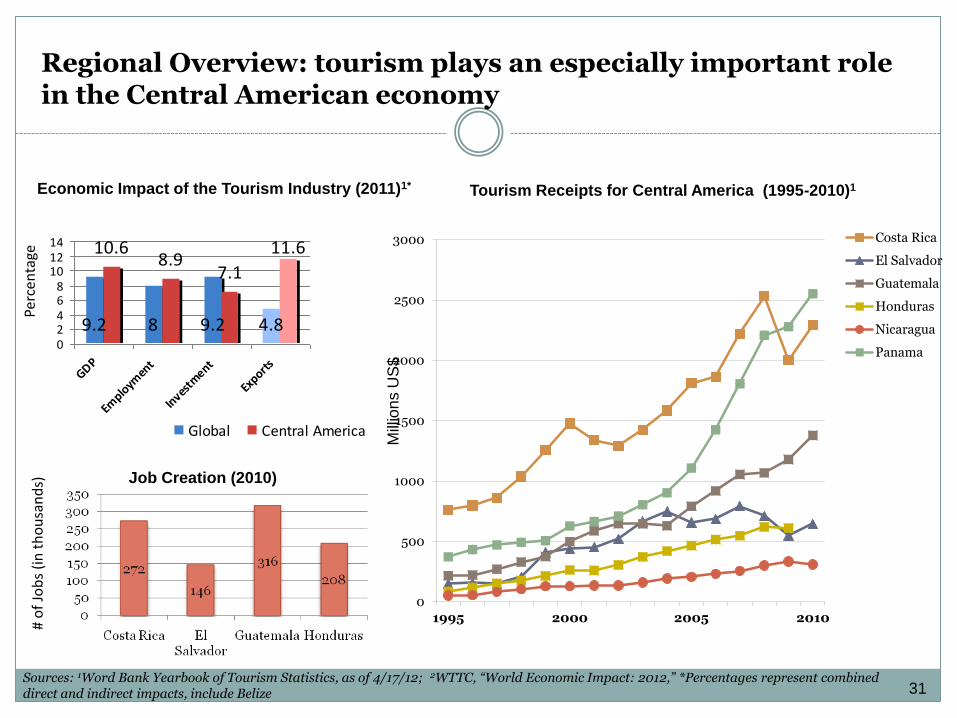
Regional Overview: tourism plays an especially important role in the Central American economy
9.2 8 9.2 4.8
10.68.9
7.1
11.6
02468
101214
GDP
Emplo
ymen
t
Inves
tment
Exports
Global Central America
Economic Impact of the Tourism Industry (2011)1*
Sources: 1Word Bank Yearbook of Tourism Statistics, as of 4/17/12; 2WTTC, “World Economic Impact: 2012,” *Percentages represent combined direct and indirect impacts, include Belize
Tourism Receipts for Central America (1995-2010)1
Perc
enta
ge
# o
f Jo
bs
(in
th
ou
san
ds)
Mill
ion
s U
S$
0
500
1000
1500
2000
2500
3000
1995 2000 2005 2010
Costa Rica
El Salvador
Guatemala
Honduras
Nicaragua
Panama
Job Creation (2010)
31
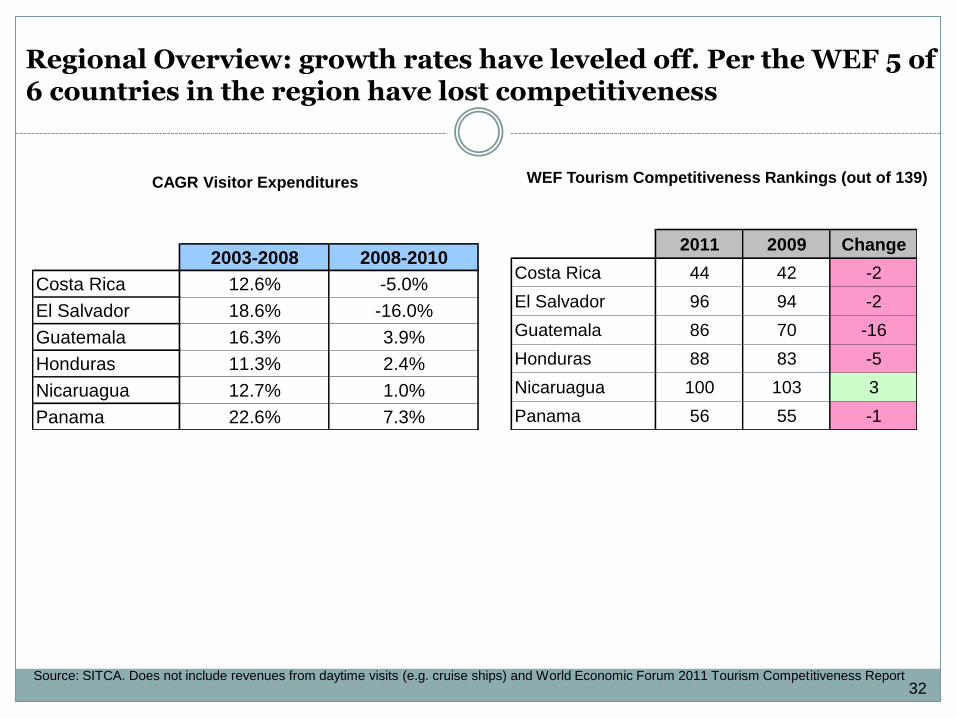
Regional Overview: growth rates have leveled off. Per the WEF 5 of 6 countries in the region have lost competitiveness
WEF Tourism Competitiveness Rankings (out of 139)
2003-2008 2008-2010
Costa Rica 12.6% -5.0%
El Salvador 18.6% -16.0%
Guatemala 16.3% 3.9%
Honduras 11.3% 2.4%
Nicaruagua 12.7% 1.0%
Panama 22.6% 7.3%
CAGR Visitor Expenditures
Source: SITCA. Does not include revenues from daytime visits (e.g. cruise ships) and World Economic Forum 2011 Tourism Competitiveness Report
2011 2009 Change
Costa Rica 44 42 -2
El Salvador 96 94 -2
Guatemala 86 70 -16
Honduras 88 83 -5
Nicaruagua 100 103 3
Panama 56 55 -1
32
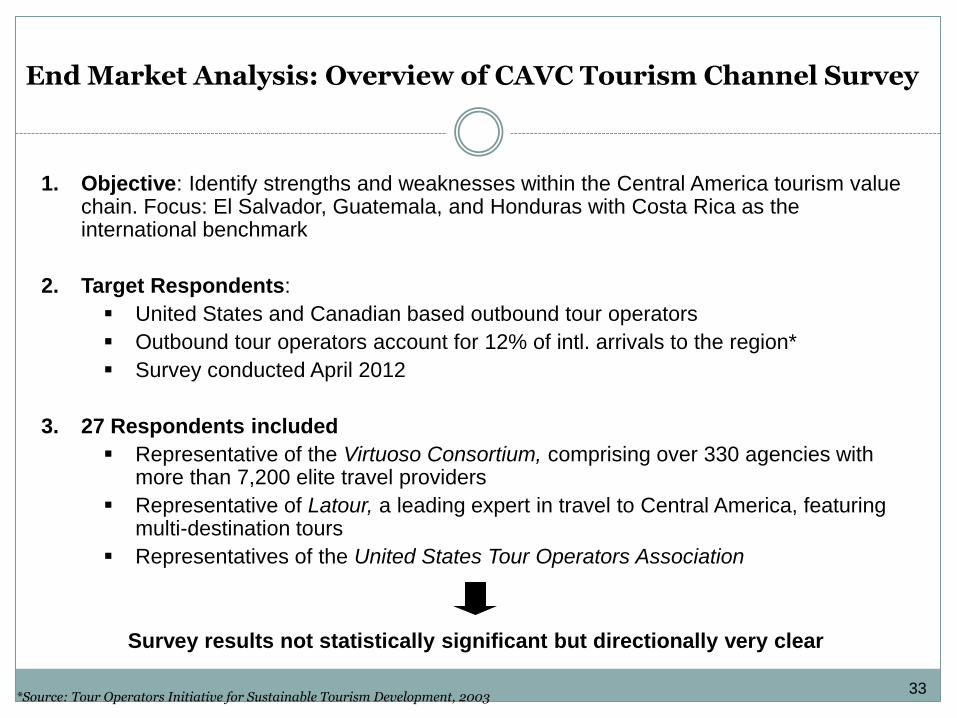
End Market Analysis: Overview of CAVC Tourism Channel Survey
1. Objective: Identify strengths and weaknesses within the Central America tourism value chain. Focus: El Salvador, Guatemala, and Honduras with Costa Rica as the international benchmark
2. Target Respondents:
United States and Canadian based outbound tour operators
Outbound tour operators account for 12% of intl. arrivals to the region*
Survey conducted April 2012
3. 27 Respondents included
Representative of the Virtuoso Consortium, comprising over 330 agencies with more than 7,200 elite travel providers
Representative of Latour, a leading expert in travel to Central America, featuring multi-destination tours
Representatives of the United States Tour Operators Association
*Source: Tour Operators Initiative for Sustainable Tourism Development, 2003
Survey results not statistically significant but directionally very clear
33
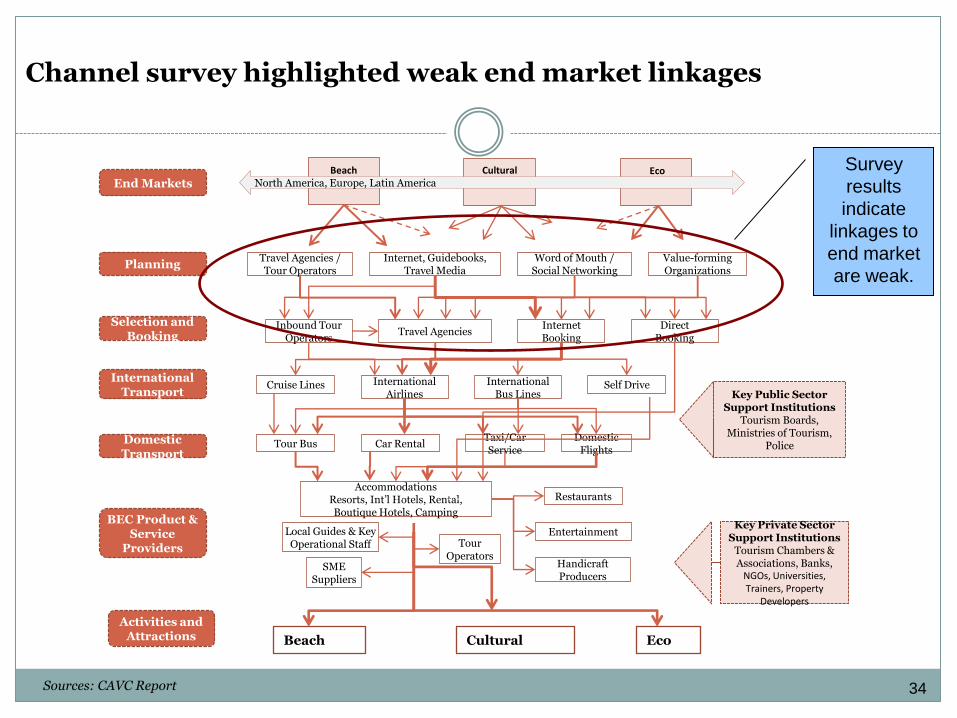
Car Rental
Accommodations Resorts, Int’l Hotels, Rental, Boutique Hotels, Camping
Travel Agencies
. . Internet, Guidebooks,
Travel Media
. Activities and Attractions Cultural Eco Beach
Key Public Sector Support Institutions
Tourism Boards, Ministries of Tourism,
Police
Key Private Sector Support Institutions
Tourism Chambers & Associations, Banks,
NGOs, Universities, Trainers, Property
Developers
Cultural Eco Beach
End Markets North America, Europe, Latin America
International Transport
Selection and Booking
Planning Word of Mouth /
Social Networking Travel Agencies / Tour Operators
Internet Booking
Inbound Tour Operators
Direct Booking
Self Drive Cruise Lines International Airlines
Domestic Transport
Tour Bus Domestic
Flights
Value-forming Organizations
International Bus Lines
BEC Product & Service
Providers
Local Guides & Key Operational Staff
Handicraft Producers
Restaurants
Tour Operators
SME Suppliers
Entertainment
Taxi/Car Service
. .
. . .
.
. . . . . . . . .
. . .
. .
. . . .
. .
.
Sources: CAVC Report
Channel survey highlighted weak end market linkages
Survey
results
indicate
linkages to
end market
are weak.
34
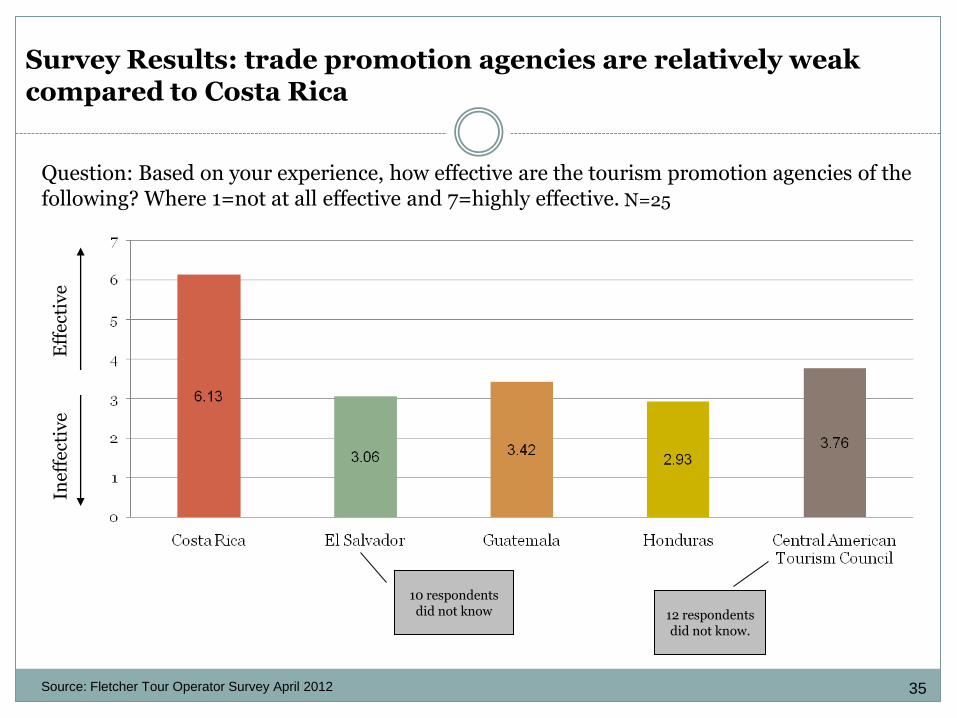
Question: Based on your experience, how effective are the tourism promotion agencies of the following? Where 1=not at all effective and 7=highly effective.
Eff
ecti
ve
In
effe
ctiv
e
10 respondents did not know 12 respondents
did not know.
N=25
Survey Results: trade promotion agencies are relatively weak compared to Costa Rica
Source: Fletcher Tour Operator Survey April 2012 35
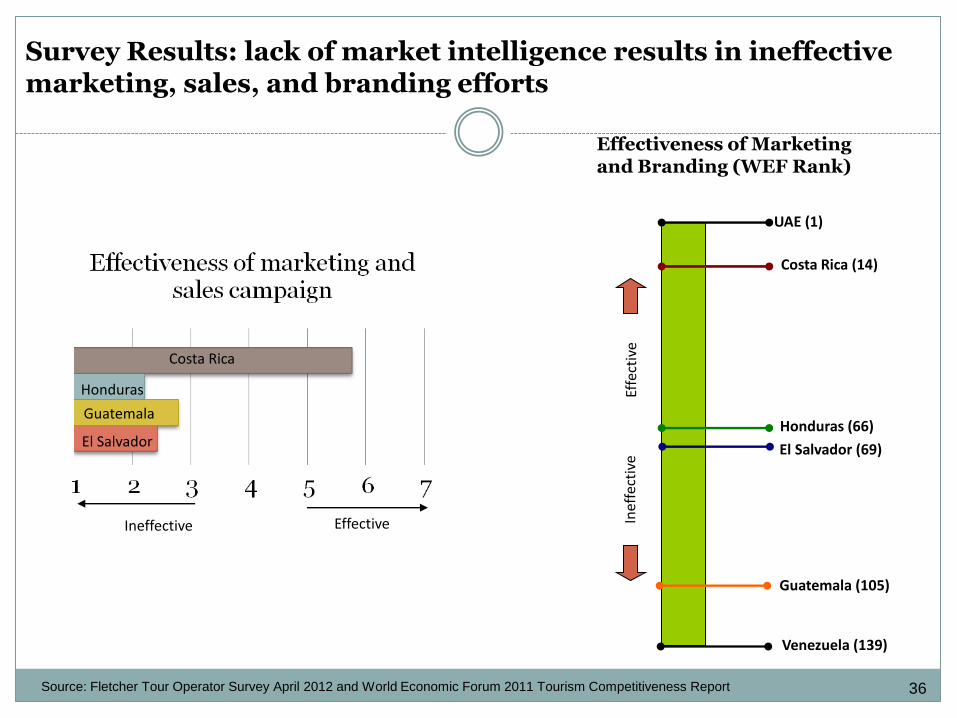
Survey Results: lack of market intelligence results in ineffective marketing, sales, and branding efforts
Source: Fletcher Tour Operator Survey April 2012 and World Economic Forum 2011 Tourism Competitiveness Report
Costa Rica
Honduras
Guatemala
El Salvador
Effective Ineffective
Costa Rica (14)
UAE (1)
Honduras (66)
El Salvador (69)
Guatemala (105)
Venezuela (139)
Effectiveness of Marketing and Branding (WEF Rank)
Inef
fect
ive
Ef
fect
ive
36
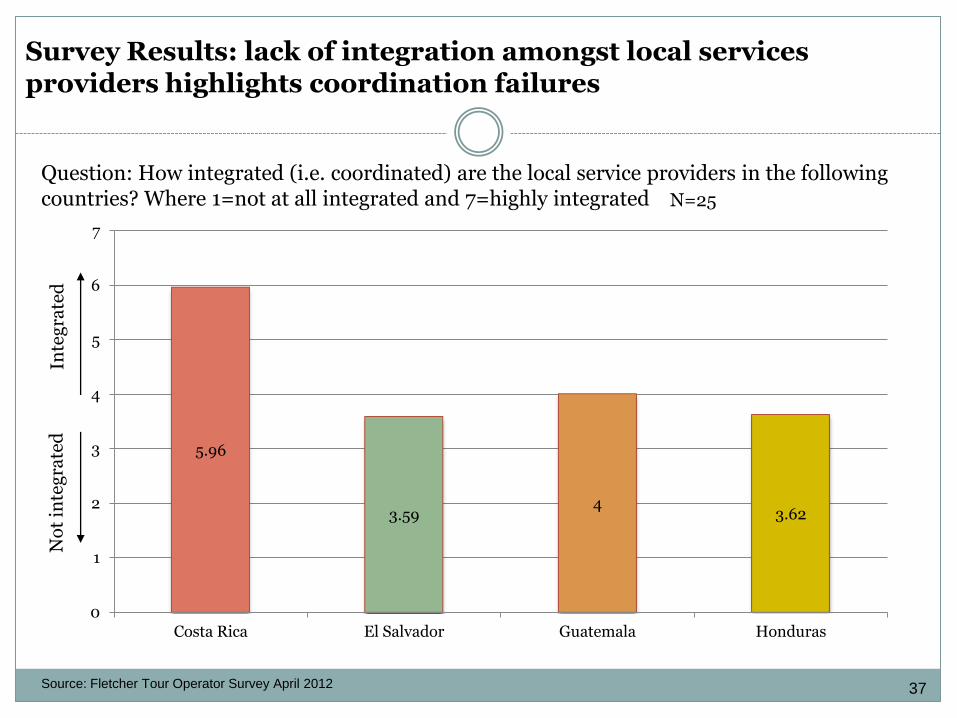
Question: How integrated (i.e. coordinated) are the local service providers in the following countries? Where 1=not at all integrated and 7=highly integrated
5.96
3.59 4
3.62
0
1
2
3
4
5
6
7
Costa Rica El Salvador Guatemala Honduras
N=25
Inte
gra
ted
N
ot
inte
gra
ted
Survey Results: lack of integration amongst local services providers highlights coordination failures
Source: Fletcher Tour Operator Survey April 2012 37
Efforts to raise awareness of the importance of tourism are limited and/or ineffective
Government Prioritization of the Travel & Tourism Industry (WEF Rank)
Sources: World Economic Forum 2011 Tourism Competitiveness Report
1 139
112 91
88 13
Attitude of Population Towards Foreign Visitors (WEF Rank)
1 139
120
102
88
55
High Med Low Ranking key:
38
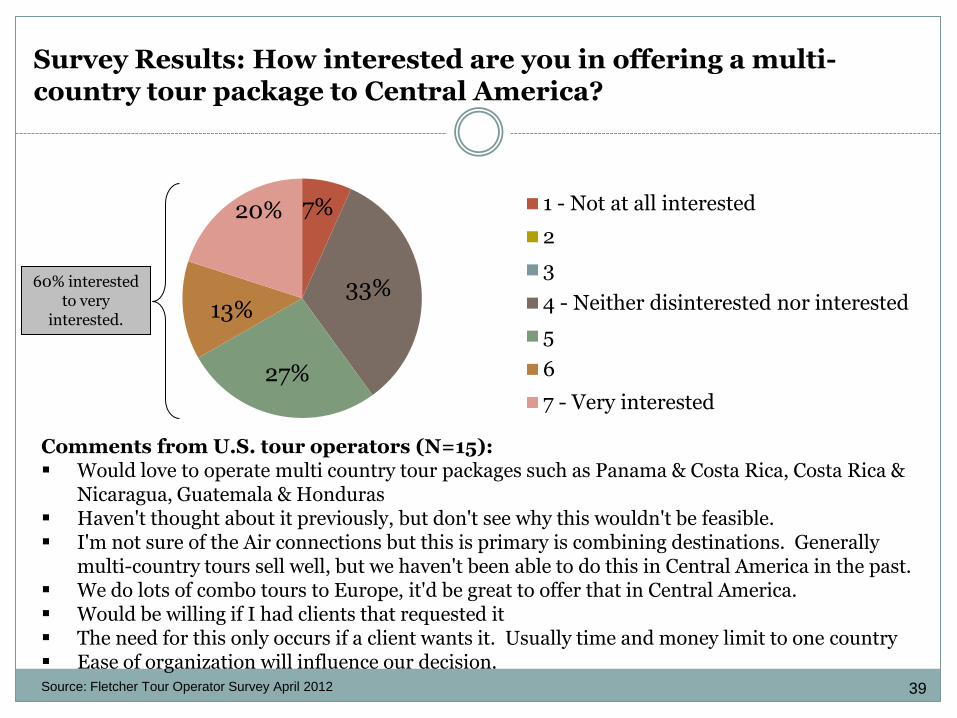
Survey Results: How interested are you in offering a multi-country tour package to Central America?
7%
33%
27%
13%
20% 1 - Not at all interested
2
3
4 - Neither disinterested nor interested
5
6
7 - Very interested
Comments from U.S. tour operators (N=15): Would love to operate multi country tour packages such as Panama & Costa Rica, Costa Rica &
Nicaragua, Guatemala & Honduras Haven't thought about it previously, but don't see why this wouldn't be feasible. I'm not sure of the Air connections but this is primary is combining destinations. Generally
multi-country tours sell well, but we haven't been able to do this in Central America in the past. We do lots of combo tours to Europe, it'd be great to offer that in Central America. Would be willing if I had clients that requested it The need for this only occurs if a client wants it. Usually time and money limit to one country Ease of organization will influence our decision.
60% interested to very
interested.
Source: Fletcher Tour Operator Survey April 2012 39
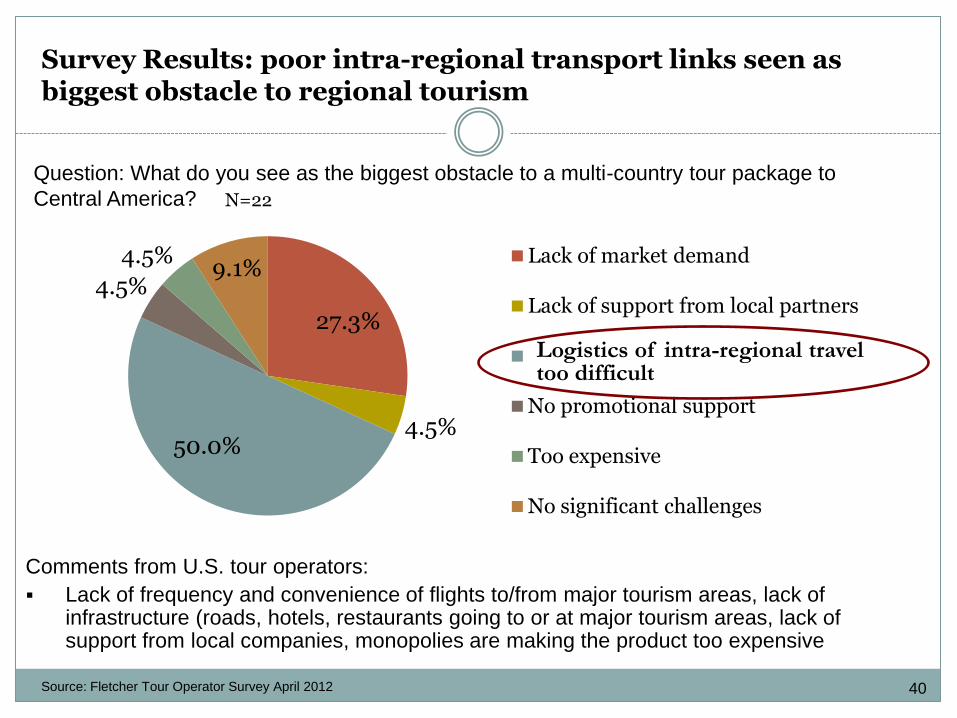
Question: What do you see as the biggest obstacle to a multi-country tour package to
Central America?
Comments from U.S. tour operators:
Lack of frequency and convenience of flights to/from major tourism areas, lack of infrastructure (roads, hotels, restaurants going to or at major tourism areas, lack of support from local companies, monopolies are making the product too expensive
27.3%
4.5% 50.0%
4.5%
4.5% 9.1%
Lack of market demand
Lack of support from local partners
Logistics of inter-regional travel too difficult No promotional support
Too expensive
No significant challenges
N=22
Source: Fletcher Tour Operator Survey April 2012
Survey Results: poor intra-regional transport links seen as biggest obstacle to regional tourism
Logistics of intra-regional travel too difficult
40
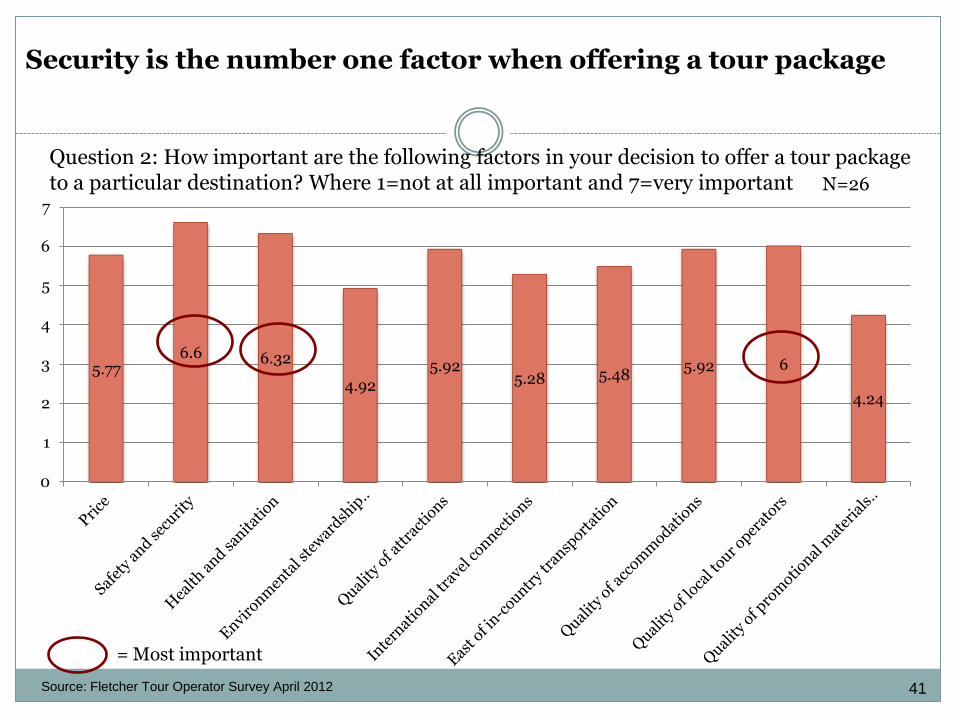
Question 2: How important are the following factors in your decision to offer a tour package to a particular destination? Where 1=not at all important and 7=very important
5.77 6.6 6.32
4.92
5.92 5.28 5.48
5.92 6
4.24
0
1
2
3
4
5
6
7
N=26
= Most important
Source: Fletcher Tour Operator Survey April 2012
Security is the number one factor when offering a tour package
41
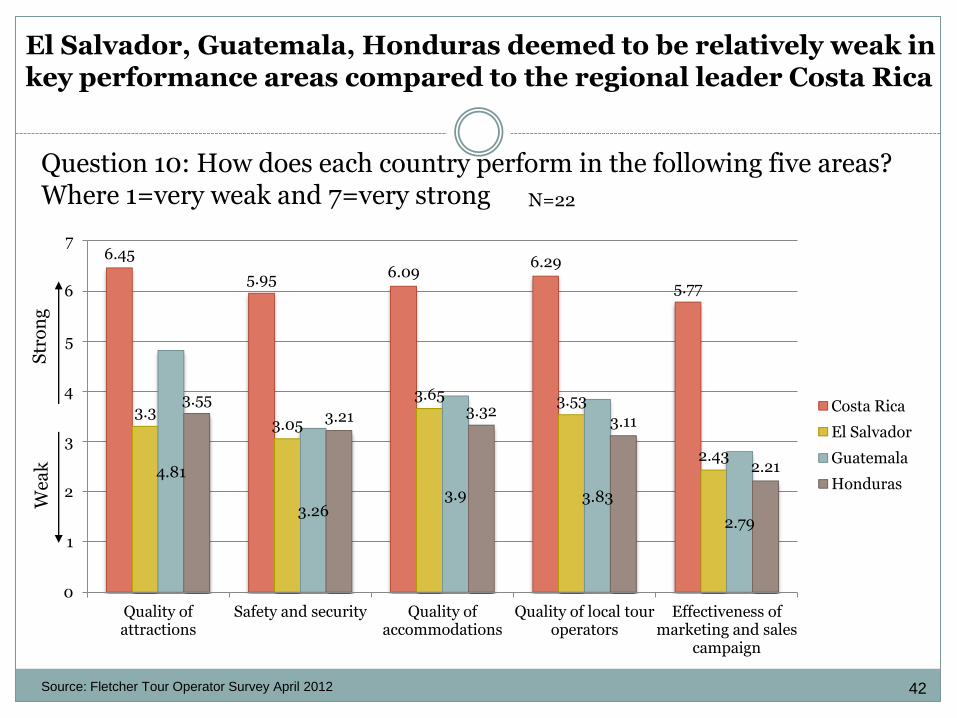
Question 10: How does each country perform in the following five areas? Where 1=very weak and 7=very strong
6.45
5.95 6.09 6.29
5.77
3.3 3.05
3.65 3.53
2.43 4.81
3.26 3.9 3.83
2.79
3.55 3.21 3.32
3.11
2.21
0
1
2
3
4
5
6
7
Quality of attractions
Safety and security Quality of accommodations
Quality of local tour operators
Effectiveness of marketing and sales
campaign
Costa Rica
El Salvador
Guatemala
Honduras
N=22
Str
on
g
Wea
k
El Salvador, Guatemala, Honduras deemed to be relatively weak in key performance areas compared to the regional leader Costa Rica
Source: Fletcher Tour Operator Survey April 2012 42
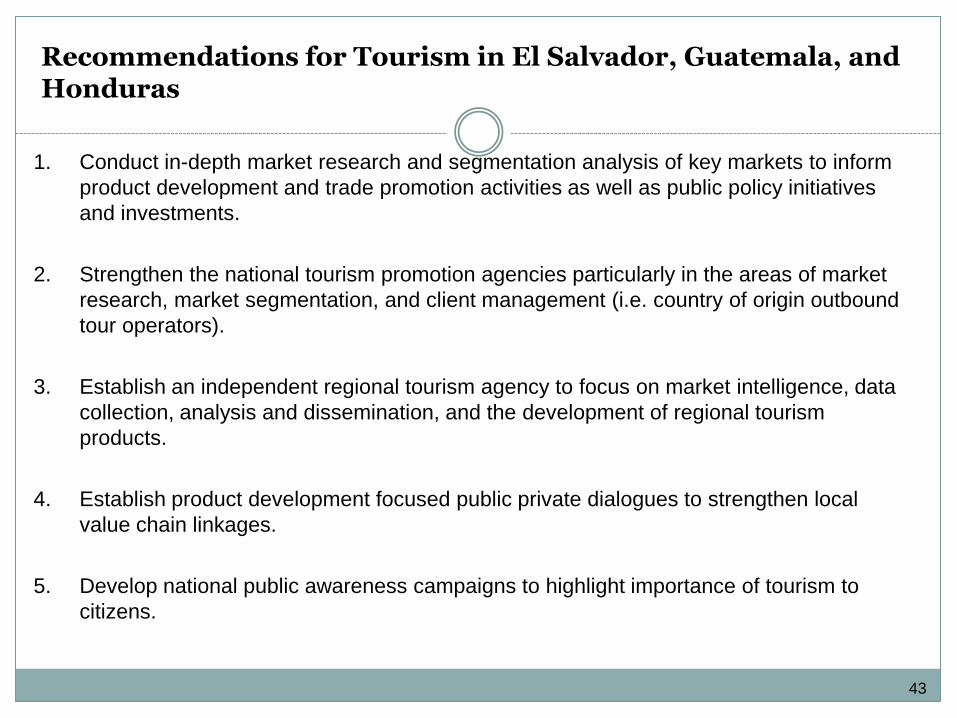
Recommendations for Tourism in El Salvador, Guatemala, and Honduras
1. Conduct in-depth market research and segmentation analysis of key markets to inform
product development and trade promotion activities as well as public policy initiatives
and investments.
2. Strengthen the national tourism promotion agencies particularly in the areas of market
research, market segmentation, and client management (i.e. country of origin outbound
tour operators).
3. Establish an independent regional tourism agency to focus on market intelligence, data
collection, analysis and dissemination, and the development of regional tourism
products.
4. Establish product development focused public private dialogues to strengthen local
value chain linkages.
5. Develop national public awareness campaigns to highlight importance of tourism to
citizens.
43
Contents
1. Regional overview
2. Aquaculture value-chain
3. Tourism value-chain
4. Coffee value chain
44
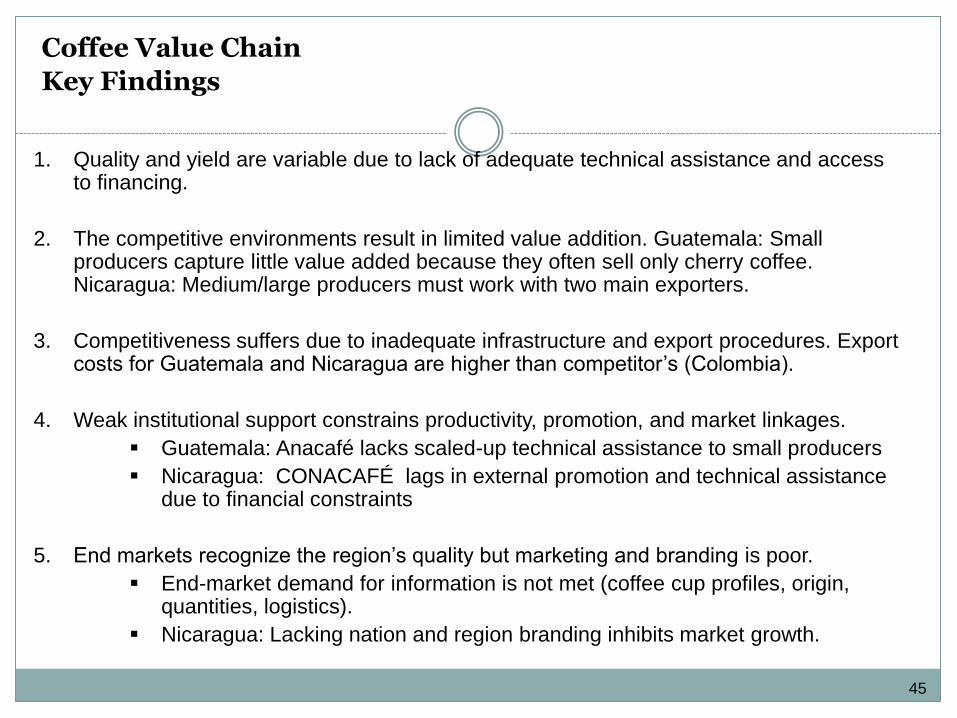
Coffee Value Chain
Key Findings
1. Quality and yield are variable due to lack of adequate technical assistance and access to financing.
2. The competitive environments result in limited value addition. Guatemala: Small producers capture little value added because they often sell only cherry coffee. Nicaragua: Medium/large producers must work with two main exporters.
3. Competitiveness suffers due to inadequate infrastructure and export procedures. Export costs for Guatemala and Nicaragua are higher than competitor’s (Colombia).
4. Weak institutional support constrains productivity, promotion, and market linkages.
Guatemala: Anacafé lacks scaled-up technical assistance to small producers
Nicaragua: CONACAFÉ lags in external promotion and technical assistance due to financial constraints
5. End markets recognize the region’s quality but marketing and branding is poor.
End-market demand for information is not met (coffee cup profiles, origin, quantities, logistics).
Nicaragua: Lacking nation and region branding inhibits market growth.
45
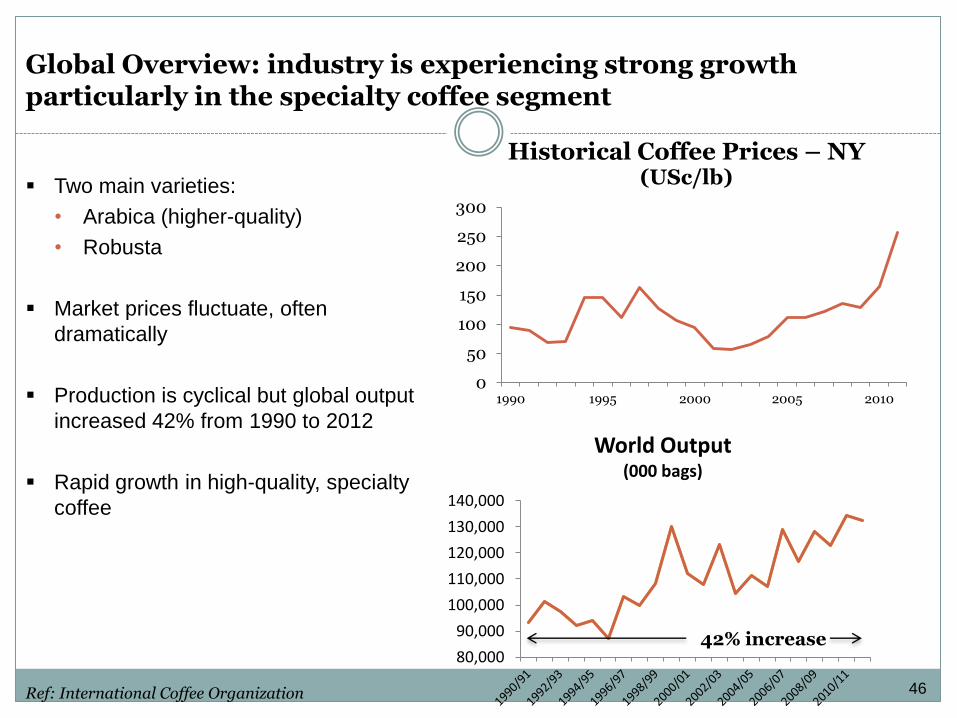
Global Overview: industry is experiencing strong growth particularly in the specialty coffee segment
Two main varieties:
• Arabica (higher-quality)
• Robusta
Market prices fluctuate, often
dramatically
Production is cyclical but global output
increased 42% from 1990 to 2012
Rapid growth in high-quality, specialty
coffee
80,000
90,000
100,000
110,000
120,000
130,000
140,000
World Output (000 bags)
0
50
100
150
200
250
300
1990 1995 2000 2005 2010
Historical Coffee Prices – NY (USc/lb)
42% increase
Ref: International Coffee Organization 46
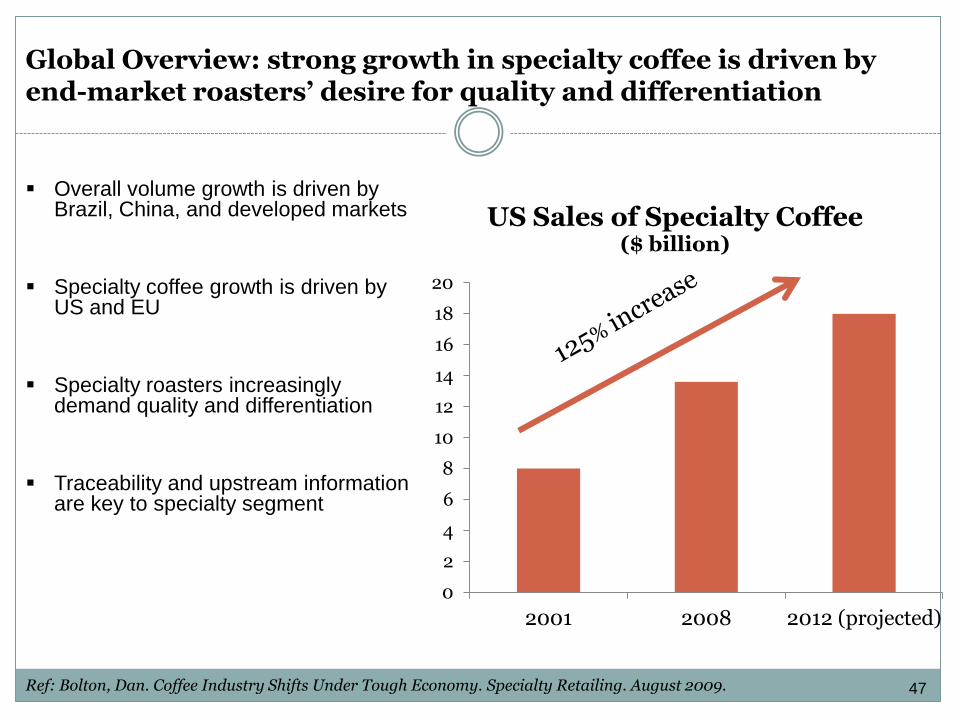
Global Overview: strong growth in specialty coffee is driven by end-market roasters’ desire for quality and differentiation
Overall volume growth is driven by Brazil, China, and developed markets
Specialty coffee growth is driven by US and EU
Specialty roasters increasingly demand quality and differentiation
Traceability and upstream information are key to specialty segment
0
2
4
6
8
10
12
14
16
18
20
2001 2008 2012 (projected)
US Sales of Specialty Coffee ($ billion)
Ref: Bolton, Dan. Coffee Industry Shifts Under Tough Economy. Specialty Retailing. August 2009. 47
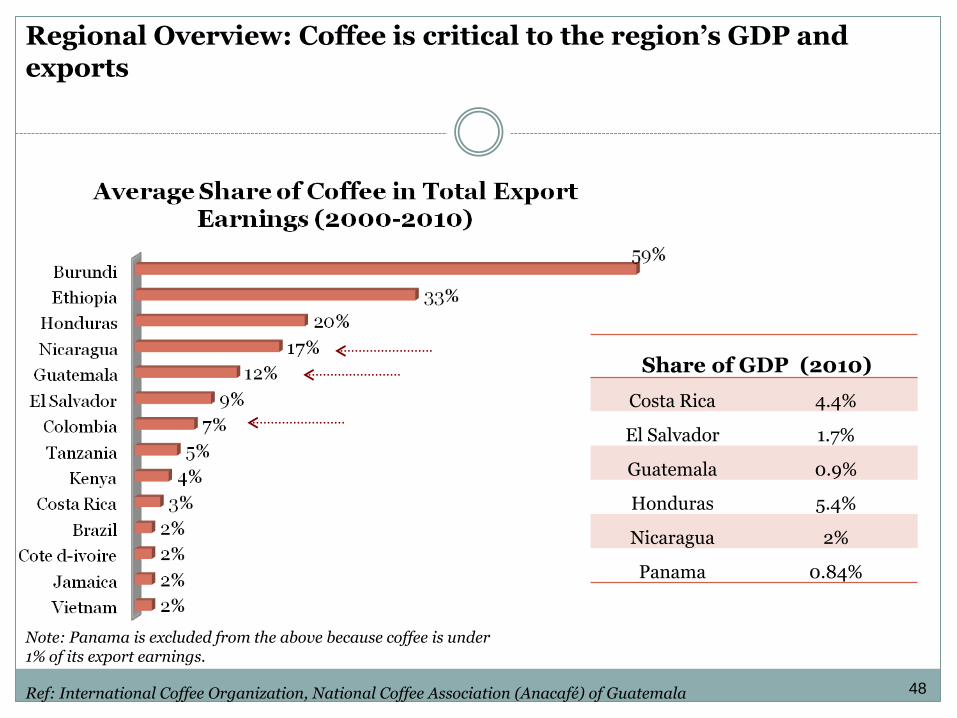
Regional Overview: Coffee is critical to the region’s GDP and exports
Ref: International Coffee Organization, National Coffee Association (Anacafé) of Guatemala
Share of GDP (2010)
Costa Rica 4.4%
El Salvador 1.7%
Guatemala 0.9%
Honduras 5.4%
Nicaragua 2%
Panama 0.84%
Note: Panama is excluded from the above because coffee is under 1% of its export earnings.
48
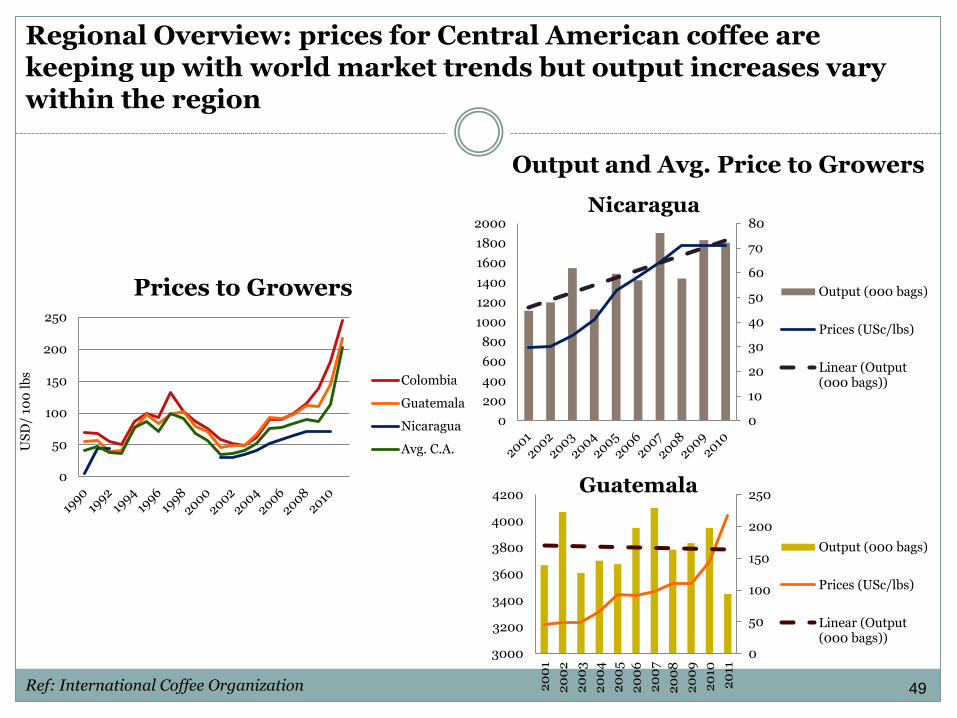
Regional Overview: prices for Central American coffee are keeping up with world market trends but output increases vary within the region
0
10
20
30
40
50
60
70
80
0
200
400
600
800
1000
1200
1400
1600
1800
2000 Nicaragua
Output (000 bags)
Prices (USc/lbs)
Linear (Output (000 bags))
0
50
100
150
200
250
3000
3200
3400
3600
3800
4000
4200
20
01
20
02
20
03
20
04
20
05
20
06
20
07
20
08
20
09
20
10
20
11
Guatemala
Output (000 bags)
Prices (USc/lbs)
Linear (Output (000 bags))
Output and Avg. Price to Growers
0
50
100
150
200
250
US
D/
100
lb
s
Prices to Growers
Colombia
Guatemala
Nicaragua
Avg. C.A.
Ref: International Coffee Organization 49
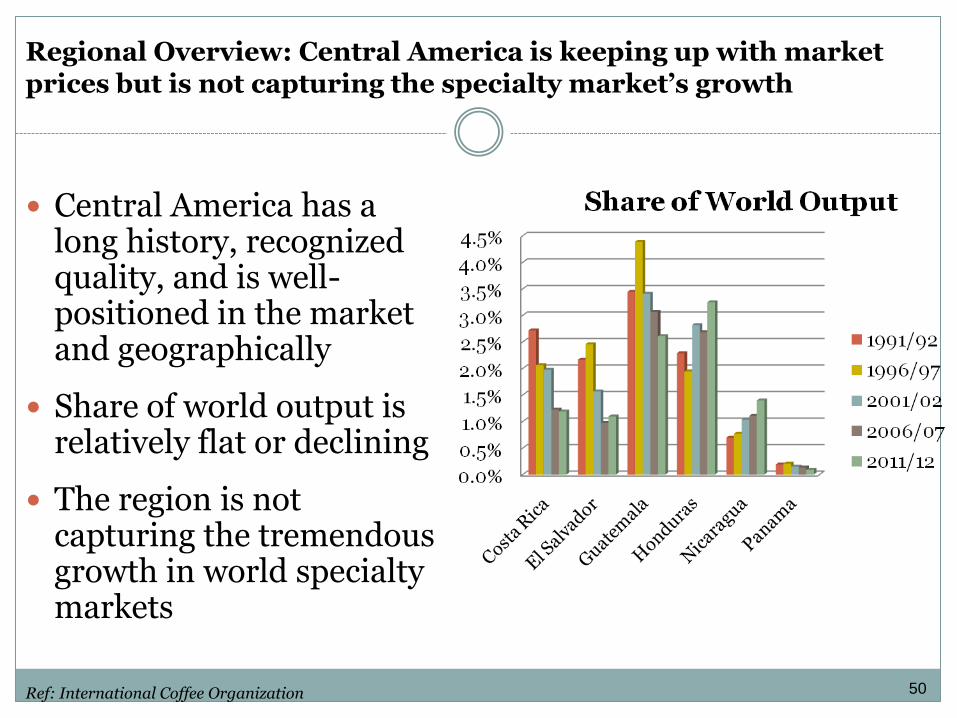
Regional Overview: Central America is keeping up with market prices but is not capturing the specialty market’s growth
Central America has a long history, recognized quality, and is well-positioned in the market and geographically
Share of world output is relatively flat or declining
The region is not capturing the tremendous growth in world specialty markets
Ref: International Coffee Organization 50
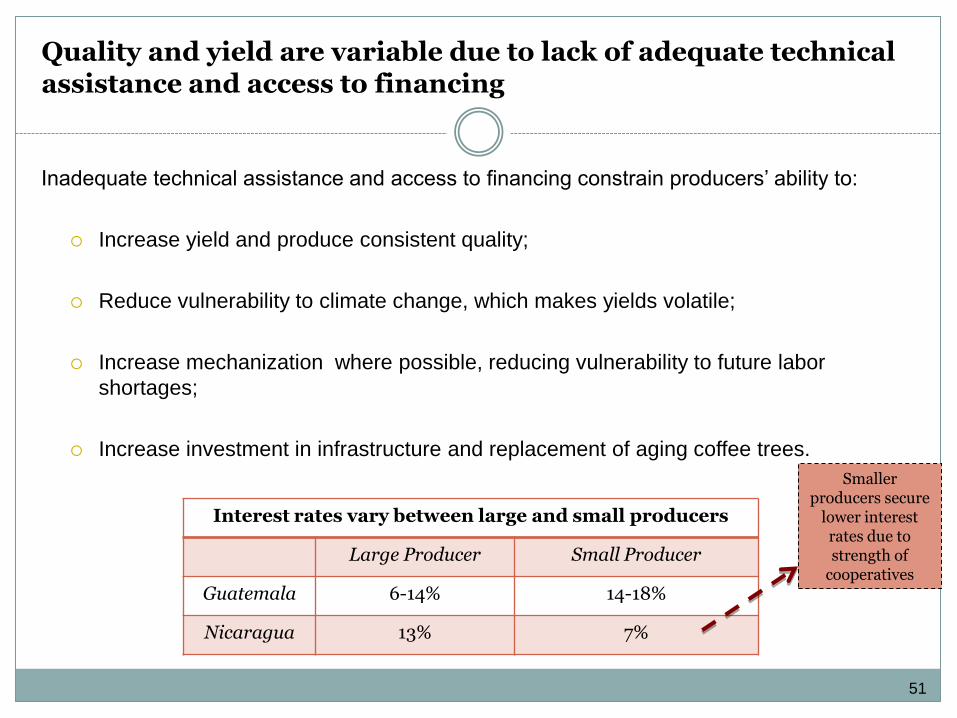
Quality and yield are variable due to lack of adequate technical assistance and access to financing
Inadequate technical assistance and access to financing constrain producers’ ability to:
Increase yield and produce consistent quality;
Reduce vulnerability to climate change, which makes yields volatile;
Increase mechanization where possible, reducing vulnerability to future labor
shortages;
Increase investment in infrastructure and replacement of aging coffee trees.
Interest rates vary between large and small producers
Large Producer Small Producer
Guatemala 6-14% 14-18%
Nicaragua 13% 7%
Smaller producers secure
lower interest rates due to strength of
cooperatives
51

The competitive environment in Nicaragua results in medium and large producers being held captive by two main exporters
1. Small producers work through cooperatives
to access international markets, technical
assistance, and financing
2. Two exporters in Nicaragua control 75% of
all exports. The lack of competition in this
segment of the value chain can constrain
the flow of market information and impede
innovation.
52
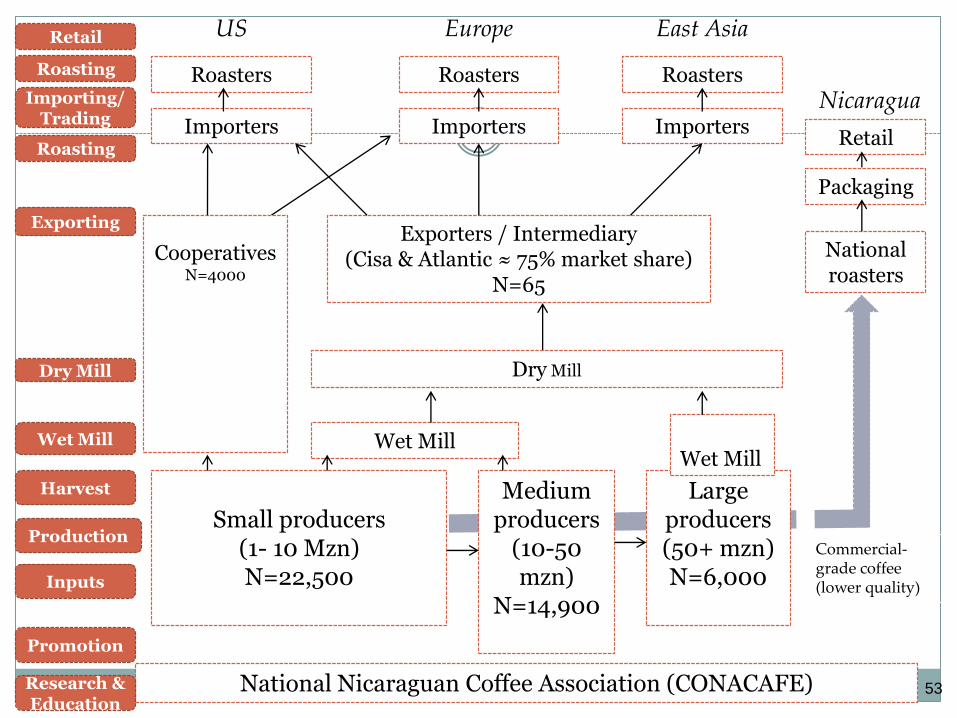
National Nicaraguan Coffee Association (CONACAFE)
Small producers
(1- 10 Mzn) N=22,500
Medium producers
(10-50 mzn)
N=14,900
Large producers (50+ mzn) N=6,000
Cooperatives N=4000
Wet Mill
Wet Mill
Exporters / Intermediary (Cisa & Atlantic ≈ 75% market share)
N=65
Importers Importers Importers
Roasters Roasters Roasters
US Europe East Asia
Harvest
Retail
Exporting
Importing/ Trading
Dry Mill
Wet Mill
Roasting
Roasting
Production
Inputs
Promotion
Research & Education
National roasters
Packaging
Retail
Nicaragua
Dry Mill
Commercial-grade coffee (lower quality)
53
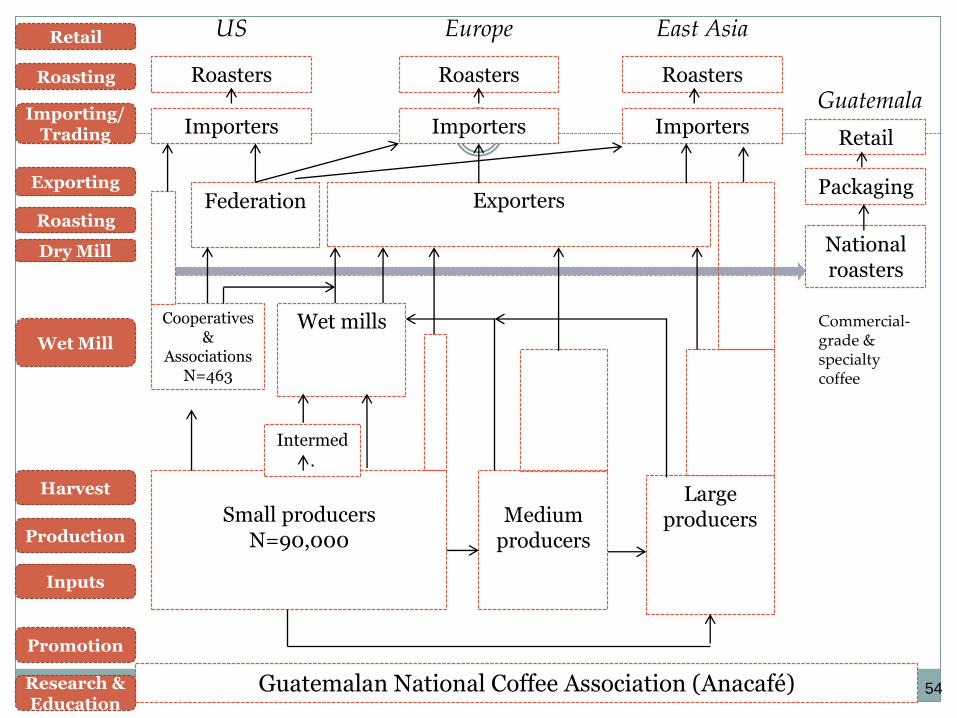
Guatemalan National Coffee Association (Anacafé)
Small producers
N=90,000
Medium
producers
Large producers
Cooperatives &
Associations N=463
Wet mills
Intermed.
Exporters
Importers Importers Importers
Roasters Roasters Roasters
US Europe East Asia
Federation
Harvest
Retail
Exporting
Importing/ Trading
Dry Mill
Wet Mill
Roasting
Roasting
Production
Inputs
Promotion
Research & Education
National roasters
Packaging
Retail
Guatemala
Commercial-grade & specialty coffee
54
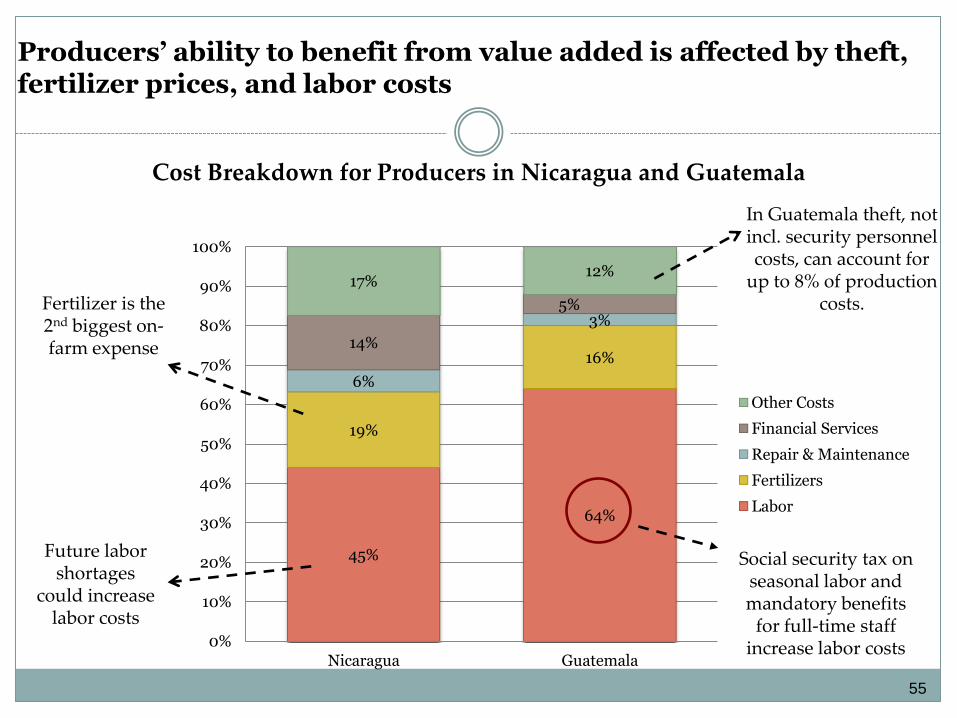
45%
64%
19%
16%
6%
3%
14%
5%
17% 12%
0%
10%
20%
30%
40%
50%
60%
70%
80%
90%
100%
Nicaragua Guatemala
Other Costs
Financial Services
Repair & Maintenance
Fertilizers
Labor
Fertilizer is the 2nd biggest on-farm expense
Future labor shortages
could increase labor costs
In Guatemala theft, not incl. security personnel costs, can account for
up to 8% of production costs.
Cost Breakdown for Producers in Nicaragua and Guatemala
Producers’ ability to benefit from value added is affected by theft, fertilizer prices, and labor costs
Social security tax on seasonal labor and mandatory benefits
for full-time staff increase labor costs
55
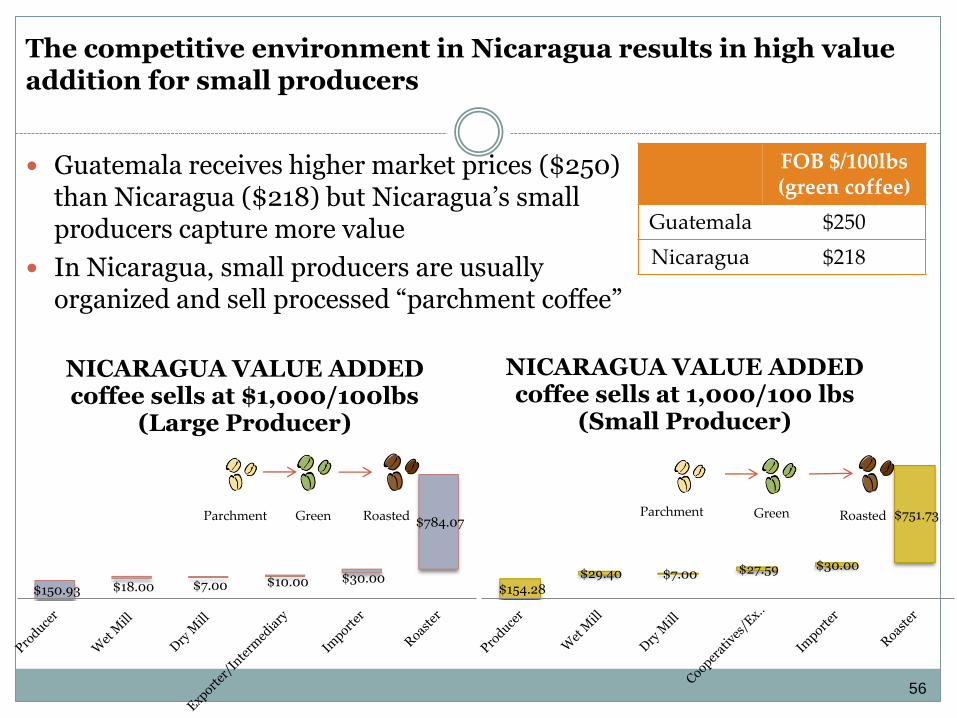
The competitive environment in Nicaragua results in high value addition for small producers
Guatemala receives higher market prices ($250) than Nicaragua ($218) but Nicaragua’s small producers capture more value
In Nicaragua, small producers are usually organized and sell processed “parchment coffee”
FOB $/100lbs (green coffee)
Guatemala $250
Nicaragua $218
Parchment Green Roasted Parchment Green Roasted
$150.93 $18.00 $7.00 $10.00 $30.00
$784.07
NICARAGUA VALUE ADDED coffee sells at $1,000/100lbs
(Large Producer)
$154.28 $29.40 $7.00 $27.59 $30.00
$751.73
NICARAGUA VALUE ADDED coffee sells at 1,000/100 lbs
(Small Producer)
56
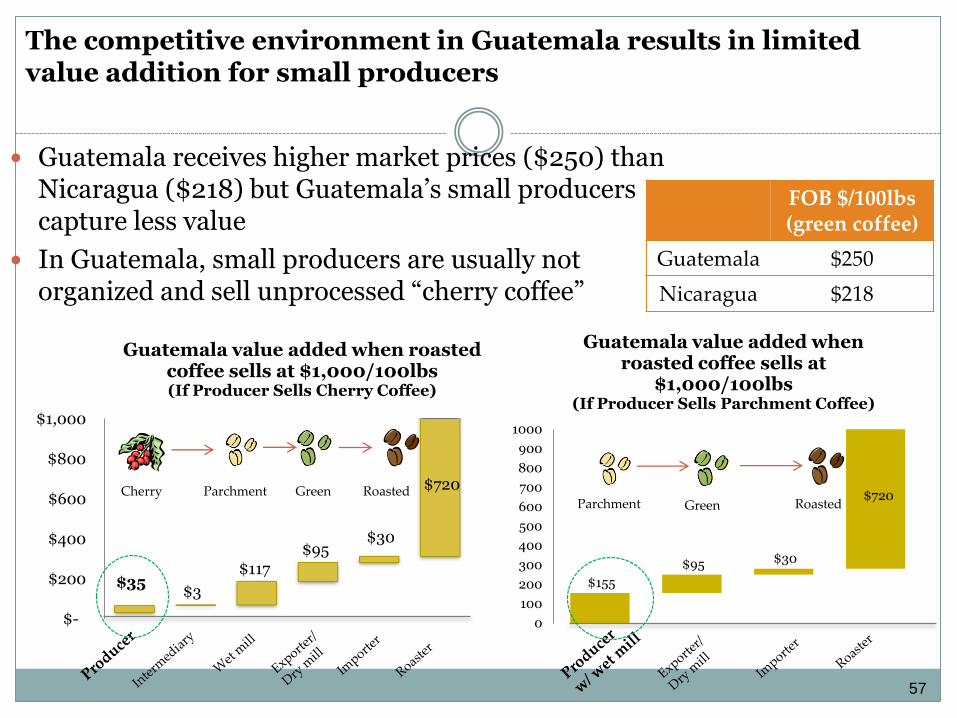
The competitive environment in Guatemala results in limited value addition for small producers
Guatemala receives higher market prices ($250) than Nicaragua ($218) but Guatemala’s small producers capture less value
In Guatemala, small producers are usually not organized and sell unprocessed “cherry coffee”
$35 $3
$117 $95
$30
$720
$-
$200
$400
$600
$800
$1,000
Guatemala value added when roasted coffee sells at $1,000/100lbs (If Producer Sells Cherry Coffee)
FOB $/100lbs (green coffee)
Guatemala $250
Nicaragua $218
$720
$155
$95 $30
0
100
200
300
400
500
600
700
800
900
1000
Guatemala value added when roasted coffee sells at
$1,000/100lbs (If Producer Sells Parchment Coffee)
Cherry Parchment Green Roasted Parchment Green Roasted
57
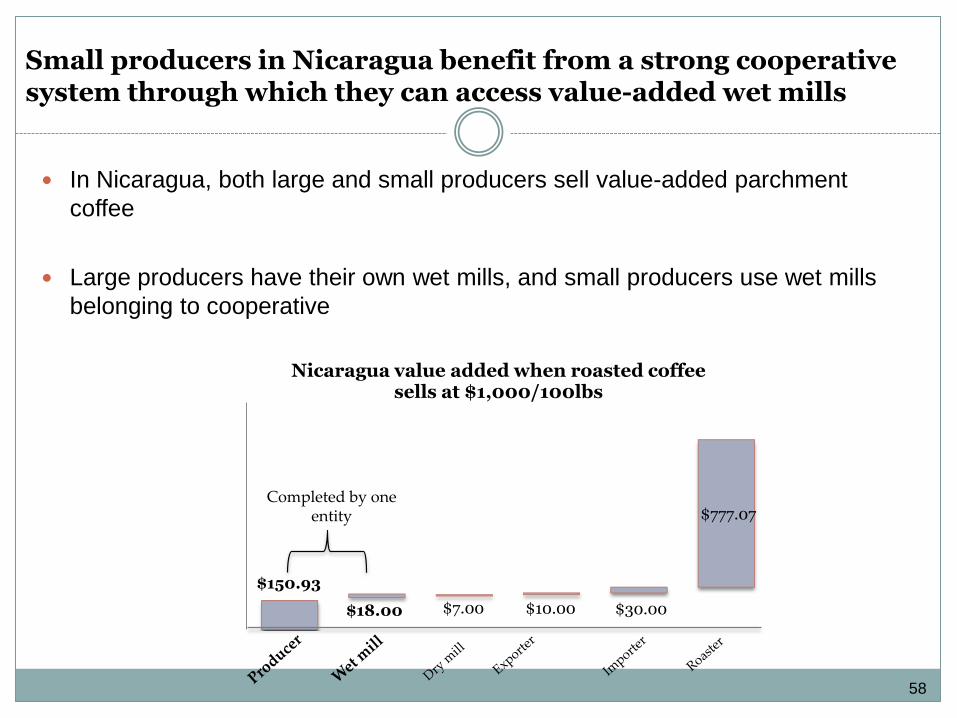
In Nicaragua, both large and small producers sell value-added parchment
coffee
Large producers have their own wet mills, and small producers use wet mills
belonging to cooperative
Small producers in Nicaragua benefit from a strong cooperative system through which they can access value-added wet mills
$150.93
$18.00 $7.00 $10.00 $30.00
$777.07
Nicaragua value added when roasted coffee sells at $1,000/100lbs
Completed by one entity
58
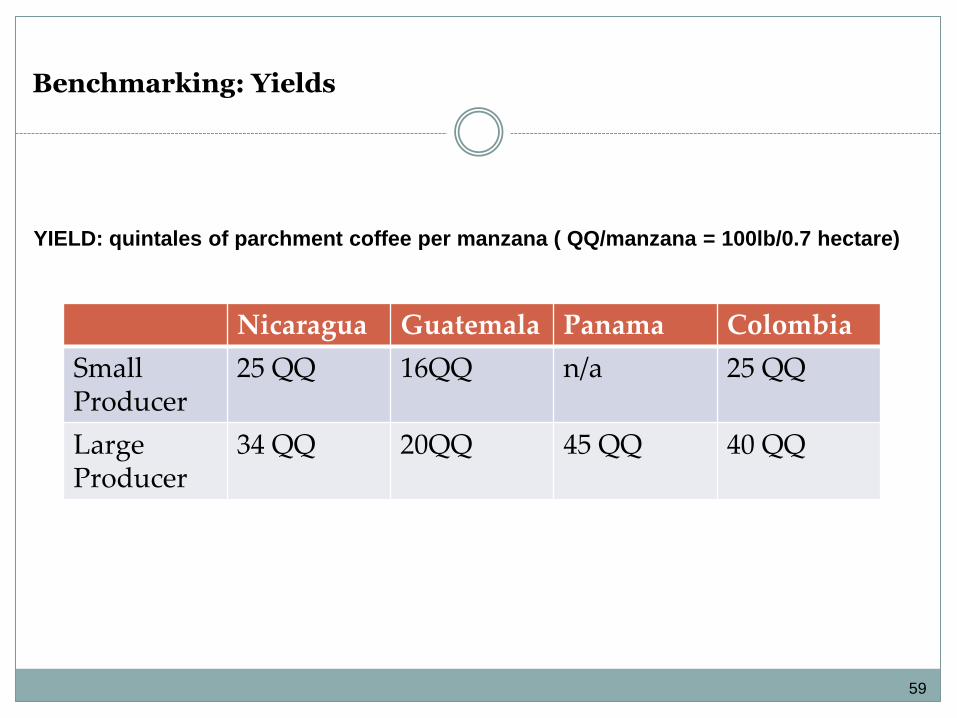
YIELD: quintales of parchment coffee per manzana ( QQ/manzana = 100lb/0.7 hectare)
Nicaragua Guatemala Panama Colombia
Small Producer
25 QQ 16QQ n/a 25 QQ
Large Producer
34 QQ 20QQ 45 QQ 40 QQ
Benchmarking: Yields
59
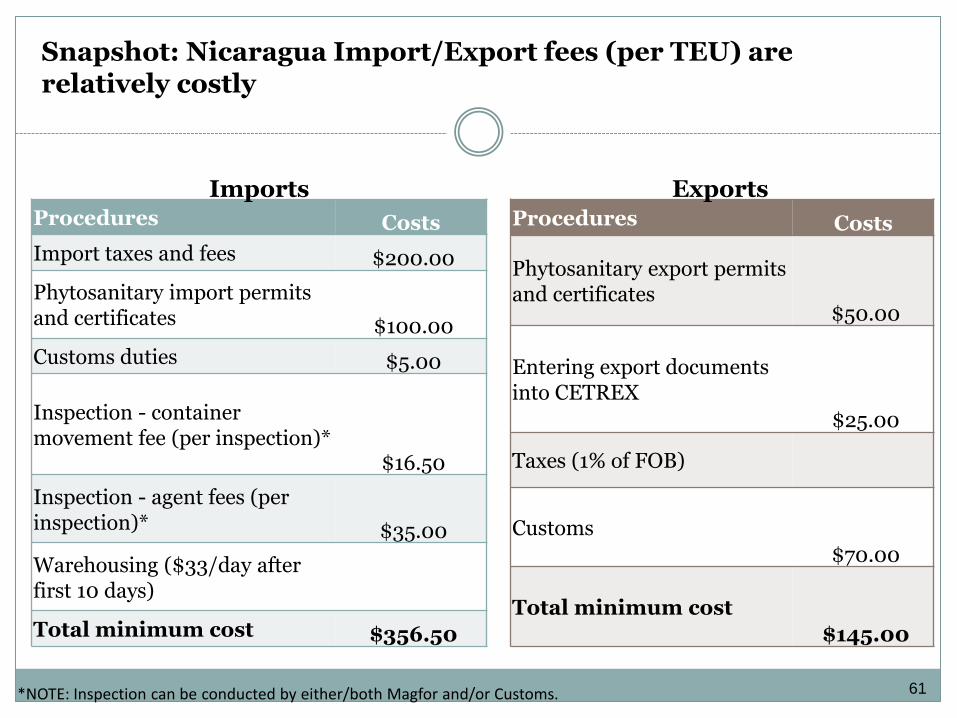
Snapshot: Nicaragua Import/Export fees (per TEU) are relatively costly
Procedures Costs
Import taxes and fees $200.00
Phytosanitary import permits and certificates $100.00
Customs duties $5.00
Inspection - container movement fee (per inspection)*
$16.50
Inspection - agent fees (per inspection)* $35.00
Warehousing ($33/day after first 10 days)
Total minimum cost $356.50
*NOTE: Inspection can be conducted by either/both Magfor and/or Customs.
Procedures Costs
Phytosanitary export permits and certificates
$50.00
Entering export documents into CETREX
$25.00
Taxes (1% of FOB)
Customs
$70.00
Total minimum cost
$145.00
Imports Exports
61
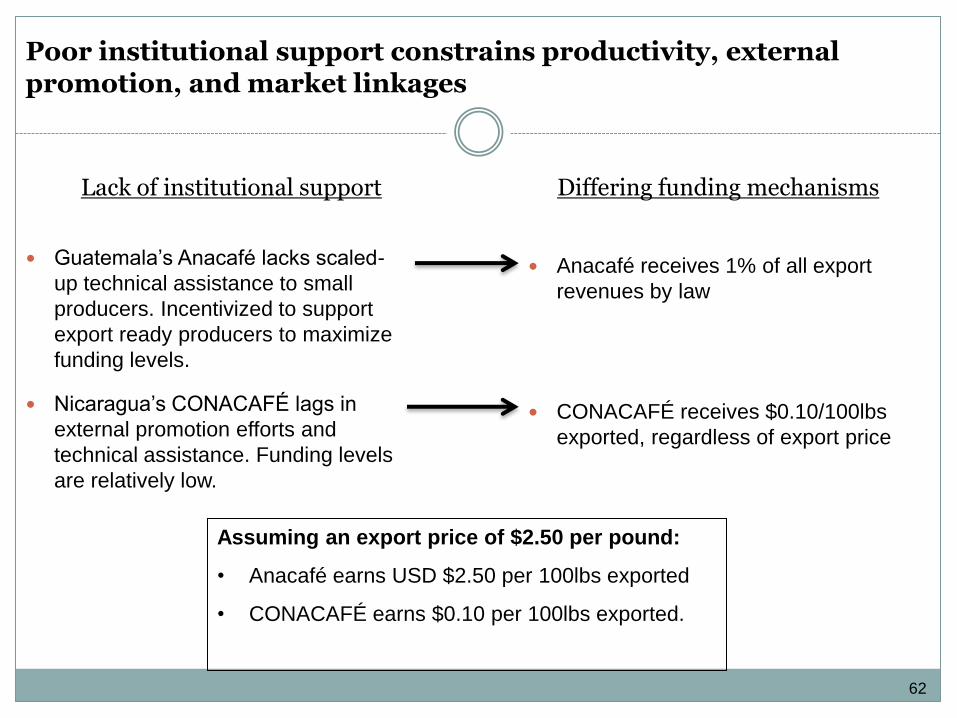
Poor institutional support constrains productivity, external promotion, and market linkages
Guatemala’s Anacafé lacks scaled-
up technical assistance to small
producers. Incentivized to support
export ready producers to maximize
funding levels.
Nicaragua’s CONACAFÉ lags in
external promotion efforts and
technical assistance. Funding levels
are relatively low.
Anacafé receives 1% of all export
revenues by law
CONACAFÉ receives $0.10/100lbs
exported, regardless of export price
Lack of institutional support Differing funding mechanisms
62
Assuming an export price of $2.50 per pound:
• Anacafé earns USD $2.50 per 100lbs exported
• CONACAFÉ earns $0.10 per 100lbs exported.
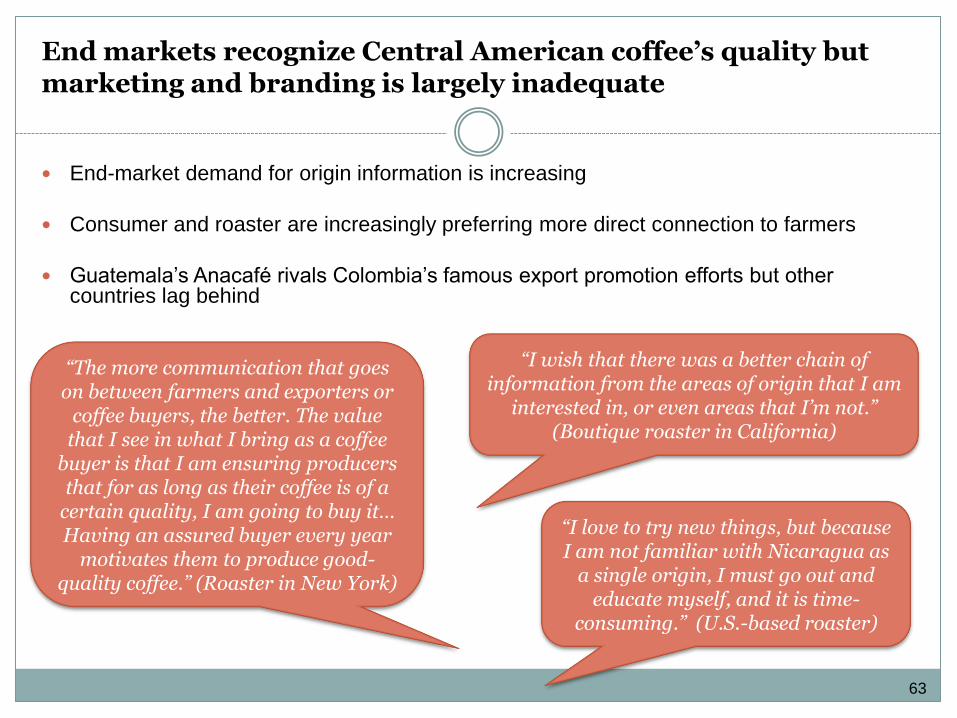
End markets recognize Central American coffee’s quality but marketing and branding is largely inadequate
End-market demand for origin information is increasing
Consumer and roaster are increasingly preferring more direct connection to farmers
Guatemala’s Anacafé rivals Colombia’s famous export promotion efforts but other countries lag behind
“I wish that there was a better chain of
information from the areas of origin that I am interested in, or even areas that I’m not.”
(Boutique roaster in California)
“I love to try new things, but because I am not familiar with Nicaragua as
a single origin, I must go out and educate myself, and it is time-
consuming.” (U.S.-based roaster)
“The more communication that goes on between farmers and exporters or
coffee buyers, the better. The value that I see in what I bring as a coffee
buyer is that I am ensuring producers that for as long as their coffee is of a
certain quality, I am going to buy it… Having an assured buyer every year
motivates them to produce good-quality coffee.” (Roaster in New York)
63
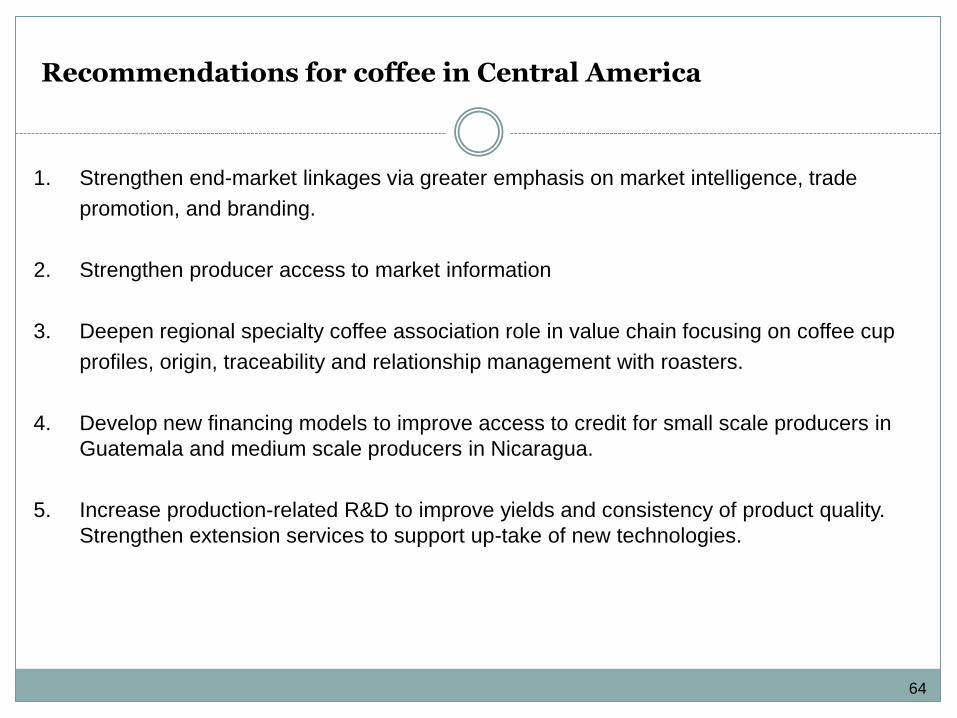
Recommendations for coffee in Central America
1. Strengthen end-market linkages via greater emphasis on market intelligence, trade
promotion, and branding.
2. Strengthen producer access to market information
3. Deepen regional specialty coffee association role in value chain focusing on coffee cup
profiles, origin, traceability and relationship management with roasters.
4. Develop new financing models to improve access to credit for small scale producers in
Guatemala and medium scale producers in Nicaragua.
5. Increase production-related R&D to improve yields and consistency of product quality.
Strengthen extension services to support up-take of new technologies.
64

Kenneth Hynes
Skype: ken hynes
Tel: +1-617-312-3213
Contact information
65

C O N T R I B U T E D B Y T H E F L E T C H E R S C H O O L O F L A W & D I P L O M A C Y
A N D T H E F O L L O W I N G S T U D E N T S :
K R I S A N N E C A M P O S
E L I Z A B E T H H E N R Y
S T E P H A N I E L A N D E R S
A N D R E A M O L I N A
J O N A T H A N T O R N
66