central america macro watch april 20, 2006. agenda external financial conditions economic growth and...
TRANSCRIPT
Central America Macro Watch
Central America Macro Watch
April 20, 2006April 20, 2006

Agenda
• External Financial Conditions
• Economic Growth and Outlook
• The Real Exchange Rate and Inflation
• Effects of Oil Price Increases
• The MDRI Initiative and its Impact

-2.0
-1.0
0.0
1.0
2.0
3.0
4.0
5.0
6.0
7.0
1997 1998 1999 2000 2001 2002 2003 2004 2005 F 2006 F
Net Capital Capital Account FDI Portfolio Other investments Errors and Omissions
Capital Flows, CAC-7Capital Flows, CAC-7(US$ Billion)(US$ Billion)
Capital Flows have kept on increasing, and have hovered Capital Flows have kept on increasing, and have hovered steadily…steadily…
Source: BoPs (April 2006), WEO(Sep 2005). Includes errors and omissions.
CAC 7 = Costa Rica, Dominican Republic, El Salvador, Guatemala, Honduras, Nicaragua and Panama
Argentinean Crisis
Russian Crisis
Asian Crisis
Total FlowsDominican
Crisis

Capital Flows, LAC 7 & CAC 7(index 1997=100)
...in contrast with LAC7 countries...in contrast with LAC7 countries
Source: BoPs (April 2006), WEO(Sep. 2005).
CAC 7 = Costa Rica, Dominican Republic , El Salvador, Guatemala, Honduras, Nicaragua and PanamaLAC 7 = Argentina, Brazil, Chile, Colombia, Mexico, Peru and Venezuela* Total Capital Flows include errors and omissions.
Asian Crisis
Russian Crisis
Argentinean Crisis
Dominican Crisis
-20
0
20
40
60
80
100
120
140
1997 1998 1999 2000 2001 2002 2003 2004 2005 F 2006 F
(In
de
x 1
99
7=
10
0)
CAC7 LAC7

External Financial ConditionsSpreads over US Treasury Bills (basis points)
Source: Bloomberg
The CAC7 Sovereign Spreads are from JP Morgan’s Latin Eurobond Index and include Costa Rica, El Salvador, Guatemala and Panama. The index shown above is an average weighted by market capitalization.
This is reflected in lower spread volatility in Central This is reflected in lower spread volatility in Central America...America...
Enron Effect
BanInter Intervention
Sovereign Spread CAC7 Excl. Dominican Rep.
EMBI+ Excl. Argentina
0
100
200
300
400
500
600
700
800
900
1000
Apr
-02
Jun-
02
Aug
-02
Oct
-02
Dec
-02
Feb
-03
Apr
-03
Jun-
03
Aug
-03
Oct
-03
Dec
-03
Feb
-04
Apr
-04
Jun-
04
Aug
-04
Oct
-04
Dec
-04
Feb
-05
Apr
-05
Jun-
05
Aug
-05
Oct
-05
Dec
-05
Feb
-06

GDP at Constant Prices(index 1997=100, regional averages)
...higher GDP growth in the region......higher GDP growth in the region...
Source: WEO (Sep. 2005).
LAC7= Argentina, Brazil, Chile, Colombia, Mexico, Peru and Venezuela
CAC 7 = Costa Rica, Dominican Republic, El Salvador, Guatemala, Honduras, Nicaragua and Panama
Asian CrisisRussian Crisis
Argentinean Crisis
CAC 7
LAC 7
60
70
80
90
100
110
120
130
140
150
1997 1998 1999 2000 2001 2002 2003 2004 2005 2006
Index 1
99
7=
10
0

....and most of all in real exchange rate stability.....and most of all in real exchange rate stability.CAC7– Bilateral Real Exchange Rate Index (1997=100)
LAC7= Argentina, Brazil, Chile, Colombia, México, Peru and Venezuela
CAC 7 = Costa Rica, Dominican Republic, El Salvador, Guatemala, Honduras, Nicaragua and Panama
The bilateral real exchange rate is the regional average.
Source: IFS, WEO (Sep. 2005) and own estimates.
Argentinean Crisis
Russian Crisis
Asian Crisis BanInter
Intervention
50
100
150
200
Jan
-97
Jul-9
7
Jan
-98
Jul-9
8
Jan
-99
Jul-9
9
Jan
-00
Jul-0
0
Jan
-01
Jul-0
1
Jan
-02
Jul-0
2
Jan
-03
Jul-0
3
Jan
-04
Jul-0
4
Jan
-05
Jul-0
5
(In
de
x 1
99
7=
10
0)
CAC7 LAC7 CAC7 (Excl. Dom Rep)

Source: WEO (Sep-05), BoPs (April-2006)Source: WEO (Sep-05), BoPs (April-2006)
CAC 7 = Costa Rica, Dominican Rep., El Salvador, Guatemala, Honduras, Nicaragua and Panama
Current Account Balance & Remittances, CAC7Current Account Balance & Remittances, CAC7(% of GDP)(% of GDP)
Although remittances have financed a big share of the Although remittances have financed a big share of the current account deficit...current account deficit...
-6.2% -6.4%
-7.8%
-6.8%
-5.7% -5.7%
-4.8%-4.4%
-5.0%-4.7%
-10.3%-11.0%
-13.0%-12.5%
-11.8%
-12.9%-13.2%
-13.7%-14.1%
-13.6%
-16.0%
-14.0%
-12.0%
-10.0%
-8.0%
-6.0%
-4.0%
-2.0%
0.0%
1997 1998 1999 2000 2001 2002 2003 2004 2005F 2006F
CA CA w/o Remittances

Source: BoPs (April 2006), WEO (Sep-05). Source: BoPs (April 2006), WEO (Sep-05).
CAC 7 = Costa Rica, Dominican Rep., El Salvador, Guatemala, Honduras, Nicaragua and Panama
Capital Flows and Remittances, CAC-7Capital Flows and Remittances, CAC-7(US Dollar Billion)(US Dollar Billion)
...they have been growing steadily, and apparently isolated ...they have been growing steadily, and apparently isolated from economic cycles.from economic cycles.
0
2
4
6
8
10
12
1990
1991
1992
1993
1994
1995
1996
1997
1998
1999
2000
2001
2002
2003
2004
2005
F
2006
F
Net Capital Flows Remittances
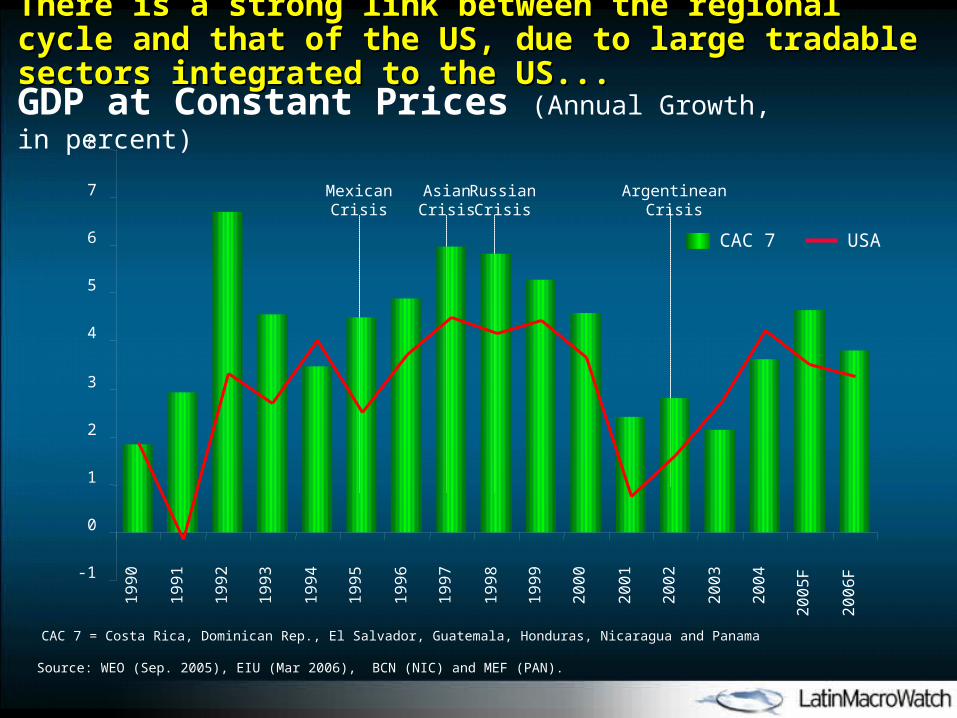
There is a strong link between the regional cycle and that of There is a strong link between the regional cycle and that of the US, due to large tradable sectors integrated to the US...the US, due to large tradable sectors integrated to the US...
Source: WEO (Sep. 2005), EIU (Mar 2006), BCN (NIC) and MEF (PAN).
CAC 7 USA
CAC 7 = Costa Rica, Dominican Rep., El Salvador, Guatemala, Honduras, Nicaragua and Panama
GDP at Constant Prices (Annual Growth, in percent)
Argentinean Crisis
Russian Crisis
Asian Crisis
Mexican Crisis
-1
0
1
2
3
4
5
6
7
81
99
0
19
91
19
92
19
93
19
94
19
95
19
96
19
97
19
98
19
99
20
00
20
01
20
02
20
03
20
04
20
05
F
20
06
F

CAC 7 = Costa Rica, Dominican Rep., El Salvador, Guatemala, Honduras, Nicaragua and Panama
GDP Growth, CAC7 (in percent, 2005E vs. 2006F)
Following lower growth expectations in the US, somewhat Following lower growth expectations in the US, somewhat lower growth is forecasted for 2006lower growth is forecasted for 2006
Source: EIU Country Reports (Mar 2006)
CRI
DOM
SLV
GTM HON
NIC
PAN
-10.0
-8.0
-6.0
-4.0
-2.0
0.0
2.0
4.0
6.0
8.0
10.0
-10.0 -8.0 -6.0 -4.0 -2.0 0.0 2.0 4.0 6.0 8.0 10.0
GDP growth in 2005E
GD
P g
row
th in
20
06
F

Inflation and the Real Inflation and the Real Exchange RateExchange Rate

Source: Central Banks, WEO (Sep-2005), EIU (March-2005)
CAC7 – Inflation Rate (%)CAC7 – Inflation Rate (%)
The region has experienced a sustained increase in inflation. The region has experienced a sustained increase in inflation. What drives this process? What drives this process?
0
2
4
6
8
10
12
14
16
CRI SLV GTM HON NIC PAN
%
2002 2003 2004 2005
0
5
10
15
20
25
30
35
40
45
50
55
DOM
Do
min
ica
n R
ep
ub
lic (
%)

In many cases, an important policy objective is to ensure In many cases, an important policy objective is to ensure real exchange rate stability...real exchange rate stability...CAC7– Bilateral Real Exchange Rate Index (1997=100)
LAC7= Argentina, Brazil, Chile, Colombia, México, Peru and Venezuela
CAC 7 = Costa Rica, Dominican Republic, El Salvador, Guatemala, Honduras, Nicaragua and Panama
The bilateral real exchange rate is the regional average.
Source: IFS, WEO (Sep. 2005) and own estimates.
Argentinean Crisis
Russian Crisis
Asian Crisis BanInter
Intervention
50
100
150
200
Jan
-97
Jul-9
7
Jan
-98
Jul-9
8
Jan
-99
Jul-9
9
Jan
-00
Jul-0
0
Jan
-01
Jul-0
1
Jan
-02
Jul-0
2
Jan
-03
Jul-0
3
Jan
-04
Jul-0
4
Jan
-05
Jul-0
5
(In
de
x 1
99
7=
10
0)
CAC7 LAC7 CAC7 (Excl. Dom Rep)

Source: IFS. Own estimates.
CAC7 – Bilateral Real Exchange Rate with the US CAC7 – Bilateral Real Exchange Rate with the US (1997=100)(1997=100)
75
100
125
150
175
Jan-
97
May
-97
Sep
-97
Jan-
98
May
-98
Sep
-98
Jan-
99
May
-99
Sep
-99
Jan-
00
May
-00
Sep
-00
Jan-
01
May
-01
Sep
-01
Jan-
02
May
-02
Sep
-02
Jan-
03
May
-03
Sep
-03
Jan-
04
May
-04
Sep
-04
Jan-
05
May
-05
Sep
-05
Jan-
06
Costa Rica Dominican Rep. El Salvador Guatemala Honduras Nicaragua Panama

1616Source: BoPs (April 2006), Central Banks, WEO (Sep-05)Source: BoPs (April 2006), Central Banks, WEO (Sep-05)
Remittances by Country Remittances by Country (% of GDP)
The substantial increase of remittances has been a source of The substantial increase of remittances has been a source of potential real exchange rate appreciation.potential real exchange rate appreciation.
0%
5%
10%
15%
20%
25%
CRI DOM SLV GTM HON NIC PAN
2001 2002 2003 2004 2005
270% increase
85% increase

1717
* General Government Balances include grants. Source: WEO (Sep-05), Central Banks, IMF Country Reports
Non-Financial Public Sector Balance (% of GDP)*
Fiscal deficit financing is large in many cases...Fiscal deficit financing is large in many cases...
-9.0%
-8.0%
-7.0%
-6.0%
-5.0%
-4.0%
-3.0%
-2.0%
-1.0%
0.0%
1.0%
CRI DOM SLV GTM HON NIC PAN
2001 2002 2003 2004 2005F
• Regional average for 2005: -2.2% of GDP

CAC 7 – Central Bank Debt (% of GDP)
Source: Central Banks. Information for Costa Rica and Honduras as of Feb-2006
……in an effort to keep inflation at bay and stabilize the real in an effort to keep inflation at bay and stabilize the real exchange rate, Central Banks sterilize the associated monetary exchange rate, Central Banks sterilize the associated monetary
expansion...expansion...
0%
2%
4%
6%
8%
10%
12%
14%
16%
18%
CRI DOM SLV GTM HON NIC
2001 2002 2003 2004 2005 Mar 2006
• Regional average for 2005: 8.4% of GDP

Source: Central Banks and IMF.
CAC 7 –Net Central Bank Losses (2003-2005, % of GDP)
...at a high quasi-fiscal cost. ...at a high quasi-fiscal cost.
0.0%
0.5%
1.0%
1.5%
2.0%
2.5%
3.0%
3.5%
4.0%
4.5%
CRI DOM GTM HON NIC
2003 2004 2005
• Regional average for 2005: 1.4% of GDP
2005 Average

An example of Likely Deviation from Equilibrium RER by An example of Likely Deviation from Equilibrium RER by 2004: Guatemala2004: Guatemala
3.2
3.6
4.0
4.4
4.8
5.2
86 88 90 92 94 96 98 00 02 04
A c tu a l Equilibrium REER P Equilibrium REER T
• However, strong real appreciation has taken place in 2005-2006 (11% )

Effects of Oil Price Effects of Oil Price IncreasesIncreases

Oil Price BehaviorOil Price Behavior
Spot Price Crude WTI Cushing. Source: Bloomberg.
343%
0
10
20
30
40
50
60
70
80Ja
n-9
7
Jul-9
7
Jan
-98
Jul-9
8
Jan
-99
Jul-9
9
Jan
-00
Jul-0
0
Jan
-01
Jul-0
1
Jan
-02
Jul-0
2
Jan
-03
Jul-0
3
Jan
-04
Jul-0
4
Jan
-05
Jul-0
5
Jan
-06
Oil
Pri
ce
- U
S$
/Ba
rre
l

Fuel Imports as a Share of Total ImportsFuel Imports as a Share of Total Imports
0%
5%
10%
15%
20%
25%
30%
35%
40%
Costa Rica Dom Republic El Salvador Guatemala Honduras Nicaragua Panama
2002 2003 2004 2005
Note: Excludes maquila or free zone imports. Source: Central Banks.
Average (2005)

Note: The Fund’s September 2005 World Economic Outlook (WEO) now envisages world oil prices averaging US$54.1/bbl in 2005 and US$61.8/bbl in 2006, some 17 percent and 40 percent higher, respectively, than projected in the April 2005 WEO.
Source: Singh, Anoop. Global Context and Regional Outolook for Latin America and the Caribbean. IMF. October 2005.
LAC: Oil price impact on economic activity and Inflation(in % )
Net oil Exporters
South America
Central America
The Caribbean
Latin America and the Caribbean
3.0%
2005 2006 2005 2006
Inflation Growth
2.5%
2.0%
1.5%
1.0%
0.5%
0.0%
-0.5%
-1.0%
-1.5%
Estimates of the impact of the change of WEO oil price assumptions in the LAC Region

Note: Preliminary results.
* Average change in Oil Prices estimated between 2004 and 2005 for the Spot Prices of the West Texas Intermediate.** Forecast based on annual growth rate of Oil Prices from IMF.Source: Central Banks, Bloomberg, and BoPs (April 2006); own estimates.
Effect of an increase in the Price of Oil over the Effect of an increase in the Price of Oil over the Real Exchange RateReal Exchange Rate
CRI DOM SLV GTM HND NIC PAN
Net Oil Imports (US$ million, 2004) 582 1449 460 910 637 377 511Oil Price Increase 2004-2005 (%)* 37.7%Oil Price Increase 2004-2006 (%)** 57.3%
Oil Imports Increase 2004-2005 As a share of GDP 2005 1.1 2.5 1.0 1.3 3.0 2.8 1.3 As a share of Imports 2004 3.1 8.3 2.9 3.8 5.1 5.9 3.8Oil Imports Increase 2004-2006 As a share of GDP 2005 1.7 3.8 1.6 1.9 4.6 4.3 2.0 As a share of Imports 2004 4.7 12.6 4.4 5.7 7.8 9.0 5.8
Change in REER required (2004-2005) 7.7 20.8 7.3 9.4 12.9 14.7 9.6 Number of Standard Deviations 4.2 1.1 4.4 1.4 4.4 5.7 10.3Change in REER required (2004-2006) 11.7 31.6 11.0 14.3 19.6 22.4 14.5
Number of Standard Deviations 6.4 1.7 6.7 2.2 6.7 8.7 15.7
So far, given favorable financing conditions, the oil shock So far, given favorable financing conditions, the oil shock has been absorbed without major RER effects. But things has been absorbed without major RER effects. But things could be different in the absence of foreign financingcould be different in the absence of foreign financing
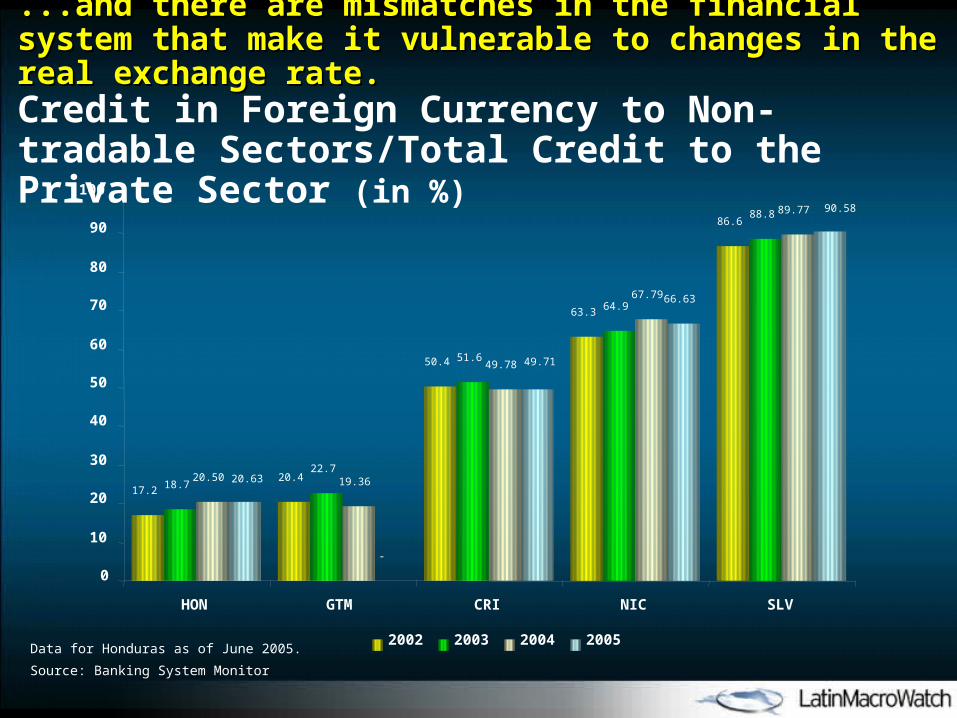
Data for Honduras as of June 2005.
Source: Banking System Monitor
...and there are mismatches in the financial system that make ...and there are mismatches in the financial system that make it vulnerable to changes in the real exchange rate.it vulnerable to changes in the real exchange rate.
Credit in Foreign Currency to Non-tradable Sectors/Total Credit to the Private Sector (in %)
17.220.4
50.4
63.3
86.6
18.7
22.7
51.6
64.9
88.8
20.50 19.36
49.78
67.79
89.77
-
66.63
49.71
20.63
90.58
0
10
20
30
40
50
60
70
80
90
100
HON GTM CRI NIC SLV
2002 2003 2004 2005

Note: The ratio dB/de measures changes in total debt in percentage points of GDP (B) that would occur when the real exchange rate (e) variation of 100%
Source: Central Banks, Finance Ministries and IMF. Own estimates.Source: Central Banks, Finance Ministries and IMF. Own estimates.
Financial Exposure of the NFPS - dB/de (2004)
On the other hand, the public sector in some countries is On the other hand, the public sector in some countries is heavily exposed to RER depreciation.heavily exposed to RER depreciation.
CAC 7 LAC 7
0%
20%
40%
60%
80%
100%
120%N
IC
UR
U
PA
N
HN
D
SLV
PE
R
BO
L
JA
M
AR
G
CO
L
DO
M
CR
I
GT
M
BR
A
ME
X
VE
N
CH
L
Lo
w E
xp
osu
reH
igh
Exp
osu
re

Multilateral Debt Reduction Multilateral Debt Reduction InitiativeInitiative

Multilateral Debt Relief Initiative (MDRI)
• Coverage: HIPC countries that have reached, or will eventually reach, their completion point, plus non-HIPC countries with a GDP per capita at or below US$380.
• Relief: 100 % of debt with three multilateral institutions: IMF, IDA, and ADF.
• Amount: About US$50 billion in nominal terms (outstanding stocks as of Dec-2004).
• Qualifying IADB members: Bolivia, Guyana, Honduras and Nicaragua.
• Allocation: In contrast to HIPC initiative, there is no specific allocation for social expenditure increases.
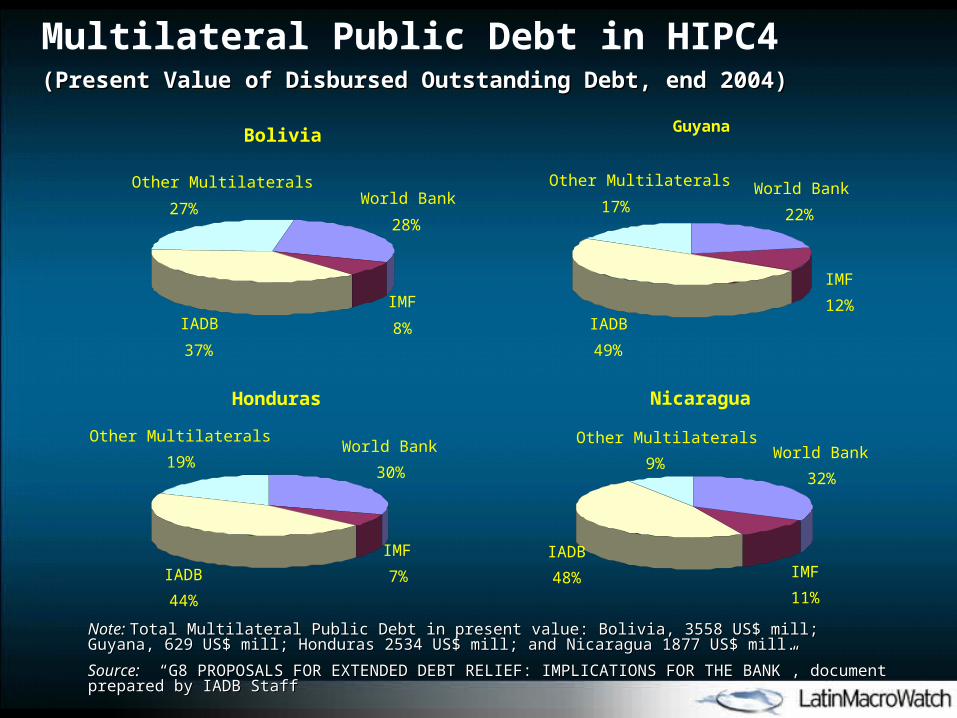
Multilateral Public Debt in HIPC4(Present Value of Disbursed Outstanding Debt, end 2004)(Present Value of Disbursed Outstanding Debt, end 2004)
Note: Note: Total Multilateral Public Debt in present value: Bolivia, 3558 US$ mill; Guyana, 629 US$ mill; Honduras Total Multilateral Public Debt in present value: Bolivia, 3558 US$ mill; Guyana, 629 US$ mill; Honduras 2534 US$ mill; and Nicaragua 1877 US$ mill.2534 US$ mill; and Nicaragua 1877 US$ mill.
Source:Source: “ “G8 PROPOSALS FOR EXTENDED DEBT RELIEF: IMPLICATIONS FOR THE BANKG8 PROPOSALS FOR EXTENDED DEBT RELIEF: IMPLICATIONS FOR THE BANK”, document ”, document prepared by IADB Staffprepared by IADB Staff
Bolivia
World Bank
28%
IMF
8%IADB
37%
Other Multilaterals
27%
Guyana
World Bank
22%
IMF
12%IADB
49%
Other Multilaterals
17%
Honduras
World Bank
30%
IMF
7%IADB
44%
Other Multilaterals
19%
Nicaragua
World Bank
32%
IMF
11%
IADB
48%
Other Multilaterals
9%

Impact of HIPC & MDRI: NPV of Public Debt as a share of GDP(2004, in %)
SourceSource: “: “G8 PROPOSALS FOR EXTENDED DEBT RELIEF: IMPLICATIONS FOR THE BANKG8 PROPOSALS FOR EXTENDED DEBT RELIEF: IMPLICATIONS FOR THE BANK”, document ”, document prepared by IADB Staff. Own calculationsprepared by IADB Staff. Own calculations
Ratio of Present Value of External Public Debt to GDP in 2004, in percent
0
20
40
60
80
100
Guyana Honduras Nicaragua Bolivia
Outstanding After HIPC After MDRI After IADB "MDRI"
15%27%
32%38%

SourceSource: GDF and IMF. Own calculations: GDF and IMF. Own calculations
0
5
10
15
20
25
Bolivia Guyana Honduras Nicaragua
Outstanding After HIPC After MDRI After IADB "MDRI"
1.4%3.3%
1.6% 1.7%
Impact of HIPC & MDRI: Amortization of Multilateral Public Debt to Reserves Ratio(2004, in %)
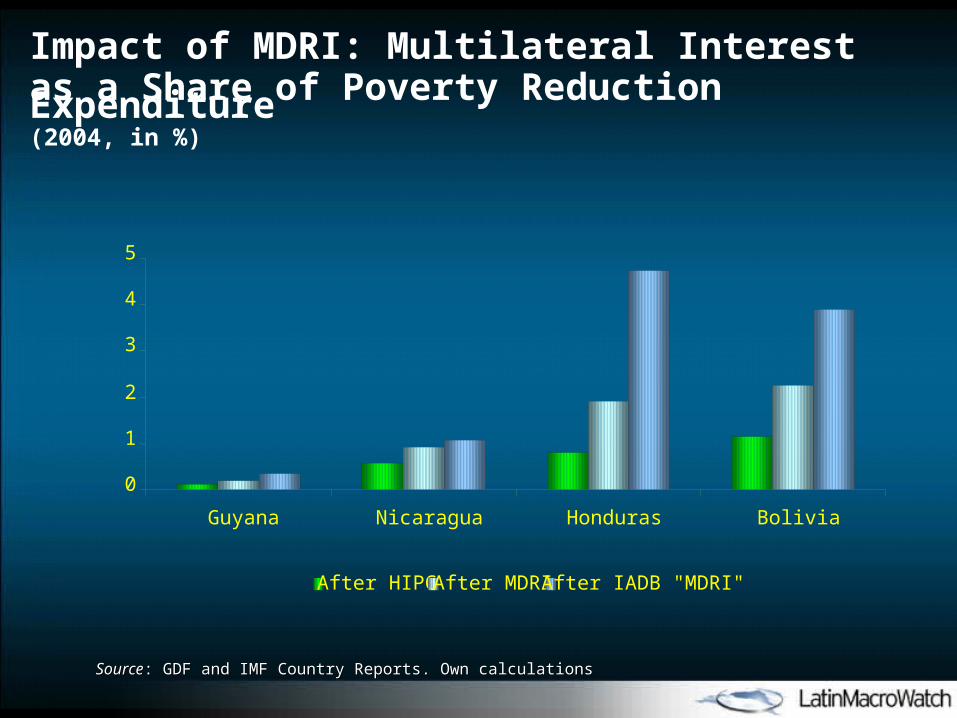
SourceSource: GDF and IMF Country Reports. Own calculations: GDF and IMF Country Reports. Own calculations
0
1
2
3
4
5
Guyana Nicaragua Honduras Bolivia
After HIPC After MDRI After IADB "MDRI"
Impact of MDRI: Multilateral Interestas a Share of Poverty Reduction Expenditure(2004, in %)

Central America Macro Watch
Central America Macro Watch
April 20, 2006April 20, 2006