centers for medicare & medicaid...
TRANSCRIPT

6/1/06 Pay-for-Performance Grant #18-P-93066/9-01 1 Focus On Therapeutic Outcomes, Inc.
Centers for Medicare & Medicaid Services
Final Report
6/1/06
Pay-for-Performance for Physical Therapy and Occupational Therapy: Medicare Part B Services
Grant #18-P-93066/9-01
Provided by Focus On Therapeutic Outcomes, Inc. Knoxville, TN
Principal Investigators: Dennis L. Hart, PhD, PT and Jerome B. Connolly, PT, CAE

6/1/06 Pay-for-Performance Grant #18-P-93066/9-01 2 Focus On Therapeutic Outcomes, Inc.
Table of Contents Executive Summary 3 Scope 6 Background 6 Methods and Results 13
Purpose 1: Risk-adjusted cut-points for Value Purchasing Payment Algorithm 13 Purpose 2: Cost differences between VPPA and fee-for-service - retrospective 24 Purpose 3: Prospective pay-for-performance data collection 26 Purpose 4: Cost differences between VPPA and fee-for-service – prospective 34 Purpose 5: Interpretations of results 37 Purpose 6: Possible new data for future data collection 39 Purpose 7: Guidelines for intermediaries and carriers to manage providers 42
Qualitative Assessment 44 Summary 49 References 50 Appendix 55 Tables 58
6/1/06 Pay-for-Performance Grant #18-P-93066/9-01 3 Focus On Therapeutic Outcomes, Inc.
Executive Summary Purpose. The purpose of this project was to implement a pay-for-performance (P4P) simulation, which would align financial incentives with the achievement of better clinical outcomes. The project was designed to demonstrate the feasibility of implementing a pay-for-performance process in outpatient physical and occupational therapy, provide information to Medicare concerning payment policy for outpatient physical and occupational therapy, and discuss implications for the development of an alternative payment method as required by Balanced Budget Act of 1997. The study does not indicate a direction, recommendation or endorsement of the P4P concept, but rather the project allowed exploration of a measurement tool and investigation of the feasibility of the use of the tool in the application of a P4P method. Summary. A risk-adjusted pay-for-performance simulation was implemented using retrospectively collected data. Additionally, the feasibility of implementing a pay-for-performance process prospectively in outpatient physical and occupational therapy was tested. The study demonstrated a pay-for-performance (or value-based purchasing) method that aligns financial incentives with achievement of better patient outcomes in an efficient manner can be designed and implemented. Further simulation demonstrated that implementation of a pay-for-performance process may be beneficial in modifying provider behavior where the provider would strive to produce better outcomes in a more efficient manner. The results supported that, by implementing a risk-adjusted pay-for-performance method in outpatient physical and occupational therapy, the process of covering outpatient physical and occupational therapy services under Medicare Part B could be moved closer to the Institute of Medicine’s vision of the future health care delivery system that is effective, patient-centered, timely, efficient and equitable. Given that the pay-for-performance process is not provider or treatment specific, the method should encourage clinicians to practice evidence-based therapy and develop best practices designed to achieve better patient functional status outcomes efficiently. When an outcomes measure of change in function is matched with the number of treatment visits, the data can be used to develop guidelines for payers designed to improve the objective management of providers, and providers can use the data to assist in the management of their patients. The pay-for-performance process described represents an alternative payment method worthy of consideration, possibly as a replacement of the therapy caps or adapted to the therapy cap exceptions process. The findings do not imply CMS has decided to develop a new payment system based on P4P, but rather there are a number of potential applications of the outcomes instrument and the measures of functional status that the instrument produces. Selected findings. • Predictive validity of the risk-adjusted pay-for-performance model was supported. • Effectiveness (i.e., clinical outcomes) and number of treatment visits were used in nine
risk-adjusted payment “scenarios”, which were used to refine a payment algorithm based on a fee-for-service method.
6/1/06 Pay-for-Performance Grant #18-P-93066/9-01 4 Focus On Therapeutic Outcomes, Inc.
• Although most patients had orthopedic impairments, over three thousand patients with neurological impairments were also tested: the effectiveness measure and number of treatment visits worked well for classifying both types of patients.
• Simulating the FOTO Value Purchasing Payment Algorithm© (VPPA) on retrospectively
collected data produced up to 12 percent reduction in reimbursement. • Simulating the VPPA on prospectively collected data produced up to 7 percent reduction in
reimbursement and supported the feasibility of applying the pay-for-performance process. • Although the sample size of the prospectively collected data was small, functional status
(FS) change for patients receiving benefits through the Medicare Advantage plan was better than the FS change reported by patients covered by the traditional fee-for-service Medicare Part B plan.
• Simulating the FOTO Value Purchasing Payment Algorithm© (VPPA) on retrospectively
collected data supported the potential for reduced reimbursement using a pay-for-performance process with clinics that attain good outcomes and suggested realignment of care based on need and payment based on results.
• The value-based purchasing model presented is an alternative payment method worthy of
consideration, possibly as a replacement for the therapy caps or to the caps exceptions process.
• The value-based purchasing model added minimal additional burden to patient and
provider. • Functional status measures and number of treatment visits data, if merged with billing data,
are expected to improve the accuracy of the analyses of payment based on effectiveness and visits.
• Patient self-report of measures of functional status change were used successfully in the
pay-for-performance process. • The clinicians’ assessment of patient improvement correlated with the patients’ assessment
of improvement and was successfully used as an external benchmark for functional change. • Results supported use of Item Response Theory (IRT) methods and Computer Adaptive
testing (CAT) processes for pay-for-performance models. • Guidelines were proposed to facilitate management of providers of outpatient physical and
occupational therapy by payers. Possible applications of the outcomes instruments and the functional status measures they produce include:

6/1/06 Pay-for-Performance Grant #18-P-93066/9-01 5 Focus On Therapeutic Outcomes, Inc.
• Implementing the therapy caps exceptions process. • Managing patient treatment by clinicians. • Managing claims review by contractors. • Applying a pay-for-performance model of reimbursement. • Adaptability to various payment methods, including the current Medicare Physician Fee
Schedule The study revealed several practical issues that would need to be addressed and tested before a pay-for-performance model could be used for Medicare payment. For example: • A method of matching patient claims to patient outcomes measures would have to be
developed. • Ways of providing incentives for rehabilitation therapy providers and suppliers to collect
and report functional outcomes data should be explored. • The risk-adjustment model studied, although powerful, would benefit from refinement by:
o Investigating ways to account for more exacting groups of patients by age. o Investigating other risk-adjustment variables that show promise for improved
model power, like self-efficacy (fear-avoidance), depression, comorbid conditions, cognitive abilities, language spoken, use of a proxy, caregiver assistance, and patient residence.
• Necessary adjustments to Medicare systems would need to be determined, programmed,
installed and tested. • Changes in the Medicare manual and education of contractors, providers and patients
would be necessary. • Other cut-points used to apply the payment algorithm should be studied to illustrate their
impact of the model and effect on Medicare expenditures for rehabilitation claims. • Reimbursement savings results in this study should be considered illustrative. An estimate
of the financial impact of a P4P payment program would require more extensive research.

6/1/06 Pay-for-Performance Grant #18-P-93066/9-01 6 Focus On Therapeutic Outcomes, Inc.
I. Scope The original scope of work (March 11, 2005) stated the contractor, Focus On Therapeutic Outcomes, Inc. (FOTO), would study the feasibility and impact of implementing a pay-for-performance process for patients receiving physical or occupational therapy services under Medicare Part B. The contractor expected to use a method similar to their previously developed pay-for-performance model for outpatient physical and occupational therapy that employed the FOTO Value Purchasing Payment Algorithm.© (VPPA) The contractor was to implement the VPPA refined following retrospective analysis of FOTO data based on risk-adjusted functional outcomes and treatment visits. The project was designed to demonstrate the feasibility of implementing a value-based purchasing model in outpatient physical and occupational therapy as well as demonstrating a possible replacement for the therapy caps. For the purpose of this project, the terms pay-for-performance and value-based purchasing will be used interchangeably. II. Background Recent History Section 4541 of the Balanced Budget Act of 1997 (BBA) (Pub.L. 105-33) imposed financial limitations on outpatient therapy services and requested development of payment alternatives. Since that time, the Centers for Medicare and Medicaid Services (CMS) has been studying the way these services are utilized and how they are reimbursed. The first utilization report, provided by AdvanceMed in 2002, 58 indicated, among other findings, that the diagnosis on the therapy claim was frequently missing or unrelated to the therapy service provided. The recent Government Accountability Office (GAO) report confirmed these findings. 18 Therefore, use of diagnosis as an indicator of the medical condition that could be used as a factor for predicting cost is troublesome. Consequently, it became evident that diagnosis when coded by ICD-9-CM codes 24 was a poor predictor of therapy utilization, and therefore diagnosis was not appropriate for use alone in the development of alternative payment policy. As was suggested by AdvanceMed, a general impairment classification may be a more valid indicator of condition, and therefore potentially a predictor of cost. 58 In a another report prepared for CMS by AdvanceMed, 9 2002 Medicare Part B claims data containing more than 3.7 million patients who received outpatient rehabilitation (physical or occupational therapy, or speech, language pathology) were used to classify patients into groups by the principal claim diagnosis code (i.e., ICD-9-CM code) used during their first outpatient therapy encounter. The diagnostic groups, which were subsequently operationally defined as clinical classification groups, represented patients treated for impairments in similar anatomical parts or patients with similar medical conditions. The value of classification groups was to mitigate the problems encountered in using a single principal diagnosis on the claim to predict appropriate utilization levels. The researchers suggested that with further refinement, these classifications could serve as the basis of an alternative payment system that might identify, for example, the allowable number of visits, length of episode, or number of services. Also, classifications would be necessary for performance-based payments, if such a method were to be implemented at some future date.

6/1/06 Pay-for-Performance Grant #18-P-93066/9-01 7 Focus On Therapeutic Outcomes, Inc.
However, to design a practical, clinically relevant and scientifically defensible performance-based payment alternative, researchers need to progress beyond clinical classification groups and address several important concerns. First, functional outcomes or measures of clinical improvement of patients needed to be matched with treatment visits, as recommended by AdvanceMed 9 allowing the payer to understand the extent to which the patient improved as a result of the treatments received. Change in functional status would provide an important, relevant measure of clinical quality or effectiveness. Second, the amount of functional improvement and the number of treatment visits per treatment episode must be risk-adjusted by pertinent patient characteristics, such as classification groups, severity of functional status at intake, patient age, and symptom acuity, so improvement of function over the treatment visits can be reasonably compared among similar patients for a better case-mix comparison. Third, once risk-adjusted functional improvement and number of treatment visits were estimated from actual therapy data collected from patients receiving outpatient therapy, a value-based purchasing payment algorithm (such as the VPPA) could be developed from which one can estimate future payments. The hypothesis of the current project is that nine (9) risk-adjusted payment scenarios based on the VPPA can be described by identifying patients who received above predicted, predicted, or below predicted functional improvement and where the patients are further subgrouped by the number of treatment visits used to obtain the functional improvement. In other words, patients could be grouped by fewer than predicted, predicted, or more than predicted treatment visits as well as simultaneously grouped by above predicted, predicted, or below predicted functional improvement. These nine (3 levels by visits X 3 levels by functional improvement) payment scenarios could be applied to risk-adjusted cells of homogeneous patients who received physical or occupational therapy in outpatient rehabilitation centers. The algorithm applied to the risk adjusted groups of homogeneous patients could be used by the payer to reimburse the provider. The provider could be paid a bonus for attaining better than predicted functional improvement in fewer than predicted treatment visits. Providers of patients who experienced less than predicted functional improvement in more than predicted treatment visits would be reimbursed less. It can be argued that encouraging, through payment incentives, better gains in functional improvement over fewer treatment visits facilitates a needs-based treatment process. For example, patients who continue to improve their functional status over outpatient rehabilitation continue to have a need for treatment. However, patients who no longer are improving their functional status may not need further treatment. This value-based purchasing model, if successful, could be used to design needs-based payment policy, which is of interest to the GAO and CMS, 18 which is currently studying methods of identifying patients who need treatment beyond limits imposed by the therapy caps. Such a value-based purchasing model complies with all four criteria suggested by the Medicare Payment Advisory Commission (MedPAC) to evaluate a pay-for-performance 51 process: measures are based on clinical evidence, data collection is not unduly burdensome, outcomes measures are risk-adjusted, and providers are able to improve their measures. 54 One recommended measure of effectiveness in outpatient rehabilitation is change in functional status (FS), and the measure of FS that we studied in this project relies on patient self-report. 26,40,42-
45,62 Functional status was selected because the majority of patients receiving outpatient physical or occupational therapy receive therapy to improve a deficit in functional status. Whereas regulatory requirements mandate the collection of clinical outcomes data (all of which have a functional status component) in skilled nursing facilities through the minimum data set (MDS), 79 home
6/1/06 Pay-for-Performance Grant #18-P-93066/9-01 8 Focus On Therapeutic Outcomes, Inc.
care agencies through the use of the Outcome and Assessment Information Set (OASIS), 33 and inpatient rehabilitation through the use of the Inpatient Rehabilitation Facility Patient Assessment Instrument (IRF-PAI), 70 there are presently no similar requirements for outpatient rehabilitation settings. Many of the FS measures used in the current study have been recognized by the National Quality Measures ClearinghouseTM (NQMCTM), which is sponsored by the Agency for Healthcare Research and Quality (AHRQ), U.S. Department of Health and Human Services. 57 Patient self-report measures of functional status are common and recommended in outpatient physical therapy 39,46 because they allow patient-centered measures of an important construct in outpatient rehabilitation. We operationally define a construct as a nonobservable behavior, in this case the patient’s functional status. Constructs are abstract variables that cannot be seen directly, but are inferred by measuring relevant behaviors that are observable. 61 Functional status is defined below. In a recent report on quality outcomes measurements in post-acute rehabilitation facilities, 46 researchers acknowledged that the current federally mandated outcomes tools for post-acute rehabilitation facilities (i.e., MDS, OASIS, IRF-PAI) do not measure whether the patient’s perception of their functional status was maximized, among other constructs. The researchers further acknowledged that measuring such important information requires input directly from patients or their proxies as an important aspect of clinical outcomes. Johnson et. al. 46 identified that many researchers focused on patient-centered outcomes believe that functional outcomes should come from patients because their perception of their function is more important than “so-called objective measures of function”. 46, p 13 Patient self-report of their functional ability represents the patient’s perception of their ability and integrates the relevance of the functional ability to the patient. If a patient has difficulty performing a functional task, but the task is not relevant to the patient, the task is likely of little importance or relevance to his or her life and needs. If a clinician had measured the patient’s functional ability to perform a task that was not relevant to the patient, the clinician may attach more importance to the task or measure of functional ability than is appropriate according to the patient. The contractor proposed to use the data from Focus On Therapeutic Outcomes, Inc. (FOTO) database to simulate a pay-for-performance process and to use the FOTO data collection method to collect the prospective data because, in addition to the outcomes measures used, FOTO had a 13-year business experience collecting and amassing a database of over 1.6 million outpatient therapy patients treated by more than 13,000 clinicians employed in more than 1500 outpatient departments and clinics across the United States. Approximately 15 percent of the patients in the recent FOTO database were Medicare Part B beneficiaries. FOTO has collected data describing functional status over the course of physical and occupational therapy. Patient outcomes or improvement in functional status, as described by patients, have been tied to condition and severity in the database. FOTO also had already developed a Value Purchasing Payment Algorithm © (VPPA). Therefore, FOTO had the business infrastructure, experience and methods that were successful collecting previous data that could be used to collect future outcomes data and had a data set large enough to risk-adjust functional improvement and number of treatment visits. This experience would be helpful testing a risk-adjusted pay-for-performance process. A large functional status data set was considered essential for the project because the data contained the necessary information to produce data that are not available from Medicare claims; specifically
6/1/06 Pay-for-Performance Grant #18-P-93066/9-01 9 Focus On Therapeutic Outcomes, Inc.
risk-adjusted, clinically appropriate functional improvement and number of treatment visits by impairment group. The current FOTO database is large, contains data from over 550 clinics in over 40 states, has been statistically stable over many years, been collected using techniques designed to reduce respondent and provider burden, and contains measures of both functional change (effectiveness) and number of visits that are available for risk adjustment. Moreover, the mathematical methods used by FOTO to collect and analyze outcomes data, i.e., Item Response Theory (IRT) 71 and Computerized Adaptive Testing (CAT), 73 could allow seamless refinements in the risk-adjusted outcomes process going forward for post-acute patient assessment instruments in outpatient rehabilitation for physical and occupational therapy, if such a process were desired. The current project was designed to contribute to the refinement of patient classifications 9 by demonstrating the need for risk-adjustment and providing a demonstration of the value of a pay-for-performance method in outpatient physical and occupational therapy, and to provide analyses that could position CMS to recommend modifications of, or implement waivers for, the current therapy caps. Aligning Incentives In its prescient publication Crossing the Quality Chasm, the Institute of Medicine (IOM) recommended aligning financial incentives with the implementation of care processes based on best practices and the achievement of better patient outcomes. 36 If a pay-for-performance process for rehabilitation were based on risk-adjusted functional outcomes and treatment visits, the method could incentivize clinicians to obtain the best functional improvement for their patients over the shortest treatment episode. If successful, the pay-for-performance method would be the catalyst to encourage clinicians to use evidence-based, patient-centered, and effective clinical services, to obtain the best outcomes in the most efficient manner, which supports the Institute of Medicine’s vision of the future health care system. Early experience with pay-for-performance models based on process measures for physicians supports clinician behavior modification when financial incentives are available. 63 The IOM’s vision has not gone unnoticed. The Medicare Payment Advisory Commission (MedPAC) that advises Congress on the Medicare program has advocated an increased role for CMS in encouraging improved quality outcomes. In its June 2003 Report to Congress, 53 MedPAC recommended that, "the Secretary (should) conduct demonstrations to evaluate provider payment differentials and structures that reward and improve quality." More recently, the MedPAC recommended that Medicare adopt pay-for-performance standards for hospitals, home health agencies, physicians, dialysis facilities and managed care plans, 52 a sentiment that has been voiced elsewhere. 60
In congressional testimony, MedPAC chairman, Glenn Hackbarth, described a good pay-for-performance program as one that would reward absolute high levels of quality and those showing significant improvement. In addition, risk-adjustment is needed because providers treating the sickest patients should not be penalized for failing to show enough improvement on quality measures. Hackbarth stated providers should be held accountable on measures that are within their control and that patient experience should be introduced as soon as means are available to collect such data. For example, physical and occupational therapy providers should be judged on patient functional improvement and if the IOM philosophy of aligning incentives is
6/1/06 Pay-for-Performance Grant #18-P-93066/9-01 10 Focus On Therapeutic Outcomes, Inc.
incorporated, providers will be paid on that basis as well. At least one rehabilitation therapy association, the American Physical Therapy Association (APTA), has adopted policy consistent with the foregoing. Embracing the concept of value-based purchasing APTA adopted policy in 2006 that physical therapists should have their compensation based on the value of their services and production (incentive).
CMS has already initiated several projects to encourage improved quality of care for Medicare beneficiaries. As examples, an open door forum was held in the fall of 2005 on the Nursing Home Pay for Performance Demonstration project where financial incentives would be provided to nursing homes that meet certain standards for providing high quality care. 6 The Hospital Quality Initiative is part of Health and Human Services broader National Quality Initiative that focuses on an initial set of 10 quality measures by linking reporting of those measures to the payments the hospitals receive for each patient discharge. 7 The Premier Hospital Quality Incentive Demonstration project was designed as a demonstration to improve the quality of inpatient care for Medicare beneficiaries by giving financial incentive to almost 300 hospitals for high quality. The Physician Group Practice Demonstration project is a pay-for-performance initiative for large group medical practices where physicians would be rewarded for improving the quality and efficiency of health care services delivered for Medicare beneficiaries. 7 Finally, in October 2005 CMS announced a voluntary quality reporting initiative for physicians, which may be the first step to a Medicare pay-for-performance program where doctors would be encouraged to report evidence-based, consensus quality measures on their patients. 5 All these initiatives represent a movement towards providing financial rewards to providers who achieve greater clinical effectiveness and efficiency. The National Quality Forum (NQF) has listed various components that will make introduction of pay-for-performance acceptable and even appealing to all health system stakeholders: 56
1. Choosing and using quality measures that: (a) have a clear and compelling application, (b) do not impose an undue burden on those who provide data, (c) help providers improve quality of care, and (d) help consumers select plans, providers and/or treatments. These quality measures should be held constant over time to permit benchmarking and measurement improvement and be open to improvement based on the scientific approach to care. The process should use risk adjusting for more accurate benchmarking and have audit standards for assessing implementation.
2. Voluntary approaches to quality measurement and reporting have failed to engage the
entire health system. On the contrary, mandating participation and reporting increases compliance, bolsters data accuracy and value, and has potential to create a system that is more equitable for all stakeholders. Once captured, data must be routinely and publicly reported in a common set of measures.
3. Quality measures should possess the integrity that allows benchmarking individual
patients to a national standard as well as measuring results of care on a patient-by-patient basis. Thus, information can be used to guide and accurately assess benefits of treatment. Data can be used as the basis for determining payment predicated on a comparison of results of intervention to the time, cost and quality parameters revealed by the database.

6/1/06 Pay-for-Performance Grant #18-P-93066/9-01 11 Focus On Therapeutic Outcomes, Inc.
MedPAC presented similar views before the Senate Committee on Finance, 54 emphasizing four criteria to evaluate whether to move forward on a pay-for-performance process: 1) measures must be based on clinical evidence, accepted by independent experts, and familiar to providers; 2) collecting and analyzing data should not be unduly burdensome for either the provider or the payer; 3) when outcome measures are used, they should be risk adjusted; and 4) most providers should be able to improve on the available measures. In their March 2006 report to Congress, MedPAC recommended CMS place a high priority on development of quality measures for pay-for-performance processes and work with other payers to encourage development of pay-for-performance payment methods. 51 To some, pay-for-performance seems inconceivable given the chaotic trends over the past decades including the current methods of payment for clinical services, but PricewaterhouseCoopers has identified pay-for-performance as the key, yet radical, trend that would affect payers in this decade. 12 They compared the current movement to pay-for-performance to the movement in the 1980s where Medicare changed from fee-for-service payment for hospitals to Diagnosis Related Groups (DRGs), which assisted in ushering in capitation that transformed payment systems of the 1990s. Pay-for-performance, according to PricewaterhouseCoopers, will characterize this decade for healthcare providers and payers. Interestingly, the pay-for-performance movement is developing from the bottom up, relying on a grassroots movement in which payers, CMS and commercial payers, are developing proprietary methodologies that use incentives to modify provider behavior. It is estimated that as many as one-third of private health plans have a pay-for-performance program in place, but most are in the early stages of development or implementation. 12 Finally, although the American Medical Association has developed guidelines for pay-for-performance programs for physicians, 1 and others 3,4,15 are watching the P4P efforts closely, no such guidelines are available for physical or occupational therapists or speech-language pathologists. Purpose The purpose of this project was to implement a pay-for-performance simulation, which will align the incentives as advocated by the IOM, NQF, MedPAC and PricewaterhouseCoopers. The project was designed to demonstrate the feasibility of implementing a pay-for-performance process in outpatient physical and occupational therapy, provide information to Medicare concerning payment policy for outpatient physical and occupational therapy, and discuss implications for the development of an alternative payment method as required by Balanced Budget Act of 1997. For patients in the FOTO database who received outpatient physical or occupational therapy covered by Medicare Part B benefits, the specific purposes were:
1. To develop the risk-adjusted cut points for effectiveness and number of treatment visits for the nine (9) payment scenarios of the VPPA pay-for-performance process for patients receiving outpatient physical or occupational therapy covered by Medicare Part B.
6/1/06 Pay-for-Performance Grant #18-P-93066/9-01 12 Focus On Therapeutic Outcomes, Inc.
2. To compare percent differences in costs to provide therapy using and not using the FOTO Value Purchasing Payment Algorithm© in a real data simulation of the retrospective data (first simulation).
3. To implement a prospective pay-for-performance process in three outpatient departments for patients receiving outpatient physical or occupational therapy.
4. To retrospectively apply the pay-for-performance process based on the VPPA to the data collected prospectively to determine the impact of implementing a pay-for-performance process (second simulation).
5. To develop clinically and statistically logical interpretations of the results that could justify changes to payment policy.
6. To determine if other data should be collected to facilitate the risk-adjusted value-based purchasing method, particularly for identifying patients who do not appear to fit well within the current risk-adjusted process.
7. To develop guidelines for intermediaries and carriers and Medicare Advantage plans for the purpose of managing providers who participate in the pay-for-performance process.

6/1/06 Pay-for-Performance Grant #18-P-93066/9-01 13 Focus On Therapeutic Outcomes, Inc.
III. Methods and Results for each purpose Purpose 1: To develop the risk-adjusted cut points for effectiveness and number of treatment visits for the nine (9) payment scenarios of the VPPA pay-for-performance process for patients receiving outpatient physical or occupational therapy on covered by Medicare Part B. Methods. Design. We conducted a secondary analysis of an existing commercial database to determine if the VPPA needed to be refined and if not, we would conduct a real data simulation using the VPPA. If the VPPA needed to be refined, we would use the new algorithm in the pay-for-performance simulation. Patients. Between January 2000 and August 2003, data from 306,556 patients were entered in the FOTO data set from 552 participating outpatient physical and occupational therapy clinics in 40 states. These patients were treated by 3,447 therapists (74% physical therapists, 12% occupational therapists, and 14% other types of healthcare workers). Patient self-reported intake and therapist-reported discharge data were entered for each of the patients. Of these patients, 196,336 (64%) had complete episodes, i.e., patient self-reported intake and discharge data plus therapist-reported discharge data were entered into the database for each patient. The fundamental difference between the larger data set and the smaller data set is that patient self-reported discharge data were entered into the smaller data set from which a change in functional status, i.e., intake to discharge, could be calculated. The sample was cleaned by deleting patients who had staff entered data on number of visits and duration of treatment episode that appeared illogical, for example, duration >400 days, and probably represent data entry errors. This left a sample of 189,088 (62%) with clean data for analyses (Table 1). The 75 most common diagnostic ICD-9-CM codes, 24 which represent 64% of the patients, are primarily common orthopedic conditions (Table 2). Although only 1.6% of the sample had selected neurological impairments (e.g., cerebrovascular accidents and traumatic brain injuries), these patients represent a subsample of 3,025 patients. To assess potential bias introduced by analyzing incomplete data, we assessed differences between patients completing only intake surveys (i.e., the larger sample) and the sample of patients who completed both intake and discharge surveys via chi square tests for independence and Student’s t-tests (Table 3). Patients who completed intake and discharge surveys were older, and received more visits over a longer treatment episode duration than patients who completed intake forms only (P<.001). Although all other comparisons were statistically significant, except for sex (P=.736), the differences appear more related to sample size than important demographic differences, with the possible exceptions of age group and region of the country where patients were treated. Patients with completed intake and discharge forms were more likely to be older and come from the north central region of the country, and patients with completed intake forms

6/1/06 Pay-for-Performance Grant #18-P-93066/9-01 14 Focus On Therapeutic Outcomes, Inc.
only were more likely to come from the mountain and south Atlantic regions of the country (P<.001). Dependent Variables. There were two dependent variables: change in functional status and number of treatment visits. Functional status (FS) data were collected using patient self-report, condition-specific surveys employing paper and pencil surveys or computerized adaptive testing (CAT) methods. Functional status, as described in detail below, was operationally defined as the patient’s perception of their ability to perform functional tasks described in the FS items. 28,30,31 FS was collected at intake and discharge, and FS change was calculated as discharge FS minus intake FS. Treatment visits were summed for a total number of visits. A treatment visit was defined as an encounter between the clinician and patient. The form of administration of the FS surveys changed over the data collection period, so two methods of collecting the data are described. First, the survey used during 2000 and 2001 was a 24-item FS survey that was administered either by using paper and pencil or a computer. This survey has been described. 26,27 The 24 items were used to calculate an overall FS measure. Items included a subset of items from the SF-36 75 and physical functioning items pertinent to patients with upper extremity impairments. 25 Results of previous studies supported test-retest reliability (ICC(2,1)=0.92), 26 responsiveness (effect size=0.83) 62 and the validity of the FS measure to discriminate expert from average therapists. 62 The second method of data collection, which we used for data collected in 2002 and 2003, was a computerized adaptive testing (CAT) process. 73 Detailed descriptions of the item response theory methods (IRT) 71 and CAT procedures 73 are beyond the scope of this report but have been described. 28,30,31 CATs were used to estimate abilities, or, as defined in the Hart et. al. studies, 28,30,31 functional status, which cannot be directly observed but can be estimated by analyzing patient’s responses to a set of self-report items. 22 For the purpose of this study, the latent trait of interest is functional status (FS), which we operationally define as the patient’s perception of their ability to perform functional tasks described in the FS items. FS is of interest because many people seek physical and occupational therapy to improve functional deficits caused by a variety of impairments, and patient self-report of FS has become well accepted in research and clinical practice, particularly in outpatient physical therapy. 20,21,28,30,31,46,62 CAT has its origins in mental, educational and military testing, 73 but CATs have recently emerged in the medical 74 and physical therapy fields. 21,28,30,31 CATs offer advantages compared to a computer administered or paper and pencil outcomes instruments, but the primary advantage is that CATs administer fewer items reducing respondent burden with little reduction in precision of patient FS estimates. 64 CATs facilitate management of a central conflict in scale development: good measurement precision with low response burden and are applicable to assessment of outcomes, i.e., change in FS in patients receiving therapy 21,28,30,31 and is of particular importance to older patients where comorbidities and fatigue may affect the data collection method.

6/1/06 Pay-for-Performance Grant #18-P-93066/9-01 15 Focus On Therapeutic Outcomes, Inc.
The foundation of CAT lies in Item Response Theory (IRT) methods. 71 Briefly, IRT comprises a set of mathematical models and associated statistical procedures that are used to estimate a person’s level of ability, like FS. IRT models produce item difficulty and patient ability estimates that do not vary with population characteristics with respect to the underlying trait (i.e., FS), standard errors conditional on trait level, and trait estimates linked to item content. 28,30,31 IRT methods allow linking of items and measures of ability from different data collection procedures and outcomes instruments. 41 The CAT used for the second method of data collection in 2002 and 2003 for this study has not been described in the literature, but evolved from the 24-item paper and pencil survey 26 by adding items representing lower functional abilities and items pertinent to specific impairments treated in outpatient rehabilitation facilities 32 to the 24-item pool. This resulted in a larger pool of items, some of which came from other outcomes instruments or were developed from clinician input. The resultant 50 items were calibrated into the FS scale using a rating scale IRT model. 2 Then, clinicians placed the items into groups related to the patient’s impairment. For example, items thought to be clinically pertinent to patients with lumbar spine impairments were grouped together. Likewise, items thought to be clinically pertinent to patients with upper extremity impairments were grouped, etc. Only items pertinent to a specific impairment group were used to assess the FS of patients with a specific impairment. For example, the items grouped for patients with lumbar impairments were used to assess the FS of patients with lumbar impairments. This created one scale of FS from which patients of different impairments could be assessed for their FS abilities using subsets of items pertinent to their impairment, which produced measures of FS that could be compared directly across impairments. 41 Necessary steps in developing a CAT have been described. 21,28,30,31,64,73 Briefly, the steps included: selecting the starting item; identifying a method for estimating FS ability and its associated standard error (SE); specifying stopping rules; and constructing an algorithm for selecting items subsequent to the starting item. The CAT was programmed to administer a limited number of impairment specific items before a precise estimate of the patient’s FS was generated. The process was designed to reduce respondent burden of data collection and to produce precise estimates of FS by using items that were clinically appropriate in content given the patient’s impairment and were matched to the patient’s level of FS ability. Patients who entered data via the impairment specific CATs received measures of FS that were scaled to a sample independent range of 0 (low functioning) to 100 (high functioning). 28,30,31 The data collected using a paper and pencil survey in 2000 and 2001 were linked to the data collected in 2002 and 2003 using the impairment specific CATs using the same software utilized to collect and analyze the 2002 and 2003 data. 29 In this way, all patients, regardless of time or mode of data collection, were placed on the same linear sample independent 0 to 100 FS scale facilitating data analyses. In the simulated CAT, the actual patient responses were taken as substitutes for the responses the patient would have given had the items been administered in the context of a CAT. We assumed that the mode of administration did not substantially affect item responses when the CAT estimated FS ability for the patients treated in 2000 and 2001. The percent of data by collection method was 77.7% by paper and pencil surveys, 12.3% by computer administered surveys, and 10.0% by computerized adaptive testing methods (Table 1). To our knowledge, this represents the first large scale functional status data collection in

6/1/06 Pay-for-Performance Grant #18-P-93066/9-01 16 Focus On Therapeutic Outcomes, Inc.
outpatient rehabilitation using CAT methods. The resultant measure of FS represents the “activity” dimension of the World Health Organization’s International Classification of Functioning, Disability and Health. 78 Independent Variables. Twelve independent variables were analyzed in the univariate analyses: gender, severity, age, symptom acuity, impairment category, type of referring physician, payer source, type of clinic ownership, region of the country, medication usage at intake, exercise history, and surgical history (Table 1). Gender was coded as male or female. Severity of the patient’s initial FS was assessed using the intake FS measures coded as quartiles of the intake measures. Because the effects of the patient’s comorbidities are embedded in their perception of their ability to perform the FS items, we considered the use of FS intake measure, which we operationally defined as a measure of condition severity, an adequate measure of severity of the patient’s FS. Severity of disability (disability has been defined as the converse of FS) has been used successfully to risk adjust change in disability following inpatient physical and occupational therapy. 66-68 Symptom acuity, which represents the number of days from onset of symptoms until beginning of intervention, was coded as <21 days, 22 to 90 days, and >90 days. Payer source was the primary source of payment for the patient’s therapy. Age was categorically coded as younger (18 to <45 years), middle age (45 to <65 years) and older (65 years or older). If the patient had an orthopedic condition impairment was coded as the anatomical body part treated by the therapist. There were two neurologic conditions with sufficient numbers of patients to be included in the study, cerebral vascular accident and traumatic brain injury, which were coded by their diagnosis. All other patients were considered “not otherwise classified,” which provided eleven categories of impairment. The type of referring physician was coded as primary care physician, orthopedic surgeon, neurologist, occupational health physician, rheumatologist, plastic surgeon, physiatrist, podiatrist, neurosurgeons, or other. The primary source of payment was coded as indemnity (fee-for-service), litigation, Medicaid, Medicare Part B, health maintenance organization (HMO), preferred provider organization (PPO), workers’ compensation, patient private pay, or other. The type of clinic ownership was coded as payer, hospital, physician, physical therapist, corporate, or other. The region of the country was grouped as New England, middle Atlantic, south Atlantic, north central, south central, mountain or pacific. The states in each region are listed in Table 4. Prescription medication usage at intake was coded yes or no. The level of exercise the patient was performing before their current episode of outpatient physical and occupational therapy was coded as at least three times a week, one to two times a week, or seldom or never. Surgical history was coded as either none or one or more. Data Analyses. Responsiveness. The purpose of the pay-for-performance process was to assess FS change. Therefore, measures used for assessing FS change must be responsive, 47 The responsiveness of the FS measures was assessed by using effect sizes calculated by subtracting the mean intake from the mean discharge measures divided by the standard deviation of the intake measures. Effect size interpretation commonly follows Cohen’s definitions, 10 but because of the arbitrary nature of the qualitative
6/1/06 Pay-for-Performance Grant #18-P-93066/9-01 17 Focus On Therapeutic Outcomes, Inc.
adjectives of effect size values and the need to match the qualitative adjectives to the statistical models used, the use of qualitative interpretations of effect size statistics should be approached with caution. 69 The best rule of thumb for interpreting effect sizes is: the larger the better, because a large effect size means the measure is good at quantifying the attribute of interest, i.e., FS change. 10 The goal of the current project was to use FS measures with high responsiveness, which means that when a clinical improvement occurs, the measure detected the improvement. The arbitrary nature of effect size interpretations is represented in two studies that provided different interpretations of effect sizes while both citing Cohen. 10 Jette and Jette 42,43 suggested effect sizes of 0.2 to 0.4 be considered “small”, 0.5 to 0.7 as “moderate”, and 0.8 or greater as “large”. Guccione et. al. 20 suggested effect sizes of <0.2 as “small”, >0.2 to <0.5 as “medium”, and >0.5 as “large”.a Univariate and multivariate analyses. The FOTO VPPA, which had been previously developed was further refined. Refinement of the risk-adjusted P4P model required several steps. The model needed to be risk-adjusted because variables not associated with treatment provided affect FS change. We defined “risk” related to our model as the potential for independent variables to alter measures of discharge FS or FS change that could affect the meaningfulness of the interpretation of discharge FS or FS change. 35 The purpose of the regression analyses was to identify the most important independent variables that should be used as the risk-adjustment variables for the P4P algorithm. We tested the predictive validity of the model using two methods. First, we cross-validated the model building procedure by randomly separating patients into two equal samples (i.e., split-half validation): one to develop the model, and one to test the stability of the independent variable coefficients of the model. We compared the independent variables (Table 1) between the two randomly selected samples and confirmed the two samples were similar (P values all >.05). Then using the developmental sample, univariate analyses (i.e., one-way ANCOVAs on discharge FS or Pearson Product Moment Correlations) were used to identify possible confounding variables or risk-adjustment variables thought to be important for the assessment of discharge FS. Then, using first the developmental and then the validation samples, data were fit to multivariate regression models using an ordinary lest squares (OLS) estimation procedure, and beta coefficients were compared across samples using 95% confidence intervals (CI). 65 We estimated the power of the model (i.e., R2 value of the model) using twelve independent variables (Table 1). Intake functional status and age were entered as continuous variables; all other independent variables were entered as categorical variables. The dependent variable was functional status at discharge. Categorical variables were reduced to dummy variables for each variable level, and 95% CIs were estimated for each beta coefficient. The 95% CIs of the beta coefficients of the risk-adjustment variables were compared between the developmental and testing samples to determine whether the beta coefficients were stable between the samples (P>.05) to examine the predictive validity (i.e., cross-validation) of the model.
a We believe the published “>5.0” on page 525 was a typographical error.

6/1/06 Pay-for-Performance Grant #18-P-93066/9-01 18 Focus On Therapeutic Outcomes, Inc.
Next, we estimated the predictive ratio as a second approach to the assessment of the predictive validity of the model. To generate the predictive ratio, the first randomly selected sample was used to estimate the beta coefficients for the independent variables, and then the beta coefficients were used to predict the discharge FS in the second randomly selected sample. The predictive ratio was estimated using the second sample by dividing the predicted discharge FS by the actual discharge FS. If the predicted discharge FS is close to the actual discharge FS, the predictive validity of the regression model would be supported. 34 We estimated predictive ratios and used descriptive statistics to characterize how well the model predicted discharge FS for patients with different impairments. Our goal was to use the largest sample available to test the payment algorithm, so if the results of the univariate and multivariate analyses supported the data sets could be combined to refine the final P4P algorithm, the samples would be combined. Once combined, the multivariate models would be rerun to determine if beta coefficient stability compared to the developmental and testing samples. Then, if the model remained stable, we would develop a new more parsimonious model that uses only the risk-adjustment variables that control the most variance of the data (i.e., variables with the strongest partial R2 values). This smaller model would offer a more easily implemented model that would be practical compared to using the complete model. To be more clinically applicable, the new model would be developed using FS change as the dependent variable, and all independent variables would be entered as categorical variables. We decided to use FS change and categorical independent variables in the final model because the new model would offer superior practical application for the refinement of the payment algorithm compared to the more complex and powerful model, even though we expected a reduction in the power of the new model that used the change dependent variable and categorical independent variables instead of discharge FS and continuous variables. Statistical analyses were performed using Stata release 9 (College Station, TX) and SYSTAT version 11 (Richmond, CA). Refining the pay-for-performance algorithm. As previously (Hart 2001, unpublished data), it was decided a priori that regardless of the results of the regression models, it was clinically logical and appropriate for our impairment specific CATs to use impairment as one of the risk-adjustment variables, which parallels the work of Stineman et. al. in the development of the functionally related groups for inpatient rehabilitation. 66-68 This means the pay-for-performance model compared treatment results within groups of patients treated for the same impairment, e.g., lumbar spine, knee, hip, etc. During the developmental process, it was decided to err on the side of larger sample sizes of patients in the majority of risk-adjusted cells, which meant we selected a limited number of risk-adjustment variables for the P4P algorithm. The P4P algorithm was designed to classify homogeneous patients within each risk-adjusted cell according to patient characteristics, so treatment effectiveness and number of treatment visits could be assessed within each cell. Effectiveness was assessed using the patient self-report of change in FS over the treatment episode. More improvement, i.e., more FS change over the treatment episode, was characterized as more effective care. We operationally defined the

6/1/06 Pay-for-Performance Grant #18-P-93066/9-01 19 Focus On Therapeutic Outcomes, Inc.
number of treatment visits as a measure of efficiency, but for consistency, the term “number of treatment visits” will be used throughout the report. Greater efficiency was operationally defined as fewer visits per treatment episode. Effectiveness was defined as whether the patient reported the predicted, less than predicted, or more than predicted risk-adjusted FS change. The number of treatment visits was described as the predicted, less than predicted, or more than predicted number of treatment visits. The number of treatment visits was estimated within each risk-adjusted FS cell. In this way, (Hart 2001 unpublished data) nine payment “scenarios” were defined on patient self-report measures of clinical effectiveness and administrative number of treatment visits (Table 5). Value Purchasing Payment Algorithm Cut-Point Determination. We originally developed the payment algorithm using 90% confidence intervals (CI) about the mean of FS change and number of treatment visits to determine the cut-points for distinguishing patients with below predicted, predicted, or above predicted effectiveness or number of treatment visits in each risk-adjusted cell. (Hart 2001 unpublished data) Confidence intervals allow us to draw reasonable inferences about population characteristics from a sample of data but may not be the best way to develop the payment algorithm. We believed that the selection of the cut-point would affect the number of patients in each payment scenario and would influence how clinicians and policy makers receive the value-based purchasing method. Therefore, our goal for this project was to examine several ways of defining the cut-points to produce a value-based payment algorithm, so we would be able to debate the balance between designing a pay-for-performance model that would both encourage clinicians to strive for efficient and effective patient outcomes as well as produce a payment algorithm that would be considered policy friendly that could be efficiently implemented by CMS, if so desired. The current feasibility study was designed to extend previous analyses (Hart 2003 unpublished) by checking the previous value-based payment algorithm using all patients regardless of payer, develop a value-based payment algorithm using only patients receiving Medicare Part B benefits, and test the impact of using different cut-points to develop the value-based payment algorithm. Therefore, several sets of cut-points, which were selected arbitrarily, were developed for the purpose of investigating the potential impact of cut-point determination on Medicare expenditures. Five sets of cut-points were examined:
1. 68% CI 2. 90% CI 3. 95% CI 4. ±1 standard deviation (SD) 5. ±2 SDs
Results. Responsiveness. FS measures for the 189,088 patients with intake and discharge FS data were 49.5±12.6 and 61.7±15.4 (mean±standard deviation), respectively, which produced an effect size of 0.97,

6/1/06 Pay-for-Performance Grant #18-P-93066/9-01 20 Focus On Therapeutic Outcomes, Inc.
regardless of impairment. Average FS measures and effect sizes per impairment (Table 6) demonstrated that all but one (i.e., CVA impairment) effect size was >0.80. Effect sizes were stronger for patients with orthopedic impairments (0.96) compared to patients with neurological impairments (0.56). Both effect sizes would have been interpreted as medium or large using either previously reported interpretations. 20,42,43 Results support the responsiveness of the FS measures across all impairment classifications with responsiveness being stronger in impairments related to patients with orthopedic syndromes compared to patients with CVA or brain injuries. Stratford and Riddle 69 recommend specific change coefficients based on different assumptions concerning the sample composition. In our data set, patients were expected to improve in their FS measures by different amounts, but we did not have access to an external standard like global rating of change to correlate to the FS change of our patients, which Stratford and Riddle recommended. The effect size statistic is an appropriate second choice but might underestimate responsiveness of our FS measures. Even with this possibility, responsiveness of the FS measures were classified as medium or large, i.e., effect size >.5. 10 The effect size statistics for the FS measure compare favorably to effect sizes from other instruments. For example, effect sizes for a recently published outpatient rehabilitation patient self-report instrument of activity (i.e., OPTIMAL), 20which is similar to the FOTO FS activity measure, were .35 for patients with lower extremity impairments, .21 for patients with “trunk” impairments, and .09 for patients with upper extremity impairments. Only 162 patients were assessed, regardless of impairment, at four weeks following initial evaluation. The patients were not well described, so detailed comparisons could not be made between that previous study and this current study, except for the magnitude of the effect size statistics. The FS measures in the current study produced effect sizes 2.8, 4.6, and 11.1 times more responsive than the effect sizes reported for the OPTIMAL instrument measures for patients with lower extremity, trunk and upper extremity impairments, respectively. In the Resnik and Hart study 62 of 24,276 patients with lumbar impairments, which used the same 24-item outcomes instrument as the patients treated in 2000 and 2001 in this study, the effect size was .83 compared to the 1.05 effect size for the 49,005 patients with lumbar impairments in the current study. It is hypothesized that the approximately 25% increase in the effect size of the current study compared to the Resnik and Hart study may be related to the IRT transformation of the responses to the FS items in the current study, which has been shown to reduce measurement error. 48 Further studies concerning the effect of IRT mathematics on responsiveness improvement are encouraged. Univariate results. All twelve independent variables assessed (Table 7) affected discharge FS, and therefore were entered into the regression models. It should be noted that with a large data set such as this, many analytical results will be statistically significant yet be clinically unimportant. We decided to follow the statistical results at this juncture, so that we would not delete possible important variables in subsequent analyses. Regression results.

6/1/06 Pay-for-Performance Grant #18-P-93066/9-01 21 Focus On Therapeutic Outcomes, Inc.
Predictive Validity of the Model. The R2 values for the developmental and testing samples were .36 and .35, respectively, which supports the models adequately controlled the variance of the data in both samples. The 95% CIs of the beta coefficients of all risk-adjustment variables estimated using both the developmental and testing samples were similar (P>.05), which supported the predictive validity (i.e., cross-validation) of the model. In the testing sample, the predicted discharge FS (for which we used the beta coefficients developed using the developmental sample) was very close to the actual discharge FS (i.e., the average predictive ratio was 1.045; median predictive ratio 1.025), which supported the predictive validity of the regression model, although the model slightly over predicted the average discharge FS for the second sample (Table 8). Descriptive statistics for the predictive ratios across impairment categories and type of clinical facility ownership generally support that the model predicted discharge FS well for all impairments and all types of facilities. However, the model tended to over-estimate the predicted discharge FS for all impairments except patients with a CVA, for whom the model tended to under-estimate the discharge FS. However, limited numbers of patients with neurological impairments with complete data from which the predicted discharge FS could be estimated were available for analyses. The previous analyses supported that we could combine the developmental and testing data sample, which we did. Using the complete data, we analyzed all patients regardless of payer, and then we analyzed patients receiving Medicare Part B benefits. We first analyzed these samples using the complete regression model and reanalyzed the two samples using a parsimonious model. For brevity, only the partial R2 values are displayed (Table 9). Using the complete regression model for discharge FS, which included two continuous independent variables (age and intake FS) and ten categorical independent variables applied to all patients regardless of payer, had an R2 value of .354. The more parsimonious regression model for FS change, which used four categorical independent variables (quartile of FS intake or condition severity, age using three levels, symptom acuity using three levels, and impairment using 11 levels) applied to all patients regardless of payer, had an R2 value of .119. The independent variables of the parsimonious model were selected because they were the three independent variables with the largest partial R2 values in the complete model plus impairment category, regardless of payer. The same regression models (complete and parsimonious) using only patients receiving Medicare Part B benefits generated R2 values of .361 and .120, respectively. The continuous variable of age was used in the complete model because age ranged from 65 to 102 years, but the categorical variable of age only accommodated patients 18-45, >45 to <65, and 65 and older, which makes the categorical age variable, as we defined it, irrelevant for patients receiving Medicare Part B benefits. For all models, severity, i.e., the quartile of the intake FS measures, controlled the largest percent of variance of the data, which was consistent with prior research. 62 Symptom acuity controlled the second largest percent of variance of the data.

6/1/06 Pay-for-Performance Grant #18-P-93066/9-01 22 Focus On Therapeutic Outcomes, Inc.
An R2 value is commonly interpreted as the percent of variance in the FS measure attributed to the regression model. Here the R2 values generated with the complete model were slightly less than the .42 R2 value in general linear regression models used by Resnik and Hart, 62 and the R2 values generated by the parsimonious model were much less impressive compared to the complete model or the model used in the previous study. The difference between the two studies is instructive. In the Resnik and Hart study and in our study using the complete model, the dependent variable was discharge functional status, and the model contained the intake functional status measure, i.e., condition severity, and age as continuous variables. Different regression models were applied between studies. In the current analysis, when we reduced the complete model to a more parsimonious model, which we did to improve practical application, a reduction in R2 occurred, which was expected. Using a change variable as the dependent variable and transforming continuous variables to categorical variables combine to reduce the power of the model because of the loss of discrimination secondary to the cut points associated with the transformations. We used the change in FS and categorical variables because they facilitated the practical implementation of the payment algorithm. Using the variables in the parsimonious model for the sample regardless of payer produces a set of 396 risk-adjusted cells of homogeneous patients. These cells are mutually exclusive, independent, “risk-adjusted” cells of homogeneous patients developed from the most statistically powerful variables plus the patient’s impairment (11 categories of impairment X 4 categories of condition severity X 3 categories of symptom acuity X 3 categories of age = 396). The parsimonious model resulting from the current multivariate analyses was identical to the VPPA developed previously. (Hart 2001 unpublished) In the current data, one cell had no patients (patients with a CVA, very severe medical condition, were older, and had acute symptoms), which left a total of 395 cells. The 395 cells covered patients with orthopedic impairments well. The model covered the cells of patients with the two neurologic conditions less well. The number of patients in each cell ranged from 1 to 2527, with an average of 479, standard deviation 499, and median 291. Of the 37 cells with less than 30 patients, 28 cells were for patients with CVAs, 8 cells were for patients with brain injuries, and 1 cell was for patients with elbow impairments. Therefore, the large data set produced cells of data from which the risk-adjusted values of FS and visits could be reasonably determined and used to develop the payment algorithm, particularly for patients with orthopedic impairments. More data for patients with neurological impairments will be necessary in future studies. Value Purchasing Payment Algorithm. We designed the Value Purchasing Payment Algorithm© (VPPA) to be used for reimbursement where effective and efficient care was encouraged by paying a bonus, and ineffective and inefficient care was discouraged by paying less. 17 To demonstrate how the algorithm would work, we arbitrarily developed definitions of the gradations in payment for each of the nine payment scenarios (Table 5) and simulated results. Before the simulation could be conducted, each patient was assigned a payment scenario after which provider reimbursement was estimated. To assign a payment scenario, each patient was placed in a risk-adjusted cell by impairment category, condition severity, age group, and symptom acuity, and then a payment scenario was assigned using patient reported FS change (effectiveness) and clinician entered treatment visits within each risk-adjusted cell.

6/1/06 Pay-for-Performance Grant #18-P-93066/9-01 23 Focus On Therapeutic Outcomes, Inc.
Value Purchasing Payment Algorithm Cut-Point Determination. To test the impact of placing patients into the various payment scenarios, five methods of establishing the cut-points for below predicted, predicted, and above predicted effectiveness and visits per risk-adjusted cell of patients were examined. We developed payment algorithms using 68% CI, 90% CI, 95% CI, ±1 SD, and ±2 SD cut-points using all patients regardless of payer. The main difference between using CIs vs. SDs is that CIs allow inferences of the population characteristics based on sample data, and SDs allow direct inferences from the sample as if the sample were the population. Results of the analyses are displayed in tables 10 through 14. The percent of patients with predicted effectiveness and visits ranged from 5% to 95% for the payment algorithms using 68% CI, 90% CI, 95% CI, ±1 SD, and ±2 SD cut-point groups, respectively. Conversely, the percent of patients in the above predicted and below predicted groups ranged from 58% to 0% for the payment algorithms using 68% CI, 90% CI, 95% CI, ±1 SD, and ±2 SD cut-point groups, respectively. As expected, the percent of patients placed into groups of patients with above predicted, predicted, and below predicted effectiveness and visits are sensitive to the statistic used to estimate the cut-points within each risk-adjusted cell, i.e., the percent of patients in each payment scenario varied with each cut-point statistic.
6/1/06 Pay-for-Performance Grant #18-P-93066/9-01 24 Focus On Therapeutic Outcomes, Inc.
Purpose 2: To compare percent differences in costs to provide therapy using and not using the FOTO Value Purchasing Payment Algorithm© in a real data simulation of the retrospective data (first simulation). Methods. Simulation of the Value Purchasing Payment Algorithm. Once we were satisfied that the payment algorithm developed using the current data was identical to the original VPPA developed in 2001, we assessed the potential financial impact of applying the algorithm by performing two real data simulations. Real data simulations use actual data (i.e., the data collected from patients using the FOTO outcomes process) on which the statistical models are tested. 64 Without prospectively collected actual data, real data simulations offer the best alternative to actual data. 64 First, we generated the cut-points for the VPPA using all patients covered by any payer for all five cut-point statistics from which we selected patients receiving Medicare Part B benefits. Second, we selected patients receiving Medicare Part B benefits, generated the new cut-points for the VPPA using just the patients receiving Medicare benefits for all five cut-points statistics, and determined potential reimbursement reductions using the value-based payment algorithms. For each patient, we calculated the amount of reimbursement that would have been paid if the provider received $63/visit (represents a fee-for-service method of reimbursement) or had been paid using VPPA. In this way, we could estimate the potential percent difference between the two methods of payment, for each method of generating the pay-for-performance algorithms, for each of the cut-points. Although the exact amount of reimbursement per visit is meaningless in a percent change calculation, we used the value of $63/visit in the real data simulations because this amount was the average cost per visit estimated from more than three million patients who received outpatient therapy services in 2002 according to data from CMS. Of those patients, 88% received physical and 20% received occupational therapy services. 9 We then compared to patients who received Medicare Part B benefits to determine the financial impact to CMS of administering a P4P process, once when the VPPA cut-points had been developed using all patients and once when the VPPA cut-points had been developed using just patients receiving Medicare Part B benefits. Results. Simulation using the Value Purchasing Payment Algorithm©. To test the impact of the P4P process on the reimbursement of outpatient physical and occupational therapy services, we first analyzed data from the entire sample with complete episodes of care regardless of payer and compared the financial effect of using the payment algorithm with the reimbursement of $63/visit regardless of payer (Tables 10 - 14). The percent reduced reimbursement for using the pay-for-performance method for all patients regardless of payer per cut-point was 12.3% for 68% CI, 12.0% for 90% CI, 11.8% for 95% CI, 1.8% for ±1 SD, and an increased payment of 0.1% for the ±2 SD cut-points. Using the payment algorithm cut-points developed from all patients regardless of payer, we then selected patients who received Medicare Part B benefits and listed them separately. The percent reduced reimbursement to CMS for using the pay-for-performance method developed on all patients
6/1/06 Pay-for-Performance Grant #18-P-93066/9-01 25 Focus On Therapeutic Outcomes, Inc.
regardless of payer per cut-point was 12.5% for the 68% CI, 12.1% for the 90% CI, 11.9% for the 95% CI, 2.6% for the ±1 SD, and 0.8% for the ±2 SD cut-point, all of which compared favorably with the percent reduced reimbursement per cut-point for all patients regardless of payer. The percent of reduced reimbursement for CMS when the pay-for-performance algorithms per cut-point were generated using just patients receiving Medicare Part B benefits (Tables 15 – 19) was 11.6% for the 68% CI, 11.2% for the 90% CI, 10.9% for the 95% CI, 1.8% for the ±1 SD, and no reduction for the ±2 SD cut-point. These results demonstrate two primary findings: the pay-for-performance simulation suggests the payer can reduce expenditures and resources would be redistributed to patients who perceived good outcomes and were treated efficiently. Except for one cut-point, all pay-for-performance simulations reduced expenditures, and the percent reductions was similar regardless of whether the pay-for-performance payment algorithms were generated using patients from all payers compared to patients receiving benefits from Medicare Part B. The latter finding is logical because the difference between the regression models reflects the elimination of one risk-adjustment variable, i.e., age group, which was eliminated for patients receiving Medicare Part B benefits. The differences in percent reduction in reimbursements per cut-point generated using all patients regardless of payer and the percent reduced reimbursements per cut-point generated using only patients receiving Medicare Part B benefits (Table 20) may reflect the fact that there were 9,616 patients who were 65 years or older but received benefits from insurance plans other than Medicare Part B. In each of tables 10 through 19, the percent change in payment per payment scenario between the fee-for-service method and the pay-for-performance method fulfilled one of the primary criteria for a pay-for-performance process: providers whose patients reported outcomes above predicted effectiveness and were treated at or above predicted number of treatment visits received a payment bonus. However, if the patients reported outcomes below predicted effectiveness or were treated with below predicted visits, the providers were paid less. Patients who reported predicted effectiveness and were treated with greater than predicted visits also received a bonus. Therefore, assuming patients with improving FS warrant continued care, using the pay-for-performance method, resources are redistributed to patients whose condition warrants care and away from patients whose condition does not tend to improve as much as other patients with similar conditions (i.e., within homogeneous risk-adjusted cells). Such a paradigm fosters care based on need and payment based on results. Because the outcomes were generated using patient self-report of FS change, the potential for clinician bias affecting the measure of effectiveness is reduced.
6/1/06 Pay-for-Performance Grant #18-P-93066/9-01 26 Focus On Therapeutic Outcomes, Inc.
Purpose 3: To implement a prospective pay-for-performance process in three outpatient clinics for patients receiving outpatient physical or occupational therapy. Methods. Three hospital outpatient rehabilitation clinics volunteered to participate in the prospective data collection. The grant started in April 2005. Prospective data collection started following approval by the institutional review boards for the protection of human subjects of Presbyterian Healthcare Services, CentraState Healthcare System and Focus On Therapeutic Outcomes, Inc., all of which were obtained by May 9th. Both Presbyterian (over 8 years using FOTO) and CentraState (over 3 years using FOTO) were experienced collecting outcomes data and using that data to manage patients and clinicians. Presbyterian Healthcare Services had two participating clinics (Healthplex and Kaseman), and CentraState Healthcare System had one participating clinic (CentraState). Therefore, there were two hospital organizations and three hospital outpatient clinics participating in the prospective data collection study. Although both Presbyterian and CentraState as businesses were experienced users of the FOTO outcomes system, not all therapists who participated in the 2005 prospective data collection were experienced with the FOTO outcomes system. For example, only two of the nine participating therapists at CentraState had prior experience using the outcome tool. Secondly, many of the participating therapists might be used to entering data into the outcomes system, not all were commonly using the data to assist them in the management of their patients, which supported the training described below. The data collection method has been described. 13,25,27,28,30,31,40,42-45,62 Briefly, patients entered demographic data and completed self-report surveys via computer prior to initial evaluation. Clinical staff entered demographic data via computer. Patients completed a functional survey via CAT (demonstration software available on http://www.fotoinc.com/demoinstructions.htm). In spite of the familiarity of the three clinics with the FOTO data collection method, we provided training for all staff. Two different types of training were accomplished. First, a series of telephone conference calls were conducted to train the staff in the use of the new Patient Inquiry (PI) software (FOTO, Knoxville, TN), which had been disseminated to both hospital systems. Second, Dr. Hart worked with the three (one for each clinic) personnel selected to monitor the data collection method, which we identify as “research assistants.” The research assistants were employees of the hospital systems and reported directly to the rehabilitation managers of the hospitals. Dr. Hart monitored the research assistants related to the patient solicitation, data collection and data transfer processes. Dr. Hart worked with interested therapists, research assistants and rehabilitation managers to develop forms to standardize patient solicitation, data collection and data transfer to FOTO. The purpose of the forms were to identify each patient who was receiving Medicare Part B benefits when they arrived to the clinic for the first time, including the Medicare Advantage plan health maintenance organization Senior Care program in New Mexico, solicit each potential patient to participate, track each patient who participated in the data collection method and record any reason for not participating or reason why any participating patient did not complete their

6/1/06 Pay-for-Performance Grant #18-P-93066/9-01 27 Focus On Therapeutic Outcomes, Inc.
episode of care, so we could account for 100% of the patients. In this way, patient selection bias, if any, could be identified. The forms standardized the language used to label patients who did not start the data collection method (Table 21) or did not finish the data collection method (Table 22). As data were collected, Dr. Hart conducted regular telephone calls with all clinics to coordinate the method of patient solicitation, data collection, and data transfer. Monthly, electronic files containing the details relating to solicitation process and patient refusals were transferred to Dr. Hart. As new reasons for not starting or not finishing were identified, they were added to the standardized forms, so all clinics could use the same language. Results. Data collection officially started by the second (CentraState) or third (Presbyterian) week of May. Between data collection initiation and December 31, 2005, 1,224 patients were approached, and 1,065 (87.0%) of these patients volunteered to participate and signed a patient consent form. Of the 1,224 patients approached, 268 (21.9%) patients either refused or were unable to participate because of a variety of patient concerns or technical issues (Table 23), which provided a sample of 956 (78.1%) patients who volunteered and were able to complete the intake surveys. Of the 956 volunteers who started the outcomes process and outpatient rehabilitation treatment, 416 patients were either unable to finish data entry for a reason that was recorded (37 patients) or discharge outcomes data from the patient or therapist were missing (379 patients). This left a sample of 540 patients available for analyses. All of the 540 patients had an intake functional status (FS) patient survey, a discharge FS patient survey, and a therapist discharge survey in the data set, which we operationally define a complete data episode. Although these 540 patients had functional status outcomes data collected at intake and discharge as well as therapist data collected at discharge, not all additional outcomes instruments (defined below) were completed for each patient. Of the data displayed in Table 23, several important percentages should be noted. From a perspective of patient selection bias, the percent of patients who were appropriate to start the data collection process (i.e., 1,224) who actually started the data collection process (i.e., 956) is operationally defined as the implementation rate of data collection, in this sample, 78.1%. Of the 956 patients who started the data collection, the percent of patients who completed the data collection process (i.e., 540) is operationally defined as the completion rate of data collection, in this sample, 56.5%. The higher the implementation and completion rates, the less potential for patient selection bias. From a qualitative perspective, although the implementation rate is admirable and represents little potential for selection bias, the completion rate is a concern. Because the completion rate is so low, the potential for selection bias exists. Further analyses provide some data from which the potential for selection bias can be examined. First, at CentraState, there were 264 patients who started the data collection process, of which 30 did not finish data collection for known reasons. This left 234 patients who should have finished data collection, of which 186 (79.5%) patients completed data collection. This left 48 patients
6/1/06 Pay-for-Performance Grant #18-P-93066/9-01 28 Focus On Therapeutic Outcomes, Inc.
who did not finish data collection for some unknown reason: these patients are in question for potential selection bias because we do not know why discharge data were not completed. Of the 8 therapists who treated more than 10 patients each over the course of the feasibility study, only two therapists had a completion rate below 70% (40% and 67% completion rates). We have no data that could be used to further understand if these therapists deliberately elected not to collect the discharge data, but qualitative comments from the administrators suggest the discharge data more likely were not collected because of lack of interest from the therapists, lack of time from the therapists or lack of administrative pressure to collect all discharge data. The two therapists who were experienced collecting and using the outcomes data to manage their patients prior to the feasibility study had completion rates of 74 and 98%, compared to completion rates ranging from 40% to 89% from the therapists who were not accustomed to collecting and using outcomes data prior to the feasibility study. CentraState’s overall completion rate was 70.5%. The overall completion rate for the Presbyterian clinics was 49.9% for Kaseman and 53.3% for HealthPlex. For the patients treated in the Presbyterian clinics, therapists recorded reasons why patients could not provide discharge data on only 7 patients, which leaves 685 patients that should have provided discharge data, of which 354 (51.7%) patients did not have discharge data for some unknown reason. These 354 patients without discharge data raise the concern of selection bias. Of the 20 therapists who treated 10 or more patients during the feasibility study, only three therapists had completion rates greater than 70%, which implies a lack of interest in the outcomes data amongst the therapists. From these completion rates, one can imply that few therapists found the outcomes data useful enough to want to collect and use the data in the management of their patients, although other explanations are possible. For example, during the prospective data collection process, there were administrative pressures on the treating therapists, e.g., several therapists and support staff left the employment of Presbyterian, which created more administrative pressure on the remaining staff, which left little time to collect discharge data. Without the clinicians’ internal need to have the data to assist in the management of their patients or without the pressure from management or the payer to collect the data, collection of discharge data might be easily neglected. Management has no reason to believe therapists elected to collect or not collect discharge data on specific patients because of the therapist’s perception of the patient’s “expected” level of functional improvement at discharge. Further, there was no enforcement or administrative pressure at either Presbyterian or CentraState for the therapists to collect the data. Finally, it is well known from the literature on clinical guideline implementation that clinicians need to progress through several steps in the process of learning to use outcomes data in their daily practice. First, the clinician needs to collect data. Second, the clinician needs to use the data in the management of their patient. Third, with experience with using the data, the clinician will synthesize the data into the management of their patients for the goal of improving the patients’ functional status. Finally, if these steps do not create an internal need for the data by the clinician, the best way to modify clinician behavior is to attach payment to the behavior of interest. In this feasibility study, there was no relation between the collection of outcomes data and payment for treatment or administrative discipline, and therefore, only the needs or desires of the therapist were in play. Summary statistics for the 540 patients with complete episodes are displayed in Table 24. Of the 540 patients, physical therapists treated 92.6%, and occupational therapists treated 7.4% of the patients. Of interest, 8.5% of the patients were 18 to 65 years old. These patients were on Social

6/1/06 Pay-for-Performance Grant #18-P-93066/9-01 29 Focus On Therapeutic Outcomes, Inc.
Security disability and therefore covered by Medicare Part B benefits. Overall, the data demonstrated patients improved in their functional status over the course of treatment (change in functional status 11.4±13.7) over an average of 8.8±6.1 visits over a treatment episode of 36.8±23.9 calendar days (mean±standard deviation). The average (SE) visits for patients treated by physical therapists (8.6(0.26), n=497) tended to be less than the number of visits for patients treated by occupational therapists (11.3(0.95), n=39) (one-way ANCOVA F 1,1,533 =7.1, P=0.008). When compared to the number of treatment visits reported for hospitals in the 2002 CMS data analyses where the number of visits for patients treated by physical therapists was (9.0±9.4, n=1,266,249) and occupational therapists (7.3±9.6, n=255,126), it appears the current physical therapists used slightly fewer visits but the current occupational therapists used more visits. 7 We analyzed the data to see if the participating clinics were practicing differently now that they were collecting prospective data in a research project where they knew their patient management and outcomes would be examined. To answer the question of whether practice patterns changed from before the pay-for-performance project started compared to after the pay-for-performance project was implemented, we compared the data from the participating clinics collected routinely using the FOTO system over the 24 months preceding May 2005 to the data collected prospectively as part of the pay-for-performance project starting in May 2005. There were 1,686 patients (1,217 pre-study, 496 study) available for analysis. First, we checked the completion rate (i.e., patients who started the outcomes data collection process and had patient intake and discharge data as well as staff discharge data) for the three clinics. The completion rates for the pre-study vs. the pay-for-performance study samples were: Kaseman (NM) 60.0% compared to 49.9%; HealthPlex (NM) 41.2% compared to 53.3%; and CentraState (NJ) 88.8% compared to 70.5%. Therefore, the completion rate at Kaseman and CentraState decreased once in the study, and the completion rate at HealthPlex increased from pre-study to study. Second, we checked to see if the patient characteristics were different pre-study compared to during the study. There was no difference in the proportion of patients in the various levels of acuity (acute, subacute, chronic), age (18 to 45, 45 to 65, 65 to 75, >75 years), exercise history (3X/wk, 1-2X/wk, or seldom), gender (male, female), or surgical history (no, yes) for pre-study vs. study samples (P>.05). The participating patients (72.9±9.2 years) were slightly (t=2.2, df=1117, P=.027) but not meaningfully older than the patients treated before the study (71.7±10.8 years). There were more patients with neurologic impairments treated in the study compared to pre-study (chi square=6.7, df=1, P=.01, standardized deviate 2.1 for more neurologic patients in the study). Intake functional status measures were similar (t=-.66, df=1001, P=.51) for patients treated before the study (46.8±13.1) compared to patients treated once the study started (46.4±12.4). Third, we checked to see if the risk-adjusted FS change, number of visits, and treatment duration were different pre-study compared to the study sample. Because we were interested in changes between clinics over time, we used a two-way ANCOVA on each of the dependent variables (i.e., FS change, visits, duration) with intake FS as the covariate, and time (pre-study, study) and practice (CentraState, HealthPlex, Kaseman) as main factors. We controlled for symptom acuity (acute, subacute, chronic), age (18 to 45, 45 to 65, 65 to 75, >75 y), impairment (orthopedic, neurologic),

6/1/06 Pay-for-Performance Grant #18-P-93066/9-01 30 Focus On Therapeutic Outcomes, Inc.
and surgical history (none, one or more) in the ANCOVAs. The interactions between time and practice were of interest to see if there were any changes over time within practice. FS change (in FS units ranging from 0 to 100) increased (F=12.3, df=1, P<.001) over the study period (pre-study 8.2{1.2}, study 10.8{1.2}) (least squares means{standard error}), and FS change was different between clinics (F=11.0, df=2, P<.000). Patients at CentraState reported more (P<.002) FS change (12.0{1.2}) than patients at HealthPlex (8.7{1.2}) or patients at Kaseman (7.9{1.3}). The interaction between time (pre-study, study) and clinic (CentraState, HealthPlex, Kaseman) was not significant (F=2.9, df=2, P=.053), although plots of FS change by clinic by time demonstrated that all clinics tended to increase the amount of FS change over time, and HealthPlex tended to have the greatest (85%) change (CentraState and Kaseman tended to improve 11% and 19%, respectively). The number of visits increased over time (F=55.4, df=1, P<.001) from 7.0{.4} to 9.0{.4}, pre-study to post-study, respectively (mean{standard error}). The number of visits was different across clinics (F=6.5, df=2, P=.002). Kaseman used fewer (P<.02) visits (7.3{.4}) compared to CentraState (8.3{.4}) and HealthPlex (8.4{.4}). There was a significant interaction between time (pre-study, study) and clinic (CentraState, HealthPlex, Kaseman) (F=13.4, df=2, P<.001). Plots of visits by clinic by time demonstrated that all clinics tended to increase the number of treatment visits from pre-study to post-study: CentraState 6.3{.5} to 10.2{.5}, HealthPlex 7.5{.3} to 9.2{.5}, and Kaseman 7.1{.4} to 7.5{.5} (least squares means{standard error}). Duration of treatment episode (in calendar days) increased (F=32.6, df=1, P<.001) from 28.9{1.8} to 36.5{1.8} over the study period (mean{standard error}), and duration was different between clinics (F=49.5, df=2, P<.001). Duration was different amongst all pairs of clinics (P<.001): CentraState (24.2{1.9}), HealthPlex (42.2{1.8}) and Kaseman (31.7{2.0}). The interaction between time (pre-study, study) and clinic (CentraState, HealthPlex, Kaseman) was significant (F=6.8, df=2, P=.001). Plots of visits by clinic by time demonstrated that all clinics increased their duration from pre-study to post-study: CentraState from 18.4{2.4} to 30.1{2.2}, HealthPlex from 37.1{1.7} to 47.2{2.6} and Kaseman from 31.2{2.1} to 32.1{2.3} (least squares means{standard error}). In summary, practice patterns of the clinics tended to change from pre-study to the feasibility study period. Completion rates were disappointing with two of the three clinics decreasing their completion rates from pre-study to post-study, while the completion rate of the third clinic remained low pre- to post-study. The characteristics of patients treated were similar pre-study compared to post-study, except there were more patients with neurological impairments post-study, which are associated with similar number of treatment visits but less functional change and treatment duration. Functional status improved with treatment, and patients reported more FS change when treated while in the study compared to pre-study patients. All clinics increased slightly (7 to 8 visits per patient) but significantly the number of treatment visits while in the study. All clinics increased their treatment duration while in the study. Therefore, patients who participated in the study tended to report more FS change (i.e., increased effectiveness) compared to patients treated prior to the study, and clinicians tended to increase the number of treatment visits and duration of the treatment episode while in the study.
6/1/06 Pay-for-Performance Grant #18-P-93066/9-01 31 Focus On Therapeutic Outcomes, Inc.
Responsiveness and construct validity of the FS change measures were examined using the prospectively collected data. The effect size statistic (discharge FS – intake FS)/(standard deviation of intake FS measures) was .91 (n=536) overall, which represents a large effect size, i.e., the FS measure was responsive. Because the analyses of the retrospective data supported differences in effect sizes between patients with orthopedic vs. neurological impairments, responsiveness was estimated separately for these two groups of patients. The effect size statistics were .98 (n=474) for patients with orthopedic impairments compared to .45 (n=55) for patients with neurological impairments, which compares favorably to the effect sizes estimated using the retrospective data. As stated above, Stratford and Riddle 69 recommend specific change coefficients based on different assumptions concerning the sample composition. In our data set, patients were expected to improve in their FS measures by different amounts. In the prospectively collected data, we collected data representing an external standard, i.e., global rating of change, which we correlated with the FS change of our patients, so another estimate of responsiveness or sensitivity to clinically important change could be calculated. Global rating of change (GROC) was assessed independently by the patient and the therapist as recommended by Jaeschke et al. 37 At the end of treatment, the patient and therapist are asked to rate their overall perception of improvement since beginning treatment on a scale ranging from –7 (a very great deal worse) to zero (about the same) to +7 (a very great deal better). Therefore, it is important to note that in this study, we were able to not only collect patient self-report functional status data, but we also collected therapist collected data on the patient’s overall improvement while in therapy. The GROC data collected from both the patient and the therapist represent an external comparison from which we can determine what amount of functional status change is clinically important from the perspective of the patient and therapist. There were GROC data collected from 430 patients, and therapists collected GROC data on 377 patients. 322 patients had both patient and therapist data. Of those 322 patients, the difference between the patients’ and therapists’ rating of change (GROC patient minus GROC therapist) averaged .23 (2.5 standard deviation, range -13 to 8). It has been recommended that GROC values between ±3 represent small to no change, and GROC greater than ±3 represent clinically important improvement. 36 (11.1%) patients had differences greater than ±3 GROC units and were deleted from responsiveness analyses. The rest of the patients (n=286) were dichotomized on the average between the patients’ and therapists’ GROC to align the opinions of the patient and the therapist: patients with average GROC scores greater than –3 and less than +3 were categorized as having no change; patients with average GROC scores equal to or less than -3 or equal to or greater than +3 were categorized as having an important change. We used non-parametric receiver-operating-characteristic analyses to quantify the accuracy of the functional status change measure to discriminate between patients whose functional status had improved in an important way compared to patients whose functional status had not improved in an important way. 23 ROC analyses using all 286 patients supported a functional status change of 10 or more was associated with patients and therapists classifying the patients improvement as clinically important (area under the ROC .73(.04 standard error), 95% CI .66 to .80, sensitivity .64, specificity .75). Similar ROC analyses were found using the 243 patients with orthopedic impairments, i.e., a functional status change of 10 or more was associated with patients and therapists classifying the patients improvement as clinically important (area under the ROC .77(.04 standard error), 95% CI .69 to .84, sensitivity .68, specificity .75). However, the ROC

6/1/06 Pay-for-Performance Grant #18-P-93066/9-01 32 Focus On Therapeutic Outcomes, Inc.
analyses using the 43 patients with neurological impairments were less clear: a functional status change of 14 or more was associated with patients and therapists classifying a patient’s improvement as clinically important (area under the ROC .51(.10 standard error), 95% CI .31 to .71, sensitivity .35, specificity .89). Validity of the FS measures was assessed using known-groups methods. The known-groups method of construct validity was assessed by determining if the FS measures discriminated between groups of patients known to have a certain trait. For these data, we tested known-groups construct validity by assessing the discriminating ability of the FS measures to detect change in FS using one-way ANCOVAs with the FS change as the dependent variable, the intake FS measure as the covariate, and the following independent variables as the main factors. The independent variables assessed were: symptom acuity (acute, subacute, chronic), age group (18 to 45, 45 to 65, 65 to 75 years, >75 years), exercise history (3 or more times a week, 1 or 2 times a week, seldom or never), gender (male, female), prescription medication use at intake (yes, no), impairment (orthopedic, neurological), payer (Medicare Part B, Medicare Advantage), and surgical history (none, one or more). The results of the construct validity analyses are displayed in Table 25. The FS measures discriminated patients in clinically logical ways for symptom acuity, age, medication use at intake, impairment and payer (P<0.05). Overall, the results support the construct validity of the FS measures. Finally, to test whether additional measures could be helpful in identifying new risk-adjustment variables pertinent to patients receiving outpatient rehabilitation, five new patient self-report measures were assessed. The new measures were fear-avoidance of physical activities, 72
depression, 11 somatization, 11 pain 38 and the functional comorbidity index. 19 Patients with high levels of fear of physical activities have been associated with poor change in functional status following rehabilitation. 16 In our data set, 456 patients had fear-avoidance of physical activities data at intake and discharge. Possible values range from 0 (no fear) to 24 (high fear). In our data, intake fear values ranged from 0 to 24, with an average of 12.0 (6.4 SD), with a median of 12. Previous literature 77 used the median measure at intake to classify patients with low vs. high fear-avoidance, which is how we classified our patients: patients with 0 to 11 were classified as having low fear; patients with 12 to 24 were classified as having high fear. High levels of depression and somatization also have been associated with poor functional status at discharge. In previous studies, 77 the median was used to identify the cut points for the high vs. low depression and somatization. The possible values of depression used in this study ranged from 0 (low depression) to 50 (high depression). In our data set, 388 patients had intake and discharge depression data. In our data, intake depression values ranged from 0 to 38, with an average of 9.3 (8.0 SD), with a median of 7. We classified our patients with 0 to 6 as low depression and 7 to 50 as high depression. The somatization measure used in this study could range from 0 (low somatization) to 35 (high somatization). In our data set, 418 patients had intake and discharge somatization data. In our data,
6/1/06 Pay-for-Performance Grant #18-P-93066/9-01 33 Focus On Therapeutic Outcomes, Inc.
intake somatization values ranged from 0 to 21, with an average of 4.7 (4.3 SD), with a median of 4. We classified our patients with 0 to 3 as low somatization and 4 to 35 as high somatization. The functional comorbidity index (FCI) of Groll et al 19 was developed as an index to be used to adjust for the effect of comorbid disease when assessing change in physical functioning. The FCI was developed using a database similar to the FOTO outpatient rehabilitation database, so it appeared appropriate to test the effect of the FCI on discharge functional status. The FCI contains 18 diagnoses describing comorbid conditions, like presence of arthritis or congestive heart failure that are summed for a total number of comorbid conditions present. The number of comorbid conditions has been associated with physical functioning. In our data set, 516 patients had intake FCI data. In our data, the number of comorbid conditions ranged from 0 to 14, with an average of 3.4 (2.4 SD), with a median of 3. Only 85 of 516 (16.5%) patients had more than 5 comorbid conditions, and 105 (20.3%) patients had fewer than 2 comorbid conditions. We entered the number of comorbid conditions as dummy variables (i.e., one for each number of comorbid conditions) for the regression analyses. To identify potentially important risk-adjustment variables, we analyzed the prospectively collected data using the same regression techniques described above under the development of a risk-adjusted P4P model. The dependent variable was the discharge FS measure. Independent variables available in the prospective data included: intake FS measure, age, impairment (orthopedic, neurologic), payer (Medicare Part B, Medicare Advantage plan health maintenance organization Senior Care program), symptom acuity (acute, subacute, chronic), surgical history (none, one or more), practice (CentraState, HealthPlex, Kaseman), gender (male, female), exercise history (3X/wk, 1-2X/wk, seldom or none), medication use at intake (yes, no), depression (low, high), somatization (low, high), fear of physical activities (low, high), pain at intake (low, high), and the functional comorbidity index (categorical with fifteen levels). Age and intake FS were entered as continuous variables, and all other variables were entered as categorical. Once the variables with insignificant coefficients were eliminated, the final model contained the following variables: intake FS, impairment, payer, acuity, practice, and FCI (n=509, F21,487=17.1, P<.001, R2 =.425). Partial R2 values for the six significant independent (i.e., risk-adjustment) variables were 29.8, 3.7, 1.5, 2.6, 2.6 and 1.8%, respectively. Therefore, in these data, it appears that of the new risk-adjustment variables, only the FCI added a small but significant percent of variance controlled for the model. Therefore, it is recommended that future studies explore the potential advantages of using the FCI as a risk-adjustment variable for monitoring change in functional status. It should also be kept in mind that the current data set is considered small for such a multivariate analysis, the other new independent variables have shown promise as predictors of FS outcomes in other studies, and intake scores might not be as good as discharge or change measures for each of the variables for predicting FS outcomes. Therefore, further investigation into all potential risk-adjustment variables is warranted.

6/1/06 Pay-for-Performance Grant #18-P-93066/9-01 34 Focus On Therapeutic Outcomes, Inc.
Purpose 4: To retrospectively apply the pay-for-performance process to the data collected prospectively to determine the impact of implementing a pay-for-performance process (second real data simulation of the retrospective data). Methods. We applied the VPPA previously developed using retrospective data from patients receiving Medicare Part B benefits to the prospectively collected data to compare the potential financial impact of implementing a pay-for-performance process using retrospectively vs. prospectively collected data. The five cut-points assessed previously were applied to the prospectively collected data. Results. The results are displayed in Tables 26 through 30. Comparing summary data from the retrospective analyses (Table 20) with the prospectively collected data (Table 31), several interpretations can be made. First, results from the simulations suggest using a pay-for-performance payment algorithm could reduce reimbursement. Second, the change in reimbursement is dependent on the cut-points used to classify the patients by effectiveness and number of treatment visits. Therefore, if desired, policy makers can select the cut-points to remain budget neutral, i.e., either ±1 or ±2 standard deviations about the mean within each risk-adjusted cell of homogeneous patients, or policy makers can select the cut-points to decrease reimbursement, i.e., 95%, 90% or 68% confidence intervals about the mean within each risk-adjusted cell of homogeneous patients. Third, use of one of the percent confidence interval cut-points offers an opportunity to shift reimbursement away from patients who are not benefiting from treatment to those patients who are benefiting from treatment designed to improve functional status. Use of one of the percent confidence interval cut-points would therefore represent a move to provide care based on need and payment based on results. For example, if we use the 90% CI cut-point for illustration (Tables 16 & 27), use of a payment algorithm that encourages more effective outcomes produced efficiently would reimburse providers more if they produced better outcomes with limited number of treatment visits. Scenario number 1 (above predicted effectiveness and fewer than predicted number of visits) produced more reimbursement for the entire sample and the prospectively collected data: therefore, scenario number 1 would become the clinical goal for providers and managers. Similar results were obtained in scenario 4 (predicted effectiveness and fewer than predicted number of visits). Furthermore, there is ample opportunity for providers to use evidence-based treatment to improve their patients’ functional status while using fewer treatment visits. As comparisons, scenarios with more than predicted visits (i.e., scenarios 3, 6 and 9) produced the largest amount of reduced reimbursement: therefore, patients in these scenarios would be managed carefully in the clinic in order to reduce the potential for lower reimbursement. The results seem clinically logical, since the data in scenarios 3, 6 and 9 represent patients whose functional status improvement is less than expected within their homogeneous risk-adjusted group, yet the provider continued to treat beyond the predicted number of treatment visits. It could be hypothesized that the treatment was not necessary, and the data support that the treatment was not effective. Fourth, use of either the ±1 or ±2 standard deviations cut-point offers almost no opportunity for improvement for the providers who might want to strive for better outcomes through efficient evidence-based care.
6/1/06 Pay-for-Performance Grant #18-P-93066/9-01 35 Focus On Therapeutic Outcomes, Inc.
The three clinics that volunteered to participate in the pay-for-performance feasibility study had a history of being efficient and effective prior to participation in this project, but once in the study, although the FS change increased in all clinics, so did the number of treatment visits, i.e., the number of treatment visits increased. From these data, we cannot identify specific reasons for these results, particularly since there was no enforcement or payment policy in effect that would affect the way the clinics would be reimbursed while participating in the feasibility study. However, our hypothesis remains that, if a value-based purchasing process were in effect, managers would not want to be financially penalized by treating patients beyond the predicted number of treatment visits as described in the payment algorithm, so the managers would direct their clinicians to stop treatment if the number of visits went beyond the risk-adjusted predicted number of visits and functional status was not increasing. It is expected that once managers have data on effectiveness and visits from which to manage their providers in real time, managers will encourage fewer number of treatment visits and improved effectiveness. To determine what might be the result if managers encouraged their providers to modify their clinic behavior, we performed another real data simulation (third simulation) of the retrospective data set of patients (n=28,870) receiving Medicare Part B benefits using the 90% CI cut-point. In this simulation, we developed no hypothesis concerning improved effectiveness. We simply moved the patients who had been in the three payment scenarios where the number of treatment visits was more than predicted by level of effectiveness to the respective payment scenarios where the number of treatment visits was predicted by level of effectiveness, and reran the computer program to estimate the cost of treatment. Then we compared the differences in reimbursement between the initial pay-for-performance method and the pay-for-performance method where the managers modified the clinicians’ management of their patients by stopping treatment when the number of visits reached the maximum predicted number of visits. This simulation examines the possible effect of future clinicians “working within” the new payment model by reducing the number of patients for whom reimbursement represented reduce reimbursement. The results of the simulation are displayed in Table 32. As expected, when the clinicians modify their clinical behavior by not treating patients beyond the predicted number of treatment visits, the simulated amount of reimbursement increased 12.3% compared to the initial application of the VPPA. The initial simulation of the payment algorithm produced an estimated 4% savings in reimbursement compared to a fee-for-service plan. Therefore, given the results of the last simulation, application of a payment method based on effectiveness and number of treatment visits has the potential to modify provider behavior and patient management as providers would strive for better outcomes using the least number of visits feasible, which is encouraged by the IOM. 36 In our simulation, we made no effort to simulate improved patient outcomes. However, the prospectively collected data may indeed represent this possibility because the participating three clinics demonstrated improved effectiveness compared to the other clinics on average in the retrospective data (n=28,870), and the clinics participating in the prospective data collected improved their effectiveness from before participating in the feasibility study compared to participating in the study. Another suggestion from the results of the last simulation is the following: when managers and providers have and use the effectiveness and number of treatment visits data in real time, we should expect modifications in provider behavior that might increase reimbursement in comparison to the

6/1/06 Pay-for-Performance Grant #18-P-93066/9-01 36 Focus On Therapeutic Outcomes, Inc.
initial savings expected from the initiation of a pay-for-performance payment method because providers will reduce treatment visits when their patient’s functional status is no longer improving. When this occurs, the amount of reimbursement associated with more visits will be reduced. This reduced number of treatment visits is encouraged, but reduced number of treatment visits, particularly when associated with improved effectiveness, will reduce the amount of savings expected from a pay-for-performance method. In other words, fewer visits when associated with less than predicted effectiveness will be reimbursed more because the financial penalty will be less. We interpret this possibility as positive: clinics with fewer visits and effectiveness will be reimbursed more. What our prospectively collected data do not reflect is the impact of applying a pay-for-performance method to clinics with less effective treatment associated with more than predicted number of treatment visits. This comparison would require a larger prospective data collection and a stronger research design, which is recommended. The current results suggest that the process of changing a payment system will be dynamic as payers, managers and providers learn how to work within the system. One question we could not answer with our prospective or retrospective data is what would be the impact of excessively reducing the number of treatment visits. The Presbyterian clinics have experience with this possibility (Banks 2003 unpublished). In 2003, management at Presbyterian aggressively implemented a procedure where therapists were strongly encouraged to treat patients with the fewest number of treatment visits possible in an effort to be efficient. Within six months, their FS change dropped. On examination, the characteristics of the patients had not changed nor had the staff changed. It was assumed that the management style was simply too strict on the number of treatment visits allowed for the patient conditions. As can be seen by the current retrospective and prospective data, Presbyterian has improved their clinical outcomes since that episode of reduced treatment visits. Although this example is anecdotal, the facts imply that a system that compares measures of effectiveness and treatment visits contains the measures necessary to monitor adverse, unwarranted effects of well-meaning but overly aggressive policy. This experience supports using measures of effectiveness with number of treatment visits to develop a value-based purchasing method.

6/1/06 Pay-for-Performance Grant #18-P-93066/9-01 37 Focus On Therapeutic Outcomes, Inc.
Purpose 5: To develop clinically and statistically logical interpretations of the results that could justify changes to payment policy. Methods. Previous methods and results were used to accomplish purpose 5. Results. The current results demonstrate that a pay-for-performance model based on a fee-for-service method of payment for outpatient physical and occupational therapy could be developed using a data set large enough to risk-adjust the FS measures that then could be used along with number of treatment visits to pay providers according to the amount of functional improvement obtained as perceived by the patient and the number of treatment visits used by the provider. When the payment algorithm was developed using various cut-points and applied in a real data simulation, the percent reduced reimbursement ranged between 0 and approximately 12%. The differences in the percent reimbursement were related to the cut-points used to calculate the threshold of FS change or number of treatment visits where the measure becomes below predicted, predicted, or above predicted, and therefore the percent reimbursement is cut-point sensitive. The cut-points were selected arbitrarily. Further study is warranted to explore other cut-points and to investigate whether the findings reported here can be replicated. The payment scenarios generated on clinical effectiveness and number of treatment visits not only aligned resources with the level of effectiveness and visits, but if the cut-point for the payment scenarios were selected carefully, the resulting payment scenario of the pay-for-performance process would be expected to encourage providers to modify their clinical behavior to improve their patient’s outcomes while using the most efficient patient management strategies possible. Because the pay-for-performance method is not specific to any type of provider or treatment provided, the pay-for-performance model 1) should be appropriate for all clinicians treating patients receiving outpatient physical and occupational therapy who have the goal of improving their functional status, and 2) should encourage providers to use the most appropriate evidence-based interventions demonstrated to produce better clinical outcomes, such as appropriate patient classification systems 14,76,77 or clinical prediction rules 8 designed for patients receiving Medicare Part B benefits. Therefore, the pay-for-performance process should be seen as a payment method that 1) meets the Institute of Medicine’s vision of the health care delivery system of the future that is safe, effective, patient-centered, timely, efficient and equitable 36 because it aligns financial incentives with implementation of care processes based on best practices and the achievement of better patient outcomes, 2) encourages clinicians to employ evidence-based practice, 3) fosters development of best practices based on outcomes, and 4) is appropriate for physical and occupational therapists who treat patients in outpatient facilities with the goal of improving their functional status. Since the measures used to develop the payment algorithm, the possibility exists that such a payment method would be appropriate for other clinicians who treat patients with a goal of improving functional status, such as orthopedic surgeons or chiropractors. The pay-for-performance process demonstrated in this study has the capacity to align incentives in such a manner that care can be based on need and
6/1/06 Pay-for-Performance Grant #18-P-93066/9-01 38 Focus On Therapeutic Outcomes, Inc.
payment based on results. As such it is worthy of consideration as an alternative to the Medicare therapy caps. The Value Purchasing Payment Algorithm© was originally devised by outpatient rehabilitation providers, managers and business owners. Development of the VPPA was made possible by using the large risk-adjusted database that had been amassed over several years. We selected the bonus and penalty range (+10 to -10%) for the algorithm arbitrarily, but the selection was driven by suspected ease of application, analysis, explanation and level of incentive. The ultimate utility of value-based purchasing will be determined by the degree to which such a process shapes clinical decision-making or, as espoused by the Institute of Medicine, “aligns the incentives” for the delivery of care. The use of the VPPA was intended to “align the incentives” by creating a focus on efficient outcome or results of therapy (i.e., improved functional status of the patient with a limited number of treatment visits). Current results suggest the VPPA may produce such an alignment. Before value-based purchasing can be applied to rehabilitation therapy services, several practical issues need to be addressed and tested. These include but are not limited to the following.
• A method of matching patient claims to patient outcomes measures would have to be developed and tested.
• Ways of creating an appropriate incentive for rehabilitation therapy providers and
suppliers to collect and report functional outcomes data should be explored.
• Medicare systems should be examined to identify which parts of the systems would need to be modified, reprogrammed, installed and tested. It would be expected that changes would need to be made in the Medicare manual and educational processes for contractors, providers and patients would need to be developed and implemented.
• More exacting studies would need to be implemented in order to determine if other cut-
points should be used to apply the payment algorithm. These studies should illustrate the impact of the new cut-points on the model as well as the effect such variables would have on Medicare expenditures for rehabilitation claims. It should be emphasized that the reimbursement savings reflected in this study are illustrative and therefore, an estimate of the financial impact of a P4P payment program would require more extensive research.
6/1/06 Pay-for-Performance Grant #18-P-93066/9-01 39 Focus On Therapeutic Outcomes, Inc.
Purpose 6: To determine if other data should be collected to facilitate the risk-adjusted pay-for-performance process, particularly for identifying patients who do not appear to fit well within the current risk-adjusted method. Methods. Previous methods and results were used to accomplish purpose 6. Results. Our analyses demonstrated that the majority (94%: Table 1) of the patients treated in the outpatient rehabilitation clinics participating with the FOTO outcomes system had orthopedic impairments, which is higher than the results of the analyses performed on the 2002 Medicare billing data by Ciolek and Hwang where a majority (83% in their Table 17) of the patients in the billing data had orthopedic impairments. 9 For our patients with orthopedic impairments, the current risk-adjustment method has adequate predictive validity and works well. In addition, our risk-adjustment method appeared to work well for patients with neurologic impairments (n=3,025). Even so, the numbers of patients in the analyses with neurologic and other, non-orthopedic impairments should be increased for more powerful statistical analyses. We demonstrated that patients with neurological impairments perceived less FS change on average compared to patients with orthopedic impairments (Table 25), which is clinically logical and supports using impairment as a risk-adjustment variable. When impairment is a risk-adjustment variable, the payment algorithm can accommodate the differences in outcomes between the groups of patients with different impairments. In addition, it is recommended that a larger data set from different types of treatment facilities, i.e., skilled nursing facilities, where more patients with a larger variety of impairments are treated, particularly patients with neurological and more complex medical conditions, be collected and analyzed. The current results support the pay-for-performance process should be tested in a larger, more diversified by type of patient and type of treatment facility, demonstration project. We used a multivariate linear regression approach to test the validity of the predictive model that was used to develop the payment algorithm. We also analyzed the data using classification and regression trees techniques similar to what has been used for inpatient rehabilitation. 67,68 We did not report the findings from the classification and regression trees because the resultant graphical trees were not clinically useful and the power of the models were less than the power of the linear regression models. Future investigations should explore other statistical techniques that might produce more powerful and clinically useful models. Exploration of the risk-adjustment variables used to determine which independent variables to use in the regression models demonstrates that the variables of severity (quartile of the intake FS measures), symptom acuity, and age group were the strongest variables to use to analyze FS change. All the other variables including some of the new variables tested prospectively like fear-avoidance and the functional comborbidity index could be used to develop the regression model and the payment algorithm. However, the results suggest that additions of other risk-adjustment variables to the current model might not dramatically increase the percent variance controlled by the current regression model. In addition, inspection of the univariate analysis of the prospectively collected data demonstrates that we should split the patients 65 years old or older into more than one age
6/1/06 Pay-for-Performance Grant #18-P-93066/9-01 40 Focus On Therapeutic Outcomes, Inc.
group. As more data are collected for patients who are older, particularly the frail elderly, the patients older than 65 should be separated into more groups for improved risk-adjustment. Further, we need to explore other independent variables related to specific medical conditions for the purpose of improving risk adjustment. The FCI is of interest, and our results support further examination of the use of the FCI to risk-adjust FS change data. However, the FCI (i.e., the number of functional comorbidities) was not related (P>.05) to any variable studied except discharge somatization (r=.30, P=.009). Of interest, the FCI was not related to patient age or change in FS change. FCI tended to be related to the patient’s global rating of change (r=-.14), the therapist’s global rating of change (r=-.14), the patient’s rating of pain at discharge (r=.21), the patient’s perception of their intake functional status (r=-.19) and the patient’s perception of their discharge functional status (r=-.19), but none of these correlations was strong and none was significant (P>.05). Now that the FCI is mandatory in the FOTO database, studies are currently underway to explore the advantage of the Groll et. al. functional comorbidity index 19 related to FS change. Therefore, the risk-adjustment regression model studied proved to have adequate power but would benefit from further refinement. In addition to the risk-adjustment variables described above, other variables should be examined, like cognitive abilities, language spoken, use of a proxy, caregiver assistance, and patient residence. In this project, we simulated payment by using an average payment for outpatient therapy per visit from 2002 Medicare Part B billing data, but real billing data would be preferred. In future projects, functional status measures and number of treatment visits data should be merged with the claims data to facilitate for more accurate analyses of payment related to effectiveness and number of treatment visits. We made the decision that improvement in functional status is a valuable outcome for patients receiving outpatient physical and occupational therapy services conducted by physical or occupational therapists. This outcome measure appears logical for the majority of these patients, but other outcomes measures of other constructs should be explored that are pertinent to specific patients. For example, self-efficacy may be a valuable construct to assist in our risk-adjustment processes, and a change in self-efficacy might be a valuable outcomes measure in and of itself (or combined with other measures) for some patients, 16,50 although there is debate concerning the validity of a self-efficacy measure as a clinical outcome. Because fear of falling is of importance in older patients, measures related to falling or balance may be of importance. Fatigue is of concern to older patients of many diagnoses, so measures of fatigue might be of interest. However, if measures of a variety of constructs are used, the pay-for-performance process becomes dramatically more complicated mathematically. In this study, we were able to mathematically link measures of FS generated using paper and pencil surveys, computer administered surveys and computer adaptive testing (CAT) methods using Item Response Theory (IRT) mathematics. IRT mathematics and CAT methods have been touted as the future of collecting and analyzing health related quality of life and functional status measures. 55,59 Without the benefits of IRT mathematics, it would have been difficult to append data from all years of study. The benefits of IRT and CAT are worthy of exploration for future pay-for-performance payment processes because the

6/1/06 Pay-for-Performance Grant #18-P-93066/9-01 41 Focus On Therapeutic Outcomes, Inc.
mathematical techniques 1) improve the development of the outcomes measures used compared to employing traditional scale development techniques, 21,64,71 2) improve the responsiveness of the outcomes measures, which is important if used for a payment process based on clinical improvement, 48 3) reduce the data collection burden of providers and patients, which is important particularly for older or more medically complicated patients who are likely to be affected by fatigue, 28,30,31 4) may be the only techniques that can link outcomes measures from different outcomes instruments, or at least allow different outcomes measures to be placed on similar metrics, like our 0 to 100 scale or any other linear transformation, that will facilitate comparison of clinical change between different measures, 41,49 and 5) will facilitate continued future improvement of the outcomes measures without dramatic changes related to scientific/mathematic improvements in the measures per construct using IRT methods 64 or related to future public policy where IRT methods and CAT methods will allow changes in the system without opening the debate to public scrutiny. Without IRT methods and CAT methods, future outcomes measurement systems will continue to be fragmented, and interpretation or use of the outcomes measures will be dramatically hampered, making applicability to a pay-for-performance process unlikely. We believe the use of IRT and CAT methods are a necessary precursor to implementing a pay-for-performance payment method in outpatient rehabilitation. Our results support such a value-based purchasing process based on a large, risk-adjusted database and outcomes measures developed using IRT and CAT methods has merit, which supports progressing to a larger, more diverse demonstration project.
6/1/06 Pay-for-Performance Grant #18-P-93066/9-01 42 Focus On Therapeutic Outcomes, Inc.
Purpose 7: To develop guidelines for intermediaries and carriers and Medicare Advantage plans for the purpose of managing providers who use the pay-for-performance process. Methods. Previous methods and results were used to accomplish purpose 7. Results. Use of measures of effectiveness and visits facilitates development of guidelines for professionals monitoring patients receiving Medicare Part B benefits and their providers, i.e., intermediaries and carriers and Medicare Advantage plans, which we will operationally define collectively as payers. Using the measures studied in this project, the following guidelines in communication between providers and payers are proposed. The purpose of the guidelines is to reach a justifiable decision concerning the need for additional outpatient physical and occupational therapy treatments. First, providers must collect data on outcomes and treatment visits in order to make objective management decisions. Without measures, any system becomes subjective, which renders discussions designed to make patient care decisions between payers and providers almost useless. Second, outcomes measures must have published psychometrics of reliability, validity and responsiveness to be used in the discussions. Third, the measures must be able to be compared between providers, clinics, and geographical locations in mathematically logical ways. Fourth, the outcomes measures and treatment visits must be risk-adjusted, which facilitates meaningful interpretations based on patient case-mix. Fifth, since the measures of outcomes and treatment visits are risk-adjusted, predicted effectiveness and number of treatment visits per risk-adjusted group of patients should be available to the clinician and payer at initial evaluation. The clinician can use the predicted outcomes and number of visits expected for that specific patient to plan the management of the patient. Sixth, the measure of effectiveness and number of treatment visits used should be tracked throughout treatment, so clinicians can see how their patient is doing compared to a dataset of comparable risk-adjusted patient. Communications with the payer should be initiated if a problem meeting the predicted effectiveness and number of treatment visits is anticipated. Seventh, if the clinician believes the patient will require treatment beyond the predicted number of visits, the clinician should send a report of the patient’s progress including comparisons of the outcomes measured over the treatment episode to date to the payer. The payer then makes a decision concerning whether the additional treatment visits should be authorized. The decision should be based in part on the patient’s measured improvement in the risk-adjusted outcomes measured. If there are data supporting continued improvement, then the payer, provider and patient can interpret these data to mean the patient has not gained completely from the treatment and may
6/1/06 Pay-for-Performance Grant #18-P-93066/9-01 43 Focus On Therapeutic Outcomes, Inc.
warrant more visits. If there are data supporting no or little improvement in the outcomes measured, the payer, provider and patient can interpret these data to mean the treatment should be changed or the patient may have achieved maximal improvement with the current treatment, which may not support continued treatment. If there were data supporting the patient is getting worse given the measures taken, such data support changing or terminating treatment. Eighth, if the clinician, patient or payer do not agree with the management decisions, the payer should request more data to support a claim for a change, continuation or termination of the current plan of care.

6/1/06 Pay-for-Performance Grant #18-P-93066/9-01 44 Focus On Therapeutic Outcomes, Inc.
IV. Qualitative Assessment In an effort to learn from the providers and patients who collected the prospective data and other stakeholders who may be affected by a pay-for-performance method in outpatient physical and occupational therapy, we initiated two procedures. First, subjective information was collected from patients, clinicians, support staff and managers at each clinic that collected prospective data during the entire prospective data collection method. Each clinic maintained a file of concerns, comments and constructive thoughts on the method. The purposes of this data collection were to identify the logistical and subjective problems and concerns associated with implementing a pay-for-performance process. Second, we contacted the three therapy associations (American Physical Therapy Association, American Occupational Therapy Association, and American Speech-Language Hearing Association) to inform them of the project and provided a brief update of the project during the winter of 2006. Each association has agreed to provide feedback when deemed appropriate by CMS. The information might be helpful if a pay-for-performance process is implemented, particularly for improved use of outcomes data, better compliance and data completion rates. The following are comments from the participating clinics. Subjective Assessment. Comments concerning issues related to implementation of the prospective data collection process were solicited from the two participating hospitals. Both hospitals were instructed to collect concerns related to the project during the data collection process and develop a report describing the concerns and solutions at the end of the data collection process. In January 2006, management at Presbyterian Health Services and CentraState Healthcare System developed reports. It should be noted that although the following comments were made by staff and management, some of the comments represent hypotheses that could be tested but do not represent conclusions supported by data. Staffing, Scheduling and Data Entry. Several therapists voiced concerns regarding the quantity of clerical help and their skills. The number of clerical personnel in the department needs to be sufficient to cover the added administrative obligations of the data collection process, and all clerical staff need to be trained sufficiently in the data collection process. The staff must have the skills to enter all patients on the computer, monitor both patients and therapists and inform the therapist when status and discharge reports are due. Burden on the clerical and clinical staff could be reduced if the process of scheduling the data collection steps were automated. Scheduling data entry was at times difficult. The following are examples.
6/1/06 Pay-for-Performance Grant #18-P-93066/9-01 45 Focus On Therapeutic Outcomes, Inc.
Setting up new patients on FOTO during lunchtime hours was reported as difficult due to decreased staffing in the rehab area during lunch. Getting new patients who arrive late for their therapy appointments to complete FOTO was difficult. At times the staff inputting the initial data on the patient did not fully understand the patient’s medical problem. Input from therapists after they had examined the patient would improve the data accuracy. Better documentation on patient’s files to indicate when a status report is due would be helpful. For example, at times, different therapists treat the same patient when covering for the other therapist. If the primary therapist does not indicate that a status or discharge survey is due, the report may not get completed. A standardized procedure or set of instructions given to the patient prior to completing the surveys was considered important. Although standardized instructions were provided before the data collection started, variations in actual delivery of the instructions was observed. For example, some staff/therapists just gave the light pen to the patient and told the patient to complete the survey but provided no further explanation. Other staff/therapists explained the protocol describing the purpose of the surveys, reassuring the patient regarding questions that might not apply to them, and providing the option to ask questions if any survey question was confusing. The staff also wanted more specific patient instructions concerning optional surveys such as the fear-avoidance behavior questionnaire, which contained questions that were interpreted as containing double negatives, which may confuse the patient. Staff reported that many patients stated they did not want to be bothered with any more paperwork. Their expectation was that they had filled out medical history and answered a myriad of questions before going to therapy, and now it is time to see the therapist. The staff recommended that the therapist explain that the surveys are an integral part of their evaluation and treatment. Scripting for admitting staff to set expectations that the staff will be asking the patient to complete a very important survey on the computer is very important. Staff also recommended any paperwork that could be sent to the patient ahead of time, should be sent ahead of time. Presbyterian Healthcare Services is testing how many patients actually bring completed paperwork with them to their intake evaluation. Another recommendation was to eliminate the written medical history form and use the FOTO medical history module. Patient Interaction and Survey Responses. Staff noted that many patients, especially retirees from geographical areas noted for their scientific businesses (i.e., Sandia Lab or Los Alamos Labs, New Mexico), voiced appreciation that the clinic was taking the time to measure quality and improve clinical processes based on that data. These patients appreciated the image of data driven quality care. When elderly patients declined to participate in the survey, they often stated they did not want to help Medicare take away or decrease their benefits. Even with detailed explanation of the study
6/1/06 Pay-for-Performance Grant #18-P-93066/9-01 46 Focus On Therapeutic Outcomes, Inc.
purpose, some patients perceived they would be contributing to a negative impact on their benefits. Management felt that this would not be an issue if pay-for-performance were mandated because the staff can demonstrate that a pay-for-performance process actually encourages provider quality improvement and does not impact the patient’s benefits. Staff at Presbyterian voiced that in the southwest, there may be a regional suspicion and mistrust of the Federal government. For example, one patient stated: “I’m not going to help the “Feds” with anything!” Staff at Presbyterian also asked if there were differences between the southwest and mid-Atlantic in the proportion of Native American or Hispanic people, in the level of education, in level of reliance on public assistance or supplemental insurance. However, staff stated that once a pay-for-performance process is up and running, the staff can demonstrate to the patient the benefits of assessing quality care based on measurable data rather than an imposition by the “Feds”. Several patients had never used a computer, and some were reluctant to use the computer. Even with assistance to start and encouragement to use the computer, some patients were too intimidated to continue. The staff discussed various adaptations to ease the use of the computer, such as the use of a light pen or a touch screen. The light pen was helpful except for patients with tremors, which made the pen difficult to control. Some patients with shoulder dysfunction had difficulty utilizing the light pen secondary to pain provoked by lifting the weight of the arm. Lack of control of the light pen increased the chance of incorrect data entry, such as skipping a response or answering a question before the patient read the question. Clerical help to help patients use the light pen was rarely available. The staff found a computer touch screen very helpful, especially for neurological patients and patients unfamiliar with a computer. Another solution might be to have patients complete paper surveys or have proxies complete the surveys on the computer. Given a busy clinic, paper surveys appeared more practical. Staff at Presbyterian also perceived socioeconomic differences between New Jersey (Presbyterian staff assumed CentraState patients were more skilled at using a computer and answering questions) compared to New Mexico (Presbyterian staff assumed Presbyterian patients were less skilled at using a computer and answering questions), which might have negatively influenced the elderly population in New Mexico who might not have been exposed to computers or comfortable answering questions. On occasion, staff observed patients marking the same answer for a series of questions. Patients appeared to assume that subsequent questions and answers were similar to preceding questions and answers, especially for patient satisfaction, fear-avoidance, depression and somatization surveys. Even though the word color changed from red for one question to blue for the new question, some patients appeared to not read the entire question. The patient then answered the questions exactly the same, assuming the next question was still the previous question, which created confusion. Staff recommended that for questions with similar answers, change in the background screen color, location of the question on the screen, font size of the words or bold parts of the question could be changed on every other screen to improve recognition that a new question was being asked.
6/1/06 Pay-for-Performance Grant #18-P-93066/9-01 47 Focus On Therapeutic Outcomes, Inc.
Staff noticed that on occasion there was confusion regarding which functional question applied to which extremity. The staff noted this occurred more commonly with patients with upper extremity impairments. For example, when the patient saw the item, “How much difficulty do you have using your affected arm to reach an overhead shelf?”, even though the item refers to their “affected arm” and the patient has been told to “Answer the question regarding the reason why you are being treated today”, staff still noticed patients with an injured left arm say “yes I can reach overhead using my right arm.” The staff recommended that FOTO continuously examine how each question is worded and presented. Staff also recommended that the patient should repeat the question back to staff, so the staff does not assume a nod from the patient means the patient understands the question. However, it was rare that the staff were with the patient while they answered the questions. Staff noted that patients, on occasion when they were reading the questions, were not clear with their responses because they were unable to differentiate the reason for their impairment related to a specific functional question. For example, a patient being treated for a knee impairment might indicate that “going up/down a flight of stairs” is “extremely difficult” because of an impairment not related to their knee. This could affect the measure of function related to the knee. Current and future questions should be examined closely for their ability to measure the targeted construct, and future pay-for-performance processes should be monitored closely for the impact of lack of validity of the measures used for the construct of interest. Identifying patients who were not appropriate candidates for the surveys before they attempted the surveys was difficult, especially if the patient had a cognitive impairment. Cognitive impairments are a concern particularly for patients with neurological problems (i.e., CVA). Some staff recommended using the mini mental state examination to pre-screen patients, while other therapists recommended using a practical stopping point, i.e., the patient was unable to successfully complete the survey in a timely manner (20 minutes), while other therapists recommended using observations of an obvious manual difficulty using computer to exclude the patient from participating. Other areas of limitations, such as problems with motor control, eyesight, cognition, and language barriers, at times prevented completion of surveys. These patients will need to have proxies complete their surveys, but a way of identifying these patients before they start the surveys still needs to be developed and tested. Use of a proxy was discussed. Staff recommended that a standard procedure for identifying when a proxy could or should be used should be established. For example, if a proxy is used to complete the intake survey, the same proxy must complete the status surveys, which the staff thought would improve reliability and validity of the proxy data. Some therapists recommended that if a proxy completed the surveys, it would be better for the proxy to attend therapy sessions and become involved in the patient education process, but other therapists disagreed. Staff voiced the concern that some patients were intimidated by the wording of the detailed consent form. The staff assumed that for those patients, reading the “fine print” made them nervous, which might have affected the patient’s interpretation of the actual intent of the project and might have affected the patient’s responses to the items or possibly their response to

6/1/06 Pay-for-Performance Grant #18-P-93066/9-01 48 Focus On Therapeutic Outcomes, Inc.
treatment. Although the consent content was prescribed by each hospital’s IRB, and each hospital tried to make the wording as user friendly as possible (i.e., summary with talking points), some patients just got intimidated and refused to participate. The staff realized that once a pay-for-performance process is in place, the consent form would not be an issue. Equipment. The staff felt that available computer equipment with light pen or touch screen capability would be essential to use FOTO on a daily basis. Staff also reported that a mechanism must be in place to upgrade computer technology every 2-3 years. The staff recommended that identification of reliable vendors for light pens and touch screens would be helpful. Compatibility of the most current light pens and touch screens may not work with software upgrades. Staff requested more technical support during software upgrades. Some software upgrades were associated with new application problems that resulted in the program being down and delay in data entry. Global Implementation. Staff expressed concerns about the lack of adequate sample sizes for functional status risk adjustment for many patients with neurological impairments, lymphadema, pediatric impairments, wounds, and impairments associated with complicated surgical intervention, which might affect future pay-for-performance decisions. Staff also voiced concern that the current measure of functional status may not be appropriate for certain patients, like patients with a CVA who have very limited functional status. Therapists recommended an arbitration process based on data be developed that could be used when the FOTO goals for effectiveness and visits appear inappropriate for a specific patient. Therapists recommended use of other validated outcome tools, such as global rating of change to determine pay-for-performance decisions when the patient presented an exception to the present pay-for-performance algorithm. Staff concluded that a pay-for-performance system could not be developed for every patient, and therefore exceptions will occur. Therefore, an arbitration process would be helpful to benefit individual circumstances. The percent of patients therapists believe would require arbitration was estimated as 20%. Concerns about cheating were raised where a front desk manager or therapist could complete the survey for the patient for the purpose of being paid more. Staff recommended that a mechanism must be in place (perhaps statistically) to monitor data entry for the purpose of identifying unusual outcome patterns that might reflect cheating. Staff voiced concern that some clinics may deny care to more disabled patients, especially patients who have had a stroke or may have multiple sclerosis and who are wheelchair bound, because these patients may not attain predicted risk-adjusted outcome over predicted treatment visits. Staff recommended that the system must be checked for predictive validity for all patients,

6/1/06 Pay-for-Performance Grant #18-P-93066/9-01 49 Focus On Therapeutic Outcomes, Inc.
but particular emphasis should be placed on patients with more complicated impairments and associated comorbidities. Any type of a priori “cherry picking” needs to be prevented. Specific Issues. Management of Presbyterian Healthcare Services stated that the pay-for-performance feasibility study figured prominently in their 2005 site visit for the National Malcolm Baldrige Award. Participation in a cutting-edge pay-for-performance research study that emphasized many of the Institute of Medicine’s (2001) aims for a better future health care delivery system demonstrated to informed consumers that Presbyterian was serious about national excellence and quality based on functional outcomes. Concluding Note. Many of the above comments from the staff of the participating clinics are worthy of future study. Some areas have already been examined, i.e., use of the mini mental state examination and functional status item validity. We thank the staff for their unbiased comments. V. Summary of the Pay-for-Performance Feasibility Study We have implemented a pay-for-performance simulation using retrospectively collected data and tested the feasibility of implementing a value purchasing payment algorithm prospectively in outpatient physical and occupational therapy. The data demonstrated that a pay-for-performance process that aligns financial incentives with achievement of better patient outcomes in an efficient manner could be successfully designed and implemented. Further simulation demonstrated that implementation of a pay-for-performance method may be beneficial in modifying provider behavior because the provider would strive to produce better outcomes in a more efficient manner. The results support that, by implementing a risk-adjusted pay-for-performance process in outpatient physical and occupational therapy, we can move closer to the Institute of Medicine’s vision of the future health care delivery system that is effective, patient-centered, timely, efficient and equitable. Because the pay-for-performance method described is not provider or treatment specific, the process should encourage clinicians to practice evidence-based practice and develop best practices designed to produce better patient functional status outcomes. Using the selected outcomes measure of change in functional status and number of treatment visits, the data can be used to develop guidelines for payers designed to assist in the management of providers and patients. The pay-for-performance method demonstrated presents an alternative payment method worthy of consideration, possibly as a replacement of the therapy caps or to assist in the therapy caps exceptions process.

6/1/06 Pay-for-Performance Grant #18-P-93066/9-01 50 Focus On Therapeutic Outcomes, Inc.
References 1. American Medical Association. Guidelines for Pay-for-Performance Programs. 2005. Report
accessed 11/8/05. http://www.cms.hhs.gov/faca/ppac/030705ama_guidelines.pdf 2. Andrich D. A rating formulation for ordered response categories. Psychometrika 1978;
43(4):561-573. 3. Becker C. Right on the money: CMS awarding pay-for-performance bonuses. Modern
Healthcare. November 14, 2005. Available at: http://www.modernhealthcare.com/storyPreview.cms?articleId=37637&archive=Y Accessed March 16, 2006.
4. Bothe A. Medicare physician payment update. Legislation physician pay-for-performance, testimony on behalf of the Association of American Medical Colleges before the Practicing Physicians Advisory Council, Centers for Medicare and Medicaid Services. May 23, 2005. Available at: http://www.aamc.org/advocacy/library/teachphys/phys0023.htm Accessed March 16, 2006.
5. Centers for Medicare and Medicaid Services. Medicare Takes Key Step Toward Voluntary Quality Reporting For Physicians. 2005. Report accessed 11/8/05. http://www.cms.hhs.gov/media/press/release.asp?Counter=1699
6. Centers for Medicare and Medicaid Services. Nursing Home Pay for Performance Demonstration Initiative. 2005. Report accessed 11/8/05. http://www.cms.hhs.gov/researchers/demos/nhp4p/default.asp
7. Centers for Medicare and Medicaid Services. Medicare “Pay for Performance (P4P)” Initiatives. 2005. Report accessed 11/8/05. http://www.cms.hhs.gov/media/press/release.asp?Counter=1343
8. Childs JD, Fritz JM, Flynn TW, et al. A clinical prediction rule to identify patients with low back pain most likely to benefit from spinal manipulations: a validation study. Ann Int Med 2004;141(12):920-928.
9. Ciolek DE, Hwang W. Development of a Model Episode-Based Payment System for Outpatient Therapy Services. Outpatient Rehabilitation Services Payment System Evaluation Contract. Final Project Report. November 2004. Centers for Medicare and Medicaid Services Contract No. 500-99-0009/0009. Report accessed 11/1/05 http://www.cms.hhs.gov/providers/therapy/projectrpt111504.pdf
10. Cohen J. Statistical Power Analysis for the Behavioral Sciences. 2nd edition. Hillsdale, NJ: Lawrence Erlbaum Associates. 1988.
11. Derogatis LR. Symptoms Checklist-90. Administration, Scoring and Procedures Manual for the Revised Version. Baltimore, MD: Clinical Psychometric Research, 1977.
12. Deverich M. Pay for performance’s small steps of progress. PricewaterhouseCoopers. 2004. Report accessed 11/8/05. http://healthcare.pwc.com/cgi-local/hcregister.cgi?link=pdf/p4p.pdf
13. Dobrzykowski EA, Nance T. The Focus On Therapeutic Outcomes (FOTO) Outpatient Orthopedic Rehabilitation Database: Results of 1994-1996. J Rehabil Outcome Meas 1997; 1(1):56-60.
14. Fritz JM, Delitto A, Erhard RE. Comparison of a classification based approach to physical therapy and therapy based on AHCPR clinical practice guidelines for patients with acute low back pain: a randomized clinical trial. Spine 2003;28(13):1363-1371.
6/1/06 Pay-for-Performance Grant #18-P-93066/9-01 51 Focus On Therapeutic Outcomes, Inc.
15. Galvin RS. Evaluating the performance of pay for performance. Med Care Res Rev. 2006;63:126S-130S. Available at: http://mcr.sagepub.com/cgi/reprint/63/1_suppl/126S Accessed March 16, 2006.
16. George SZ, Fritz JM, McNeil DW. Fear-avoidance beliefs as measured by the fear-avoidance beliefs questionnaire: change in fear-avoidance beliefs questionnaire is predictive of change in self-report of disability and pain intensity for patient with acute low back pain. Clin J Pain 2006; 22(2):197-203, 2006.
17. Goldfield N, Burford R, Averill R, Boissonnault B, Kelly W, Kravis T, Smithline N. Pay for performance: an excellent idea that simply needs implementation. Qual Man Health Care 2005; 14(1):31-44.
18. Government Accountability Office. Report to Congressional Committees. Medicare. Little Progress Made in Targeting Outpatient Therapy Payments to Beneficiaries’ Needs. GAO-06-59. 2005. Report accessed 11/29/05. http://www.gao.gov/new.items/d0659.pdf.
19. Groll DL, To T, Bombardier C, Wright JG. The development of a comorbidity index with physical function as the outcome. J Clin Epidemiol 2005; 58:595-602.
20. Guccione AA, Mielenz TJ, DeVellis RF, et al. Development and testing of a self-report instrument to measure actions: Outpatient Physical Therapy Improvement in Movement Assessment Log (OPTIMAL). Phys Ther 2005; 85(6):515-530.
21. Haley SM, Coster WJ, Andres PL, Kosinski M, Ni P. Score comparability of short forms and computerized adaptive testing: simulation study with the activity measure for post-acute care. Arch Phys Med Rehabil 2004; 85(4):661-666.
22. Hambleton RK. Emergence of item response modeling in instrument development and data analysis. Med Care 2000; 38(Suppl II):II-60-II-65.
23. Hanley JA, McNeil BJ. The meaning and use of the area under a receiver operating characteristic (ROC) curve. Radiology 1982; 143:26-36.
24. Hart AC, Hopkins CA (eds). ICD-9-CM Expert for Physicians Volumes 1 & 2. 9th Revision, 6th Edition, Reston, VA: Ingenix (St. Anthony Publishing/Medicode). 2003.
25. Hart DL. Assessment of unidimensionality of physical functioning in patients receiving therapy in acute, orthopedic outpatient centers. J Outcome Meas 2000; 4(1):413-430.
26. Hart DL. Test-retest reliability of an abbreviated self-report overall health status measure. J Orthop Sports Phys Ther 2003; 33(12):734-742.
27. Hart DL. The power of outcomes: FOTO Industrial Outcomes Tool – Initial assessment. Work 2001; 16:39-51.
28. Hart DL, Cook KF, Mioduski JE, Teal CR, Crane PK. Simulated computerized adaptive test for patients with shoulder impairments was efficient and produced valid measures of function. J Clin Epidemiol, in press 2006.
29. Hart DL, Mioduski JE. CAT Development and Testing Software User’s Guide. Knoxville, TN: FOTO, Inc., 2004.
30. Hart DL, Mioduski JE, Stratford PW. Simulated computerized adaptive tests for measuring functional status were efficient with good discriminant validity in patients with hip, knee, or foot/ankle impairments. J Clin Epidemiol 2005; 58(6):629-638.
31. Hart DL, Mioduski JE, Werneke MW, Stratford PW. Simulated computerized adaptive tests for patients with lumbar spine impairments were efficient and produced valid measures of function. J Clin Epidemiol, 2006 in press.
32. Hart DL, Wright BD. Development of an index of physical functional health status. Arch Phys Med Rehabil 2002; 83(5):655-665.

6/1/06 Pay-for-Performance Grant #18-P-93066/9-01 52 Focus On Therapeutic Outcomes, Inc.
33. Health Care Financing Administration. Medicare and Medicaid programs; mandatory use, collection, encoding, and transmission of Outcome and Assessment Information Set (OASIS) for home health agencies. Fed Register 1999;64(117):32984-32991.
34. Hwang W, Ireys HT, Anderson GF. Comparison of risk adjusters for Medicaid-enrolled children with and without chronic health conditions. Ambul Ped 2001; 1(4):217-224.
35. Iezzoni LI. Dimensions of risk. In Iezzoni LI (ed.). Risk Adjustment for Measuring Health Care Outcomes. Ann Arbor, MI: Health Administration Press. 29-118, 1994.
36. Institute of Medicine. Crossing the Quality Chasm. A New Health System for the 21st Century. Washington, DC: National Academy Press. 2001.
37. Jaeschke R, Singer J, Guyatt GH. Measurement of health status: ascertaining the minimal clinically important difference. Control Clin Trials 1989; 10:407-415.
38. Jensen MP, Karoly P, Braver S. The measurement of clinical pain intensity: a comparison of six methods. Pain 1986; 27:117-126.
39. Jette AM. Using health-related quality of life measures in physical therapy outcomes research. Phys Ther 1993; 73(8):528-537.
40. Jette AM, Delitto A. Physical therapy treatment choices for musculoskeletal impairments. Phys Ther 1997; 77(2):145-154.
41. Jette AM, Haley SM, Ni P. Comparison of functional status tools used in post-acute care. Health Care Fin Rev 2003; 24(3):13-24.
42. Jette DU, Jette AM. Physical therapy and health outcomes in patients with knee impairments. Phys Ther 1996; 76(11):1178-1187.
43. Jette DU, Jette AM. Physical therapy and health outcomes in patients with spinal impairments. Phys Ther 1996; 76(9):930-945.
44. Jette DU, Jette AM. Professional uncertainty and treatment choices by physical therapists. Arch Phys Med Rehabil 1997; 78:1346-1351.
45. Jewell DV, Riddle DL. Interventions that increase or decrease the likelihood of a meaningful improvement in physical health in patients with sciatica. Phys Ther 2005; 85(11):1139-1150.
46. Johnson M, Holthaus D, Harvell J, Coleman E, Eilertsen T, Kramer A. Medicare Post-Acute Care: Quality Measurement Final Report. US Department of Health and Human Services. University of Colorado Health Sciences Center. 3/29/01. Report accessed 11/8/05. http://aspe.hhs.gov/daltcp/reports/mpacqm.htm
47. Kirshner B, Guyatt G. A methodological framework for assessing health indices. J Chron Dis 1985; 38(1):27-36.
48. Kosinski M, Bjorner JB, Ware JE, Batenhorst A, Cady RK. The responsiveness of headache impact scales scored using ‘classical’ and ‘modern’ psychometric methods: A re-analysis of three clinical trials. Qual Life Res 2003; 12(8):903-912.
49. Lord FM. Applications of Item Response Theory To Practical Testing Problems. Hillsdale, NJ: Lawrence Erlbaum; 1980.
50. Lorig KR, Ritter P, Stewart AL, Sobel DS, Brown BW, Bandura A, Gonzalez VM, Laurent DD, Holman HR. Chronic disease self-management program. 2-year health status and health care utilization outcomes. Med Care 2001; 39(11):1217-1223.
51. MedPAC. Report to Congress. Medicare Payment Policy. March 2006. Report accessed 3/31/06. http://www.medpac.gov/publications/congressional_reports/Mar06_TOC.pdf.
52. MedPAC urges congress to move on pay for performance. Medical Health 2005; 59(9):1-3.
6/1/06 Pay-for-Performance Grant #18-P-93066/9-01 53 Focus On Therapeutic Outcomes, Inc.
53. MedPAC. Variation and Innovation in Medicare. Report to the Congress. 2003. Report accessed 11/1/05 http://www.medpac.gov/publications/congressional_reports/June03_Entire_Report.pdf
54. Miller ME. Pay for performance in medicine. Testimony before Senate Committee on Finance. July 27, 2005. Report accessed 11/2/05 http://www.medpac.gov/publications/congressional_testimony/Testimony_P4P.pdf
55. Mills CN, Potenza MT, Fremer JJ, Ward WC, Eds. Computer-Based Testing. Building the Foundation for Future Assessments. Mahwah, NJ: Lawrence Erlbaum. 2002.
56. National Quality Forum. Pay-for-Performance Programs: Guiding Principles and Design Strategies. October 2005.
57. National Quality Measures Clearinghouse.TM Report accessed 11/10/05. http://www.qualitymeasures.ahrq.gov/
58. Olshin J, Ciolek D, Hwang W. Study and Report on Outpatient Therapy Utilization: Physical Therapy, Occupational Therapy, and Speech-Language Pathology Services billed to Medicare Part B in all Settings in 1998, 1999, and 2000. September 2002. Centers for Medicare and Medicaid Services Contract No. 500-99-0009/0002. Report accessed 11/1/05 http://www.cms.hhs.gov/providers/therapy/finalrpt.pdf
59. Patrick DL, Chiang Y. Convening health outcomes methodologists. Med Care 2000; 38(9, Suppl II):II-3-II-6.
60. Pay-for-performance tops experts’ list to control health care costs. Medical Health 2005; 59(17):4-5.
61. Portney LG, Watkins MP. Foundations of Clinical Research. Applications to Practice. Upper Saddle River, NJ: Prentice Hall Health, 2000.
62. Resnik L, Hart DL. Using clinical outcomes to identify expert physical therapists. Phys Ther 2003; 83(11):990-1002.
63. Rosenthal MB, Frank RG, Li Z, Epstein AM. Early experience with pay-for-performance. From concept to practice. JAMA 2005;294(14):1788-1793.
64. Sands WA, Waters BK, McBride JR (editors). Computerized Adaptive Testing. From Inquiry To Operation. Washington, DC: American Psychological Association. 1997.
65. Shwartz M, Ash AS. Evaluating the performance of risk-adjustment methods: continuous measures. In Iezzoni LI (ed). Risk Adjustment for Measuring Health Care Outcomes. Ann Arbor, MI: Health Administration Press. 287-311, 1994.
66. Stineman MG. Prospective payment, prospective challenge. Arch Phys Med Rehabil 2002;83(12):1802-1805.
67. Stineman MG, Goin JE, Tassoni CJ, Granger CV, Williams SV. Classifying rehabilitation inpatients by expected functional gain. Med Care 1997; 35(9):963-973.
68. Stineman MG, Granger CV. A modular case-mix classification system for medical rehabilitation illustrated. Health Care Fin Rev 1997; 19(1):87-103.
69. Stratford PW, Riddle DL. Assessing sensitivity to change: choosing the appropriate change coefficient. Health Qual Life Outcomes 2005; 3(1):23.
70. U.S. Department of Health and Human Services, Centers for Medicare and Medicaid Services. Inpatient Rehabilitation Facility PPS. http://www.cms.hhs.gov/InpatientRehabFacPPS/01_Overview.asp#TopOfPage Report accessed 5/1/06
71. van der Linden W, Hambleton RK, (editors). Handbook of Modern Item Response Theory. New York, NY: Springer-Verlang. 1997.

6/1/06 Pay-for-Performance Grant #18-P-93066/9-01 54 Focus On Therapeutic Outcomes, Inc.
72. Waddell G, Newton M, Henderson I, Somerville D, Main CJ. A Fear-Avoidance Beliefs Questionnaire (FABQ) and the role of fear-avoidance beliefs in chronic low-back pain and disability. Pain 1993; 52:157-68.
73. Wainer H (ed.). Computerized Adaptive Testing. A Primer. Second Edition. Mahway, NJ: Lawrence Erlbaum Associates. 2000.
74. Ware JE, Kosinski M, Bjorner JB, et al. Applications of computerized adaptive testing (CAT) to the assessment of headache impact. Qual Life Res 2003; 12(8):935-952.
75. Ware JE, Sherbourne CD. The MOS 36-item short-form health survey (SF-36), I: conceptual framework and item selection. Med Care 1992; 30(6):473-483.
76. Werneke M, Hart DL. Categorizing patients with occupational low back pain by use of the Quebec Task Force Classification System versus Pain Pattern Classification Procedures: discriminant and predictive validity. Phys Ther 2004;84(3):243-254.
77. Werneke M, Hart DL. Centralization phenomenon as a prognostic factor for chronic low back pain and disability. Spine 2001; 26(7):758-765.
78. World Health Organization. International Classification of Functioning, Disability and Health. Geneva: World Health Organization. 2001.
79. Zimmerman DR. Improving nursing home quality of care through outcomes data: the MDS quality indicators. Int J Geriatr Psychiatry 2003;18(3):250-257.
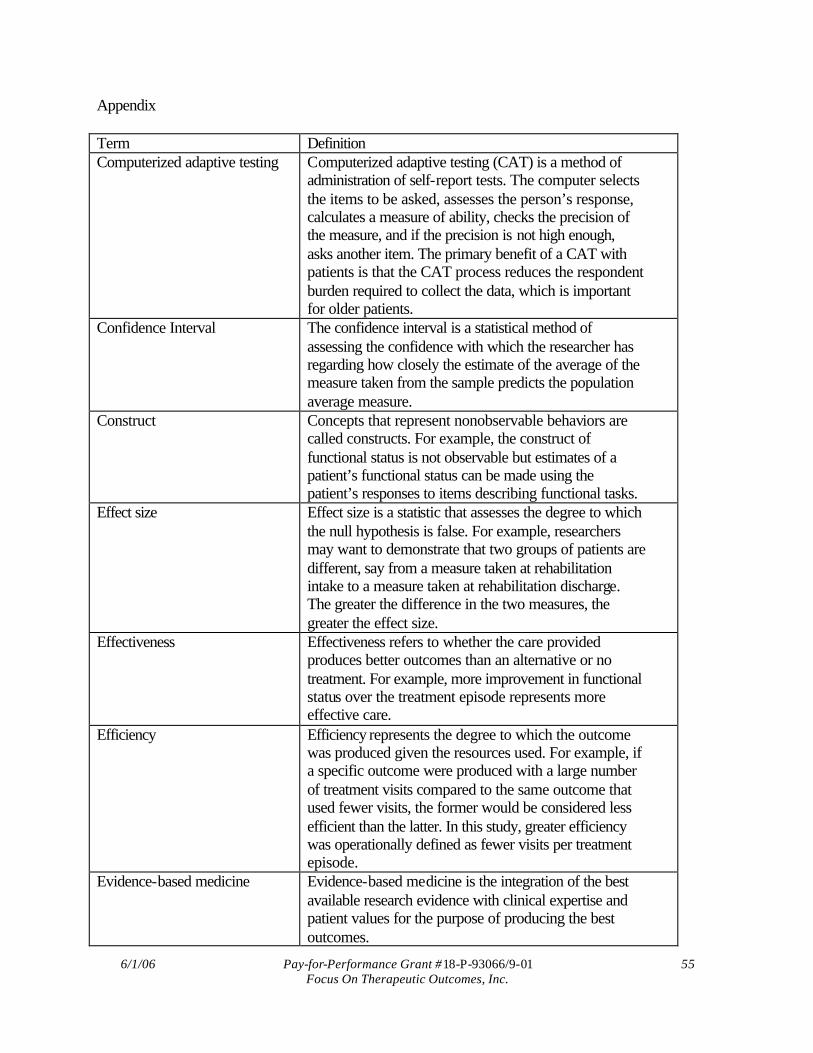
6/1/06 Pay-for-Performance Grant #18-P-93066/9-01 55 Focus On Therapeutic Outcomes, Inc.
Appendix Term Definition Computerized adaptive testing Computerized adaptive testing (CAT) is a method of
administration of self-report tests. The computer selects the items to be asked, assesses the person’s response, calculates a measure of ability, checks the precision of the measure, and if the precision is not high enough, asks another item. The primary benefit of a CAT with patients is that the CAT process reduces the respondent burden required to collect the data, which is important for older patients.
Confidence Interval The confidence interval is a statistical method of assessing the confidence with which the researcher has regarding how closely the estimate of the average of the measure taken from the sample predicts the population average measure.
Construct Concepts that represent nonobservable behaviors are called constructs. For example, the construct of functional status is not observable but estimates of a patient’s functional status can be made using the patient’s responses to items describing functional tasks.
Effect size Effect size is a statistic that assesses the degree to which the null hypothesis is false. For example, researchers may want to demonstrate that two groups of patients are different, say from a measure taken at rehabilitation intake to a measure taken at rehabilitation discharge. The greater the difference in the two measures, the greater the effect size.
Effectiveness Effectiveness refers to whether the care provided produces better outcomes than an alternative or no treatment. For example, more improvement in functional status over the treatment episode represents more effective care.
Efficiency Efficiency represents the degree to which the outcome was produced given the resources used. For example, if a specific outcome were produced with a large number of treatment visits compared to the same outcome that used fewer visits, the former would be considered less efficient than the latter. In this study, greater efficiency was operationally defined as fewer visits per treatment episode.
Evidence-based medicine Evidence-based medicine is the integration of the best available research evidence with clinical expertise and patient values for the purpose of producing the best outcomes.

6/1/06 Pay-for-Performance Grant #18-P-93066/9-01 56 Focus On Therapeutic Outcomes, Inc.
Functional status Functional status represents a person’s ability to execute a task or action. Functional status is a construct that cannot be directly measured but can be quantified using assessing the person’s response to functional items, i.e., tasks or actions.
Global rating of change Global rating of change is a measure that can be completed by patients and clinicians that assesses how much change the patient believes they experienced during their rehabilitation episode. The change is commonly used as an external comparison to which other measures of change can be compared.
Item Response Theory Methods
IRT comprises a set of mathematical models and associated statistical procedures that are used to estimate a person’s level of ability, like functional status.
Patient-centered Patient-centered is a term that represents the process of providing care to patients that is respectful of and responsive to individual patient preferences, needs, and values. The process ensures that patient values guide all clinical decisions. For example in rehabilitation, if the patient provides functional status information via self-report, and the provider uses that information to treat the patient to improve their functional status, the treatment process should represent a patient-centered approach to patient management.
Patient classification Patient classification refers to methods of grouping patients into homogeneous subgroups after which specific treatments can be directed to the appropriate group of patients. Patient classification systems improve assessment of outcomes for patients within a specific group and improves the ability to compare outcomes between different groups of patients.
Pay-for-performance (value-based purchasing)
Pay-for-performance or value-based purchasing, which are considered the same process, represent a method of reimbursement that is based on patient improvement. Under such a method, providers will be paid more if the patient’s outcomes are high.
Real data simulation Real data simulation represents a statistical method of testing a procedure, like a computerized adaptive test. For example, in a real data simulation, patients answer all items on the survey. Those answers are then analyzed using a CAT to produce estimates of the patient’s functional status. The real data simulation offers an excellent way of testing a new CAT before actually using the CAT on patients.
Responsiveness Responsiveness represents the ability of an outcomes instrument to measure the amount of change that

6/1/06 Pay-for-Performance Grant #18-P-93066/9-01 57 Focus On Therapeutic Outcomes, Inc.
occurred over the course of treatment. The larger the better.
Risk adjustment Risk adjustment is a statistical assessment that controls the effects of extraneous variables that might affect the dependent variable. Controlling for the effect of extraneous variables provides a more meaningful interpretation of the dependent variable. For example, it would be illogical to compare the functional status change between patients with acute symptoms compared to patients with chronic symptoms: patients with chronic symptoms are not expected to improve their functional status as much as patients with acute symptoms.
Self-report Self-report simply means the person answered items by himself or herself. Patient self-report of their functional ability represents the patient’s perception of their ability and integrates the relevance of the functional ability to the patient.
Standard Deviation Standard deviation is statistical method of assessing the variability of the data. If the data are more variable, the standard deviation will be larger.
Value Purchasing Payment Algorithm
A Value Purchasing Payment Algorithm is a method of grouping patients according to some predetermined rules, for example the amount of treatment effectiveness and number of treatment visits. The algorithm is used to assign payment to the provider according to the classification of the patient using the algorithm.
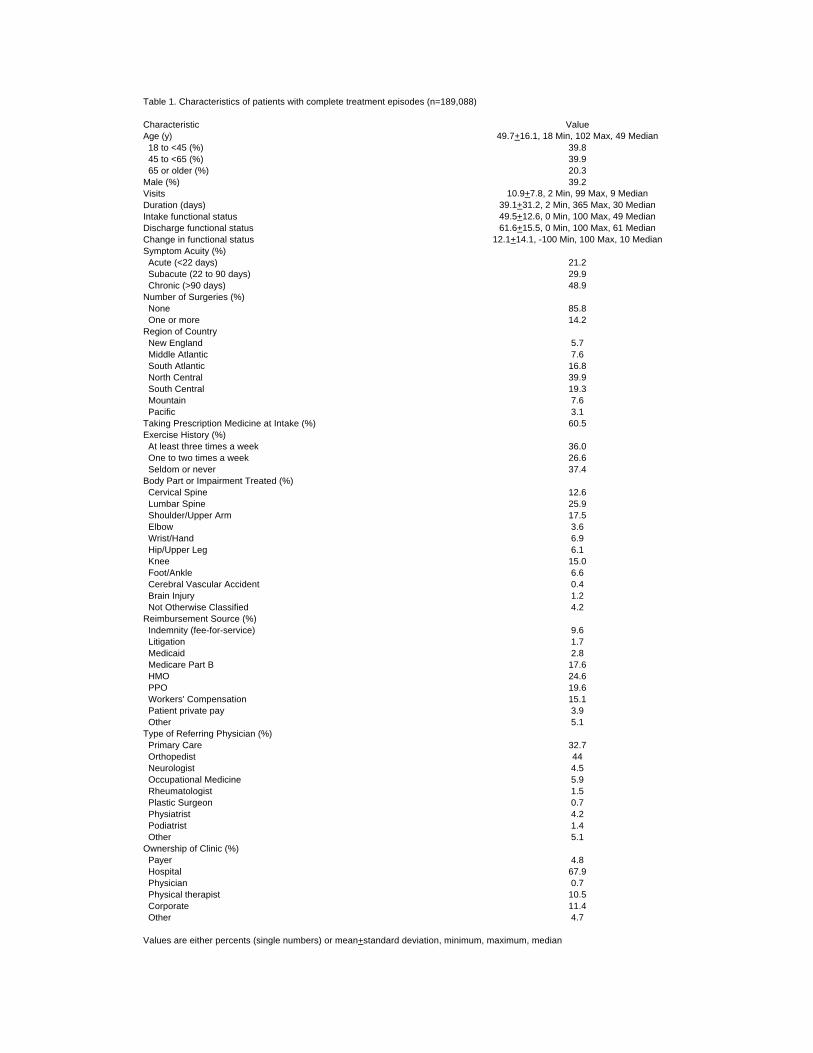
Table 1. Characteristics of patients with complete treatment episodes (n=189,088)
Characteristic ValueAge (y) 49.7+16.1, 18 Min, 102 Max, 49 Median 18 to <45 (%) 39.8 45 to <65 (%) 39.9 65 or older (%) 20.3Male (%) 39.2Visits 10.9+7.8, 2 Min, 99 Max, 9 MedianDuration (days) 39.1+31.2, 2 Min, 365 Max, 30 MedianIntake functional status 49.5+12.6, 0 Min, 100 Max, 49 MedianDischarge functional status 61.6+15.5, 0 Min, 100 Max, 61 MedianChange in functional status 12.1+14.1, -100 Min, 100 Max, 10 MedianSymptom Acuity (%) Acute (<22 days) 21.2 Subacute (22 to 90 days) 29.9 Chronic (>90 days) 48.9Number of Surgeries (%) None 85.8 One or more 14.2Region of Country New England 5.7 Middle Atlantic 7.6 South Atlantic 16.8 North Central 39.9 South Central 19.3 Mountain 7.6 Pacific 3.1Taking Prescription Medicine at Intake (%) 60.5Exercise History (%) At least three times a week 36.0 One to two times a week 26.6 Seldom or never 37.4Body Part or Impairment Treated (%) Cervical Spine 12.6 Lumbar Spine 25.9 Shoulder/Upper Arm 17.5 Elbow 3.6 Wrist/Hand 6.9 Hip/Upper Leg 6.1 Knee 15.0 Foot/Ankle 6.6 Cerebral Vascular Accident 0.4 Brain Injury 1.2 Not Otherwise Classified 4.2Reimbursement Source (%) Indemnity (fee-for-service) 9.6 Litigation 1.7 Medicaid 2.8 Medicare Part B 17.6 HMO 24.6 PPO 19.6 Workers' Compensation 15.1 Patient private pay 3.9 Other 5.1Type of Referring Physician (%) Primary Care 32.7 Orthopedist 44 Neurologist 4.5 Occupational Medicine 5.9 Rheumatologist 1.5 Plastic Surgeon 0.7 Physiatrist 4.2 Podiatrist 1.4 Other 5.1Ownership of Clinic (%) Payer 4.8 Hospital 67.9 Physician 0.7 Physical therapist 10.5 Corporate 11.4 Other 4.7
Values are either percents (single numbers) or mean+standard deviation, minimum, maximum, median

Table 2. Top 75 diagnostic ICD-9-CM codes by frequency (n=189,088)
Diagnosis ICD-9 Frequency Percent
Lumbago 724.2 12315 6.51Sprains and strains of other and unspecified parts of back 847 7718 4.08Sprains and strains of other and unspecified parts of back, lumbar 847.2 7635 4.04Rotator cuff syndrome of shoulder and allied disorders 726.1 5226 2.76Cervicalgia (pain in the neck) 723.1 4884 2.58Pain in joint (arthralgia), shoulder 719.41 3574 1.89Displacement of thoracic or lumbar intervertebral disc without myelopathy 722.1 3237 1.71Other affections of shoulder region, not elsewhere classified 726.2 3103 1.64Pain in joint (arthralgia), lower leg 719.46 3029 1.60Sprains and strains of shoulder and upper arm, unspecified site 840.9 2674 1.41Peripheral enthesopathies and allied syndromes 726 2616 1.38Sprains and strains of shoulder and upper arm, rotator cuff 840.4 2601 1.38Dislocation of knee 836 2556 1.35Lateral epicondylitis of elbow 726.32 2345 1.24Sprains and strains of ankle and foot 845 2253 1.19Chondromalacia of patella 717.7 2086 1.10Sprains and strains of knee and leg, unspeccified site 844.9 1970 1.04Brachial neuritis or radiculitis (cervical radiculitis) 723.4 1932 1.02Sprains and strains of sacroiliac region 846 1922 1.02Sciatica 724.3 1910 1.01Sprains and strains of other and unspecified parts of back, thoracic 847.1 1910 1.01Carpal tunnel syndrome 354 1848 0.98Pain in limb 729.5 1814 0.96Backache, unspecified 724.5 1715 0.91Plantar fascial fibromatosis 728.71 1699 0.90Intervertebral disc disorder with myelopathy, lumbar region 722.73 1646 0.87Spinal stenosis, lumbar region 724.02 1554 0.82Myalgia and myositis, unspecified 729.1 1512 0.80Lumbar or lumbosacral intervertebral disc 722.52 1510 0.80Thoracic or lumbosacral neuritis or radiculitis, unspecified 724.4 1470 0.78Enthesopathy of hip region 726.5 1389 0.73Complete rupture of rotator cuff 727.61 1264 0.67Spondylosis and allied disorders 721 1143 0.60Intervertebral disc disorders 722 1086 0.57Pain in joint, pelvic region and thigh 719.45 1079 0.57Osteoarthrosis, unspecified whether generalized or localized, lower leg 715.96 998 0.53Osteoarthrosis, localized, primary, lower leg 715.16 964 0.51Sprains and strains of knee and leg, cruciate ligament of knee 844.2 942 0.50Sprains and strains of wrist and hand 842 820 0.43Degeneration of cervical intervertebral disc 722.4 819 0.43Spondylosis of unspecified site 721.9 808 0.43Lumbosacral spondylosis without myelopathy 721.3 791 0.42Unspecified internal derangement of knee 717.9 756 0.40Old disruption of anterior cruciate ligament 717.83 753 0.40Achilles bursitis or tendinitis 726.71 740 0.39Other tenosynovitis of hand and wrist 727.05 665 0.35Postlaminectomy syndrome, lumbar 722.83 648 0.34Intervertebral disc disorder with myelopathy, cervical region 722.71 605 0.32Pain in joint (arthralgia), ankle and foot 719.47 604 0.32Pain in thoracic spine 724.1 600 0.32Other fractures of distal end of radius 813.42 599 0.32Sprains and strains of other specified sites of shoulder and upper arm 840.8 590 0.31Abnormality of gait 781.2 567 0.30Fracture of humerus 812 564 0.30Osteoarthorosis, unspecified whether generalized or localized 715.9 554 0.29Calcifying tendinitis of shoulder 726.11 535 0.28Acute, but ill-defined, cerebrovascular disease 436 528 0.28Fracture of ankle, unspecified, closed 824.8 505 0.27Polymyalgia rheumatica 725 502 0.27Sprains and strains of hip and thigh, unspecified site 843.9 500 0.26Sprains and strains of hip and thigh, other specified sites 843.8 459 0.24Other joint derangement, not elsewhere classified, shoulder region 718.81 448 0.24Displacement of intervertebral disc, site unspecified, without myelopathy 722.2 448 0.24Sprains and strains of sacroiliac region, unspecified site 846.9 436 0.23Radial styloid tenosynovitis 727.04 430 0.23Disorders of sacrum 724.6 410 0.22Enthesopathy of elbow region, medial epicondylitis 726.31 409 0.22Dislocation of shoulder 831 402 0.21Sprains and strains of knee and leg, medial collateral ligament of knee 844.1 402 0.21Fracture of ankle 824 400 0.21Other tear of cartilage or meniscus of knee, current 836.2 384 0.20Fracture of one or more phalanges of hand 816 377 0.20Sprains and strains of shoulder and upper arm 840 373 0.20Patellar tendinitis 726.64 368 0.19Osteoarthrosis and allied disorders 715 365 0.19
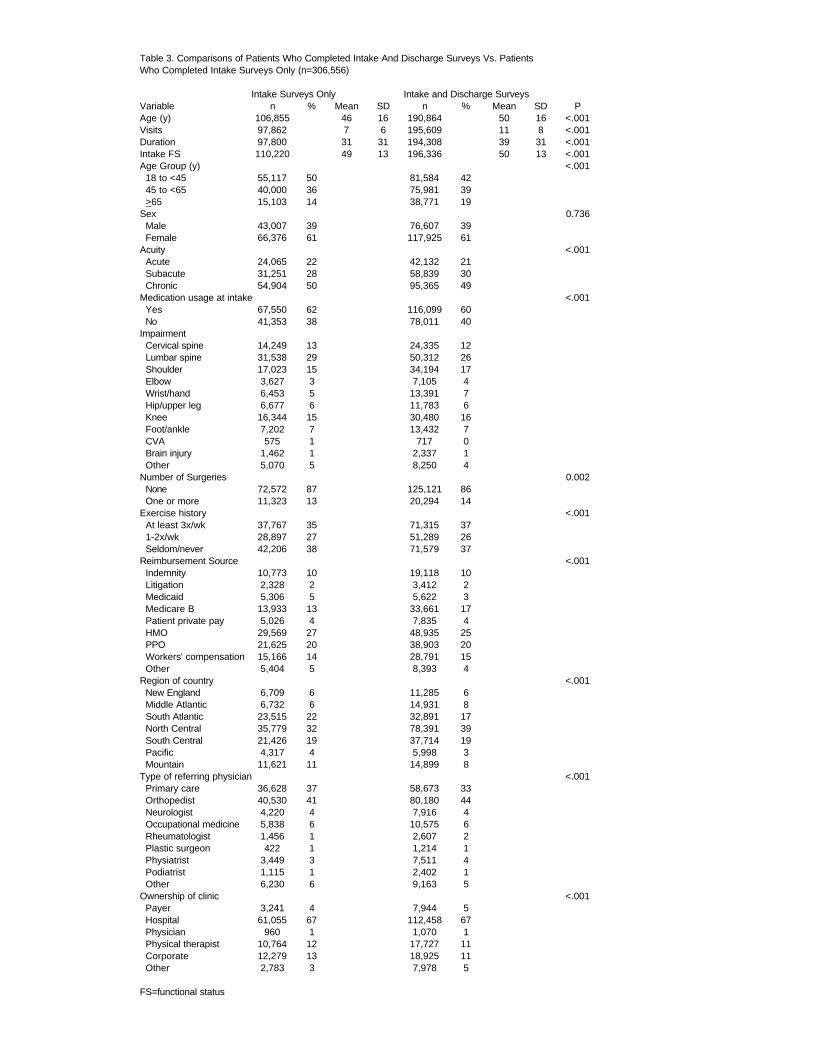
Table 3. Comparisons of Patients Who Completed Intake And Discharge Surveys Vs. Patients Who Completed Intake Surveys Only (n=306,556)
Intake Surveys Only Intake and Discharge SurveysVariable n % Mean SD n % Mean SD PAge (y) 106,855 46 16 190,864 50 16 <.001Visits 97,862 7 6 195,609 11 8 <.001Duration 97,800 31 31 194,308 39 31 <.001Intake FS 110,220 49 13 196,336 50 13 <.001Age Group (y) <.001 18 to <45 55,117 50 81,584 42 45 to <65 40,000 36 75,981 39 >65 15,103 14 38,771 19Sex 0.736 Male 43,007 39 76,607 39 Female 66,376 61 117,925 61Acuity <.001 Acute 24,065 22 42,132 21 Subacute 31,251 28 58,839 30 Chronic 54,904 50 95,365 49Medication usage at intake <.001 Yes 67,550 62 116,099 60 No 41,353 38 78,011 40Impairment Cervical spine 14,249 13 24,335 12 Lumbar spine 31,538 29 50,312 26 Shoulder 17,023 15 34,194 17 Elbow 3,627 3 7,105 4 Wrist/hand 6,453 5 13,391 7 Hip/upper leg 6,677 6 11,783 6 Knee 16,344 15 30,480 16 Foot/ankle 7,202 7 13,432 7 CVA 575 1 717 0 Brain injury 1,462 1 2,337 1 Other 5,070 5 8,250 4Number of Surgeries 0.002 None 72,572 87 125,121 86 One or more 11,323 13 20,294 14Exercise history <.001 At least 3x/wk 37,767 35 71,315 37 1-2x/wk 28,897 27 51,289 26 Seldom/never 42,206 38 71,579 37Reimbursement Source <.001 Indemnity 10,773 10 19,118 10 Litigation 2,328 2 3,412 2 Medicaid 5,306 5 5,622 3 Medicare B 13,933 13 33,661 17 Patient private pay 5,026 4 7,835 4 HMO 29,569 27 48,935 25 PPO 21,625 20 38,903 20 Workers' compensation 15,166 14 28,791 15 Other 5,404 5 8,393 4Region of country <.001 New England 6,709 6 11,285 6 Middle Atlantic 6,732 6 14,931 8 South Atlantic 23,515 22 32,891 17 North Central 35,779 32 78,391 39 South Central 21,426 19 37,714 19 Pacific 4,317 4 5,998 3 Mountain 11,621 11 14,899 8Type of referring physician <.001 Primary care 36,628 37 58,673 33 Orthopedist 40,530 41 80,180 44 Neurologist 4,220 4 7,916 4 Occupational medicine 5,838 6 10,575 6 Rheumatologist 1,456 1 2,607 2 Plastic surgeon 422 1 1,214 1 Physiatrist 3,449 3 7,511 4 Podiatrist 1,115 1 2,402 1 Other 6,230 6 9,163 5Ownership of clinic <.001 Payer 3,241 4 7,944 5 Hospital 61,055 67 112,458 67 Physician 960 1 1,070 1 Physical therapist 10,764 12 17,727 11 Corporate 12,279 13 18,925 11 Other 2,783 3 7,978 5
FS=functional status

Table 4. States by regionRegion
New Middle South North SouthState England Atlantic Atlantic Central Central Mountain PacificArizona* XColorado* XIdaho* XMontana XNevada XNew Mexico* XUtah XWyoming XIllinois* XIndiana* XIowa* XKansas* XMichigan* XMinnesota* XMissouri* XNebraska* XNorth Dakota XOhio* XSouth Dakota* XWisconsin* XAlabama* XArkansas XKentucky* XLouisiana* XMississippi* XOklahoma* XTennessee* XTexas* XNew Jersey* XNew York* XPennsylvania* XCalifornia* XOregon XWashington* XConnecticut* XMaine* XMassachusetts* XNew Hampshire* XRhode Island* XVermont* XDelaware XDistrict of Columbia XFlorida* XGeorgia* XMaryland* XNorth Carolina* XSouth Carolina XVirginia* XWest Virginia* X
*States that had data for retrospective analysesHawaii and Alaska are not represented

Table 5. Value Purchasing Payment Algorithm©
Pay Effectiveness/Efficiency Classification Payment SuggestionScenario
Enhanced Effectiveness: Actual FS change was greater than predicted FS change1 Enhanced Efficiency
Actual visits were less than predicted visits Pay predicted number of visits times standard price per visit plus 10%2 Predicted Efficiency
Actual visits equaled predicted visits Pay predicted number of visits times standard price per visit plus 5%3 Decreased Efficiency
Actual visits were greater than predicted visits Pay predicted number of visits times standard price per visit plus 5%
Predicted Effectiveness: Actual FS change equaled predicted FS change4 Enhanced Efficiency
Actual visits were less than predicted visits Pay predicted number of visits times standard price per visit5 Predicted Efficiency
Actual visits equaled predicted visits Pay predicted number of visits times standard price per visit6 Decreased Efficiency
Actual visits were greater than predicted visits Pay predicted number of visits times standard price per visit
Decreased Effectiveness: Actual FS change less than predicted FS change7 Enhanced Efficiency
Actual visits were less than predicted visits Pay actual number of visits times standard price per visit minus 5%8 Predicted Efficiency
Actual visits equaled predicted visits Pay actual number of visits times standard price per visit minus 5%9 Decreased Efficiency
Actual visits were greater than predicted visits Pay predicted number of visits times standard price per visit minus 10%

Table 6. Functional Status Measures1 and Responsiveness per Impairment
Intake Discharge ChangeImpairment n Mean(SD) Min/Max Median Mean(SD) Min/Max Median Mean(SD) Min/Max Median Effect SizeCervical spine 23,880 52.1(12.5) 0/100 51.7 63.1(15.6) 0/100 62.2 10.9(13.6) -100/95 8.7 0.88Lumbar spine 49,005 48.3(11.4) 0/100 48.2 60.2(15.4) 0/100 59.4 11.9(13.8) -17/100 9.7 1.05Shoulder 33,162 50.5(12.3) 0/100 50.6 63.0(15.0) 0/100 61.7 12.5(14.1) -100/99 10.2 1.05Elbow 6,895 51.7(12.1) 0/100 51.7 63.8+15.3 0/100 62.7 12.1(14.3) -96/95 9.8 1.00Wrist/hand 13,046 50.5(13.6) 0/100 50.6 63.2(16.1) 0/100 61.6 12.7(15.2) -94/93 10.4 0.94Hip 11,315 48.7(12.8) 0/100 47.8 59.6(15.3) 0/100 58.1 11.0(13.2) -76/91 9.3 0.86Knee 28,432 47.5(12.8) 0/100 47.1 61.1(14.6) 0/100 59.5 13.7(14.2) -75/99 11.8 1.06Foot/ankle 12,538 50.7(12.9) 0/100 49.7 63.1(15.1) 0/100 62.2 12.5(14.3) -73/97 10.7 0.97CVA 594 32.0(21.1) 0/95 38.9 41.7(23.9) 0/100 47.7 9.7(15.9) -82/66 6.6 0.46Brain injury 2,278 49.0(13.0) 0/100 48.2 57.5(15.0) 0/100 55.4 8.5(12.1) -54/61 6.7 0.66Not classified 7,943 50.0(14.0) 0/100 50.0 61.4(17.4) 0/100 61.0 11.4(14.5) -82/97 9.2 0.82
1 mean+standard deviation, min=minimum, max=maximum, and effect size=(mean discharge - mean intake)/(standard deviation at intake)

Table 7. Univariate Analyses Results (n=94,544)
Discharge Functional StatusVariable Mean(SE)* df* F* P*Condition Severity 3/94539 35 <.001 Slight 62.7(.13) Moderate 61.7(.09) Severe 61.0(.09) Very severe 61.1(.13)Age Group (y) 2/94540 1,689 <.001 18 to <45 64.4(.07) 45 to <65 60.9(.07) >65 57.8(.10)Sex 1/93719 523 <.001 Male 62.9(.07) Female 60.8(.06)Symptom Acuity 2/94540 1,402 <.001 Acute 65.2(.09) Subacute 62.6(.08) Chronic 59.5(.06)Medication Usage at Intake 1/93504 135 <.001 Yes 61.4(.06) No 62.4(.07)Impairment 10/94532 51 <.001 Cervical spine 61.4(.12) Lumbar spine 60.9(.09) Shoulder 62.3(.10) Elbow 62.4(.23) Wrist/hand 62.7(.16) Hip/upper leg 60.2(.18) Knee 62.3(.11) Foot/ankle 62.5(.17) CVA 53.4(.77) Brain injury 58.0(.40) Other 61.1(.21)Number of Surgeries 1/70073 285 <.001 None 62.3(.06) One or more 59.8(.14)Exercise History 2/93527 231 <.001 At least 3x/wk 62.7(.07) 1-2x/wk 62.1(.08) Seldom/never 60.6(.07)Reimbursement Source 8/94534 313 <.001 Indemnity 63.3(.14) Litigation 62.7(.33) Medicaid 58.5(.25) Medicare B 57.5(.10) Patient private pay 64.6(.22) HMO 62.5(.09) PPO 63.3(.10) Workers' compensation 61.7(.11) Other 61.1(.19)Region of Country 6/94536 18 <.001 New England 62.7(.18) Middle Atlantic 61.2(.16) South Atlantic 61.4(.11) North Central 61.8(.07) South Central 61.7(.10) Pacific 62.2(.25) Mountain 60.5(.16)Type of Referring Physician 8/86846 137 <.001 Primary care 62.3(.08) Orthopedist 62.0(.07) Neurologist 59.4(.21) Occupational medicine 64.3(.18) Rheumatologist 56.6(.36) Plastic surgeon 65.2(.53) Physiatrist 57.9(.22) Podiatrist 60.0(.39) Other 59.5(.20)Ownership of Clinic 5/80310 33 <.001 Payer 61.5(.21) Hospital 61.4(.06) Physician 63.5(.59) Physical therapist 62.6(.14) Corporate 62.2(.14) Other 63.5(.21)
Correlational Coefficients r** P**Intake Functional Status 0.52 <.001Age (y) -0.25 <.001
*One-way ANCOVA results: **Pearson Product Moment Correlation resultsMean(SE)=least squares means(standard error); df=degrees of freedom; F=F-ratio statistic; P=probability

Table 8. Predictive Ratios by Impairment Group
Impairment n Minimum Maximum Median Mean(CI)All 52911 0.315 36.703 1.025 1.045(1.042,1.047)
By ImpairmentCervical 7757 0.325 4.573 1.030 1.048(1.043,1.053)Lumbar 15624 0.315 9.667 1.027 1.045(1.042,1.049)Shoulder 8617 0.374 3.603 1.023 1.040(1.035,1.044)Elbow 1931 0.375 14.266 1.031 1.052(1.035,1.068)Wrist/hand 3169 0.405 36.703 1.024 1.051(1.027,1.074)Hip 3055 0.359 23.040 1.017 1.045(1.029,1.062)Knee 6240 0.364 3.893 1.025 1.045(1.040,1.051)Foot/ankle 3265 0.410 9.756 1.019 1.036(1.027,1.044)CVA 36 0.478 1.557 0.952 .961(.894,1.028)Brain Injury 744 0.597 2.636 1.016 1.042(1.027,1.057)Not classified 2473 0.329 12.062 1.022 1.051(1.037,1.065)
By Type of FacilityPayer owned 2224 0.446 3.791 1.025 1.041(1.031,1.051)Hospital outpatient 36433 0.315 36.703 1.022 1.043(1.039,1.046)Physician office 368 0.477 2.145 1.005 1.025(1.005,1.045)Physical therapist private practice 5105 0.359 4.519 1.035 1.057(1.050,1.063)Corporate owned 6256 0.435 23.040 1.029 1.052(1.043,1.060)Other 2525 0.325 4.573 1.036 1.044(1.035,1.053)
CI=95% confidence interval

Table 9. Regression results for discharge functional status and change in functional status
Complete Regression Model
Patients regardless of payer Patients receiving Medicare Part B benefitsVariable Partial R2 Cumulative R2 Variable Partial R2 Cumulative R2
FS at Intake 0.2339 0.2339 FS at Intake 0.2606 0.2606Age 0.0362 0.2701 Symptom acuity 0.0152 0.2758Symptom acuity 0.0237 0.2938 Exercise history 0.0101 0.2859Exercise history 0.0041 0.2979 Gender 0.0054 0.2913Type of referring physician 0.0040 0.3019 Age 0.0037 0.2950Medication use at intake 0.0032 0.3051 Medication use at intake 0.0034 0.2984Gender 0.0026 0.3077 Type of referring physician 0.0029 0.3013Surgical history 0.0015 0.3092 Clinic ownership 0.0016 0.3029Clinic ownership 0.0014 0.3106 Surgical history 0.0010 0.3039Region of country 0.0004 0.3110 Region of country 0.0004 0.3043Payer source 0.0004 0.3114 Impairment 0.0000 0.3043Impairment 0.0000 0.3114
n=106,568 R2 =.354 F46,106521 =1269 P<.001 n=18,044 R2 =.361 F38,18005 =268 P<.001
Parsimonious Regression Model
Patients regardless of payer Patients receiving Medicare Part B benefitsVariable Partial R2 Cumulative R2 Variable Partial R2 Cumulative R2
Condition severity 0.0718 0.0718 Condition severity 0.0999 0.0999Symptom acuity 0.0281 0.0999 Symptom acuity 0.0125 0.1124Age group 0.0135 0.1134 Impairment 0.0006 0.1130Impairment 0.0003 0.1137
n=189,088 R2 =.119 F17,189070 =1497 P<.001 n=33,296 R2 =.120 F15,33280 =302 P<.001
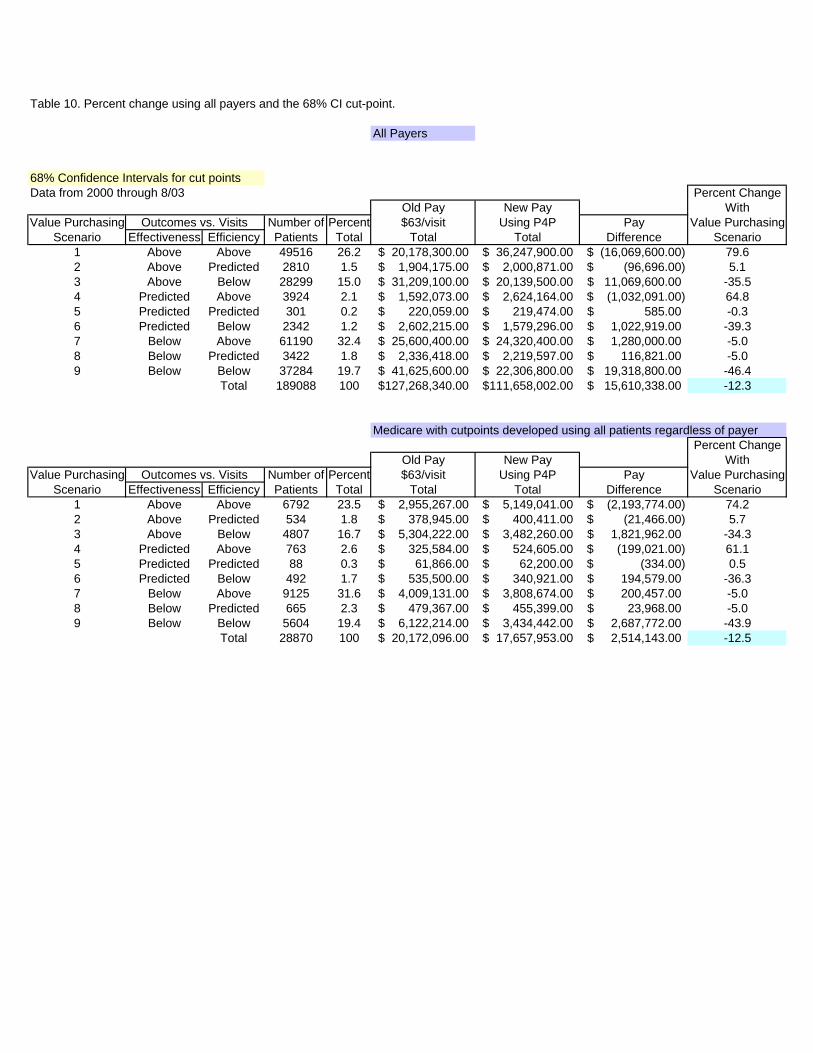
Table 10. Percent change using all payers and the 68% CI cut-point.
All Payers
68% Confidence Intervals for cut pointsData from 2000 through 8/03 Percent Change
Old Pay New Pay WithValue Purchasing Outcomes vs. Visits Number of Percent $63/visit Using P4P Pay Value Purchasing
Scenario Effectiveness Efficiency Patients Total Total Total Difference Scenario1 Above Above 49516 26.2 20,178,300.00$ 36,247,900.00$ (16,069,600.00)$ 79.62 Above Predicted 2810 1.5 1,904,175.00$ 2,000,871.00$ (96,696.00)$ 5.13 Above Below 28299 15.0 31,209,100.00$ 20,139,500.00$ 11,069,600.00$ -35.54 Predicted Above 3924 2.1 1,592,073.00$ 2,624,164.00$ (1,032,091.00)$ 64.85 Predicted Predicted 301 0.2 220,059.00$ 219,474.00$ 585.00$ -0.36 Predicted Below 2342 1.2 2,602,215.00$ 1,579,296.00$ 1,022,919.00$ -39.37 Below Above 61190 32.4 25,600,400.00$ 24,320,400.00$ 1,280,000.00$ -5.08 Below Predicted 3422 1.8 2,336,418.00$ 2,219,597.00$ 116,821.00$ -5.09 Below Below 37284 19.7 41,625,600.00$ 22,306,800.00$ 19,318,800.00$ -46.4
Total 189088 100 127,268,340.00$ 111,658,002.00$ 15,610,338.00$ -12.3
Medicare with cutpoints developed using all patients regardless of payerPercent Change
Old Pay New Pay WithValue Purchasing Outcomes vs. Visits Number of Percent $63/visit Using P4P Pay Value Purchasing
Scenario Effectiveness Efficiency Patients Total Total Total Difference Scenario1 Above Above 6792 23.5 2,955,267.00$ 5,149,041.00$ (2,193,774.00)$ 74.22 Above Predicted 534 1.8 378,945.00$ 400,411.00$ (21,466.00)$ 5.73 Above Below 4807 16.7 5,304,222.00$ 3,482,260.00$ 1,821,962.00$ -34.34 Predicted Above 763 2.6 325,584.00$ 524,605.00$ (199,021.00)$ 61.15 Predicted Predicted 88 0.3 61,866.00$ 62,200.00$ (334.00)$ 0.56 Predicted Below 492 1.7 535,500.00$ 340,921.00$ 194,579.00$ -36.37 Below Above 9125 31.6 4,009,131.00$ 3,808,674.00$ 200,457.00$ -5.08 Below Predicted 665 2.3 479,367.00$ 455,399.00$ 23,968.00$ -5.09 Below Below 5604 19.4 6,122,214.00$ 3,434,442.00$ 2,687,772.00$ -43.9
Total 28870 100 20,172,096.00$ 17,657,953.00$ 2,514,143.00$ -12.5

Table 11. Percent change using all payers and the 90% CI cut-point.
All Payers
90% Confidence Intervals for cut pointsData from 2000 through 8/03 Percent Change
Old Pay New Pay WithValue Purchasing Outcomes vs. Visits Number of Percent $63/visit Using P4P Pay Value Purchasing
Scenario Effectiveness Efficiency Patients Total Total Total Difference Scenario1 Above Above 47347 25.0 19,057,600.00$ 34,626,400.00$ (15,568,800.00)$ 81.72 Above Predicted 4283 2.3 2,879,793.00$ 3,036,079.00$ (156,286.00)$ 5.43 Above Below 26899 14.2 29,921,000.00$ 19,165,000.00$ 10,756,000.00$ -35.94 Predicted Above 6467 3.4 2,608,452.00$ 4,313,747.00$ (1,705,295.00)$ 65.45 Predicted Predicted 787 0.4 559,440.00$ 568,330.00$ (8,890.00)$ 1.66 Predicted Below 3782 2.0 4,249,539.00$ 2,540,462.00$ 1,709,077.00$ -40.27 Below Above 58519 30.9 24,179,600.00$ 22,970,600.00$ 1,209,000.00$ -5.08 Below Predicted 5402 2.9 3,670,884.00$ 3,487,340.00$ 183,544.00$ -5.09 Below Below 35602 18.8 40,142,000.00$ 21,316,700.00$ 18,825,300.00$ -46.9
Total 189088 100 127,268,308.00$ 112,024,658.00$ 15,243,650.00$ -12.0
Medicare with cutpoints developed using all patients regardless of payerPercent Change
Old Pay New Pay WithValue Purchasing Outcomes vs. Visits Number of Percent $63/visit Using P4P Pay Value Purchasing
Scenario Effectiveness Efficiency Patients Total Total Total Difference Scenario1 Above Above 6439 22.3 2,783,592.00$ 4,877,527.00$ (2,093,935.00)$ 75.22 Above Predicted 746 2.6 517,482.00$ 546,719.00$ (29,237.00)$ 5.63 Above Below 4501 15.6 5,008,437.00$ 3,257,247.00$ 1,751,190.00$ -35.04 Predicted Above 1282 4.4 543,312.00$ 885,409.00$ (342,097.00)$ 63.05 Predicted Predicted 206 0.7 147,546.00$ 147,287.00$ 259.00$ -0.26 Predicted Below 804 2.8 902,601.00$ 558,849.00$ 343,752.00$ -38.17 Below Above 8675 30.0 3,781,512.00$ 3,592,436.00$ 189,076.00$ -5.08 Below Predicted 1009 3.5 716,562.00$ 680,734.00$ 35,828.00$ -5.09 Below Below 5208 18.0 5,771,052.00$ 3,192,521.00$ 2,578,531.00$ -44.7
Total 28870 100 20,172,096.00$ 17,738,729.00$ 2,433,367.00$ -12.1
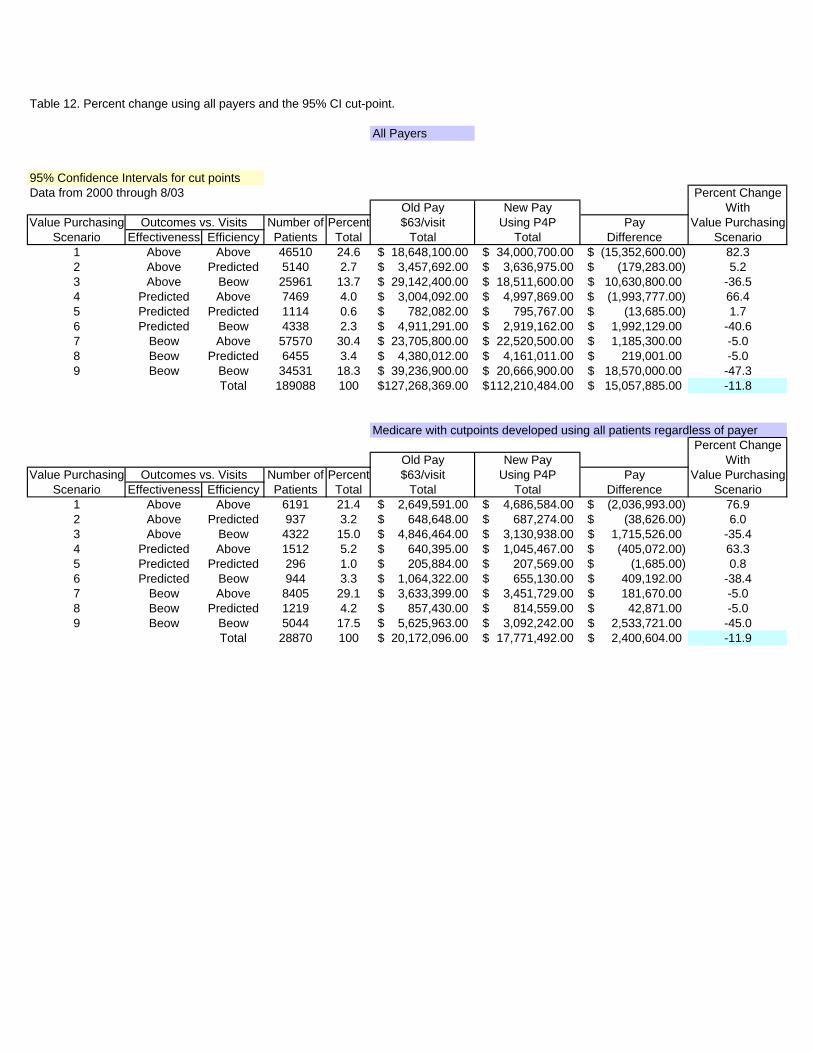
Table 12. Percent change using all payers and the 95% CI cut-point.
All Payers
95% Confidence Intervals for cut pointsData from 2000 through 8/03 Percent Change
Old Pay New Pay WithValue Purchasing Outcomes vs. Visits Number of Percent $63/visit Using P4P Pay Value Purchasing
Scenario Effectiveness Efficiency Patients Total Total Total Difference Scenario1 Above Above 46510 24.6 18,648,100.00$ 34,000,700.00$ (15,352,600.00)$ 82.32 Above Predicted 5140 2.7 3,457,692.00$ 3,636,975.00$ (179,283.00)$ 5.23 Above Beow 25961 13.7 29,142,400.00$ 18,511,600.00$ 10,630,800.00$ -36.54 Predicted Above 7469 4.0 3,004,092.00$ 4,997,869.00$ (1,993,777.00)$ 66.45 Predicted Predicted 1114 0.6 782,082.00$ 795,767.00$ (13,685.00)$ 1.76 Predicted Beow 4338 2.3 4,911,291.00$ 2,919,162.00$ 1,992,129.00$ -40.67 Beow Above 57570 30.4 23,705,800.00$ 22,520,500.00$ 1,185,300.00$ -5.08 Beow Predicted 6455 3.4 4,380,012.00$ 4,161,011.00$ 219,001.00$ -5.09 Beow Beow 34531 18.3 39,236,900.00$ 20,666,900.00$ 18,570,000.00$ -47.3
Total 189088 100 127,268,369.00$ 112,210,484.00$ 15,057,885.00$ -11.8
Medicare with cutpoints developed using all patients regardless of payerPercent Change
Old Pay New Pay WithValue Purchasing Outcomes vs. Visits Number of Percent $63/visit Using P4P Pay Value Purchasing
Scenario Effectiveness Efficiency Patients Total Total Total Difference Scenario1 Above Above 6191 21.4 2,649,591.00$ 4,686,584.00$ (2,036,993.00)$ 76.92 Above Predicted 937 3.2 648,648.00$ 687,274.00$ (38,626.00)$ 6.03 Above Beow 4322 15.0 4,846,464.00$ 3,130,938.00$ 1,715,526.00$ -35.44 Predicted Above 1512 5.2 640,395.00$ 1,045,467.00$ (405,072.00)$ 63.35 Predicted Predicted 296 1.0 205,884.00$ 207,569.00$ (1,685.00)$ 0.86 Predicted Beow 944 3.3 1,064,322.00$ 655,130.00$ 409,192.00$ -38.47 Beow Above 8405 29.1 3,633,399.00$ 3,451,729.00$ 181,670.00$ -5.08 Beow Predicted 1219 4.2 857,430.00$ 814,559.00$ 42,871.00$ -5.09 Beow Beow 5044 17.5 5,625,963.00$ 3,092,242.00$ 2,533,721.00$ -45.0
Total 28870 100 20,172,096.00$ 17,771,492.00$ 2,400,604.00$ -11.9

Table 13. Percent change using all payers and the +/- 1 SD cut-point.
All Payers
+/- 1 SD for cut pointsData from 2000 through 8/03 Percent Change
Old Pay New Pay WithValue Purchasing Outcomes vs. Visits Number of Percent $63/visit Using P4P Pay Value Purchasing
Scenario Effectiveness Efficiency Patients Total Total Total Difference Scenario1 Above Above 1966 1.0 354,753.00$ 1,410,493.00$ (1,055,740.00)$ 297.62 Above Predicted 22272 11.8 12,432,400.00$ 15,641,600.00$ (3,209,200.00)$ 25.83 Above Beow 2858 1.5 4,687,515.00$ 2,120,481.00$ 2,567,034.00$ -54.84 Predicted Above 8257 4.4 1,551,312.00$ 5,488,718.00$ (3,937,406.00)$ 253.85 Predicted Predicted 114586 60.6 65,566,100.00$ 76,977,800.00$ (11,411,700.00)$ 17.46 Predicted Beow 16910 8.9 27,303,400.00$ 11,568,100.00$ 15,735,300.00$ -57.67 Beow Above 1373 0.7 264,726.00$ 251,490.00$ 13,236.00$ -5.08 Beow Predicted 17847 9.4 10,187,000.00$ 9,677,625.00$ 509,375.00$ -5.09 Beow Beow 3018 1.6 4,918,725.00$ 1,777,848.00$ 3,140,877.00$ -63.9
Total 189087 100 127,265,931.00$ 124,914,155.00$ 2,351,776.00$ -1.8
Medicare with cutpoints developed using all patients regardless of payerPercent Change
Old Pay New Pay WithValue Purchasing Outcomes vs. Visits Number of Percent $63/visit Using P4P Pay Value Purchasing
Scenario Effectiveness Efficiency Patients Total Total Total Difference Scenario1 Above Above 318 1.1 65,772.00$ 231,309.00$ (165,537.00)$ 251.72 Above Predicted 2946 10.2 1,823,787.00$ 2,151,019.00$ (327,232.00)$ 17.93 Above Beow 517 1.8 812,826.00$ 392,376.00$ 420,450.00$ -51.74 Predicted Above 1692 5.9 355,509.00$ 1,134,037.00$ (778,528.00)$ 219.05 Predicted Predicted 17336 60.0 10,524,000.00$ 12,011,400.00$ (1,487,400.00)$ 14.16 Predicted Beow 2830 9.8 4,364,073.00$ 1,970,477.00$ 2,393,596.00$ -54.87 Beow Above 298 1.0 64,575.00$ 61,346.00$ 3,229.00$ -5.08 Beow Predicted 2531 8.8 1,533,987.00$ 1,457,288.00$ 76,699.00$ -5.09 Beow Beow 402 1.4 627,606.00$ 244,454.00$ 383,152.00$ -61.0
Total 28870 100 20,172,135.00$ 19,653,706.00$ 518,429.00$ -2.6
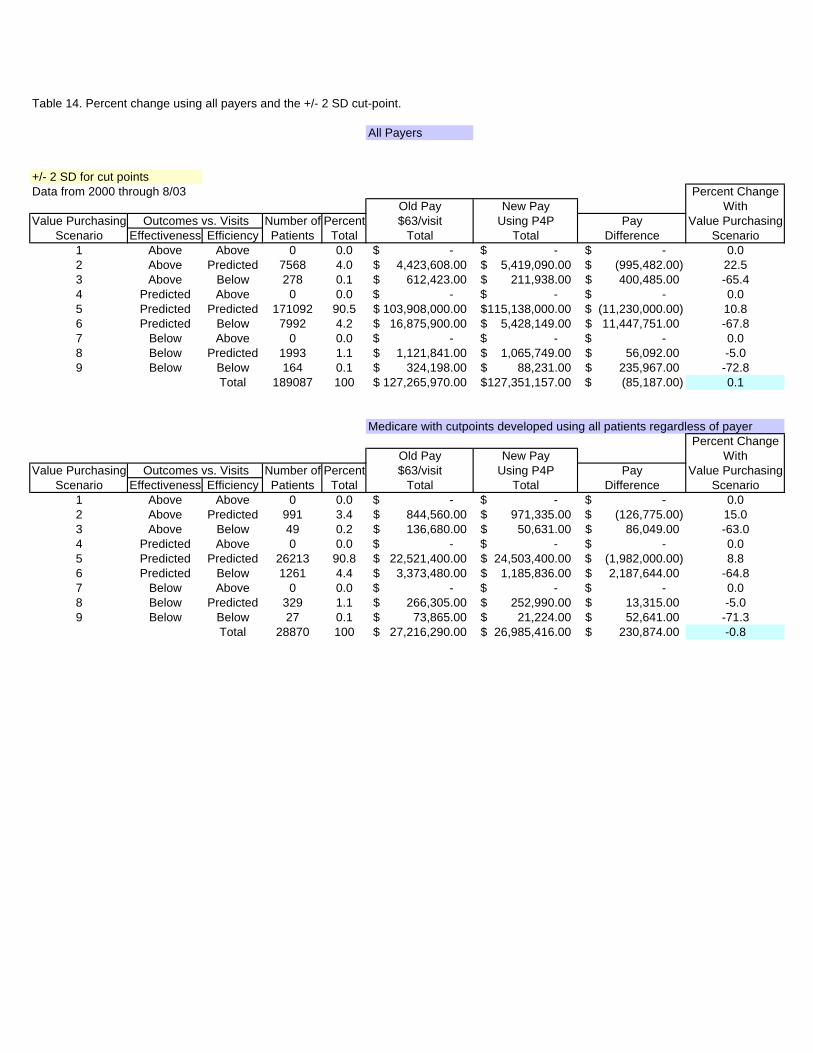
Table 14. Percent change using all payers and the +/- 2 SD cut-point.
All Payers
+/- 2 SD for cut pointsData from 2000 through 8/03 Percent Change
Old Pay New Pay WithValue Purchasing Outcomes vs. Visits Number of Percent $63/visit Using P4P Pay Value Purchasing
Scenario Effectiveness Efficiency Patients Total Total Total Difference Scenario1 Above Above 0 0.0 -$ -$ -$ 0.02 Above Predicted 7568 4.0 4,423,608.00$ 5,419,090.00$ (995,482.00)$ 22.53 Above Below 278 0.1 612,423.00$ 211,938.00$ 400,485.00$ -65.44 Predicted Above 0 0.0 -$ -$ -$ 0.05 Predicted Predicted 171092 90.5 103,908,000.00$ 115,138,000.00$ (11,230,000.00)$ 10.86 Predicted Below 7992 4.2 16,875,900.00$ 5,428,149.00$ 11,447,751.00$ -67.87 Below Above 0 0.0 -$ -$ -$ 0.08 Below Predicted 1993 1.1 1,121,841.00$ 1,065,749.00$ 56,092.00$ -5.09 Below Below 164 0.1 324,198.00$ 88,231.00$ 235,967.00$ -72.8
Total 189087 100 127,265,970.00$ 127,351,157.00$ (85,187.00)$ 0.1
Medicare with cutpoints developed using all patients regardless of payerPercent Change
Old Pay New Pay WithValue Purchasing Outcomes vs. Visits Number of Percent $63/visit Using P4P Pay Value Purchasing
Scenario Effectiveness Efficiency Patients Total Total Total Difference Scenario1 Above Above 0 0.0 -$ -$ -$ 0.02 Above Predicted 991 3.4 844,560.00$ 971,335.00$ (126,775.00)$ 15.03 Above Below 49 0.2 136,680.00$ 50,631.00$ 86,049.00$ -63.04 Predicted Above 0 0.0 -$ -$ -$ 0.05 Predicted Predicted 26213 90.8 22,521,400.00$ 24,503,400.00$ (1,982,000.00)$ 8.86 Predicted Below 1261 4.4 3,373,480.00$ 1,185,836.00$ 2,187,644.00$ -64.87 Below Above 0 0.0 -$ -$ -$ 0.08 Below Predicted 329 1.1 266,305.00$ 252,990.00$ 13,315.00$ -5.09 Below Below 27 0.1 73,865.00$ 21,224.00$ 52,641.00$ -71.3
Total 28870 100 27,216,290.00$ 26,985,416.00$ 230,874.00$ -0.8

Table 15. Percent change using patients receiving Medicare Part B benefits and the 68% CI cut-point.
68% Confidence Intervals for cut pointsData from 2000 through 8/03
Medicare with cutpoints developed using just patients receiving MedicarePercent Change
Old Pay New Pay WithValue Purchasing Outcomes vs. Visits Number of Percent $63/visit Using P4P Pay Value Purchasing
Scenario Effectiveness Efficiency Patients Total Total Total Difference Scenario1 Above Above 6872 23.8 3,013,164.00$ 5,258,798.00$ (2,245,634.00)$ 74.52 Above Predicted 556 1.9 391,167.00$ 412,379.00$ (21,212.00)$ 5.43 Above Below 4670 16.2 5,206,698.00$ 3,421,062.00$ 1,785,636.00$ -34.34 Predicted Above 900 3.1 391,041.00$ 632,410.00$ (241,369.00)$ 61.75 Predicted Predicted 120 0.4 84,861.00$ 85,610.00$ (749.00)$ 0.96 Predicted Below 567 2.0 623,007.00$ 396,380.00$ 226,627.00$ -36.47 Below Above 9086 31.5 4,011,840.00$ 3,811,248.00$ 200,592.00$ -5.08 Below Predicted 726 2.5 517,167.00$ 491,309.00$ 25,858.00$ -5.09 Below Below 5373 18.6 5,933,151.00$ 3,326,064.00$ 2,607,087.00$ -43.9
Total 28870 100 20,172,096.00$ 17,835,260.00$ 2,336,836.00$ -11.6

Table 16. Percent change using patients receiving Medicare Part B benefits and the 90% CI cut-point.
90% Confidence Intervals for cut pointsData from 2000 through 8/03
Medicare with cutpoints developed using just patients receiving MedicarePercent Change
Old Pay New Pay WithValue Purchasing Outcomes vs. Visits Number of Percent $63/visit Using P4P Pay Value Purchasing
Scenario Effectiveness Efficiency Patients Total Total Total Difference Scenario1 Above Above 6388 22.1 2,750,076.00$ 4,874,434.00$ (2,124,358.00)$ 77.22 Above Predicted 874 3.0 617,967.00$ 655,754.00$ (37,787.00)$ 6.13 Above Below 4366 15.1 4,906,881.00$ 3,192,678.00$ 1,714,203.00$ -34.94 Predicted Above 1456 5.0 621,369.00$ 1,017,945.00$ (396,576.00)$ 63.85 Predicted Predicted 273 0.9 195,552.00$ 197,910.00$ (2,358.00)$ 1.26 Predicted Below 907 3.1 1,017,387.00$ 633,077.00$ 384,310.00$ -37.87 Below Above 8509 29.5 3,696,210.00$ 3,511,400.00$ 184,810.00$ -5.08 Below Predicted 1084 3.8 775,530.00$ 736,754.00$ 38,776.00$ -5.09 Below Below 5013 17.4 5,591,124.00$ 3,101,190.00$ 2,489,934.00$ -44.5
Total 28870 100 20,172,096.00$ 17,921,142.00$ 2,250,954.00$ -11.2
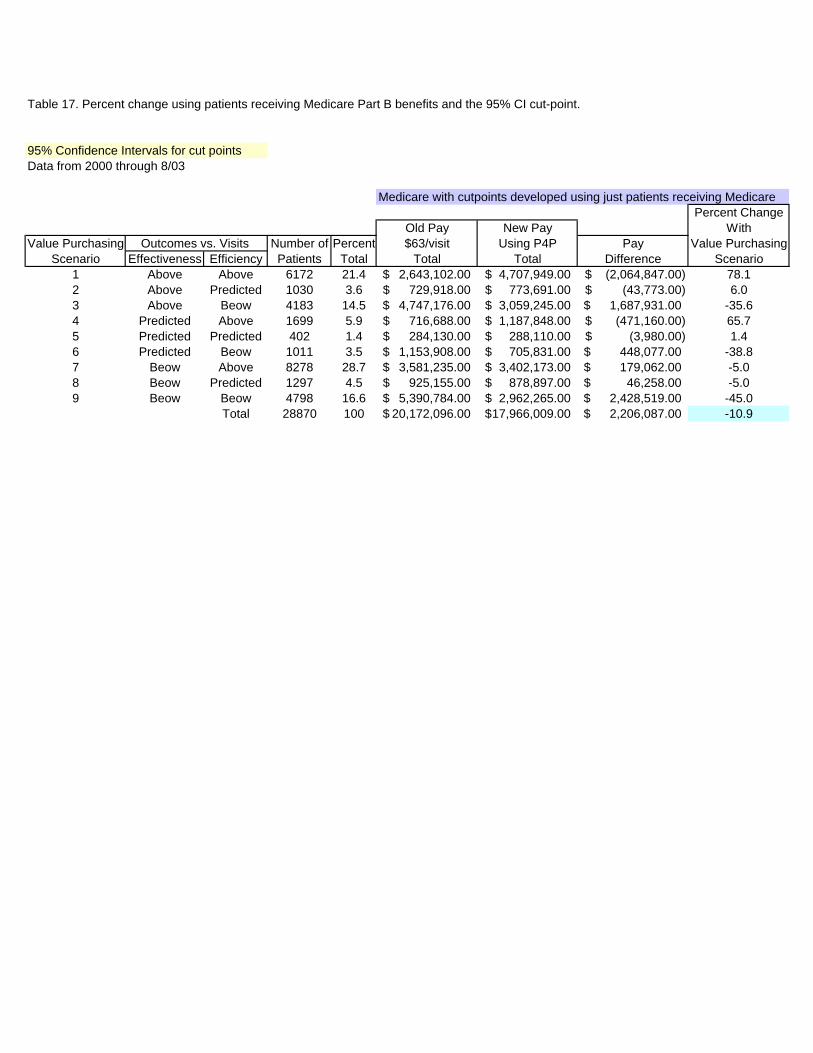
Table 17. Percent change using patients receiving Medicare Part B benefits and the 95% CI cut-point.
95% Confidence Intervals for cut pointsData from 2000 through 8/03
Medicare with cutpoints developed using just patients receiving MedicarePercent Change
Old Pay New Pay WithValue Purchasing Outcomes vs. Visits Number of Percent $63/visit Using P4P Pay Value Purchasing
Scenario Effectiveness Efficiency Patients Total Total Total Difference Scenario1 Above Above 6172 21.4 2,643,102.00$ 4,707,949.00$ (2,064,847.00)$ 78.12 Above Predicted 1030 3.6 729,918.00$ 773,691.00$ (43,773.00)$ 6.03 Above Beow 4183 14.5 4,747,176.00$ 3,059,245.00$ 1,687,931.00$ -35.64 Predicted Above 1699 5.9 716,688.00$ 1,187,848.00$ (471,160.00)$ 65.75 Predicted Predicted 402 1.4 284,130.00$ 288,110.00$ (3,980.00)$ 1.46 Predicted Beow 1011 3.5 1,153,908.00$ 705,831.00$ 448,077.00$ -38.87 Beow Above 8278 28.7 3,581,235.00$ 3,402,173.00$ 179,062.00$ -5.08 Beow Predicted 1297 4.5 925,155.00$ 878,897.00$ 46,258.00$ -5.09 Beow Beow 4798 16.6 5,390,784.00$ 2,962,265.00$ 2,428,519.00$ -45.0
Total 28870 100 20,172,096.00$ 17,966,009.00$ 2,206,087.00$ -10.9
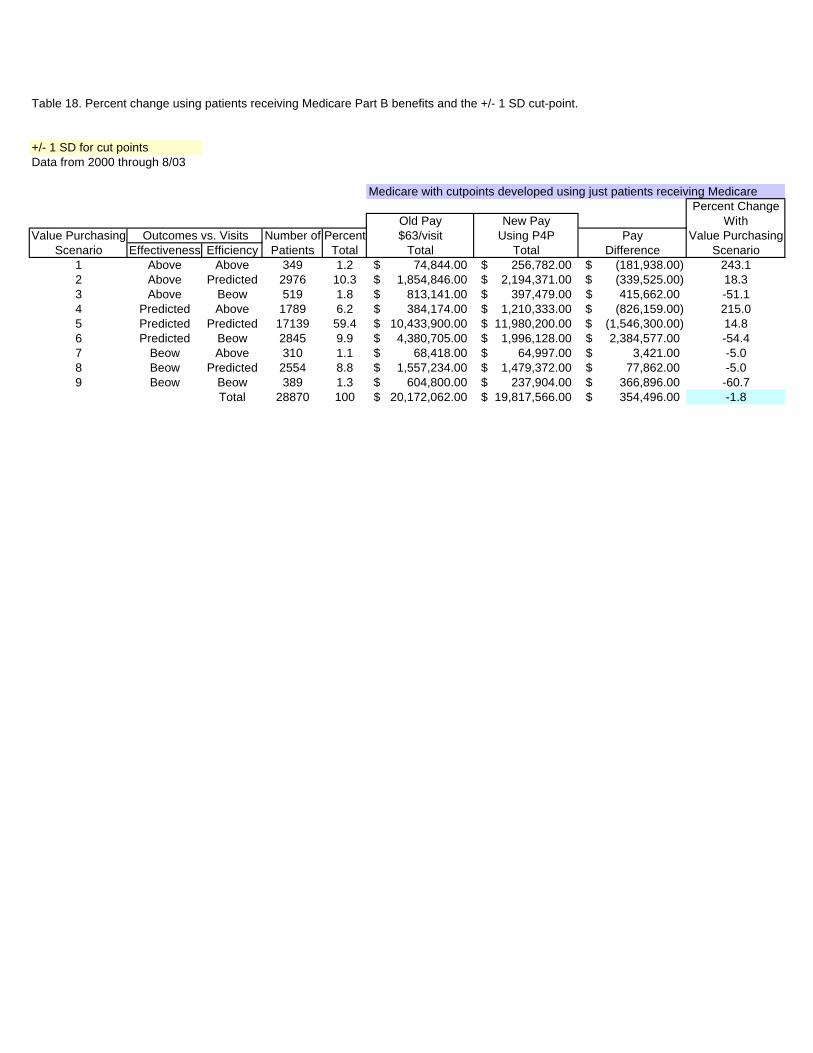
Table 18. Percent change using patients receiving Medicare Part B benefits and the +/- 1 SD cut-point.
+/- 1 SD for cut pointsData from 2000 through 8/03
Medicare with cutpoints developed using just patients receiving MedicarePercent Change
Old Pay New Pay WithValue Purchasing Outcomes vs. Visits Number of Percent $63/visit Using P4P Pay Value Purchasing
Scenario Effectiveness Efficiency Patients Total Total Total Difference Scenario1 Above Above 349 1.2 74,844.00$ 256,782.00$ (181,938.00)$ 243.12 Above Predicted 2976 10.3 1,854,846.00$ 2,194,371.00$ (339,525.00)$ 18.33 Above Beow 519 1.8 813,141.00$ 397,479.00$ 415,662.00$ -51.14 Predicted Above 1789 6.2 384,174.00$ 1,210,333.00$ (826,159.00)$ 215.05 Predicted Predicted 17139 59.4 10,433,900.00$ 11,980,200.00$ (1,546,300.00)$ 14.86 Predicted Beow 2845 9.9 4,380,705.00$ 1,996,128.00$ 2,384,577.00$ -54.47 Beow Above 310 1.1 68,418.00$ 64,997.00$ 3,421.00$ -5.08 Beow Predicted 2554 8.8 1,557,234.00$ 1,479,372.00$ 77,862.00$ -5.09 Beow Beow 389 1.3 604,800.00$ 237,904.00$ 366,896.00$ -60.7
Total 28870 100 20,172,062.00$ 19,817,566.00$ 354,496.00$ -1.8
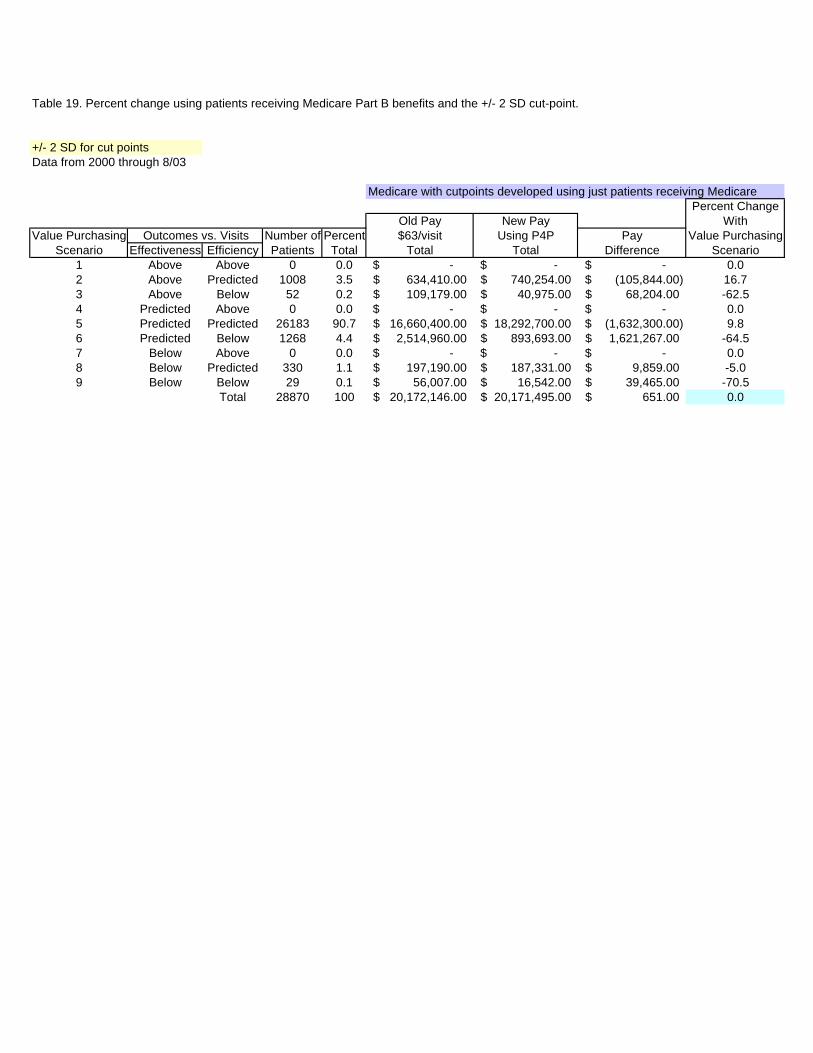
Table 19. Percent change using patients receiving Medicare Part B benefits and the +/- 2 SD cut-point.
+/- 2 SD for cut pointsData from 2000 through 8/03
Medicare with cutpoints developed using just patients receiving MedicarePercent Change
Old Pay New Pay WithValue Purchasing Outcomes vs. Visits Number of Percent $63/visit Using P4P Pay Value Purchasing
Scenario Effectiveness Efficiency Patients Total Total Total Difference Scenario1 Above Above 0 0.0 -$ -$ -$ 0.02 Above Predicted 1008 3.5 634,410.00$ 740,254.00$ (105,844.00)$ 16.73 Above Below 52 0.2 109,179.00$ 40,975.00$ 68,204.00$ -62.54 Predicted Above 0 0.0 -$ -$ -$ 0.05 Predicted Predicted 26183 90.7 16,660,400.00$ 18,292,700.00$ (1,632,300.00)$ 9.86 Predicted Below 1268 4.4 2,514,960.00$ 893,693.00$ 1,621,267.00$ -64.57 Below Above 0 0.0 -$ -$ -$ 0.08 Below Predicted 330 1.1 197,190.00$ 187,331.00$ 9,859.00$ -5.09 Below Below 29 0.1 56,007.00$ 16,542.00$ 39,465.00$ -70.5
Total 28870 100 20,172,146.00$ 20,171,495.00$ 651.00$ 0.0

Table 20. Summary of percent change if providers had been reimbursed using a pay-for-performance process: Retrospectively collected dataPatients receiving Medicare Part B benefits
% Above % Below % Above % Below% Predicted % Predicted Predicted Predicted Predicted Predicted
Cut Point % Savings Effectiveness Efficiency Effectiveness Effectiveness Efficiency Efficiency68% CI -11.6 5.5 4.9 41.9 52.6 58.4 36.890% CI -11.2 9.1 7.7 40.2 50.6 56.6 35.695% CI -10.9 10.8 9.5 39.4 50.0 55.9 34.6+1SD -1.8 75.4 78.5 13.3 11.3 8.5 13.0+2SDs 0.0 95.1 95.3 3.7 1.2 0.0 4.7
n=28,870 patients receiving outpatient rehabilitation in 2000 through August 2003Negative "Savings" implies the payer would reimburse less, and positive "Savings" implies the payer would reimburse more compared to a fee-for-service plan.

Table 21. Reasons for not volunteering the research project.
Reasons patient not entered into FOTO Operational Definition
Cannot read Patient could not read or illiterateCognitive deficit Patient could not understand questions in software or patient took >20 minutes to complete surveyTechnical difficulties Software or hardware were not workingLanguage deficit Patient cannot read English or SpanishLate for appointment Patient was late for appointment and there was not enough time to complete the surveyNot registered Patient walked in unannounced and was not registered by front deskRefused Patient refused to take surveyStaff not trained Therapist was not trained to use the FOTO softwareVisual deficit Patient could not see to use softwareOne time visit Patient was scheduled for only one visit (NOTE: Preferrably, don't enter patient)Motor deficit Patient does not have the motor skills to operate the computer successfullyOther Any other problem not listed above

Table 22. Reasons for not completing the treatment episode.
Reason patient did not complete status Operational definition
Discharged to another clinic Patient discharged to a new medical clinicDischarged to home care Patient discharged to home careFamily problem or intervention Patient lost to follow up because of a family problem or family interventionHospitalization Patient was hospitalizedIncreased pain Patient lost to follow up because of more painInsurance company discharged patient The insurance company discharged the patientLost to follow up Patient stopped coming for no reason or could not find a reasonMedical reasons Patient lost to follow up because of a medical problem, could be a new injuryPassed away Patient diedPatient refused Patient refused to take discharge status surveyPatient self-discharged Patient discharged him/herselfReferral inappropriate Referral to therapy was not appropriate in the first placeReturned to work Patient returned to workStaff did not get status Staff did not get statusTransportation problem Patient lost to follow up because they could not get to the clinic because of a transportation problemWork conflict Patient could not go to therapy because of a conflict with their work scheduleOne time visit After patient was examined the therapist thought the patient should not continue treatment)Technical difficulties Software or hardware were not workingOther Any other problem not listed above
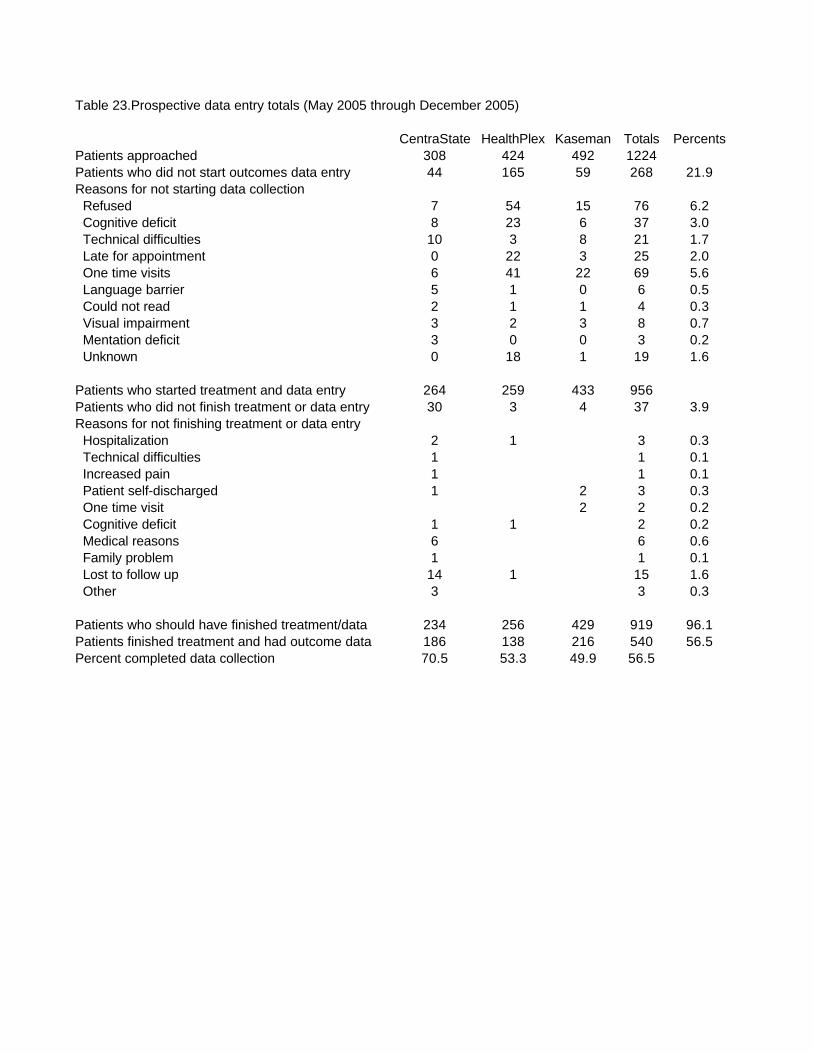
Table 23.Prospective data entry totals (May 2005 through December 2005)
CentraState HealthPlex Kaseman Totals PercentsPatients approached 308 424 492 1224Patients who did not start outcomes data entry 44 165 59 268 21.9Reasons for not starting data collection Refused 7 54 15 76 6.2 Cognitive deficit 8 23 6 37 3.0 Technical difficulties 10 3 8 21 1.7 Late for appointment 0 22 3 25 2.0 One time visits 6 41 22 69 5.6 Language barrier 5 1 0 6 0.5 Could not read 2 1 1 4 0.3 Visual impairment 3 2 3 8 0.7 Mentation deficit 3 0 0 3 0.2 Unknown 0 18 1 19 1.6
Patients who started treatment and data entry 264 259 433 956Patients who did not finish treatment or data entry 30 3 4 37 3.9Reasons for not finishing treatment or data entry Hospitalization 2 1 3 0.3 Technical difficulties 1 1 0.1 Increased pain 1 1 0.1 Patient self-discharged 1 2 3 0.3 One time visit 2 2 0.2 Cognitive deficit 1 1 2 0.2 Medical reasons 6 6 0.6 Family problem 1 1 0.1 Lost to follow up 14 1 15 1.6 Other 3 3 0.3
Patients who should have finished treatment/data 234 256 429 919 96.1Patients finished treatment and had outcome data 186 138 216 540 56.5Percent completed data collection 70.5 53.3 49.9 56.5

Table 24. Characteristics of patients with complete treatment episodes
Characteristic All Clinics (n=540) CentraState (n=186) HealthPlex (n=138) Kaseman (n=216)Age (y) 72.9+9.2, 25, 93, 74 73.9+9.8, 25, 93, 75 71.6+9.1, 29, 90, 72 73.0+8.8, 40, 91, 74 18 to 45 1.9 1.6 2.1 1.8 >45 to 65 10.7 9.1 13.9 10.2 >65 to 75 47.9 43.5 50.4 50.0 >75 39.5 45.8 33.6 38.0Male 30.6 36 26.8 28.2Visits 8.8+6.1, 2, 57, 7 10.3+7.5, 3, 57, 9 9.1+5.3, 2, 38, 8 7.3+4.7, 2, 36, 6Duration (days) 36.8+23.9, 5, 179, 30 31.9+16.2, 5, 111, 28 48.4+30.8, 7, 179, 41 32.7+22.0, 5, 135, 28Intake functional status 46.2+12.5, 3, 89, 45 44.3+12.8, 3, 89, 43 47.2+11.7, 6, 75, 48 47.3+12.4, 12, 79, 46Discharge functional status 57.6+15.9, 9, 100, 55 57.6+16.9, 10, 98, 55 59.0+14.1, 33, 99, 57 56.7+16.2, 9, 100, 55Change in functional status 11.4+13.7, -38, 72, 10 13.3+14.7, -22, 52, 13 11.7+12.8, -14, 58, 11 9.5+13.1, -38, 72, 8Symptom Acuity Acute (<22 days) 13.9 21.0 10.1 10.2 Subacute (22 to 90 days) 26.1 24.2 26.1 27.8 Chronic (>90 days) 60.0 54.8 63.8 62.0Number of Surgeries None 73.9 72.0 74.6 75.0 One or more 26.1 28.0 25.4 25.0Taking Prescription Medicine at Intake 44.0 44.1 38.2 46.7Exercise History At least three times a week 39.1 32.3 42.8 42.8 One to two times a week 22.1 17.7 26.8 22.8 Seldom or never 38.8 50.0 30.4 34.4Body Part or Impairment Treated Cervical Spine 7.8 3.2 6.5 12.5 Lumbar Spine 25.7 26.3 15.9 31.5 Shoulder/Upper Arm 17.0 14.0 17.4 19.4 Elbow 0.2 0.0 0.7 0.0 Wrist/Hand 3.1 2.7 8.7 0.0 Hip/Upper Leg 12.0 11.8 15.9 9.7 Knee 13.7 12.9 10.9 16.2 Foot/Ankle 5.4 5.4 5.1 5.6 Inflammatory diseases of the nervous system 0.2 0.5 0.0 0.0 Degenerative CNS disorders 0.7 2.2 0.0 0.0 Non-tramatic CNS dysfunction 0.2 0.5 0.0 0.0 Peripheral nervous system disorders/injuries 1.5 4.3 0.0 0.0 Vertigo 2.8 1.6 8.9 0.0 Cerebrovascular disorders 2.4 7.0 0.0 0.0 Brain Injury 0.2 0.5 0.0 0.0 Arthropathies 0.2 0.7 0.0 Diseases of the arterial system 0.2 1.1 0.0 0.0 Diseases of the veins and lymphatics 0.8 2.2 0.0 0.0 Not classified neuromuscular disorders 2.6 3.8 0.7 1.9 Not classified orthopedic disorders 3.3 0.0 8.6 3.2Reimbursement Source Medicare Part B 80.6 100.0 72.5 69.0 Medicare Advantage (Senior Care HMO) 19.4 0.0 27.5 31.0Type of Referring Physician Primary care 47.9 44.7 50.7 Orthropedic surgeon 31.4 19.1 34.0 Neurologist 2.0 6.4 0.7 Rheumatologist 3.4 10.6 1.3 Podiatrist 6.4 4.3 6.7 Insurance company 1.0 0.0 1.3 Other 7.8 14.9 5.3 Internal medicine 0.1Patients treated by specific type of clinician Physical therapist 92.6 91.4 82.6 100.0 Occupational therapist 7.4 8.6 17.4 0.0
Single values percents; multiple values are mean+standard deviation, minimum, maximum, median

Table 25. Construct validity results for functional status change (n=540)
Variable Levels a df b F c P d
Acuity* Acute Subacute Chronic15.5(1.5) 14.2(1.1) 9.2(.7) 2,1,529 11.6,40.2 <.001,<.001
Age group* 18 to 64 y 65 to 74 y >75 y10.2(1.6) 12.8(.8) 10.0(.9) 2,1,528 3.0,40.2 .031,<.001
Exercise history 3 or more 1 or 2 Seldom12.5(.9) 10.8(1.2) 10.6(.9) 2,1,528 1.2,40.6 .29,<.001
Gender Male Female12.2(1.0) 11.0(.7) 1,1,530 1.0,39.7 .32,<.001
Medication use* Yes No9.2(.9) 13.0(.8) 1,1,517 10.5,47.5 .001,<.001
Impairment* Orthopedic Neurological12.1(.6) 5.7(1.8) 1,1,524 11.7,37.1 .001,<.001
Payer* Part B Advantage10.8(.6) 13.9(1.3) 1,1,530 4.6,40.6 .03,<.001
Surgical history No Yes10.8(1.1) 13.1(1.1) 1,1,530 3.0,32.7 .08,<.001
a Adjusted least squares means (standard errors) of functional status change from one-way ANCOVAsb df=degrees of freedom, main factor, covariate (intake functional status measure), errorc F=F statistics: main factor, covariated P=probability of F statistics, main factor, covariate* Main factor significant (P<0.05)

Table 26. Percent change using patients receiving Medicare Part B, 68% CI cut-point: Prospectively Collected Data.
Medicare with cutpoints developed using patients receiving Medicare Part B benefits
68% Confidence Intervals for cut pointsData from 5/05 through 9/05 Percent Change
Old Pay New Pay WithValue Purchasing Outcomes vs. Visits Number of Percent $63/visit Using P4P Pay Value Purchasing
Scenario Effectiveness Efficiency Patients Total Total Total Difference Scenario1 Above Above 56 11.7 18,207.00$ 33,453.00$ (15,246.00)$ 83.72 Above Predicted 52 10.9 26,775.00$ 29,234.00$ (2,459.00)$ 9.23 Above Below 47 9.8 37,863.00$ 26,322.00$ 11,541.00$ -30.54 Predicted Above 39 8.2 13,419.00$ 22,994.00$ (9,575.00)$ 71.45 Predicted Predicted 72 15.1 42,210.00$ 43,644.00$ (1,434.00)$ 3.46 Predicted Below 35 7.3 30,618.00$ 19,449.00$ 11,169.00$ -36.57 Below Above 81 16.9 25,263.00$ 24,000.00$ 1,263.00$ -5.08 Below Predicted 43 9.0 24,696.00$ 23,461.00$ 1,235.00$ -5.09 Below Below 53 11.1 46,809.00$ 24,776.00$ 22,033.00$ -47.1
Total 478 100 265,860.00$ 247,333.00$ 18,527.00$ -7.0

Table 27. Percent change using patients receiving Medicare Part B, 90% CI cut-point: Prospectively Collected Data.
Medicare with cutpoints developed using patients receiving Medicare Part B benefits
90% Confidence Intervals for cut pointsData from 5/05 through 9/05 Percent Change
Old Pay New Pay WithValue Purchasing Outcomes vs. Visits Number of Percent $63/visit Using P4P Pay Value Purchasing
Scenario Effectiveness Efficiency Patients Total Total Total Difference Scenario1 Above Above 24 5.0 5,922.00$ 12,186.00$ (6,264.00)$ 105.82 Above Predicted 51 10.7 26,523.00$ 30,808.00$ (4,285.00)$ 16.23 Above Below 22 4.6 16,128.00$ 11,150.00$ 4,978.00$ -30.94 Predicted Above 51 10.7 17,766.00$ 30,926.00$ (13,160.00)$ 74.15 Predicted Predicted 162 33.9 88,074.00$ 94,252.00$ (6,178.00)$ 7.06 Predicted Below 48 10.0 50,904.00$ 28,267.00$ 22,637.00$ -44.57 Below Above 43 9.0 11,844.00$ 11,252.00$ 592.00$ -5.08 Below Predicted 49 10.3 25,452.00$ 24,179.00$ 1,273.00$ -5.09 Below Below 28 5.9 23,247.00$ 12,082.00$ 11,165.00$ -48.0
Total 478 100 265,860.00$ 255,102.00$ 10,758.00$ -4.0

Table 28. Percent change using patients receiving Medicare Part B, 95% CI cut-point: Prospectively Collected Data.
Medicare with cutpoints developed using patients receiving Medicare Part B benefits
95% Confidence Intervals for cut pointsData from 5/05 through 9/05 Percent Change
Old Pay New Pay WithValue Purchasing Outcomes vs. Visits Number of Percent $63/visit Using P4P Pay Value Purchasing
Scenario Effectiveness Efficiency Patients Total Total Total Difference Scenario1 Above Above 17 3.6 3,843.00$ 8,181.00$ (4,338.00)$ 112.92 Above Predicted 51 10.7 25,956.00$ 30,294.00$ (4,338.00)$ 16.73 Above Below 18 3.8 12,663.00$ 8,741.00$ 3,922.00$ -31.04 Predicted Above 43 9.0 15,813.00$ 25,532.00$ (9,719.00)$ 61.55 Predicted Predicted 203 42.5 110,187.00$ 117,372.00$ (7,185.00)$ 6.56 Predicted Below 41 8.6 45,675.00$ 24,271.00$ 21,404.00$ -46.97 Below Above 37 7.7 11,277.00$ 10,713.00$ 564.00$ -5.08 Below Predicted 49 10.3 24,759.00$ 23,521.00$ 1,238.00$ -5.09 Below Below 19 4.0 15,687.00$ 7,864.00$ 7,823.00$ -49.9
Total 478 100 265,860.00$ 256,489.00$ 9,371.00$ -3.5

Table 29. Percent change using patients receiving Medicare Part B, +1SD cut-point: Prospectively Collected Data.
Medicare with cutpoints developed using patients receiving Medicare Part B benefits
+1 SDs for cut pointsData from 5/05 through 9/05 Percent Change
Old Pay New Pay WithValue Purchasing Outcomes vs. Visits Number of Percent $63/visit Using P4P Pay Value Purchasing
Scenario Effectiveness Efficiency Patients Total Total Total Difference Scenario1 Above Above 7 1.5 1,449.00$ 3,746.00$ (2,297.00)$ 158.52 Above Predicted 55 12.1 27,027.00$ 30,875.00$ (3,848.00)$ 14.23 Above Below 8 1.8 6,426.00$ 4,032.00$ 2,394.00$ -37.34 Predicted Above 28 6.2 6,489.00$ 14,933.00$ (8,444.00)$ 130.15 Predicted Predicted 255 56.2 124,236.00$ 139,558.00$ (15,322.00)$ 12.36 Predicted Below 47 10.4 54,621.00$ 28,339.00$ 26,282.00$ -48.17 Below Above 9 2.0 2,268.00$ 2,155.00$ 113.00$ -5.08 Below Predicted 29 6.4 12,537.00$ 11,910.00$ 627.00$ -5.09 Below Below 16 3.5 13,671.00$ 7,529.00$ 6,142.00$ -44.9
Total 454 100 248,724.00$ 243,077.00$ 5,647.00$ -2.3

Table 30. Percent change using patients receiving Medicare Part B, +2SD cut-point: Prospectively Collected Data.
Medicare with cutpoints using patients receiving Medicare Part B benefits
+2 SDs for cut pointsData from 5/05 through 9/05 Percent Change
Old Pay New Pay WithValue Purchasing Outcomes vs. Visits Number of Percent $63/visit Using P4P Pay Value Purchasing
Scenario Effectiveness Efficiency Patients Total Total Total Difference Scenario1 Above Above 0 0.0 -$ -$ -$ 0.02 Above Predicted 8 1.8 4,347.00$ 4,209.00$ 138.00$ -3.23 Above Below 0 0.0 -$ -$ -$ 0.04 Predicted Above 1 0.2 126.00$ 469.00$ (343.00)$ 272.25 Predicted Predicted 428 94.3 223,965.00$ 233,309.00$ (9,344.00)$ 4.26 Predicted Below 13 2.9 18,459.00$ 7,418.00$ 11,041.00$ -59.87 Below Above 0 0.0 -$ -$ -$ 0.08 Below Predicted 4 0.9 1,827.00$ 1,736.00$ 91.00$ -5.09 Below Below 0 0.0 -$ -$ -$ 0.0
Total 454 100 248,724.00$ 247,141.00$ 1,583.00$ -0.6
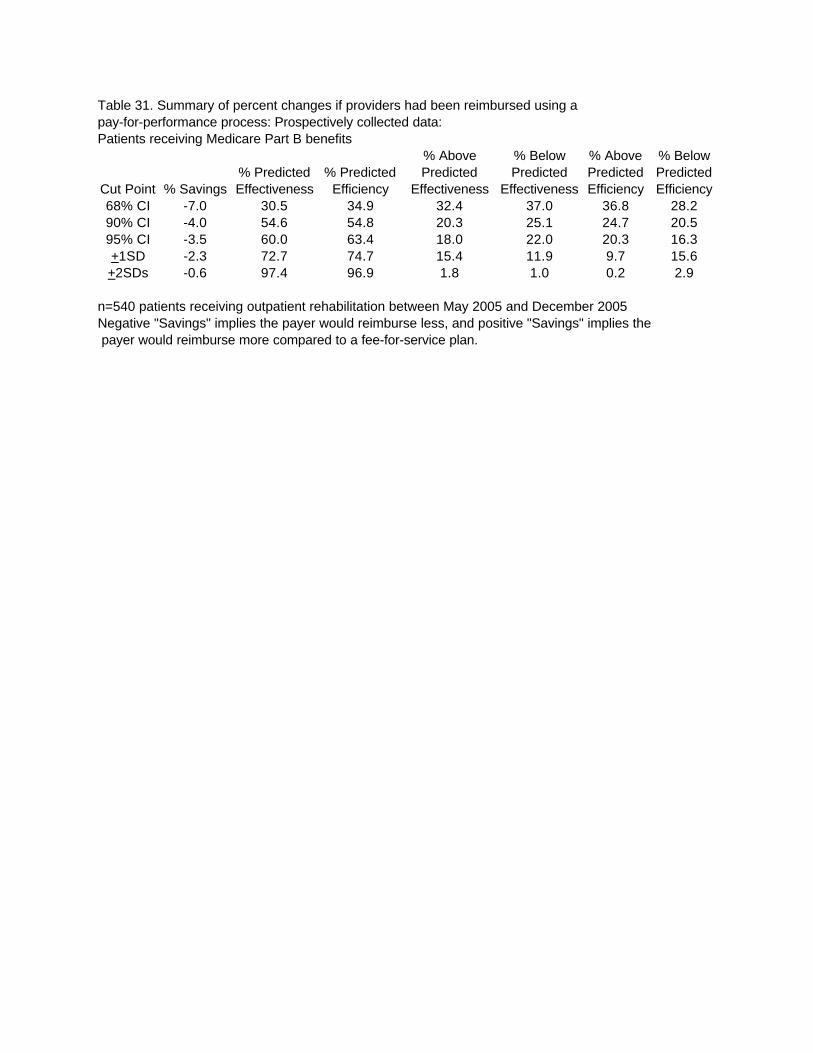
Table 31. Summary of percent changes if providers had been reimbursed using a pay-for-performance process: Prospectively collected data: Patients receiving Medicare Part B benefits
% Above % Below % Above % Below% Predicted % Predicted Predicted Predicted Predicted Predicted
Cut Point % Savings Effectiveness Efficiency Effectiveness Effectiveness Efficiency Efficiency68% CI -7.0 30.5 34.9 32.4 37.0 36.8 28.290% CI -4.0 54.6 54.8 20.3 25.1 24.7 20.595% CI -3.5 60.0 63.4 18.0 22.0 20.3 16.3+1SD -2.3 72.7 74.7 15.4 11.9 9.7 15.6+2SDs -0.6 97.4 96.9 1.8 1.0 0.2 2.9
n=540 patients receiving outpatient rehabilitation between May 2005 and December 2005Negative "Savings" implies the payer would reimburse less, and positive "Savings" implies the payer would reimburse more compared to a fee-for-service plan.

Table 32. Simulated percent change in reimbursement if clinicians did not use more than predicted number of visits and did not change effectivenessusing patients receiving Medicare Part B benefits and the 90% CI cut-point.
Data from 2000 through 8/03 Medicare with cutpoints developed using just patients receiving Medicare
First Pay-for-Performance Clinicians Become More Efficient Percent ChangeNew Pay Slimulated Pay After Clinicians
Value Purchasing Outcomes vs. Visits Number of Percent Using P4P Number of Percent Using P4P Pay ImproveScenario Effectiveness Efficiency Patients Total Total Patients Total Total Difference Efficiency
1 Above Above 6388 22.1 4,874,434.00$ 6388 22.1 4,874,434.00$ -$ 0.02 Above Predicted 874 3.0 655,754.00$ 5240 18.2 3,848,432.00$ (3,192,678.00)$ 486.93 Above Below 4366 15.1 3,192,678.00$ 0 0.0 -$ -$ 0.04 Predicted Above 1456 5.0 1,017,945.00$ 1456 5.0 1,017,945.00$ -$ 0.05 Predicted Predicted 273 0.9 197,910.00$ 1180 4.1 830,987.00$ (633,077.00)$ 319.96 Predicted Below 907 3.1 633,077.00$ 0 0.0 -$ -$ 0.07 Below Above 8509 29.5 3,511,400.00$ 8509 29.5 3,511,400.00$ -$ 0.08 Below Predicted 1084 3.8 736,754.00$ 6097 21.1 6,048,321.00$ (5,311,567.00)$ 720.99 Below Below 5013 17.4 3,101,190.00$ 0 0.0 -$ -$ 0.0
Total 28870 100 17,921,142.00$ 28870 100 20,131,519.00$ (2,210,377.00)$ 12.3